Biomarkers of Whole-Grain and Cereal-Fiber Intake in Human Studies: A Systematic Review of the Available Evidence and Perspectives

 , ,
, ,
Abstract
1. Introduction
2. Materials and Methods
2.1. Search Methods
2.2. Selection Criteria
2.3. Data Collection and Analysis
2.4. Data Analysis
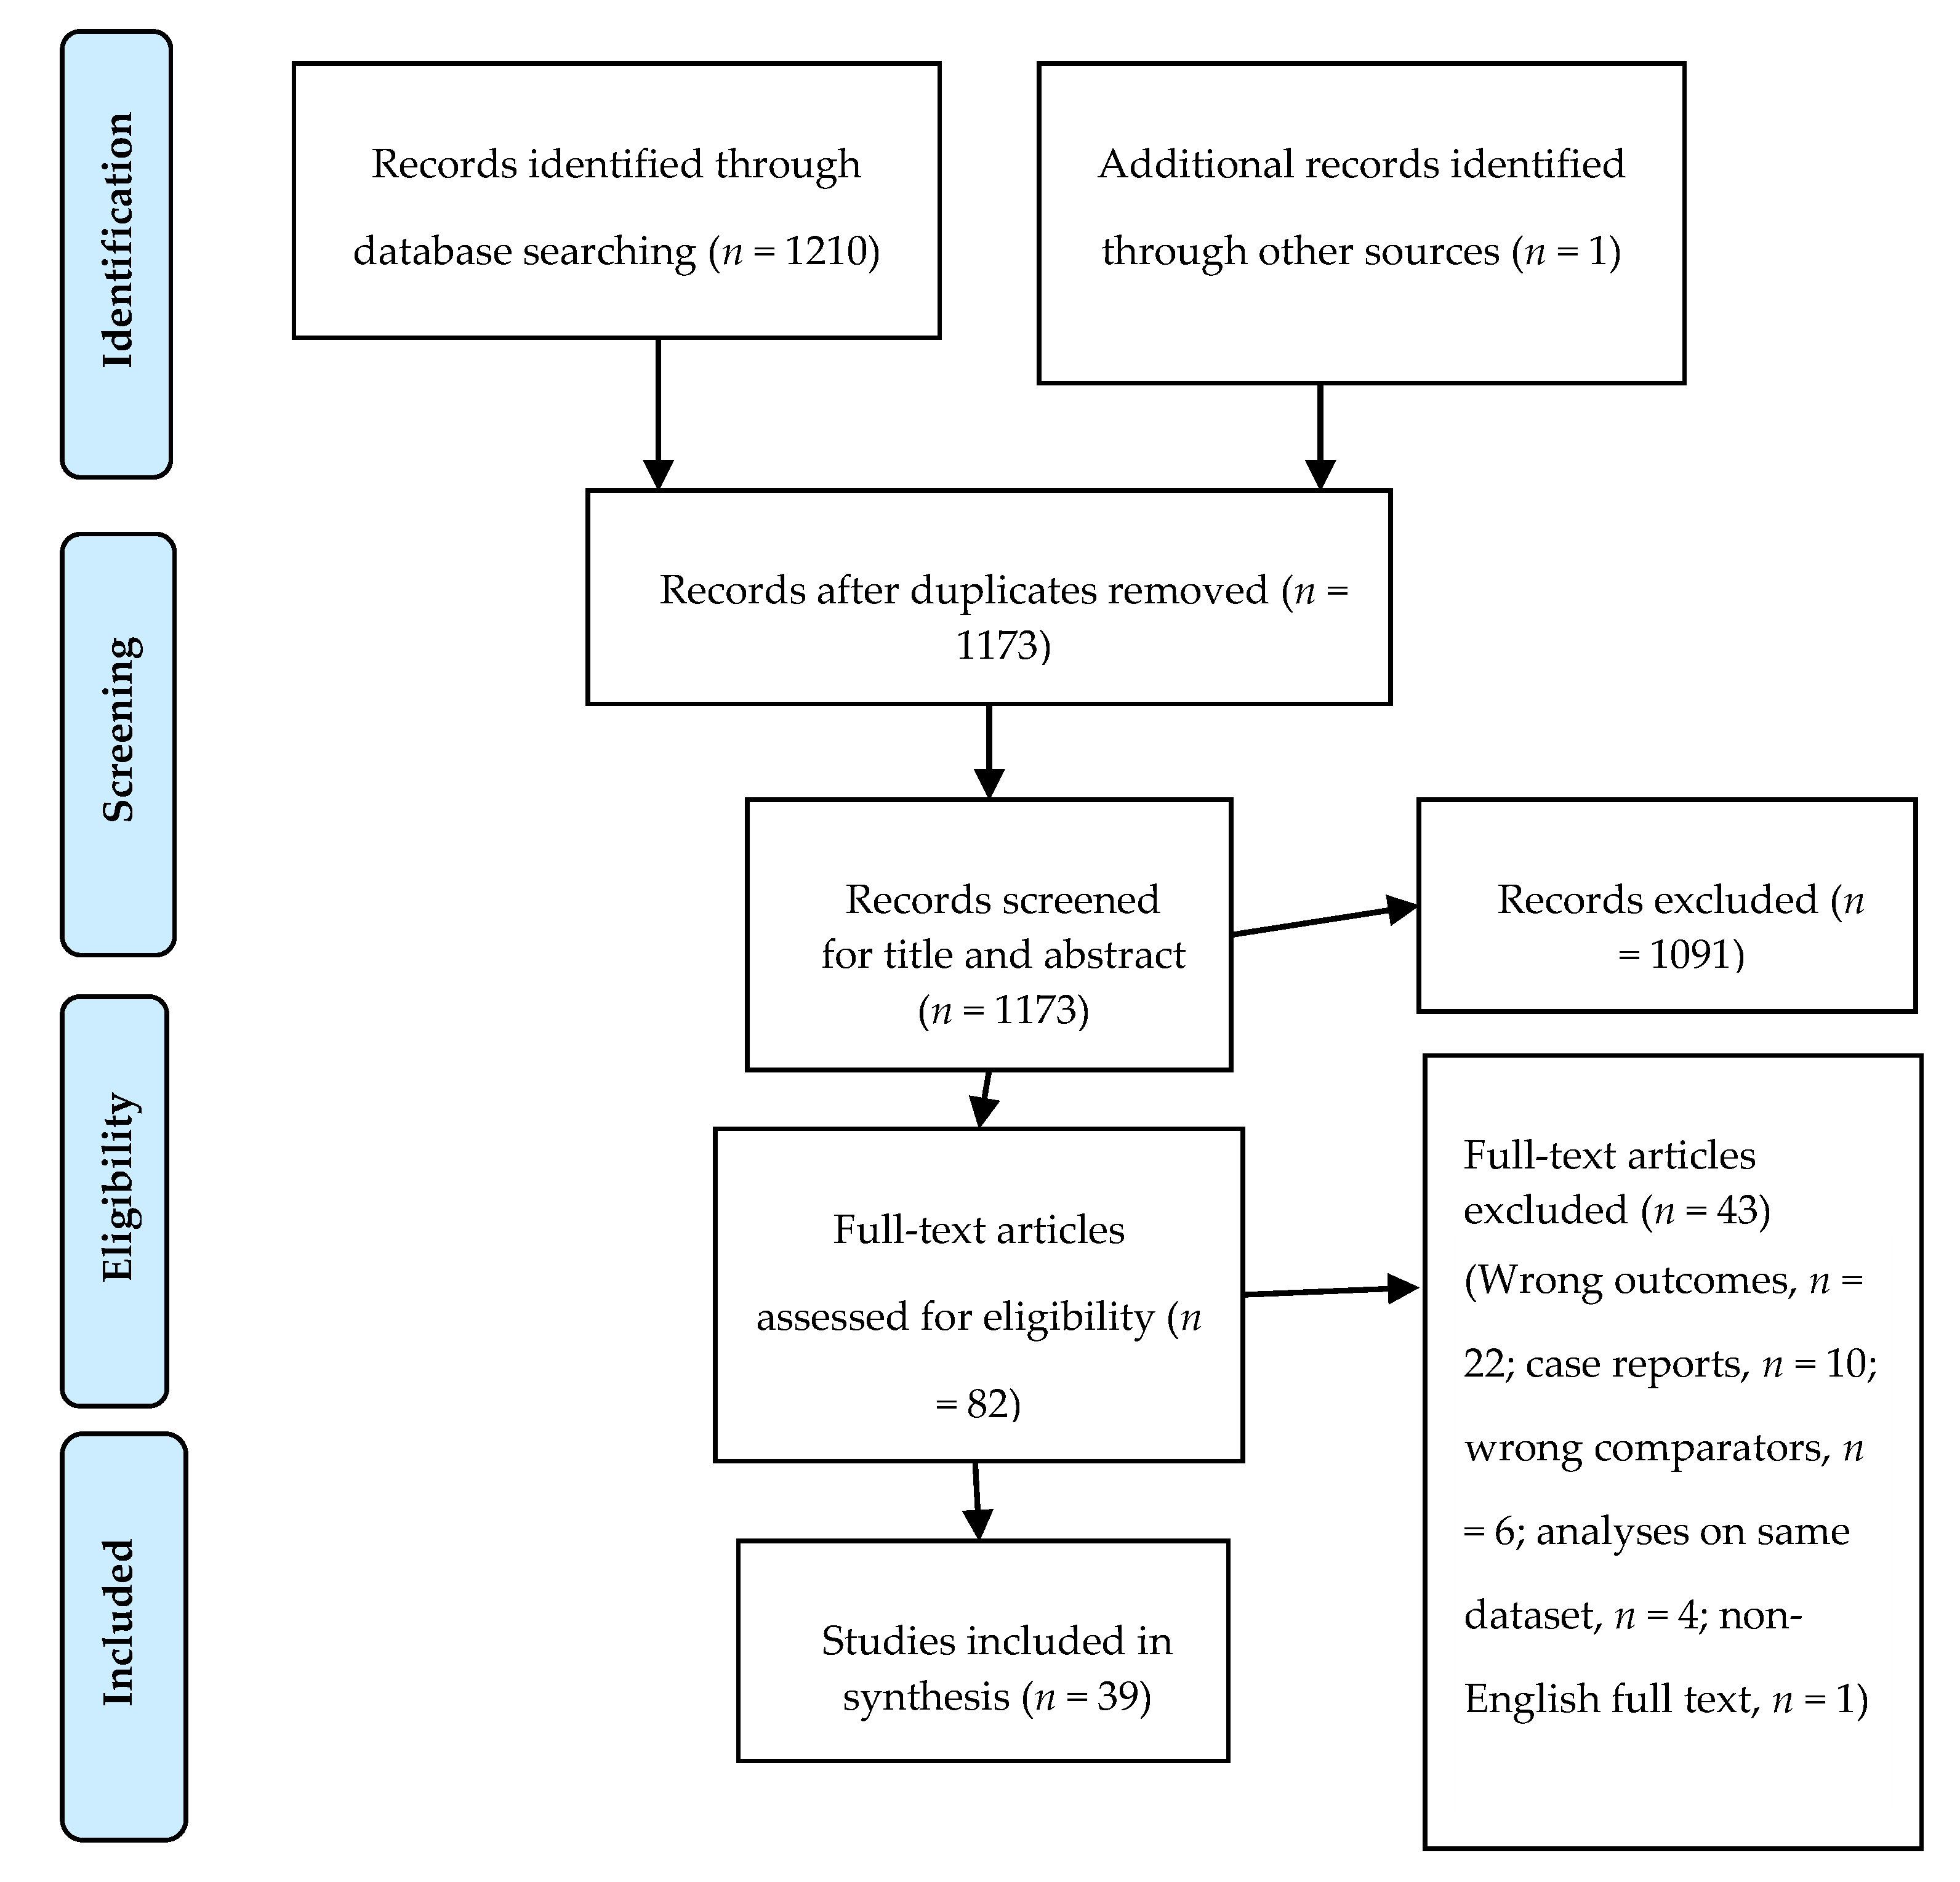
3. Results
3.1. Overview of the Studies Included
3.2. Quality Assessment and Assessment of the Risk of Bias in the Included Studies
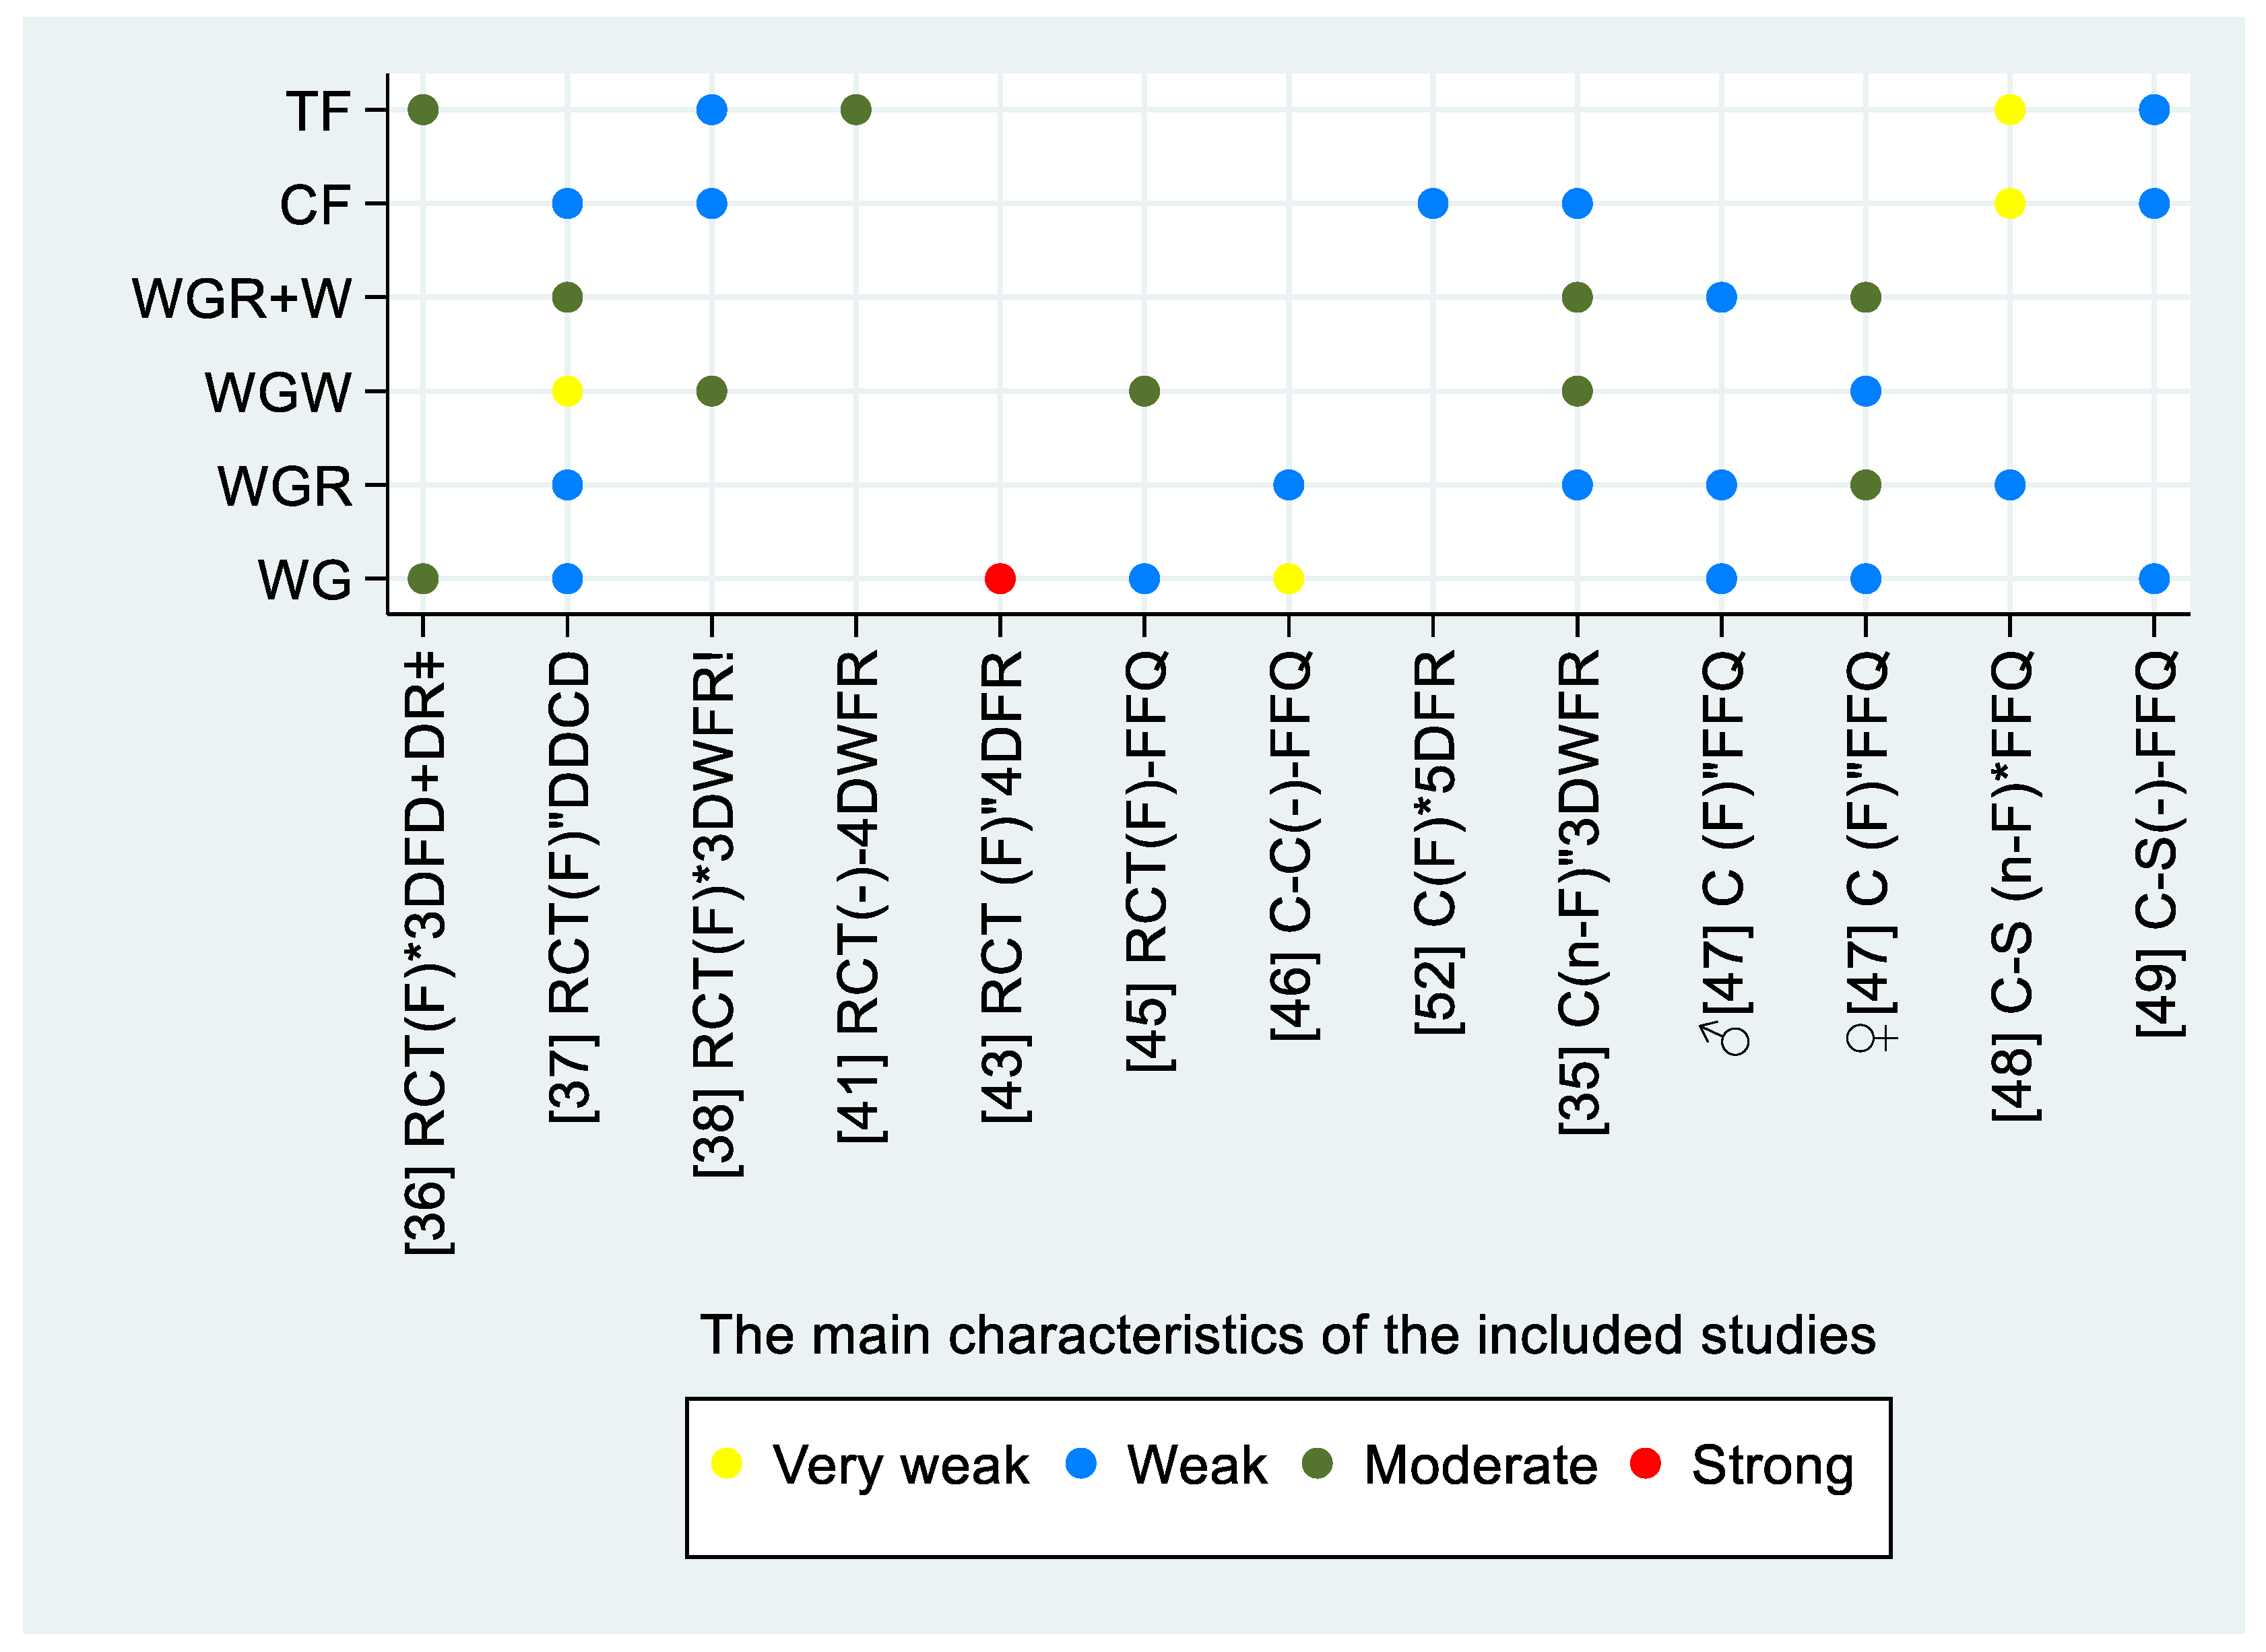
3.3. Reported Biomarkers
3.3.1. Alkylresorcinols in Plasma
3.3.2. Alkylresorcinol in Adipose Tissue Biopsies
3.3.3. Alkylresorcinol in Erythrocyte Membrane
3.3.4. Alkylresorcinol Metabolites in Plasma
3.3.5. Alkylresorcinol Metabolites in Urine
3.3.6. Avenacosides
3.3.7. Benzoxazinoid-Derived Phenylacetamide Sulfates
3.3.8. Untargeted Metabolomics Studies
4. Discussion
5. Conclusions
Supplementary Materials
Author Contributions
Funding
Acknowledgments
Conflicts of Interest
Abbreviations
| WG | whole grain |
| FFQ | food frequency questionnaire |
| CI | 95% confidence interval |
| SD | standard deviation |
| SE | standard error |
| ICC | intraclass correlation coefficient |
| AR | alkylresorcinol |
| P-AR | plasma alkylresorcinol |
| WGR | whole-grain rye |
| WGW | whole-grain wheat |
| 3DFDs | 3-day food diaries |
| DRs | daily records |
| h | hours |
| RF | refined grain |
| EM | erythrocyte membrane |
| DHBA | 3,5-dihydroxybenozoic acid |
| DHPPA | 3-(3,5-dihydroxyphenyl)-1-propanoic acid |
| DHCA | 3,5-dihydroxycinnamic acid |
| DHBA-glycine | 2-(3,5-dihydroxybenzamido)acetic acid |
| DHPPTA | 5-(3,5-dihydroxyphenyl)pentanoic acid |
| DHCA-amide | 3,5dihydroxycinnamic acid amide |
| DIBOA | 2,4-dihyxdoxy 1,4-benzoxazin-3one |
| HHPAA | hydroxy-N-(2-hydroxyphenyl) acetamide |
| HPAA | N-(2hydroxyphenyl) acetamide |
References
- Fardet, A. New hypotheses for the health-protective mechanisms of whole-grain cereals: What is beyond fibre? Nutr. Res. Rev. 2010, 23, 65–134. [Google Scholar] [CrossRef] [PubMed]
- Seal, C.J.; Brownlee, I.A. Whole-grain foods and chronic disease: Evidence from epidemiological and intervention studies. Proc. Nutr. Soc. 2015, 74, 313–319. [Google Scholar] [CrossRef] [PubMed]
- Ye, E.Q.; Chacko, S.A.; Chou, E.L.; Kugizaki, M.; Liu, S. Greater whole-grain intake is associated with lower risk of type 2 diabetes, cardiovascular disease, and weight gain. J. Nutr. 2012, 142, 1304–1313. [Google Scholar] [CrossRef] [PubMed]
- Aune, D.; Keum, N.; Giovannucci, E.; Fadnes, L.T.; Boffetta, P.; Greenwood, D.C.; Tonstad, S.; Vatten, L.J.; Riboli, E.; Norat, T. Whole grain consumption and risk of cardiovascular disease, cancer, and all cause and cause specific mortality: Systematic review and dose-response meta-analysis of prospective studies. BMJ 2016, 353, i2716. [Google Scholar] [CrossRef]
- Roager, H.M.; Vogt, J.K.; Kristensen, M.; Hansen, L.B.S.; Ibrugger, S.; Maerkedahl, R.B.; Bahl, M.I.; Lind, M.V.; Nielsen, R.L.; Frokiaer, H.; et al. Whole grain-rich diet reduces body weight and systemic low-grade inflammation without inducing major changes of the gut microbiome: A randomised cross-over trial. Gut 2019, 68, 83–93. [Google Scholar] [CrossRef]
- Mendis, M.; Leclerc, E.; Simsek, S. Arabinoxylan hydrolyzates as immunomodulators in Caco-2 and HT-29 colon cancer cell lines. Food Funct. 2017, 8, 220–231. [Google Scholar] [CrossRef]
- Andersen, V.; Holmskov, U.; Sorensen, S.B.; Jawhara, M.; Andersen, K.W.; Bygum, A.; Hvid, L.; Grauslund, J.; Wied, J.; Glerup, H.; et al. A Proposal for a Study on Treatment Selection and Lifestyle Recommendations in Chronic Inflammatory Diseases: A Danish Multidisciplinary Collaboration on Prognostic Factors and Personalised Medicine. Nutrients 2017, 9, 499. [Google Scholar] [CrossRef]
- Awika, J.M.; Rose, D.J.; Simsek, S. Complementary effects of cereal and pulse polyphenols and dietary fiber on chronic inflammation and gut health. Food Funct. 2018, 9, 1389–1409. [Google Scholar] [CrossRef]
- Derrien, M.; Veiga, P. Rethinking Diet to Aid Human-Microbe Symbiosis. Trends Microbial. 2017, 25, 100–112. [Google Scholar] [CrossRef]
- Gong, L.; Cao, W.; Chi, H.; Wang, J.; Zhang, H.; Liu, J.; Sun, B. Whole cereal grains and potential health effects: Involvement of the gut microbiota. Food Res. Int. 2018, 103, 84–102. [Google Scholar] [CrossRef]
- O’Neil, C.E.; Nicklas, T.A.; Zanovec, M.; Cho, S. Whole-grain consumption is associated with diet quality and nutrient intake in adults: The National Health and Nutrition Examination Survey, 1999–2004. J. Am. Diet. Assoc. 2010, 110, 1461–1468. [Google Scholar] [CrossRef] [PubMed]
- Hur, I.Y.; Reicks, M. Relationship between whole-grain intake, chronic disease risk indicators, and weight status among adolescents in the National Health and Nutrition Examination Survey, 1999–2004. J. Acad. Nutr. Diet. 2012, 112, 46–55. [Google Scholar] [CrossRef] [PubMed]
- The American Association of Cereal Chemists. The American Association of Cereal Chemists—AACCI Definitions of Whole Grain/Sprouted Grain/Whole Grain Product. Available online: https://www.aaccnet.org/initiatives/definitions/Pages/WholeGrain.aspx (accessed on 3 December 2019).
- Slavin, J.; Tucker, M.; Harriman, C.; Jonnalagadda, S.S. Whole Grains: Definition, Dietary Recommendations, and Health Benefits. Cereal Foods World 2013, 58, 191–198. [Google Scholar] [CrossRef]
- Ministry of Environment and Food of Denmark. The Official Dietary Guidelines. 2018. Available online: https://www.foedevarestyrelsen.dk/english/Food/Nutrition/The_dietary_recommendations/Pages/default.aspx (accessed on 10 December 2018).
- Foedevarestyrelsen. Rugbrød til aftensmad er også sund fornuft. 2017. Available online: https://www.foedevarestyrelsen.dk/Nyheder/Aktuelt/Sider/Nyheder_2017/Rugbr%C3%B8d_til_aftensmad_er_ogs%C3%A5_sund_fornuft.aspx# (accessed on 3 December 2019).
- Kaaks, R.J. Biochemical markers as additional measurements in studies of the accuracy of dietary questionnaire measurements: Conceptual issues. Am. J. Clin. Nutr. 1997, 65, 1232S–1239S. [Google Scholar] [CrossRef]
- Satija, A.; Yu, E.; Willett, W.C.; Hu, F.B. Understanding Nutritional Epidemiology and Its Role in Policy. Adv. Nutr. 2015, 6, 5–18. [Google Scholar] [CrossRef]
- Tasevska, N.; Midthune, D.; Tinker, L.F.; Potischman, N.; Lampe, J.W.; Neuhouser, M.L.; Beasley, J.M.; Van Horn, L.; Prentice, R.L.; Kipnis, V. Use of a urinary sugars biomarker to assess measurement error in self-reported sugars intake in the nutrition and physical activity assessment study (NPAAS). Cancer Epidemiol. Prev. Biomark. 2014, 23, 2874–2883. [Google Scholar] [CrossRef]
- Ross, A.B.; Pineau, N.; Kochhar, S.; Bourgeois, A.; Beaumont, M.; Decarli, B. Validation of a FFQ for estimating whole-grain cereal food intake. Br. J. Nutr. 2009, 102, 1547–1551. [Google Scholar] [CrossRef]
- Ross, A.B.; Kristensen, M.; Seal, C.J.; Jacques, P.; McKeown, N.M. Recommendations for reporting whole-grain intake in observational and intervention studies. Am. J. Clin. Nutr. 2015, 101, 903–907. [Google Scholar] [CrossRef]
- McKeown, N.M.; Jacques, P.F.; Seal, C.J.; de Vries, J.; Jonnalagadda, S.S.; Clemens, R.; Webb, D.; Murphy, L.A.; van Klinken, J.W.; Topping, D.; et al. Whole grains and health: From theory to practice—Highlights of The Grains for Health Foundation’s Whole Grains Summit 2012. J. Nutr. 2013, 143, 744S–758S. [Google Scholar] [CrossRef]
- Ross, A.B.; Kamal-Eldin, A.; Aman, P. Dietary alkylresorcinols: Absorption, bioactivities, and possible use as biomarkers of whole-grain wheat- and rye-rich foods. Nutr. Rev. 2004, 62, 81–95. [Google Scholar] [CrossRef]
- Kaaks, R.; Ferrari, P.; Ciampi, A.; Plummer, M.; Riboli, E. Uses and limitations of statistical accounting for random error correlations, in the validation of dietary questionnaire assessments. Public Health Nutr. 2002, 5, 969–976. [Google Scholar] [CrossRef] [PubMed]
- The United Nations Environment Programme; The World Health Organization. Biomarkers in Risk Assessment: Validity and Validation; The International Programme on Chemical Safety (IPCS): Geneva, Switzerland, 2001; Available online: http://www.inchem.org/documents/ehc/ehc/ehc222.htm (accessed on 3 December 2019).
- Van Loveren, C.; Aartman, I.H. The PICO (Patient-Intervention-Comparison-Outcome) question. Ned. Tijdschr. Tandheelkd. 2007, 114, 172–178. [Google Scholar] [PubMed]
- Moher, D.; Liberati, A.; Tetzlaff, J.; Altman, D.G. Preferred Reporting Items for Systematic Reviews and Meta-Analyses: The PRISMA StatementThe PRISMA Statement. Ann. Int. Med. 2009, 151, 264–269. [Google Scholar] [CrossRef] [PubMed]
- Covidence Systematic Review Software, Veritas Health Innovation, Melbourne, Australia. Available online: www.covidence.org (accessed on 3 December 2019).
- Evans, J.D. Straightforward Statistics for the Behavioral Sciences; Thomson Brooks/Cole Publishing Co: Belmont, CA, USA, 1996. [Google Scholar]
- Cohen, L. Measurement of Life Events; Cohen, L.H., Ed.; Life Events and Psychological Functioning; Sage: Newbury Park, CA, USA, 1988; pp. 11–30. [Google Scholar]
- Koo, T.K.; Li, M.Y. A Guideline of Selecting and Reporting Intraclass Correlation Coefficients for Reliability Research. J. Chiropr. Med. 2016, 15, 155–163. [Google Scholar] [CrossRef] [PubMed]
- Wierzbicka, R.; Zamaratskaia, G.; Kamal-Eldin, A.; Landberg, R. Novel urinary alkylresorcinol metabolites as biomarkers of whole grain intake in free-living Swedish adults. Mol. Nutr. Food Res. 2017, 61. [Google Scholar] [CrossRef]
- Landberg, R.; Wierzbicka, R.; Shi, L.; Nybacka, S.; Kamal-Eldin, A.; Hedblad, B.; Lindroos, A.K.; Winkvist, A.; Forslund, H.B. New alkylresorcinol metabolites in spot urine as biomarkers of whole grain wheat and rye intake in a Swedish middle-aged population. Eur. J. Clin. Nutr. 2018, 72, 1439. [Google Scholar] [CrossRef]
- Aubertin-Leheudre, M.; Koskela, A.; Marjamaa, A.; Adlercreutz, H. Plasma alkylresorcinols and urinary alkylresorcinol metabolites as biomarkers of cereal fiber intake in Finnish women. Cancer Epidemiol. Prev. Biomark. 2008, 17, 2244–2248. [Google Scholar] [CrossRef]
- Andersson, A.; Marklund, M.; Diana, M.; Landberg, R. Plasma alkylresorcinol concentrations correlate with whole grain wheat and rye intake and show moderate reproducibility over a 2- to 3-month period in free-living Swedish adults. J. Nutr. 2011, 141, 1712–1718. [Google Scholar] [CrossRef]
- Ampatzoglou, A.; Atwal, K.; Maidens, C.; Williams, C.; Ross, A.; Thielecke, F.; Jonnalagadda, S.; Kennedy, O.; Yaqoob, P. Increased whole grain consumption does not affect blood biochemistry, body composition, or gut microbiology in healthy, low-habitual whole grain consumers. J. Nutr. 2014, 145, 215–221. [Google Scholar] [CrossRef]
- Biltoft-Jensen, A.; Damsgaard, C.; Andersen, E.; Ygil, K.; Andersen, R.; Ege, M.; Christensen, T.; Thorsen, A.; Tetens, I.; Wu, H.; et al. Validation of Reported Whole-Grain Intake from a Web-Based Dietary Record against Plasma Alkylresorcinol Concentrations in 8- to 11-Year-Olds Participating in a Randomized Controlled Trial. J. Nutr. 2016, 146, 377–383. [Google Scholar] [CrossRef]
- Landberg, R.; Kamal-Eldin, A.; Andersson, A.; Vessby, B.; Aman, P. Alkylresorcinols as biomarkers of whole-grain wheat and rye intake: Plasma concentration and intake estimated from dietary records. Am. J. Clin. Nutr. 2008, 87, 832–838. [Google Scholar] [CrossRef] [PubMed]
- Landberg, R.; Aman, P.; Friberg, L.; Vessby, B.; Adlercreutz, H.; Kamal-Eldin, A. Dose response of whole-grain biomarkers: Alkylresorcinols in human plasma and their metabolites in urine in relation to intake. Am. J. Clin. Nutr. 2009, 89, 290–296. [Google Scholar] [CrossRef] [PubMed]
- Linko, A.M.; Juntunen, K.S.; Mykkanen, H.M.; Adlercreutz, H. Whole-grain rye bread consumption by women correlates with plasma alkylresorcinols and increases their concentration compared with low-fiber wheat bread. J. Nutr. 2005, 135, 580–583. [Google Scholar] [CrossRef] [PubMed]
- Magnusdottir, O.; Landberg, R.; Gunnarsdottir, I.; Cloetens, L.; Åkesson, B.; Önning, G.; Jonsdottir, S.; Rosqvist, F.; Schwab, U.; Herzig, K.; et al. Plasma alkylresorcinols reflect important whole-grain components of a healthy Nordic diet. J. Nutr. 2013, 143, 1383–1390. [Google Scholar] [CrossRef] [PubMed]
- McKeown, N.; Marklund, M.; Ma, J.; Ross, A.; Lichtenstein, A.; Livingston, K.; Jacques, P.; Rasmussen, H.; Blumberg, J.; Chen, C. Comparison of plasma alkylresorcinols (AR) and urinary AR metabolites as biomarkers of compliance in a short-term, whole-grain intervention study. Eur. J. Nutr. 2016, 55, 1235–1244. [Google Scholar] [CrossRef] [PubMed]
- Wu, H.; Kolehmainen, M.; Mykkanen, H.; Poutanen, K.; Uusitupa, M.; Schwab, U.; Wolk, A.; Landberg, R. Alkylresorcinols in adipose tissue biopsies as biomarkers of whole-grain intake: An exploratory study of responsiveness to advised intake over 12 weeks. Eur. J. Clin. Nutr. 2015, 69, 1244–1248. [Google Scholar] [CrossRef]
- Landberg, R.; Kamal-Eldin, A.; Andersson, S.O.; Johansson, J.E.; Zhang, J.X.; Hallmans, G.; Aman, P. Reproducibility of plasma alkylresorcinols during a 6-week rye intervention study in men with prostate cancer. J. Nutr. 2009, 139, 975–980. [Google Scholar] [CrossRef]
- Ross, A.B.; Bourgeois, A.; Macharia, H.N.U.; Kochhar, S.; Jebb, S.A.; Brownlee, I.A.; Seal, C.J. Plasma alkylresorcinols as a biomarker of whole-grain food consumption in a large population: Results from the WHOLEheart Intervention Study. Am. J. Clin. Nutr. 2012, 95, 204–211. [Google Scholar] [CrossRef]
- Knudsen, M.D.; Kyro, C.; Olsen, A.; Dragsted, L.O.; Skeie, G.; Lund, E.; Aman, P.; Nilsson, L.M.; Bueno-de-Mesquita, H.B.; Tjonneland, A.; et al. Self-Reported Whole-Grain Intake and Plasma Alkylresorcinol Concentrations in Combination in Relation to the Incidence of Colorectal Cancer. Am. J. Epidemiol. 2014, 179, 1188–1196. [Google Scholar] [CrossRef]
- Wu, H.; Mhd Omar, N.A.; Hakansson, N.; Wolk, A.; Michaelsson, K.; Landberg, R. Evaluation of alkylresorcinols in adipose tissue biopsies as a long-term biomarker of whole-grain wheat and rye intake in free-living Swedish men and women. Public Health Nutr. 2018, 21, 1933–1942. [Google Scholar] [CrossRef]
- Landberg, R.; Kamal-Eldin, A.; Aman, P.; Christensen, J.; Overvad, K.; Tjonneland, A.; Olsen, A. Determinants of plasma alkylresorcinol concentration in Danish post-menopausal women. Eur. J. Clin. Nutr. 2011, 65, 94–101. [Google Scholar] [CrossRef] [PubMed]
- McKeown, N.M.; Hruby, A.; Landberg, R.; Herrington, D.M.; Lichtenstein, A.H. Plasma alkylresorcinols, biomarkers of whole-grain intake, are not associated with progression of coronary artery atherosclerosis in postmenopausal women with coronary artery disease. Public Health Nutr. 2016, 19, 326–331. [Google Scholar] [CrossRef] [PubMed]
- Jansson, E.; Landberg, R.; Kamal-Eldin, A.; Wolk, A.; Vessby, B.; Aman, P. Presence of alkylresorcinols, potential whole grain biomarkers, in human adipose tissue. Br. J. Nutr. 2010, 104, 633–636. [Google Scholar] [CrossRef] [PubMed]
- Linko, A.M.; Adlercreutz, H. Whole-grain rye and wheat alkylresorcinols are incorporated into human erythrocyte membranes. Br. J. Nutr. 2005, 93, 11–13. [Google Scholar] [CrossRef] [PubMed]
- Aubertin-Leheudre, M.; Koskela, A.; Samaletdin, A.; Adlercreutz, H. Responsiveness of urinary and plasma alkylresorcinol metabolites to rye intake in finnish women. Cancers 2010, 2, 513–522. [Google Scholar] [CrossRef]
- Guyman, L.A.; Adlercreutz, H.; Koskela, A.; Li, L.; Beresford, S.A.A.; Lampe, J.W. Urinary 3-(3,5-dihydroxyphenyl)-1-propanoic acid, an alkylresorcinol metabolite, is a potential biomarker of whole-grain intake in a US population. J. Nutr. 2008, 138, 1957–1962. [Google Scholar] [CrossRef]
- Landberg, R.; Townsend, M.K.; Neelakantan, N.; Sun, Q.; Sampson, L.; Spiegelman, D.; van Dam, R.M. Alkylresorcinol metabolite concentrations in spot urine samples correlated with whole grain and cereal fiber intake but showed low to modest reproducibility over one to three years in U.S. women. J. Nutr. 2012, 142, 872–877. [Google Scholar] [CrossRef]
- Marklund, M.; Landberg, R.; Andersson, A.; Aman, P.; Kamal-Eldin, A. Alkylresorcinol metabolites in urine correlate with the intake of whole grains and cereal fibre in free-living Swedish adults. Br. J. Nutr. 2013, 109, 129–136. [Google Scholar] [CrossRef]
- Meija, L.; Krams, I.; Cauce, V.; Samaletdin, A.; Soderholm, P.; Meija, R.; Larmane, L.; Lejnieks, A.; Lietuvietis, V.; Adlercreutz, H. Alkylresorcinol Metabolites in Urine and Plasma as Potential Biomarkers of Rye and Wheat Fiber Consumption in Prostate Cancer Patients and Controls. Nutr. Cancer Int. J. 2015, 67, 258–265. [Google Scholar] [CrossRef]
- Ross, A.B.; Aman, P.; Kamal-Eldin, A. Identification of cereal alkylresorcinol metabolites in human urine - potential biomarkers of wholegrain wheat and rye intake. J. Chromatogr. B Anal. Technol. Biomed. Life Sci. 2004, 809, 125–130. [Google Scholar] [CrossRef]
- Zhu, Y.; Shurlknight, K.L.; Chen, X.; Sang, S. Identification and pharmacokinetics of novel alkylresorcinol metabolites in human urine, new candidate biomarkers for whole-grain wheat and rye intake. J. Nutr. 2014, 144, 114–122. [Google Scholar] [CrossRef] [PubMed]
- Aubertin-Leheudre, M.; Koskela, A.; Samaletdin, A.; Adlercreutz, H. Plasma alkylresorcinol metabolites as potential biomarkers of whole-grain wheat and rye cereal fibre intakes in women. Br. J. Nutr. 2010, 103, 339–343. [Google Scholar] [CrossRef] [PubMed]
- Drake, I.; Sonestedt, E.; Gullberg, B.; Bjartell, A.; Olsson, H.; Adlercreutz, H.; Tikkanen, M.J.; Wirfalt, E.; Wallstrom, P. Plasma alkylresorcinol metabolites as biomarkers for whole-grain intake and their association with prostate cancer: A Swedish nested case-control study. Cancer Epidemiol. Prev. Biomark. 2014, 23, 73–83. [Google Scholar] [CrossRef] [PubMed]
- Soderholm, P.P.; Koskela, A.H.; Lundin, J.E.; Tikkanen, M.J.; Adlercreutz, H.C. Plasma pharmacokinetics of alkylresorcinol metabolites: New candidate biomarkers for whole-grain rye and wheat intake. Am. J. Clin. Nutr. 2009, 90, 1167–1171. [Google Scholar] [CrossRef] [PubMed]
- Hanhineva, K.; Keski-Rahkonen, P.; Lappi, J.; Katina, K.; Pekkinen, J.; Savolainen, O.; Timonen, O.; Paananen, J.; Mykkanen, H.; Poutanen, K. The postprandial plasma rye fingerprint includes benzoxazinoid-derived phenylacetamide sulfates. J. Nutr. 2014, 144, 1016–1022. [Google Scholar] [CrossRef]
- Wang, P.; Yang, J.; Yerke, A.; Sang, S. Avenacosides: Metabolism, and potential use as exposure biomarkers of oat intake. Mol. Nutr. Food Res. 2017, 61, 1700196. [Google Scholar] [CrossRef]
- Bondia-Pons, I.; Barri, T.; Hanhineva, K.; Juntunen, K.; Dragsted, L.O.; Mykkanen, H.; Poutanen, K. UPLC-QTOF/MS metabolic profiling unveils urinary changes in humans after a whole grain rye versus refined wheat bread intervention. Mol. Nutr. Food Res. 2013, 57, 412–422. [Google Scholar] [CrossRef]
- Johansson-Persson, A.; Barri, T.; Ulmius, M.; Onning, G.; Dragsted, L. LC-QTOF/MS metabolomic profiles in human plasma after a 5-week high dietary fiber intake. Anal. Bioanal. Chem. 2013, 405, 4799–4809. [Google Scholar] [CrossRef]
- Hanhineva, K.; Lankinen, M.A.; Pedret, A.; Schwab, U.; Kolehmainen, M.; Paananen, J.; de Mello, V.; Sola, R.; Lehtonen, M.; Poutanen, K.; et al. Nontargeted metabolite profiling discriminates diet-specific biomarkers for consumption of whole grains, fatty fish, and bilberries in a randomized controlled trial. J. Nutr. 2015, 145, 7–17. [Google Scholar] [CrossRef]
- Zhu, Y.D.; Wang, P.; Sha, W.; Sang, S.M. Urinary Biomarkers of Whole Grain Wheat Intake Identified by Non-targeted and Targeted Metabolomics Approaches. Sci. Rep. 2016, 6, 36278. [Google Scholar] [CrossRef]
- Coulomb, M.; Gombert, A.; Moazzami, A.A. Metabolomics study of cereal grains reveals the discriminative metabolic markers associated with anatomical compartments. Ital. J. Food Sci. 2015, 27, 142–150. [Google Scholar]
- Garcia-Aloy, M.; Llorach, R.; Urpi-Sarda, M.; Tulipani, S.; Salas-Salvado, J.; Martinez-Gonzalez, M.A.; Corella, D.; Fito, M.; Estruch, R.; Serra-Majem, L.; et al. Nutrimetabolomics fingerprinting to identify biomarkers of bread exposure in a free-living population from the PREDIMED study cohort. Metabolomics 2015, 11, 155–165. [Google Scholar] [CrossRef]
- Hanhineva, K.; Brunius, C.; Andersson, A.; Marklund, M.; Juvonen, R.; Keski-Rahkonen, P.; Auriola, S.; Landberg, R. Discovery of urinary biomarkers of whole grain rye intake in free-living subjects using nontargeted LC-MS metabolite profiling. Mol. Nutr. Food Res. 2015, 59, 2315–2325. [Google Scholar] [CrossRef] [PubMed]
- Ross, A.B.; Kamal-Eldin, A.; Lundin, E.A.; Zhang, J.X.; Hallmans, G.; Aman, P. Cereal alkylresorcinols are absorbed by humans. J. Nutr. 2003, 133, 2222–2224. [Google Scholar] [CrossRef] [PubMed]
- Marklund, M.; Stromberg, E.A.; Laerke, H.N.; Bach Knudsen, K.E.; Kamal-Eldin, A.; Hooker, A.C.; Landberg, R. Simultaneous pharmacokinetic modeling of alkylresorcinols and their main metabolites indicates dual absorption mechanisms and enterohepatic elimination in humans. J. Nutr. 2014, 144, 1674–1680. [Google Scholar] [CrossRef] [PubMed]
- Ross, A.B.; Shepherd, M.J.; Knudsen, K.E.B.; Glitso, L.V.; Bowey, E.; Phillips, J.; Rowland, I.; Guo, Z.X.; Massy, D.J.R.; Aman, P.; et al. Absorption of dietary alkylresorcinols in ileal-cannulated pigs and rats. Br. J. Nutr. 2003, 90, 787–794. [Google Scholar] [CrossRef]
- Tłuścik, F. Localization of the alkylresorcinols in rye and wheat caryopses. Acta Soc. Bot. Polon. 1978, 47, 211–218. [Google Scholar] [CrossRef]
- Suresh, G.; Dan, P.; Ann-Christine, S.; Per, Å. Analysis of alkyl- and alkenylresorcinols in triticale, wheat and rye. J. Sci. Food Agric. 1988, 45, 43–52. [Google Scholar] [CrossRef]
- Wieringa, G.W. On the Occurrence of Growth Inhibiting Substances in Rye; Institute for Storage and Processing of Agricultural Produce: Wageningen, The Netherlands, 1967. [Google Scholar]
- Ross, A.B.; Shepherd, M.J.; Schupphaus, M.; Sinclair, V.; Alfaro, B.; Kamal-Eldin, A.; Aman, P. Alkylresorcinols in cereals and cereal products. J. Agric. Food Chem. 2003, 51, 4111–4118. [Google Scholar] [CrossRef]
- Landberg, R.; Kamal-Eldin, A.; Salmenkallio-Marttila, M.; Rouau, X.; Åman, P. Localization of alkylresorcinols in wheat, rye and barley kernels. J. Cereal Sci. 2008, 48, 401–406. [Google Scholar] [CrossRef]
- Sang, S.; Chu, Y. Whole grain oats, more than just a fiber: Role of unique phytochemicals. Mol. Nutr. Food Res. 2017, 61, 1600715. [Google Scholar] [CrossRef] [PubMed]
- Yang, J.; Wang, P.; Wu, W.; Zhao, Y.; Idehen, E.; Sang, S. Steroidal Saponins in Oat Bran. J. Agric. Food Chem. 2016, 64, 1549–1556. [Google Scholar] [CrossRef] [PubMed]
- Hanhineva, K.; Rogachev, I.; Aura, A.M.; Aharoni, A.; Poutanen, K.; Mykkanen, H. Qualitative characterization of benzoxazinoid derivatives in whole grain rye and wheat by LC-MS metabolite profiling. J. Agric. Food Chem. 2011, 59, 921–927. [Google Scholar] [CrossRef] [PubMed]
- Chen, Y.; Ross, A.B.; Aman, P.; Kamal-Eldin, A. Alkylresorcinols as markers of whole grain wheat and rye in cereal products. J. Agric. Food Chem. 2004, 52, 8242–8246. [Google Scholar] [CrossRef]
- Landberg, R.; Aman, P.; Hallmans, G.; Johansson, I. Long-term reproducibility of plasma alkylresorcinols as biomarkers of whole-grain wheat and rye intake within Northern Sweden Health and Disease Study Cohort. Eur. J. Clin. Nutr. 2013, 67, 259–263. [Google Scholar] [CrossRef]
- Montonen, J.; Landberg, R.; Kamal-Eldin, A.; Aman, P.; Boeing, H.; Steffen, A.; Pischon, T. Reliability of fasting plasma alkylresorcinol metabolites concentrations measured 4 months apart. Eur. J. Clin. Nutr. 2012, 66, 968–970. [Google Scholar] [CrossRef]
- Al-Delaimy, W.K.; Natarajan, L.; Sun, X.; Rock, C.L.; Pierce, J.P.; Women’s Healthy, E.; Living Study, G. Reliability of plasma carotenoid biomarkers and its relation to study power. Epidemiology 2008, 19, 338–344. [Google Scholar] [CrossRef]
- Crews, H.; Alink, G.; Andersen, R.; Braesco, V.; Holst, B.; Maiani, G.; Ovesen, L.; Scotter, M.; Solfrizzo, M.; van den Berg, R.; et al. A critical assessment of some biomarker approaches linked with dietary intake. Br. J. Nutr. 2001, 86 (Suppl. 1), S5–S35. [Google Scholar] [CrossRef]
- Weber, P. Role of biomarkers in nutritional science and industry—A comment. Br. J. Nutr. 2001, 86 (Suppl. 1), S93–S95. [Google Scholar] [CrossRef]
- Landberg, R.; Hanhineva, K.; Tuohy, K.; Garcia-Aloy, M.; Biskup, I.; Llorach, R.; Yin, X.; Brennan, L.; Kolehmainen, M. Biomarkers of cereal food intake. Genes Nutr. 2019, 14, 28. [Google Scholar] [CrossRef]
- Moher, D.; Hopewell, S.; Schulz, K.F.; Montori, V.; Gøtzsche, P.C.; Devereaux, P.J.; Elbourne, D.; Egger, M.; Altman, D.G. CONSORT 2010 Explanation and Elaboration: Updated guidelines for reporting parallel group randomised trials. BMJ 2010, 340, c869. [Google Scholar] [CrossRef] [PubMed]
- Von Elm, E.; Altman, D.G.; Egger, M.; Pocock, S.J.; Gotzsche, P.C.; Vandenbroucke, J.P. The Strengthening the Reporting of Observational Studies in Epidemiology (STROBE) Statement: Guidelines for reporting observational studies. Int. J. Surg. 2014, 12, 1495–1499. [Google Scholar] [CrossRef] [PubMed]


| Population | Men and women, with no restrictions on age, ethnicity, or comorbidities |
| Intervention | WG intake |
| Comparator | Not applicable |
| Outcome | Biomarkers for WG 2 intake |
| Study Design | Randomized controlled trials (cross-over and parallel study designs), case–control studies, cohorts, and cross-sectional studies |
| Research Question | Which biomarkers of whole-grain intake were assessed in the literature? |
| Study (Author, Year, Country) | Study Design | Population (n) 1 (% ♀) 2 Age (years) 3 Health Status | Aim (A), Intervention (I), Washout (Wo) (Background Diet) | Method of the Report of the Exposure | Biomarker Biological Sample Analytical Method | Main Results |
|---|---|---|---|---|---|---|
| Ampatzoglou, 2015 [36], UK | RCT cross-over non-blinded | (33) (64%) 48.8 ± 1.1 (40–65) Healthy | (A) To investigate the compliance to the WG diet data with plasma alkylresorcinol (P-AR) I1: WG (WG > 80 g) 6 weeks; Wo: (-) 4 weeks I2: RG (WG < 16 g) 6 weeks (Habitual diet controlled for WG, without prebiotics or probiotics) | 3-day food diaries (3DFDs) and daily records (DRs) (analyzed separately) | Alkylresorcinol (AR) Plasma (F) LC–MS | A moderate significant correlation between (1) P-AR and total WG form both from the 3DFDs (rs = 0.46, p < 0.001) and DRs (rs = 0.52, p < 0.001), total fiber and P-AR WG (rs = 0.46, p < 0.001), and (2) total fiber (rs =0.40, p < 0.001) from the 3DFDs (rs from DRs not reported). P-AR in I1 (x = 161 ± 31 nmol/L) was significantly different from I2 (x = 38 ± 5 nmol/L) and from baseline (p < 0.001). |
| Biltoft-Jensen, 2016 [37], Denmark | RCT cross-over non-blinded | (750) (49%) 0.2 ± 0.6 (8–11) Without severe disorders 4 | (A) To validate WG intake data from 2 diets reported by children, using P-AR I1: High in WG (x = 42 CI (35–49) g) 3 months I2: Low in WG (x = 35 (29, 42) g) 3 months (Lunch controlled for WG, other meals of habitual diet) | Daily dietary compliance diaries (after each meal 4–7 days/1 week) | AR Plasma (F) GC–MS | Very close WG exposure in both intervention groups. No difference in P-AR between both groups. Weak correlation between P-AR and total WG, WGR, and total cereal fibers in both groups. Very weak to weak correlation between WGW and P-AR. |
| Landberg, 2008 [38], Sweden | RCT cross-over non-blinded | (30) (73%) 59 ± 5 - - | (A) To study the correlation between P-AR and WG intake I1: WG 112 g/day (18 g fiber) 6 weeks Wo: (-) 6-weeks I2: RG 112 g/day (6 g fiber) 6 weeks (Habitual diet controlled for WG cereals) | 3-day weighted food records (pooled) and food diaries (for compliance check) | AR Plasma (F) GC | Significant difference between P-total AR x = 202 ± 107 in I1 and x = 59 ± 57 in I2 (p < 0.0001), and baseline (p < 0.0001). Generally, the correlation between P-AR and (1) AR and WGR + WGW intake was moderate, and (2) total fiber was weak. |
| Landberg, 2009 [39], Sweden | RCT cross-over non-blinded | (16) (53%) 30.6 ± 10.3 - Healthy | (A) To assess the responsiveness of P-AR and the excretion of U-DHBA and U-DHPPA in 24-h urine. I1: High WG (90 g) 1 week I2: Medium WG (45 g) 1 week I3: Low WG (22.5 g) 1 week Wo: No WG (0) 4 × 1 week (Habitual diet controlled for cereal and table spread products (provided)) | Daily dietary compliance diaries (after each meal) | AR Plasma (F) U-DHBA and U-DHPPA (24-h urine) GC | P-AR differed significantly between all doses for all homologs except for 17:0/21:0 (p < 0.05). U-DHBA, U-DHPPA, and U-DHBA+DHPPA excretion increased significantly with dose increases (p < 0.001) and differed between all three doses (p < 0.020). |
| Linko, 2005 [40], Finland | RCT cross-over non-blinded | (39) (100%) 59 ± 0.94 - Hypercholesterolemia and BMI of 20–33 kg/m2 | (A) To assess the possible utility of ARs as biomarkers for WGR and WG wheat (WGW) intake. I1: High-fiber rye bread 8 weeks Wo: Habitual eating 8 weeks I2: Low-fiber wheat bread 8 weeks (Habitual diet controlled for bread products (provided)) | 4-day food intake records during each intervention | AR Plasma (-) Enterolactone GC–MS | The correlation between P-AR and (1) intake of rye bread was weak (p < 0.05), and (2) intake of wheat bread was absent. The correlation between P-enterolactone and (1) consumption of rye bread was very weak (p < 0.05), and (2) intake of wheat bread was absent. |
| Hanhineva, 2014 [62], Finland | RCT cross-over non-blinded | (12) (-) 57 ± 9 - Almost healthy 5 | (A) Benzoxazinoid as biomarkers for WG intake I1: Rye (high WG) I2: White wheat (low WG) (Breakfast controlled for WG. Other meals: habitual diet, no alcohol) | Not used In-clinic intervention | Benzoxazinoid compounds (HPAA and HHPAA sulfate) Plasma (F) LC–QTOF-MS | HPAA and HHPAA appeared in plasma rapidly after I1 t-max HPAA = 60 min, t-max HHPAA = 120 min. HPAA and HHPAA were not detected in I2. |
| Wu, 2015 [43], Finland | RCT parallel non-blinded | (16) (-) - (47–65) Metabolic syndrome | (A) To evaluate the response of adipose tissue AR after a 12-week dietary WG intervention. I1: WG (12 weeks) I2: RG (12 weeks) (Habitual diet controlled for cereals) | 4-day food intake records | AR Plasma (F) and adipose tissue GC–MS | After 12 weeks, AR concentrations in the plasma and adipose tissue were significantly higher in I1 than I2 (p < 0.05). Strong correlation between WG intake and P-AR (r13 = 0.60–0.72, p < 0.05) and adipose tissues (r = 0.60–0.84, p < 0.05) |
| Magnusdottir, 2013 [41], European multicenter | RCT parallel non-blinded | (158) (65%) 54.5 ± 8.2 (30–65) Metabolic syndrome | (A) To assess P-AR as biomarker in Nordic diet (rich in dietary fibers) I1: High fiber (WGR + barley + oat + fruits + vegetables) (>36 g/day fibers) I2: Low fiber (RG wheat) (total fibers > 16 g/day at 18 or 24 weeks) (Controlled feeding trial) | 4-day weighted food records (consecutive days) with either weighted or estimated portion sizes | AR Plasma (-) GC–MS | Significant difference between I1 (P-AR = 106) and I2 (P-AR = 61) at week 12 (p < 0.001). The correlation between total fiber intake and P-AR was (1) very weak at week 12 in both groups independently, and moderate when pooled, and (2) weak at the endpoint in both groups independently, and moderate when pooled. |
| McKeown, 2016 [42], USA | RCT cross-over non-blinded | (19) (47%) 25.6 ± 5.8 (18–40) Healthy | (A) To compare the short-term, dose response of WGW on P-AR and U-AR-metabolites. I1: High in WG wheat (-) 6 days Wo: habitual diet (no WG) 2 weeks I2 (A) WG wheat (3 days) and (B) refined wheat (3 days) (Habitual diet controlled for WGW and RF) | 3-day diet record | AR Plasma (F) and AR metabolites Urine (24 h) (last day I/Wo) UHPLC | Adjusted x P-AR in I1 and I2 (A) was ≥3.1-fold higher (p < 0.001) than Wo. No difference between x P-AR in I1 and I2 (A) x U-DHBA, DHPPA, and DHBA + DHPPA I1 and I2 (A) were different (p < 0.001) from Wo. The excretion of metabolites after I2 (A) was 3.7-fold greater than WO. The mean percentage increase of metabolites for 3 WG servings compared with 6 WG servings was 75%. |
| Ross, 2012 [45], UK | RCT parallel non-blinded | (266) (50%) - - Overweight healthy | (A) To evaluate plasma ARs in a long-term intervention in subjects with a low habitual intake of WGW. I1: WG (60 g) 16 weeks I2: WG (60 g) 7 weeks then (120 g) 8 weeks I3: Low WG diet (<30 g) 16 weeks (Habitual diet controlled for WG) | 149-question semi-quantitative FFQ | AR Plasma (F) GC–MS | After 8 weeks, a significant difference in P-AR between I1 and I2 (p = 0.002) and the control group (p < 0.0001). After 16 weeks, no difference in P-AR between I1 and I2. A significant difference between I1 + I2 and I3 (p < 0.0001). Total P-AR was weak correlated to total WG and AR intake (p < 0.001) and moderate to WG wheat (p < 0.01) |
| Landberg, 2009 [44], Sweden | RCT cross-over non-blinded | (17) (0%) 73.5 ± 4.6 - Prostate cancer | (A) To investigate the effect of very high AR intakes on fasting plasma AR concentration and to assess the short-term (6 weeks) reproducibility under intervention conditions where the intake was kept constant. I1: Rye WG 6 weeks Wo: (-) 2 weeks I1: Refined wheat 6 weeks (Habitual diet controlled for cereal and table spread products (provided)) | 4-day weighted food records | AR Plasma (F) (8 samples/participant) GC | P-AR plasma concentration was 991 ± 794 nmol/L in I1 and 75 ± 92 nmol/L in I2. Carry-over effect in participants starting with I1 (P-AR was higher in Wo and I2) for C19:0, C21:0, C23:0, and for total AR. The AR C17:0/C21:0 ratio was higher in I1 (0.65 ± 0.24) than I2 (0.27 ± 0.22) (p < 0.0001). Good reproducibility of P-AR under intervention conditions. |
| Meija, 2015 [56], Latvia | Case–control unmatched | (31 + 91) (0%) 60.8 ± 6.6 (45–79) ± Prostate cancer (PC) | (A) To investigate the relationship between the intake of bread (particularly rye bread) and the concentration of AR metabolites in urine/plasma in PC and controls and the day and night variation of DHPPA and DHBA (Habitual diet) | 3-day food records and 1-day food record (on third day of intervention (analyzed separately) | DHBA, DHPPA Plasma (-) and Urine (12 h and 24 h) HPLC–CEAD | Moderate correlation between U- DHPPA, U-DHBA, and DHPPA plasma (both in 12-h and 24-h urine). Strong to very strong correlation between U-DHBA and U-DHPPA in both in 12-h and 24-h urine. The main exposure variables: bread and bread fiber, rye bread, and rye fiber. 3DFR data were best associated with AR metabolites. Very weak to weak associations between P- and U-metabolites and data from 3 days. Better weak to moderate associations between U-metabolites and the main exposure variables in PC group compared to the controls. Night urine and 24-h urine were best associated with these variables. In PC group, strong correlation between DHPPA plasma and bread and bread fiber, and moderate correlation between rye bread and rye bread fiber (p < 0.01) |
| Knudsen, 2014 [46], European multicenter | Case–control nested | (450 + 450) (46%) Median = 59 (50–64) ± Colorectal cancer | (A) To compare whole-grain intake measured from FFQs and P-AR concentrations. (Habitual diet) | Three different FFQs (every center used a different FFQ) | AR Plasma (pooled F and non-F) GC–MS | Weak correlation between rye, total WG, and P-total-AR (p < 0.0001) and inverse correlation with wheat. |
| Drake, 2014 [60], Sweden | Case–control nested | (1010 + 1817) (0%) 60.8 ± 6.6 (45–73) ± Prostate cancer | (A) To identify major dietary and lifestyle determinants of P-AR metabolites. (Habitual diet) | 7-day menu book of lunches and dinners + 168-item dietary questionnaire + 1-h interview (combined) | DHBA, DHPPA and DHBA + DHPPA plasma (non-F) HPLC–CEAD | Weak significant correlations between total fiber, WG, and high bread fiber with DHBA, DHPPA and DHBA + DHPPA (plasma). Very weak significant correlations between total cereal fiber, low-fiber bread with DHBA, DHPPA and DHBA + DHPPA (plasma). |
| Aubertin-Leheudre, 2008 [34], Finland | Cohort | (56) (100%) 46 ± 13 - Without major diseases 6 | (A) To examine the relationship between plasma ARs and urinary DHBA and between DHPPA and cereal-fiber intake. Visit 1 in spring Visit 2 in autumn (same year) (Habitual diet) | 5-day food records (consecutive days) | AR Plasma (F) and U-DHBA and U-DHPPA (72-h urine) (day-3, -4, -5 FFQ) GC–MS | Significantly weak r total fiber and U-DHBA (not significantly moderate r13 with DHPPA). The correlation of cereal fiber was (1) significantly weak with C17:0, C19:0, and C25:0, (2) significantly moderate with C21:0 and C23:0 and total AR, (3) weak with U-DHBA, and (4) moderate with DHPPA. A moderate significant correlation between AR homologs in plasma and U-DHBA and U-DHPPA. |
| Aubertin-Leheudre, 2010 [59], Finland | Cohort | (56) (100%) 46 ± 13 - Without major diseases 6 | (A) To evaluate plasma DHBA and DHPPA as biomarkers of whole-grain rye and wheat cereal fiber. Visit 1 in spring Visit 2 in autumn (same year) (Habitual diet) | 5-day food records (consecutive days) | P-DHBA and P-DHPPA (F) (day-3, -4, -5 FFQ) HPLC–CEAD | A moderate significant correlation between WGR and total cereal fiber and AR metabolites (DHBA and DHPPA) (plasma) No significant association was detected between plasma AR metabolites and vegetable or berry/fruit fiber intake |
| Aubertin-Leheudre, 2010 [52], Finland | Cohort | (60) (100%) - - Without major diseases 6 | (A) To examine the responsiveness of U-AR and P-AR metabolites to rye intake Two time points (V1 and V2) with 6 months later Three groups according to their rye intake: G1 = low rye intake: 23 ± 9 g/day (n = 20); G2 = medium rye intake: 44 ± 4 g/day (n = 20), G3 = high rye intake: 68 ± 18 g/day (n = 20). (Habitual diet) | 5-day food records (consecutive days) | P-DHBA, P-DHPPA (F) (day-3, -4. -5 FFQ) U-DHBA, U-DHPPA (day-3, -4, -5 FFQ) HPLC–CEAD | Difference between G1, G2, and G3 was (1) significant in rye and cereal-fiber intake (p < 0.05), and (2) non-significant in wheat and total fiber intake (divided groups based on rye intake). Pooled (n = 60) r rye intake was (1) moderate with U-DHBA and U-DHPPA (p < 0.001), and (2) weak with P-DHBA and P-DHPPA (p < 0.05). Weak r between total fiber intake and U-DHBA, U-DHPPA, P-DHBA, P-DHPPA (p < 0.05). U-DHBA, U-DHPPA, and P-DHPPA, and (not plasma DHBA) increased proportionally and significantly with the consumption of WGR (good responsiveness). |
| Linko, 2005 [51], Finland | Cohort | (4+4+1) (-) - - - | (A) To show that whole-grain rye and wheat AR are incorporated into erythrocyte membranes in vivo. I1: No WG 1 week then WG 1 week I2: WG 2 weeks I3: No WG, no gluten 2 weeks (Habitual diet controlled for WG) | 4-day diet records (each intervention) | AR Erythrocyte membranes (F) GC–MS | AR homologs are incorporated in the erythrocyte membrane (best for C19:0, C21:0, C23:0). Not detected AR in plasma or erythrocyte membrane in I3 Good symmetric progression in AR in I2 both in plasma and erythrocyte membrane. Unchanged low concentration of AR in I1 both in plasma and erythrocyte membrane. |
| Ross, 2004 [57], Sweden | Cohort | (1) (0%) 26 26 - | (A) To assess AR metabolites as biomarkers for WGR and WGW intake I1: WG-free diet 5 days I2: High WG single dose (Habitual diet controlled for WG) | Not relevant In-clinic intervention | AR metabolites 12-h urine GC–MS | DHBA and DHPPA were revealed in the urine after consumption of WGR and WGW |
| Andersson, 2011 [35], Sweden | Cohort | (72) (76%) 42 ± 17 (20–70) Without gastrointestinal diseases | (A) To evaluate (1) the medium-term reproducibility of fasting plasma AR concentrations, (2) the short-term reproducibility of non-fasting plasma AR concentrations, and (3) the relative validity of fasting plasma AR concentrations as an intake biomarker of WG. Visit 1 Visit 2 (after 2–3 months) (Habitual diet) | 3-day weighed food records | AR Plasma (F visit 1) and (non-F visit 2) GC–MS | Weak r between P-AR with WGR, total cereal (p < 0.05), and moderate with WGW (p < 0.001) and (WGR + WGW) (p < 0.0001). Strong r between C17.0 and WG rye (p < 0.05). Moderate r between WG wheat and C21:0 and C23:0. Positive moderate r between C17/C21 (p < 0.0001). Non-fasting P-total-AR was significantly higher than P-total-AR, but the C17:0/C21:0 ratio did not differ between fasting and non-fasting samples. The reproducibility over the period of 2–3 months, when combining the fasting and non-fasting samples was significantly (1) poor for P-total-AR, C25:0, and C23:0, and (2) moderate for C17:0, C19:0, C21:0, and C17:0/C21:0 ratio. |
| Landberg, 2012 [54], USA | Cohort | (104) (100%) 41.7 ± 3.5 (25–42) Free-living | Long-term reproducibility (1–3 years) and relative validity (r) of U-DHBA and U-DHPPA, and r with WG and cereal fiber Visit 1: Baseline Visit 2: 4 years follow-up Visit 3: 8 years follow-up (A) To evaluate (1) the long-term reproducibility of DHBA and DHPPA in spot urine samples throughout 1–3 years, and (2) the relative validity of the two metabolites as biomarkers of WG, bran, or dietary fiber. (Habitual diet) | 151-item semi-quantitative-FFQ | U-DHBA and U-DHPPA (spot urine) GC–MS | Different consumption of WG between occasions. Generally, weak r between U-DHBA, U-DHPPA, and (U-DHBA + U-DHPPA) and (1) WG, cereal fiber and (2) total fiber in V2 and V3. Poor reproducibility of U-DHBA and U-DHPPA (even after adjustment for consumption) |
| Marklund, 2013 [55], Sweden | Cohort | (66) (76%) 44 ± 17 - Free-living | (A) To evaluate 24-h urinary DHBA and DHPPA as biomarkers by estimating the medium-term (2–3 months) reproducibility and their relative validity compared with self-reported intake of WG, cereal fibers. Visit 1: baseline Visit 2: last day intervention (Habitual diet) | 3-day weighted food records - | U-DHBA and U-DHPPA urine (spot and 24 h) GC–MS | The correlation between U-DHBA, DHPPA, and U-(DDHBA + DHPPA) was (1) significantly moderate to strong with WG rye and cereal fibers, (2) significantly moderate with total WG, and (3) non-significantly very weak with WG wheat. (4) statistically non-significant correlation with oat, barley, or rice No difference in WG consumption between 2 occasions. (Poor reproducibility of WG intake) Reproducibility of U-DHBA and U-DHPPA was (1) poor to moderate (ICC = 0.46–0.51) in 24-h urine, and (2) poor in spot urine. |
| Soderholm, 2009 [61], Finland | Cohort | (15) (53%) 24 ± 5 (20–39) Healthy | (A) To evaluate the short-term reproducibility (hours and up to 1 day) and validity of P-DHBA and P-DHPPA. Baseline: WG-free diet 2 days I1: High WG rye single doses Blood samples collected 3, 4, 5, 6, 7, 8, 10, 12, 14, 16, and 25 h after (Standardized meals) | Not relevant In-clinic intervention | P-DHBA and P-DHPPA (F) HLPC–CEAD | Good reproducibility of DHBA and DHPPA, significantly higher at 25 h than at baseline (p < 0.0001) Baseline: P-x-DHBA = 33.2 ± 4.7 and P-x-DHPPA = 35.5 ± 5.9 nmol/L. At 25 h: P-x-DHBA = 103.7 ± 9.5 and P-x-DHPPA = 95.4 ± 10.0 nmol/L nmol/L. P-x-DHBA—tmax = 6.1 ± 0.5 h P-x-DHPPA—tmax = 6.4 ± 0.7 h for DHPPA. P-x-DHBA—t1/2 = 10.1 ± 0.8 h P-x-DHPPA—t1/2 = 16.3 ± 1.8 h (significantly higher) |
| Wang, 2017 [63], USA | Cohort | (12) (8%) 35 ± 4 - - | To explore the metabolism and the potential use of avenacosides as a biomarker for WG oat intake. (Habitual diet controlled for cereals) | Not used | Avenacoside metabolites LC–MS | Avenacoside metabolites were absent after Wo and present two hours after a single-dose intake of WG oat. Only a trace of these metabolites was present 36 h after the exposure. |
| Landberg, 2018 [33], Sweden | Cohort | (40) (50%) 58 ± 5 50–64 Free-living | (A) To identify the reproducibility and the correlation of AR metabolites with WG wheat and rye intake (Habitual diet) | 4-day food records (consecutive days) | U-DHBA, U-DHPPA, U-DHCA, U-DHPPTA, U-DHBA-glycine (spot urine day 0, 1, 3, 12, and 14) GC–MS | Poor day-to-day reproducibility. Good reproducibility when analyzing mean day 1 and day 2 vs. mean day 2 and 14 (ICC = 0.75–0.85). No correlation between P-metabolites and U-metabolites (data not reported). The correlation between WG intake and mean (1) DHBA, DHCA, DHBA-glycine was moderate (p < 0.05), (2) DHPPA was weak (p < 0.05), and (3) DHPPTA was non-significant. The concentration of AR metabolites in urine was highest for DHBA and DHPPA followed by DHCA, DHBA-glycine, and DHPPTA |
| Wierzbicka, 2017 [32], Sweden | Cohort | (69) (75%) 44 ± 17 - - | (A) To evaluate DHPPTA, DHCA, DHCA-amide, and DHBA-glycine as biomarkers of WGR and WGW intake by assessing their medium-term reproducibility and relative validity. V1: 3DWFR + 24-h urine (day 3) V2: After 2–3 months from V1 3DWFR + 24-h urine (day 3) (Habitual diet) | 3-day weighted food records | U-DHBA-glycine, U-DHPPTA, U-DHCA, U-DHCA-amide, U-DHBA, U-DHPPA 24-h urine GC–MS | No significant differences in WG intake between occasions (p > 0.05). Poor medium-term reproducibility of WG and AR intake between occasions. The highest urinary excretion reported for DHCA-amide followed DHPPA, DHBA, DHCA, DHBA-glycine, and DHPPTA. DHCA-amide is uniquely an AR derivate. Poor significant reproducibility of P-total AR and its derivates ICC range (0.30–0.39). Moderate reproducibility of U-DHBA-glycine, U-DHPPTA, and U-DHCA, ICC (0.59–0.63). For U-DHPPA and U-DHBA, reproducibility was generally poor. The correlation of WGR and WGW was (1) very weakly insignificant with DHCA-amide and DHBA-glycine, and (2) weak to moderate for other metabolites and total metabolites. Non-significant weak correlation between all metabolites and non-AR-containing cereals (oats, barley and maize) |
| Zhu, 2014 [58], USA | Cohort | (12) (50%) 1.8 ± 5.5 - Healthy | To explore the metabolism of AR Wo: 3 days At day 4: RG wheat single doses At day 5: WG wheat single doses (Habitual diet low in cereals) | Not relevant In-clinic intervention | U-DHPPTA, U-DHBA-glycine, U-DHBA, and U-DHPPA spot urine (8 time points × 2) Urine (24–32 h) HLPC | The excretion rates of these four metabolites dramatically increased after WG wheat bread consumption, suggesting that all 4 compounds are the metabolites of AR. t1/2 (15.9 h for DHBA and 14.8 h for DHPPA) and t-max (8.3 h for 3,5-DHBA and 7.4 h for 3,5-DHPPA) The relative composition of the four metabolites was as follows: U-DHPPTA (3.8%), U-DHBA glycine (6.8%), U-DHBA (24.5%), and U-DHPPA (65.0%). (DHBA, DHPPTA still the major components of AR) |
| Wu, 2018 [47], Sweden | Cohort | (258) (42%) - - Free-living | (A) To evaluate AR in adipose tissue biopsies as a biomarker of long-term WGR and WGW intake Biopsies in (2003–2009 women and 2010–ongoing for women) For men, correlation between P-AR and WG intake last two years (FFQ 2009–2010) and 14 years (FFQ 1997–2003). For women, 7 years (1997–2003) and 17 years (FFQ 1987–1997) (Habitual diet) | Self-administered semi-quantitative FFQ (at three different endpoints during 14–17 years) (analyzed separately) | AR Plasma (F) and adipose tissue GC–MS | In data from last FFQ (few years before biopsies), weakly significant rs between WGR and WGR + WGW and all AR homologs, except moderate rs for WGR and C17:0. Very weak correlation between WGW and all homologs. Generally weakly significant correlations between WG intake and P and A-AR in the long-term assessment. The correlation between plasma and adipose AR is very strong in C17:0, strong in C19:0 and C21:0, moderate in C23:0 and C25:0 (p < 0.001) |
| Landberg, 2011 [48], Denmark | Cross-sectional | (360) (100%) 56 (53–60) Free-living | (A) To estimate the variation in plasma AR concentration (Habitual diet) | 192-item FFQ | AR Plasma (non-F) GC–MS | r P-AR and all homologs are (1) weakly significant with Rye bread and (2) very weakly significant with cereal fibers and total fibers |
| Guyman, 2008 [53], USA | Cross-sectional | (99) (47%) - (20–39) Healthy and non-smoking | (A) To determine the utility of DHPPA as a biomarker for WG intake by investigating the relationship between whole-grain wheat and rye intake and DHPPA excretion from 3-day food records and 12-h urine at day 4. (Habitual diet) | 3-day food records (consecutive days) and FFQ (analyzed separately) | U-DHPPA 12-h overnight urine LC–MS | From both 3DFR and FFQ data, WGR + WGW intake and WG intake was associated with DHPPA excretion. From 3DFR data, the DHPPA excretion in WGR + WGW consumers was 44% higher than no-consumers (ratio of excretion (95% CI) 1.44 (1.04, 1.97); p = 0.029) (adjusted for BMI, energy, and fiber) From FFQ data: (1) A serving increase in WG intake increased DHPPA by 67% (2) A serving increase in whole-grain wheat 1 rye intake increased DHPPA excretion by 94% |
| McKeown, 2016 [49], USA | Cross-sectional | (190) (100%) 65 (SE = 0.5) - Coronary disease | (A) To investigate the association between plasma AR concentrations and estimates of dietary intake derived from self-reported FFQ (Habitual diet) | 226-item FFQ | AR Plasma (-) GC–MS | Weak significant r between P-total-AR and WG, total fiber, cereal fiber, and very weak with legume fiber. Non-significant weak correlations with RG, fruit, and vegetable fibers. |
| Jansson, 2010 [50], Sweden | Cross-sectional | (20) (100%) - - Free-living | (A) To investigate AR content and relative homologue composition in adipose tissue biopsies Assessment of AR as a long-term biomarker (Habitual diet) | 123-item FFQ | AR Plasma (F) and adipose tissue GC–MS | Moderate significant r between WG bread and total AR adipose tissue (r 0.48, p < 0.05) |
| Study (Author, Year, Country) | Study Design | Population (n) 1 (% ♀) 2 Age (years) 3 Health Status | Aim(A), Intervention(I), Description (Background Diet) | Method of the Report of the Exposure | Biological Sample |
|---|---|---|---|---|---|
| Bondia-Pons, 2013 [64], Finland | RCT cross-over, non-blinded | (20) (50%) ♀: 40.6 ± 7.7 ♂: 43.4 ± 9.9 4 - hypercholesterolemia | (A) To elucidate urinary biomarkers of WGR intake by a non-targeted UPLC–QTOF-MS metabolite profiling I1: Rye bread 4 weeks Wo: 4 weeks I2: Wheat bread 4 weeks (Habitual diet controlled for WG bread products) | 4-day food records | 24-h urine |
| Johansson-Persson, 2013 [65], Sweden | RCT cross-over, non-blinded | (25) (60%) - (49–66) Overweight healthy | (A) To investigate the alteration in the plasma metabolome profile in high dietary fiber diet by non-targeted LC–QTOF-MS I1: High fiber (x = 48.0 g) 5 weeks Wo: (-) 3 weeks I2: Low fiber (x = 32.2 g) 5 weeks (Habitual diet controlled for fiber) | 3-day food records (consecutive days) and daily FFQ | Plasma (F) |
| Hanhineva, 2015 [66], Finland | RCT parallel, non-blinded | (106) (-) - 40–70 impaired glucose concentration in the blood | (A) To report novel biomarkers for the consumption of WG, bilberries, and fish by a non-targeted LC–MS I1: Healthy diet containing WG, fatty fish, and bilberries (n = 37) I2: WG-enriched diets, habitual eating of fish and berries (n = 34) I3: Control diet with refined wheat bread, no fish and berries (n = 35) (Controlled feeding trail) | 4-day dietary records | Plasma (F) |
| Zhu, 2016 [67], USA | Cohort | (12) (50%) 1.8 ± 5.5 - Healthy | (A) To analyze metabolites from WGW bread and RF wheat bread intake using (1) non-targeted UPLC–MS/MS (2) targeted HPLC–MS/MS metabolomics Wo: 3 days At day 4: RF wheat single dose At day 5: WGW single dose (Habitual diet low in cereals) | Not used In-clinic intervention | 24-h urine at six time points on day 4 and 5 |
| Coulomb, 2015 [68], Sweden | Cohort | (1) (0%) 35 Healthy | (A) To search for the discriminative metabolites in the endosperm and bran of WGR and WGW by non-targeted NMR-based metabolomics Refined wheat bread six days On day seven WGR bread (Habitual diet controlled for WG) | Not used | 24-h urine at day 6 and 7 |
| Garcia-Aloy, 2014 [69], Spain | Cross-sectional | (155) (-) - 55–80 Type-2 diabetes/cardiovascular risk factors | (A) To elucidate biomarkers of bread exposure by non-targeted HPLC–QTOF-MS. Non-consumers of bread (n = 56) White-bread consumers (n = 48) WG-bread consumers (n = 51) (Habitual diet) | 137-item FFQ | Spot urine |
| Hanhineva, 2015 [70], Sweden | Cross-sectional | (66) (75%) 44 ± 17 - Free-living | (A) (1) To discover putative biomarkers for WGR intake by non-targeted LC–MS (2) To identify the reproducibility of identified markers in samples taken 1–3 months apart (Habitual diet) | 3-day weighted food records | 24-h urine |
| Reported Metabolites | Bondia-Pons 2013 [64] | Johansson-Persson 2013 [65] | Hanhineva 2015 [66] | Zhu 2016 [67] | Coulomb 2015 [68] | Garcia-Aloy 2014 [69] | Hanhineva 2015 [70] |
|---|---|---|---|---|---|---|---|
| Biological Sample | |||||||
| Urine | Plasma | Plasma | Urine | Urine | Urine | Urine | |
| 2,6-DHBA | X2 | ||||||
| 2,8-Dihydroxyquinoline glucuronide | X8 | ||||||
| 2-Aminophenol sulfate | X1 | X2 | X4 | X7 | |||
| 3,5-DHPPA glucuronide | X1 | X8 | |||||
| 3,5- DHPPA sulfate | X1 | X4 | S9 (r = 0.61; p < 0.001) | ||||
| 3,5- DHPPTA sulfate | X4 | ||||||
| 3,5-DHBA | X4,5 | ||||||
| 3,5-DHBA glycine | X4 | ||||||
| 3,5-DHBA sulfate | X4 | ||||||
| 3,5-DHPHTA sulfate | X4 | ||||||
| 3,5-DHPPA derivative (fragmented ion) | S9 (r = 0.64; p < 0.001) | ||||||
| 3,5-DHPPTA | X4 | ||||||
| 3,5-Dihydroxyhydrocinamic acid sulfate | X1 | ||||||
| 3,5-Dihydroxyphenyl ethanol sulfate | X1 | ||||||
| 3-Indolecarboxylic acid glucuronide | X8 | ||||||
| 3-Methylcatechol sulfate | X5 | ||||||
| Alkenylresorcinol 21:1-Gln | S3 (rs = 0.63; p < 0.05) | ||||||
| Alkylresorcinol 19:0 Gln | M3 (rs = 0.47; p < 0.05) | ||||||
| Azelaic acid (nonanedioic acid) | X1 | X6 | |||||
| Caffeic acid sulfate | X4 | M9 (r = 0.58; p < 0.001) | |||||
| DIBOA sulfate | X1 | ||||||
| Dihydroferulic acid sulfate | X8 | ||||||
| Enterolactone glucuronide | X1 | X8 | |||||
| Ferulic acid-4-O-sulfate | X1 | X4,5 | |||||
| Feruloyglycine | X4 | ||||||
| Feruloyglycine sulfate | X4 | ||||||
| HBOA glycoside | X8 | ||||||
| HHPAA | X8 | M9 (r = 0.54; p < 0.001) | |||||
| HHPAA sulfate | X4 | S9 (r = 0.62; p < 0.001) | |||||
| HHPPA sulfate | X4 | ||||||
| HMBOA | X7 | ||||||
| HMBOA glucuronide | X7 | ||||||
| HPAA glucuronide | X7 | ||||||
| HPAA sulfate | X4,5 | M9 (r = 0.54; p < 0.001) | |||||
| HPPA | X4 | X7 | |||||
| Hydroxybenzoic acid glucuronide | X7 | ||||||
| Indolylacryloylglycine | X1 | ||||||
| Pimelic acid | M9 (r = 0.58; p < 0.001) | ||||||
| Pyrraline | X8 | ||||||
| Riboflavin | X8 | ||||||
© 2019 by the authors. Licensee MDPI, Basel, Switzerland. This article is an open access article distributed under the terms and conditions of the Creative Commons Attribution (CC BY) license (http://creativecommons.org/licenses/by/4.0/).
Share and Cite
Jawhara, M.; Sørensen, S.B.; Heitmann, B.L.; Andersen, V. Biomarkers of Whole-Grain and Cereal-Fiber Intake in Human Studies: A Systematic Review of the Available Evidence and Perspectives. Nutrients 2019, 11, 2994. https://doi.org/10.3390/nu11122994
Jawhara M, Sørensen SB, Heitmann BL, Andersen V. Biomarkers of Whole-Grain and Cereal-Fiber Intake in Human Studies: A Systematic Review of the Available Evidence and Perspectives. Nutrients. 2019; 11(12):2994. https://doi.org/10.3390/nu11122994
Chicago/Turabian StyleJawhara, Mohamad, Signe Bek Sørensen, Berit Lilienthal Heitmann, and Vibeke Andersen. 2019. "Biomarkers of Whole-Grain and Cereal-Fiber Intake in Human Studies: A Systematic Review of the Available Evidence and Perspectives" Nutrients 11, no. 12: 2994. https://doi.org/10.3390/nu11122994
APA StyleJawhara, M., Sørensen, S. B., Heitmann, B. L., & Andersen, V. (2019). Biomarkers of Whole-Grain and Cereal-Fiber Intake in Human Studies: A Systematic Review of the Available Evidence and Perspectives. Nutrients, 11(12), 2994. https://doi.org/10.3390/nu11122994