Dietary Curcumin Supplementation Increases Antioxidant Capacity, Upregulates Nrf2 and Hmox1 Levels in the Liver of Piglet Model with Intrauterine Growth Retardation

 , ,
, , 
 ,
, 
Abstract
1. Introduction
2. Materials and Methods
2.1. Curcumin Preparation
2.2. Animal Experiment Design
2.3. Sample Collection
2.4. Analysis of Serum Parameters
2.5. Analysis of Liver Antioxidant Status
2.6. Gene Expression
2.7. Western Blotting
2.8. Statistical Analysis
3. Results
3.1. Growth Performance
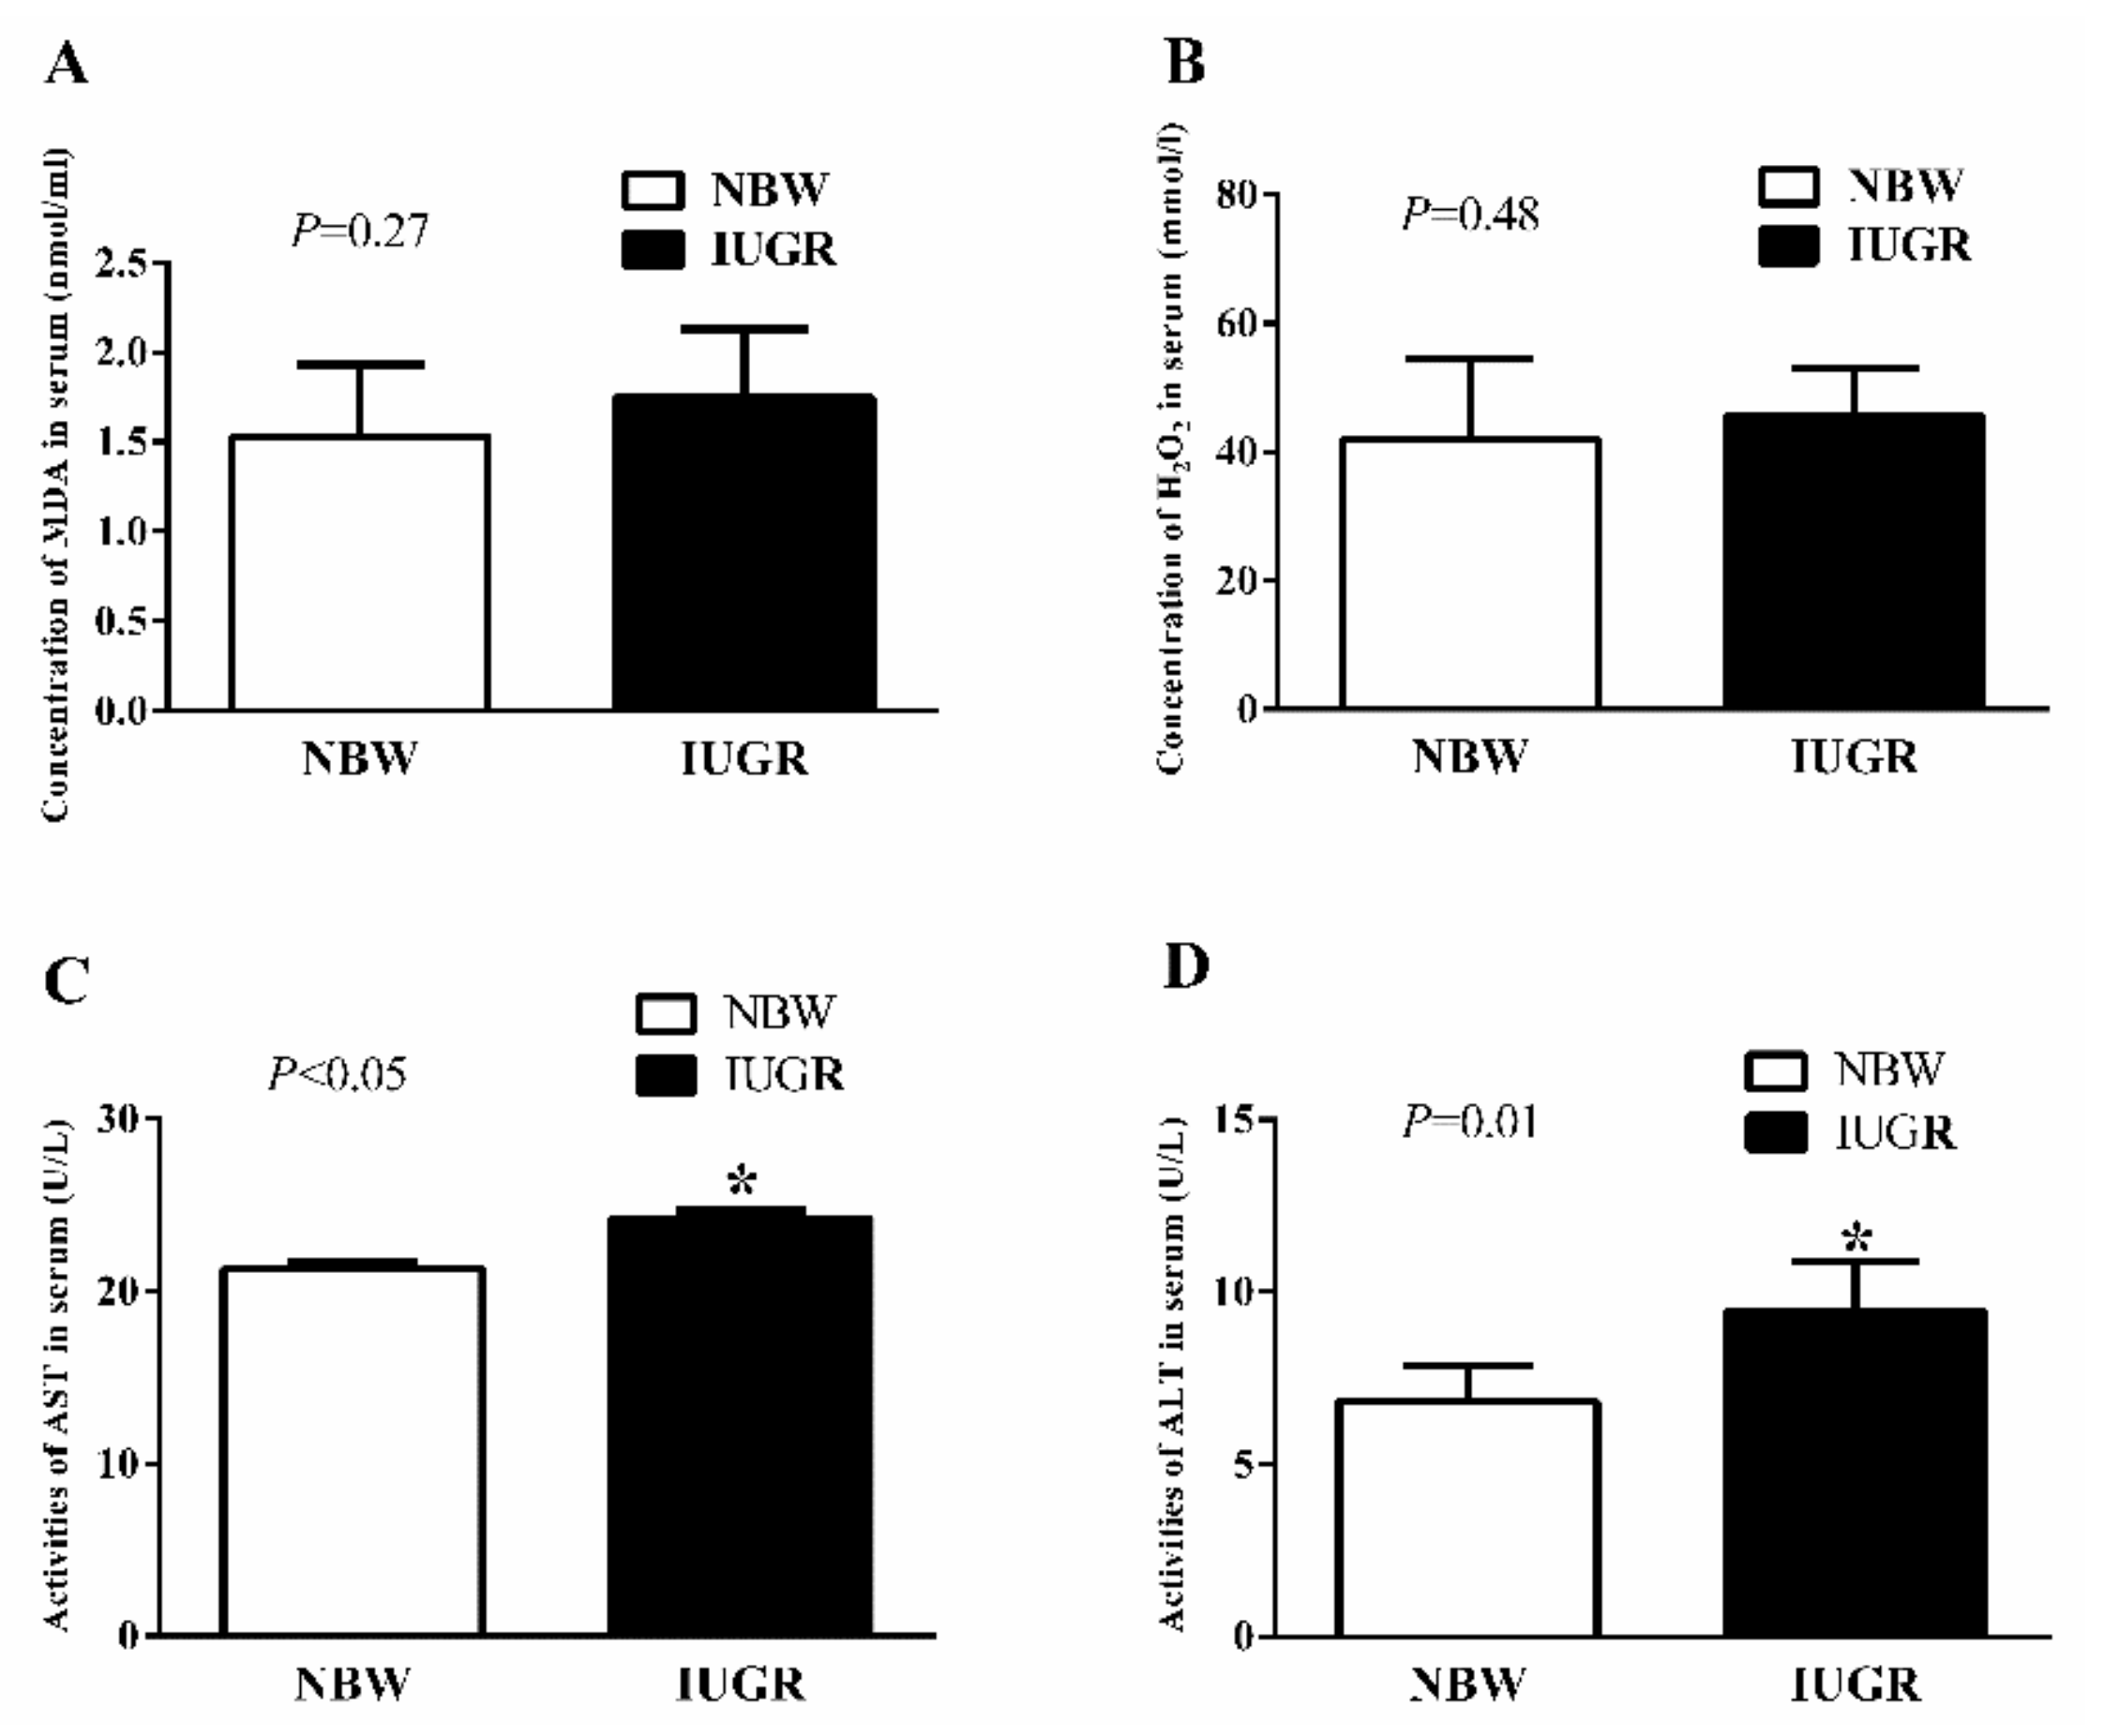
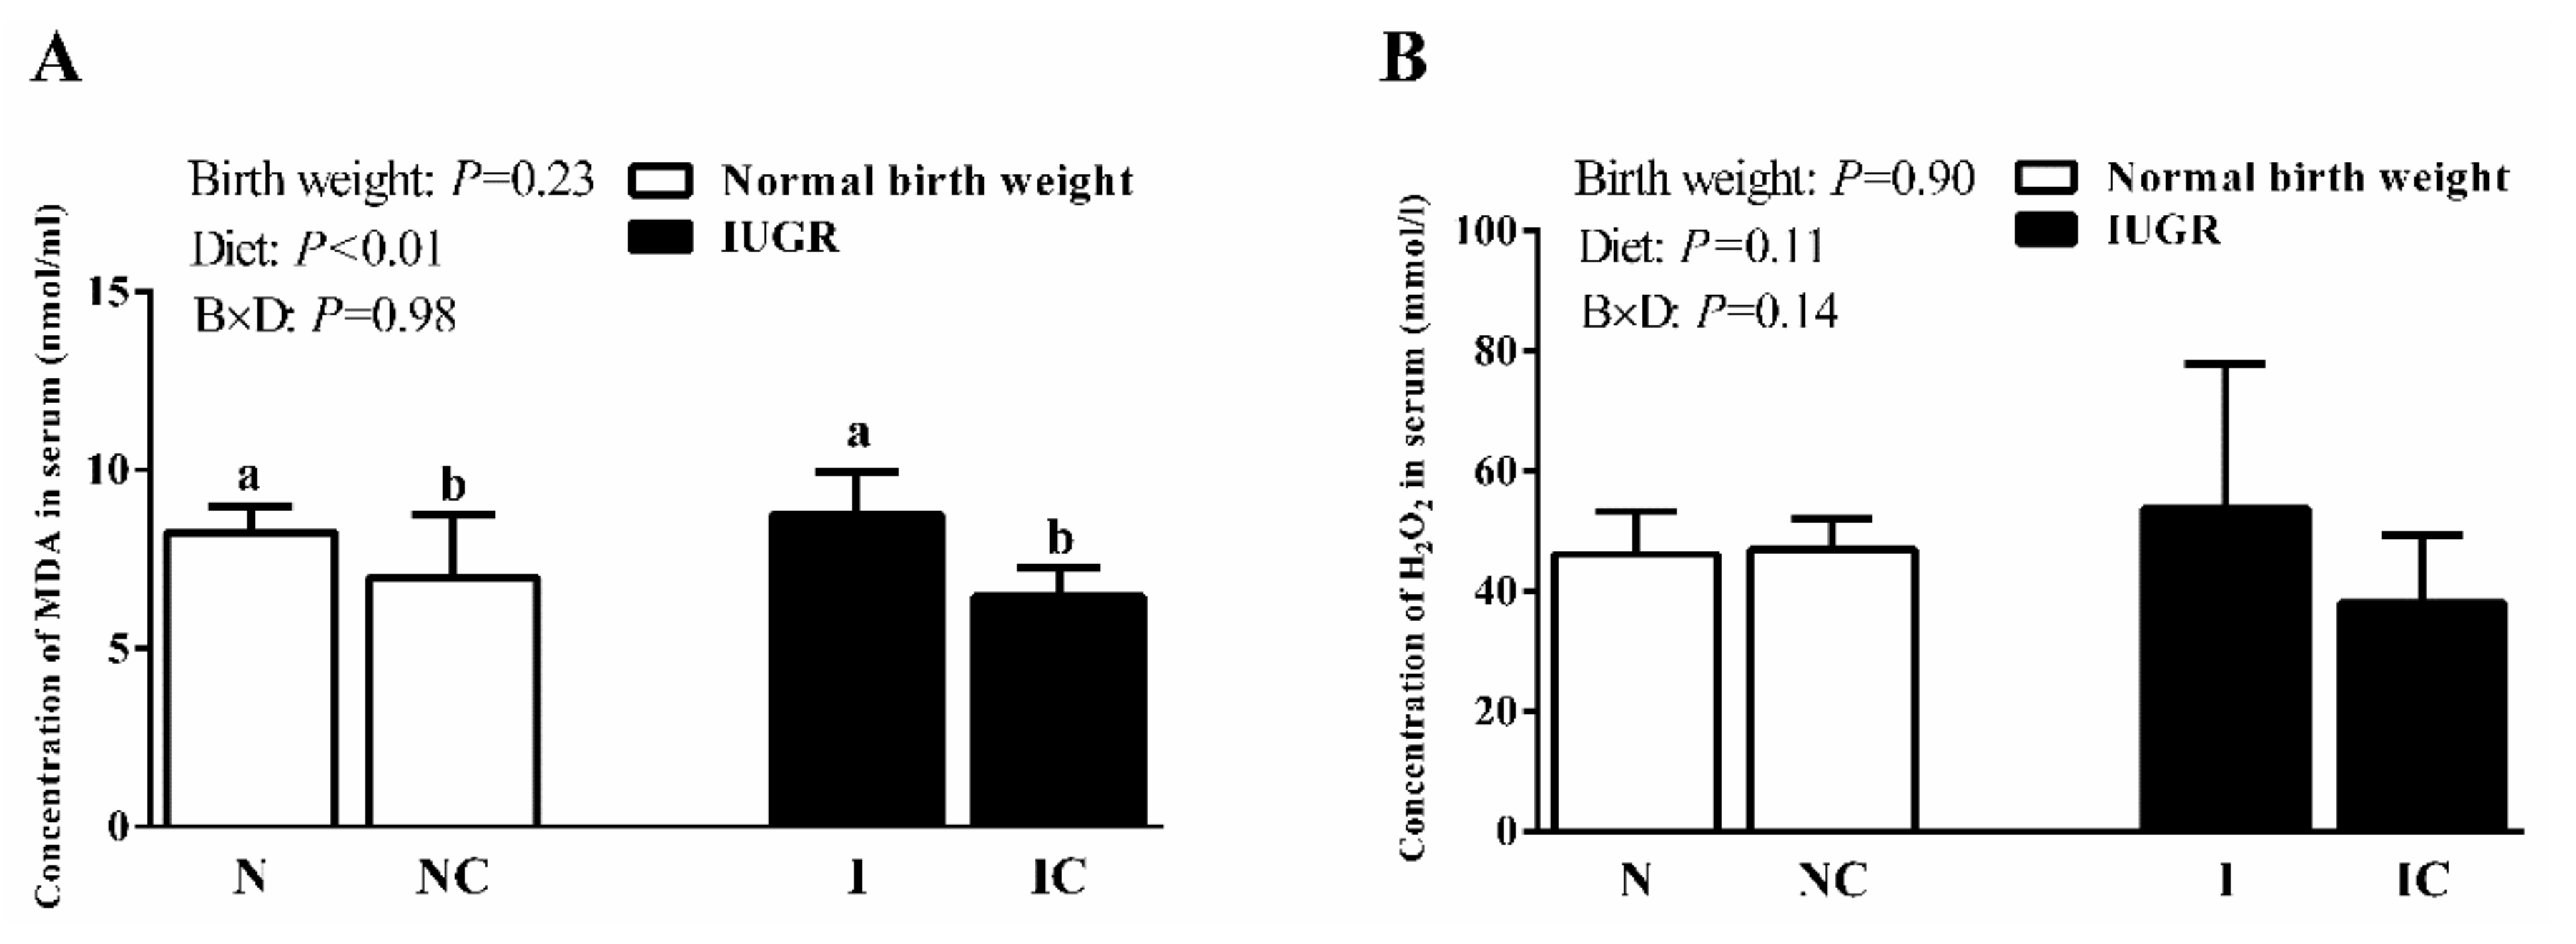
3.2. Serum Antioxidant Capacity of Newborn and Weaned Piglets
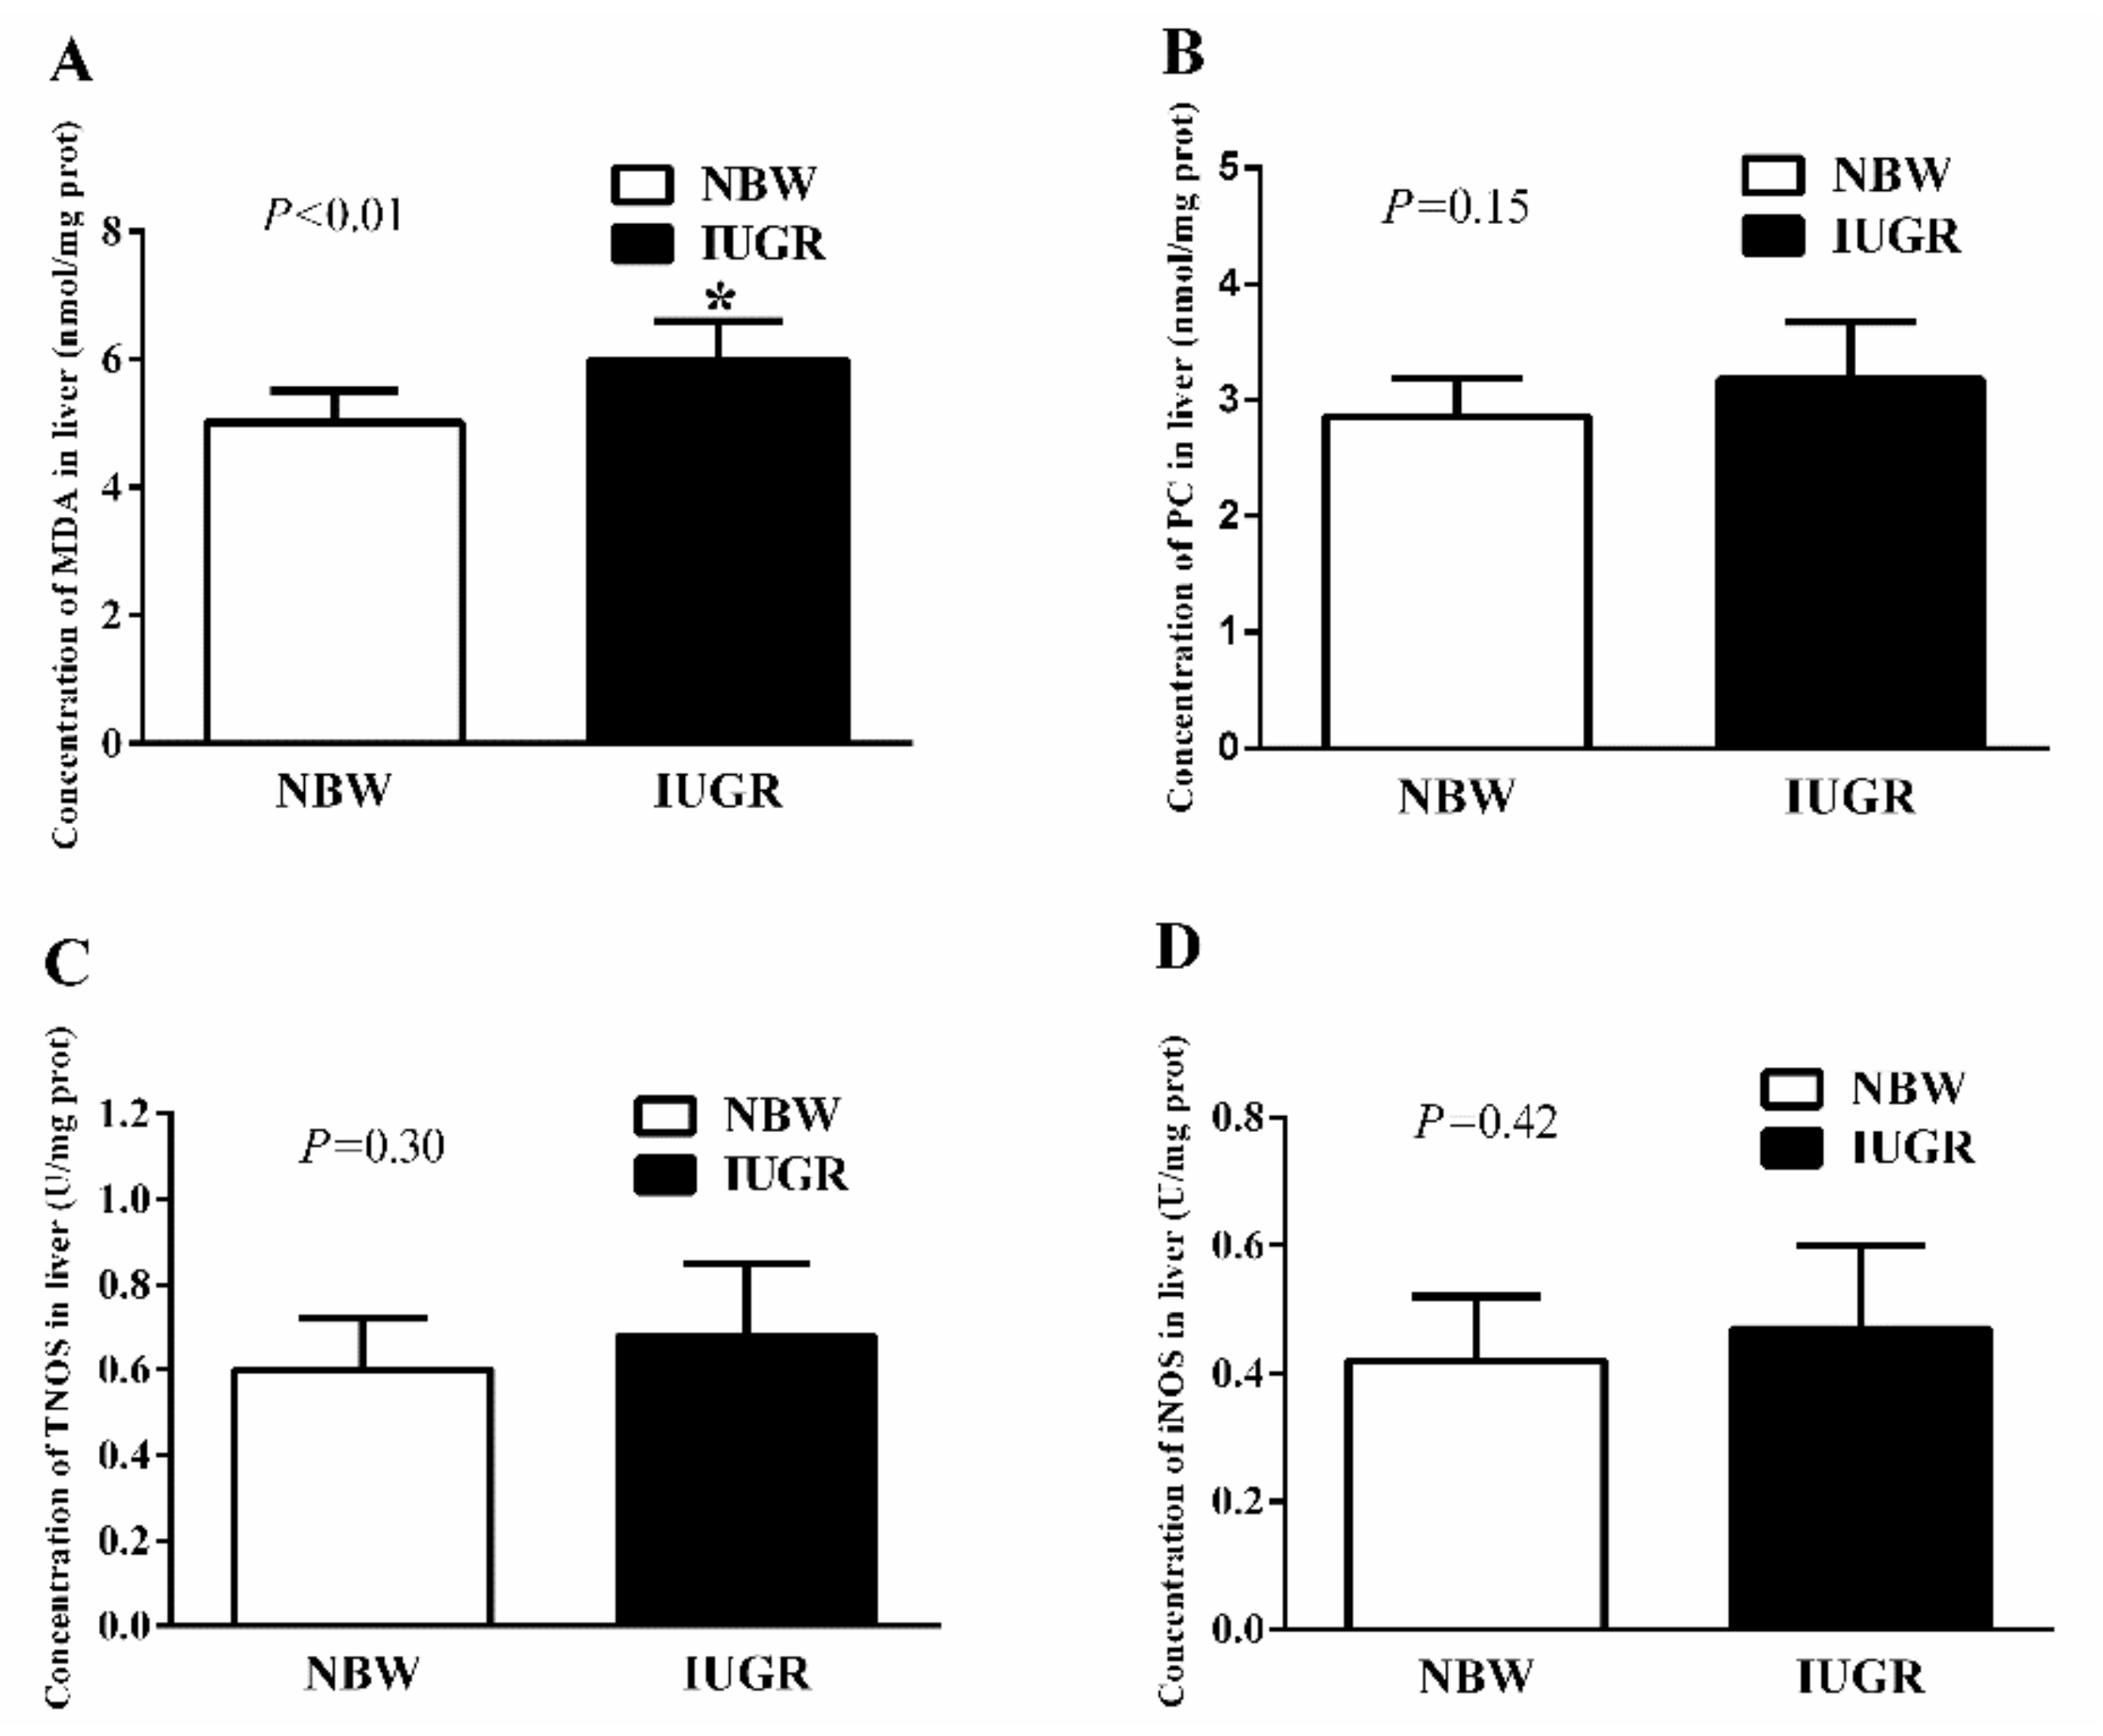
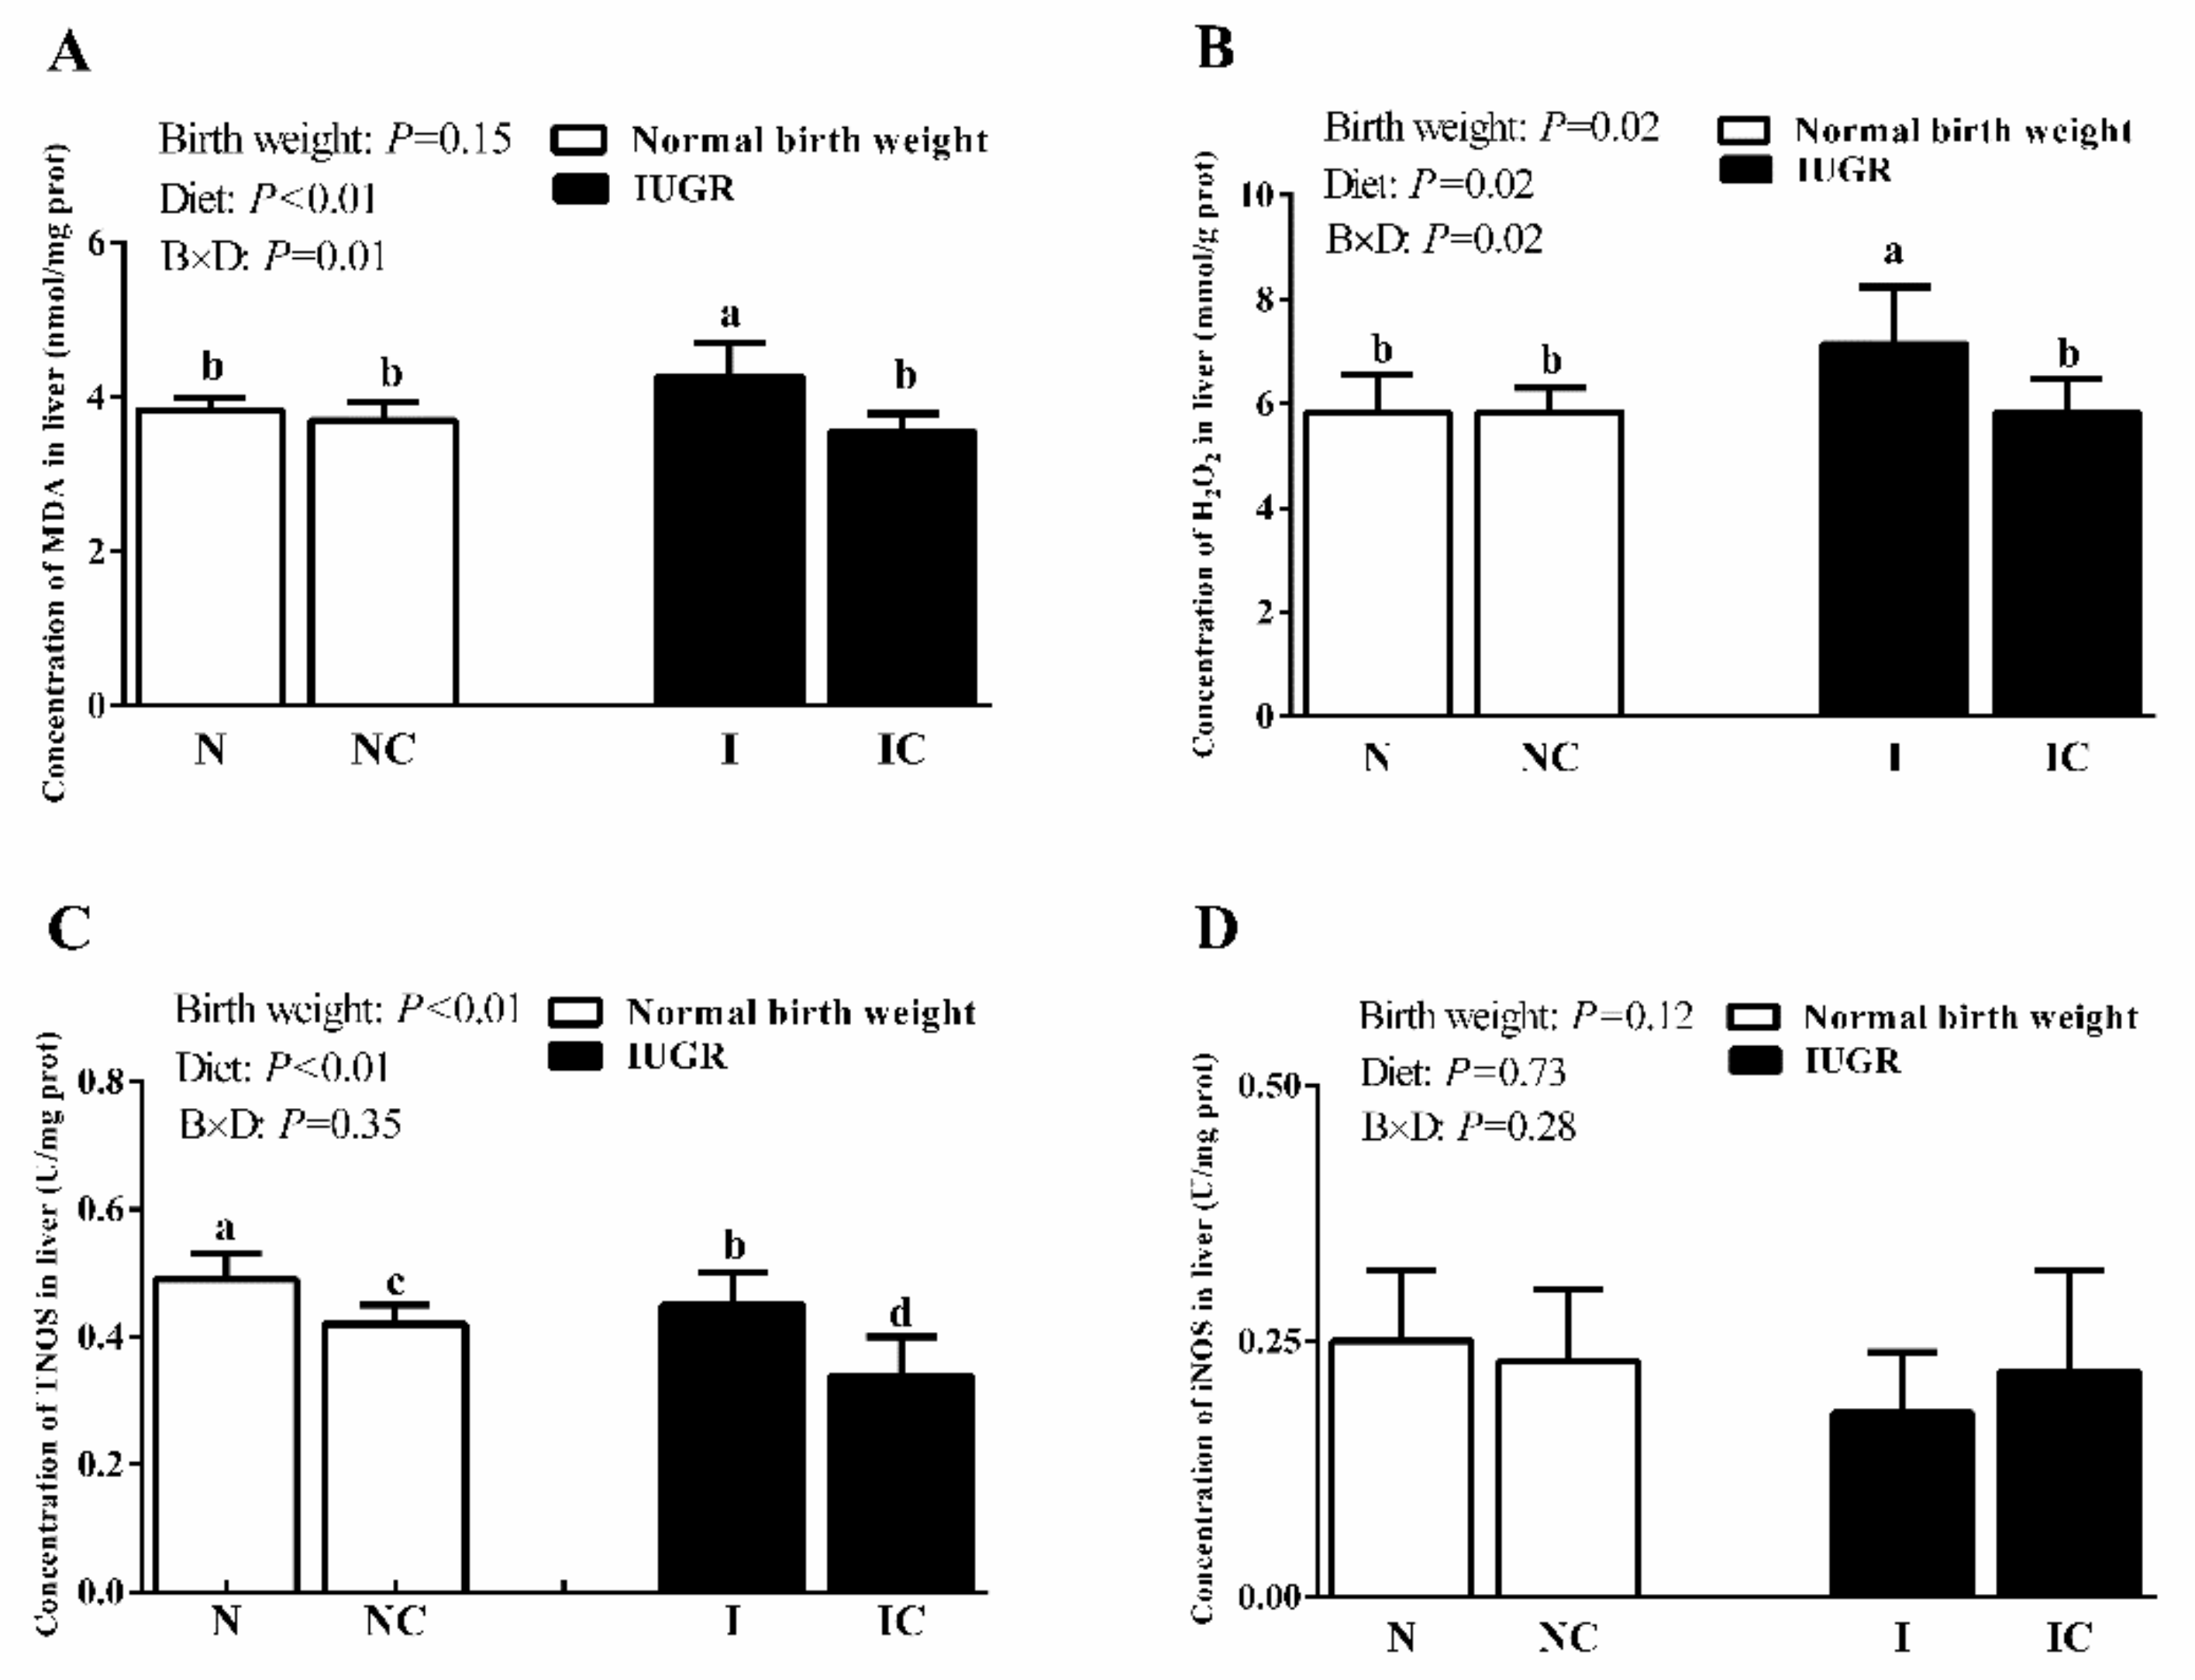
3.3. Hepatic Antioxidant Capacity of Newborn and Weaned Piglets
3.4. Hepatic Nuclear Factor, Erythroid 2-Like 2 (Nfe2l2), Heme Oxygenase-1 (Hmox1), Cat, and Glutathione Peroxidase 1 (Gpx1) Gene Expressions of Newborn and Weaned Piglets
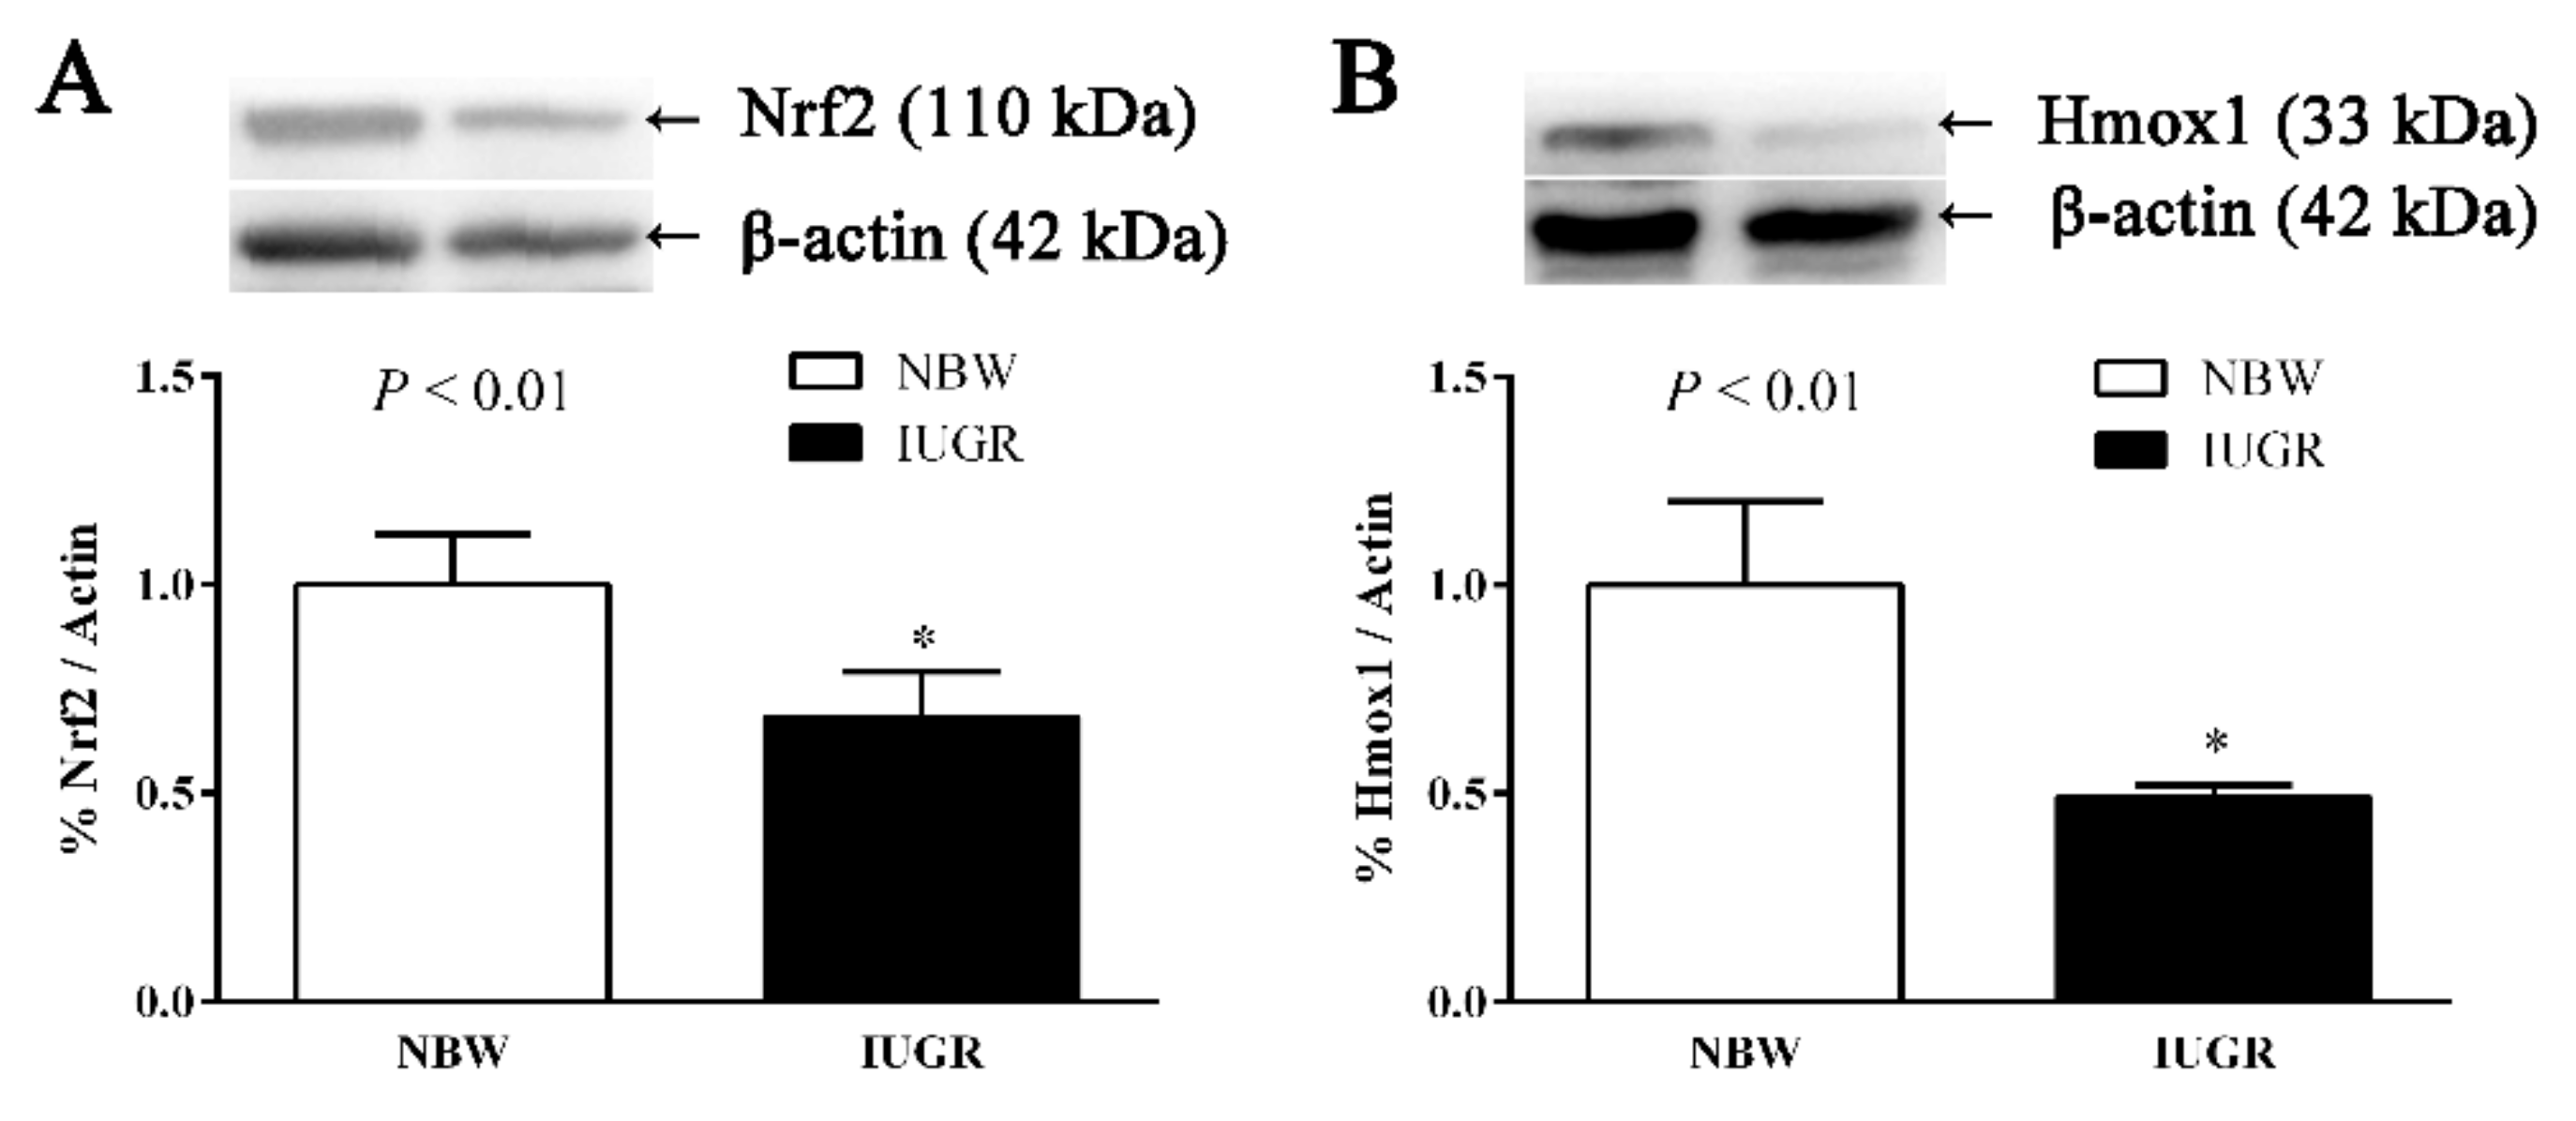
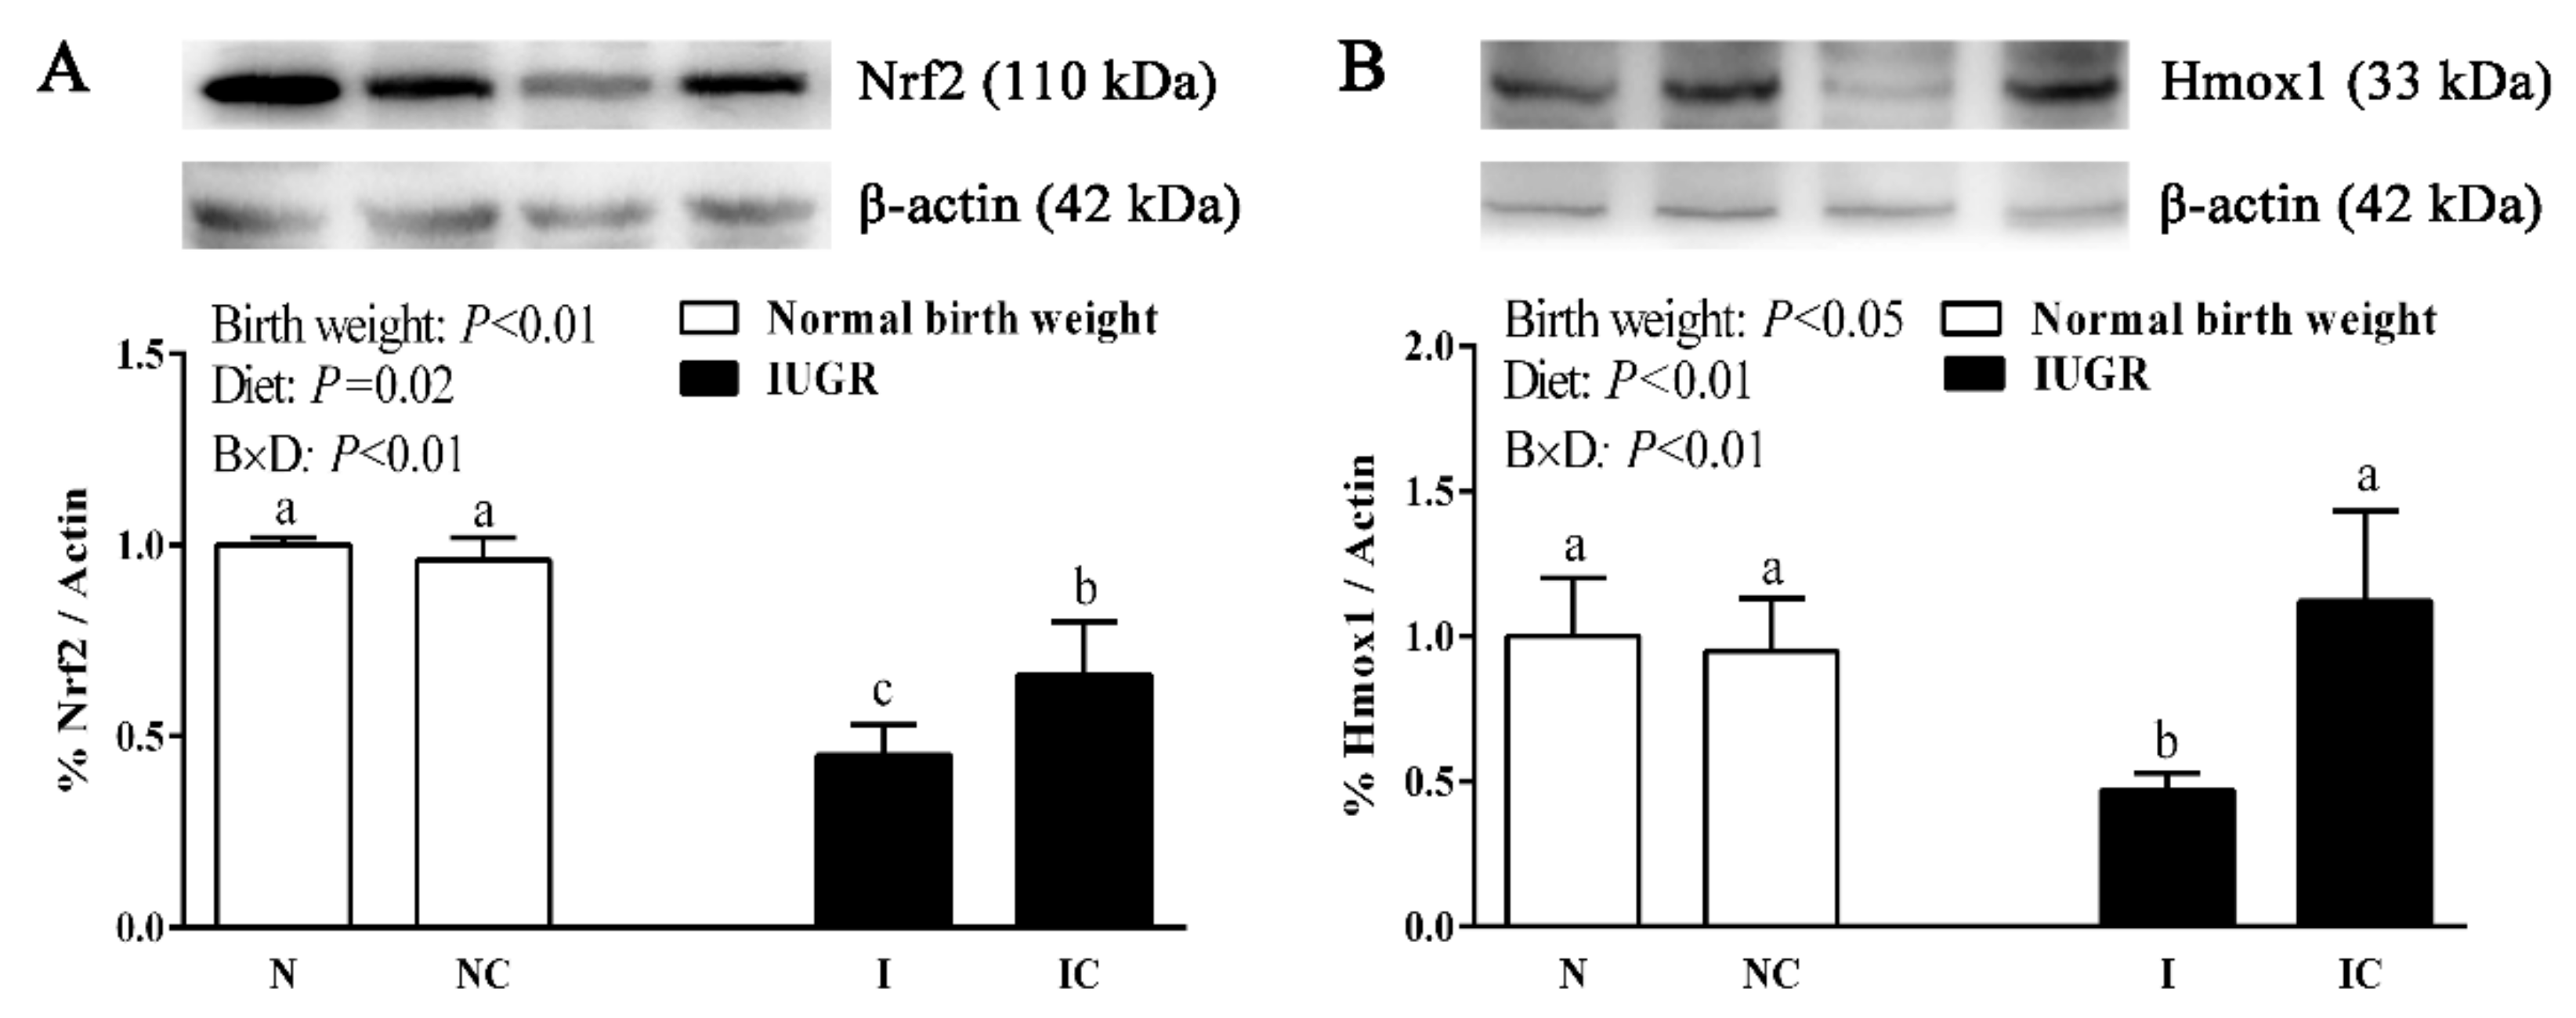
3.5. Immunoblotting
4. Discussion
5. Conclusions
Supplementary Materials
Author Contributions
Funding
Acknowledgments
Conflicts of Interest
References
- Anand, P.; Kunnumakkara, A.B.; Newman, R.A.; Aggarwal, B.B. Bioavailability of curcumin: Problems and promises. Mol. Pharm. 2007, 4, 807–818. [Google Scholar] [CrossRef] [PubMed]
- Lao, C.D.; Ruffin, M.T.; Normolle, D.; Heath, D.D.; Murray, S.I.; Bailey, J.M.; Boggs, M.E.; Crowell, J.; Rock, C.L.; Brenner, D.E. Dose escalation of a curcuminoid formulation. BMC Complement. Altern. Med. 2006, 6, 10. [Google Scholar] [CrossRef] [PubMed]
- Toydemir, T.; Kanter, M.; Erboga, M.; Oguz, S.; Erenoglu, C. Antioxidative, antiapoptotic, and proliferative effect of curcumin on liver regeneration after partial hepatectomy in rats. Toxicol. Ind. Health 2015, 31, 162–172. [Google Scholar] [CrossRef] [PubMed]
- Gan, Z.; Wei, W.; Li, Y.; Wu, J.; Zhao, Y.; Zhang, L.; Wang, T.; Zhong, X. Curcumin and resveratrol regulate intestinal bacteria and alleviate intestinal inflammation in weaned piglets. Molecules 2019, 24, 1220. [Google Scholar] [CrossRef]
- Wang, M.E.; Chen, Y.C.; Chen, I.S.; Hsieh, S.C.; Chen, S.S.; Chiu, C.H. Curcumin protects against thioacetamide-induced hepatic fibrosis by attenuating the inflammatory response and inducing apoptosis of damaged hepatocytes. J. Nutr. Biochem. 2012, 23, 1352–1366. [Google Scholar] [CrossRef] [PubMed]
- Ruby, A.J.; Kuttan, G.; Babu, K.D.; Rajasekharan, K.N.; Kuttan, R. Anti-tumour and antioxidant activity of natural curcuminoids. Cancer Lett. 1995, 94, 79–83. [Google Scholar] [CrossRef]
- Xun, W.; Shi, L.; Zhou, H.; Hou, G.; Cao, T.; Zhao, C. Effects of curcumin on growth performance, jejunal mucosal membrane integrity, morphology and immune status in weaned piglets challenged with enterotoxigenic Escherichia coli. Int. Immunopharmacol. 2015, 27, 46–52. [Google Scholar] [CrossRef]
- Wei, S.; Xu, H.; Xia, D.; Zhao, R. Curcumin attenuates the effects of transport stress on serum cortisol concentration, hippocampal NO production, and BDNF expression in the pig. Domest. Anim. Endocrinol. 2010, 39, 231–239. [Google Scholar] [CrossRef]
- Gao, S.; Duan, X.; Wang, X.; Dong, D.; Liu, D.; Li, X.; Sun, G.; Li, B. Curcumin attenuates arsenic-induced hepatic injuries and oxidative stress in experimental mice through activation of Nrf2 pathway, promotion of arsenic methylation and urinary excretion. Food Chem. Toxicol. 2013, 59, 739–747. [Google Scholar] [CrossRef]
- Hay, W.W.; Thureen, P.J.; Anderson, M.S. Intrauterine growth restriction. NeoReviews 2001, 2, e129–e138. [Google Scholar] [CrossRef]
- Wu, G.; Bazer, F.W.; Datta, S.; Gao, H.; Johnson, G.A.; Lassala, A.; Li, P.; Satterfield, M.C.; Spencer, T.E. Intrauterine growth retardation in livestock: Implications, mechanisms and solutions. Arch. fur Tierz. Arch. Anim. Breed. 2008, 51, 4–10. [Google Scholar]
- Zohdi, V.; Lim, K.; Pearson, J.T.; Black, M.J. Developmental programming of cardiovascular disease following intrauterine growth restriction: Findings utilising a rat model of maternal protein restriction. Nutrients 2015, 7, 119–152. [Google Scholar] [CrossRef] [PubMed]
- Amarilyo, G.; Oren, A.; Mimouni, F.B.; Ochshorn, Y.; Deutsch, V.; Mandel, D. Increased cord serum inflammatory markers in small-for-gestational-age neonates. J. Perinatol. 2011, 31, 30–32. [Google Scholar] [CrossRef] [PubMed]
- Mert, I.; Oruc, A.S.; Yuksel, S.; Cakar, E.S.; Buyukkagnici, U.; Karaer, A.; Danisman, N. Role of oxidative stress in preeclampsia and intrauterine growth restriction. J. Obstet. Gynaecol. Res. 2012, 38, 658–664. [Google Scholar] [CrossRef] [PubMed]
- Kamath, U.; Rao, G.; Kamath, S.U.; Rai, L. Maternal and fetal indicators of oxidative stress during intrauterine growth retardation (IUGR). Indian J. Clin. Biochem. 2006, 21, 111–115. [Google Scholar] [CrossRef] [PubMed]
- Liu, J.; Yao, Y.; Yu, B.; Mao, X.; Huang, Z.; Chen, D. Effect of folic acid supplementation on hepatic antioxidant function and mitochondrial-related gene expression in weanling intrauterine growth retarded piglets. Livest. Sci. 2012, 146, 123–132. [Google Scholar] [CrossRef]
- Hao, Z.; Yue, L.; Tian, W. Antioxidant capacity and concentration of redox-active trace mineral in fully weaned intra-uterine growth retardation piglets. J. Anim. Sci. Biotechnol. 2016, 6, 201–207. [Google Scholar]
- NRC. Nutrient Requirements of Swine, 11th rev. ed.; The National Academies Press: Washington, DC, USA, 2012. [Google Scholar]
- Dong, L.; Zhong, X.; Ahmad, H.; Li, W.; Wang, Y.; Zhang, L.; Wang, T. Intrauterine growth restriction impairs small intestinal mucosal immunity in neonatal piglets. J. Histochem. Cytochem. 2014, 62, 510–518. [Google Scholar] [CrossRef]
- Wang, Y.; Zhang, L.; Zhou, G.; Liao, Z.; Ahmad, H.; Liu, W.; Wang, T. Dietary l-arginine supplementation improves the intestinal development through increasing mucosal Akt and mammalian target of rapamycin signals in intra-uterine growth retarded piglets. Br. J. Nutr. 2012, 108, 1371–1381. [Google Scholar] [CrossRef]
- Zhang, J.; Xu, L.; Zhang, L.; Ying, Z.; Su, W.; Wang, T. Curcumin Attenuates D-Galactosamine/Lipopolysaccharide-Induced Liver Injury and Mitochondrial Dysfunction in Mice. J. Nutr. 2014, 144, 1211–1218. [Google Scholar] [CrossRef]
- He, J.; Dong, L.; Xu, W.; Bai, K.; Lu, C.; Wu, Y.; Huang, Q.; Zhang, L.; Wang, T. Dietary tributyrin supplementation attenuates insulin resistance and abnormal lipid metabolism in suckling piglets with intrauterine growth retardation. PLoS ONE 2015, 10, e0136848. [Google Scholar] [CrossRef] [PubMed]
- Schmittgen, T.D.; Livak, K.J. Analyzing real-time PCR data by the comparative CT method. Nat. Protoc. 2008, 3, 1101–1108. [Google Scholar] [CrossRef] [PubMed]
- Oztuna, D.; Elhan, A.H.; Tüccar, E. Investigation of four different normality tests in terms of type 1 error rate and power under different distributions. Turk. J. Med. Sci. 2006, 36, 171–176. [Google Scholar]
- Biri, A.; Bozkurt, N.; Turp, A.; Kavutcu, M.; Himmetoglu, O.; Durak, I. Role of oxidative stress in intrauterine growth restriction. Gynecol. Obstet. Investig. 2007, 64, 187–192. [Google Scholar] [CrossRef]
- Xu, W.; Bai, K.; He, J.; Su, W.; Dong, L.; Zhang, L.; Wang, T. Leucine improves growth performance of intrauterine growth retardation piglets by modifying gene and protein expression related to protein synthesis. Nutrition 2015, 32, 114–121. [Google Scholar] [CrossRef]
- Zhang, J.F.; Hu, Z.P.; Lu, C.H.; Yang, M.X.; Zhang, L.L.; Wang, T. Dietary curcumin supplementation protects against heat-stress-impaired growth performance of broilers possibly through a mitochondrial pathway. J. Anim. Sci. 2015, 93, 1656–1665. [Google Scholar] [CrossRef]
- Nyblom, H.; Berggren, U.; Balldin, J.; Olsson, R. High AST/ALT ratio may indicate advanced alcoholic liver disease rather than heavy drinking. Alcohol Alcohol. 2004, 39, 336–339. [Google Scholar] [CrossRef]
- Lee, D.H.; Lim, B.S.; Lee, Y.K.; Yang, H.C. Effects of hydrogen peroxide (H2O2) on alkaline phosphatase activity and matrix mineralization of odontoblast and osteoblast cell lines. Cell Biol. Toxicol. 2006, 22, 39–46. [Google Scholar] [CrossRef]
- Fang, Y.Z.; Yang, S.; Wu, G. Free radicals, antioxidants, and nutrition. Nutrition 2002, 18, 872–879. [Google Scholar] [CrossRef]
- Jones, D.P. Redox potential of GSH/GSSG couple: Assay and biological significance. Methods Enzymol. 2002, 348, 93–112. [Google Scholar]
- Mahmoud, K.Z.; Edens, F.W. Influence of selenium sources on age-related and mild heat stress-related changes of blood and liver glutathione redox cycle in broiler chickens (Gallus domesticus). Comp. Biochem. Physiol. Part B Biochem. Mol. Biol. 2003, 136, 921–934. [Google Scholar] [CrossRef]
- Hracsko, Z.; Orvos, H.; Novak, Z.; Pal, A.; Varga, I.S. Evaluation of oxidative stress markers in neonates with intra-uterine growth retardation. Redox Rep. Commun. Free Radic. Res. 2013, 13, 11–16. [Google Scholar] [CrossRef] [PubMed]
- Eldemerdash, F.M.; Yousef, M.I.; Radwan, F.M. Ameliorating effect of curcumin on sodium arsenite-induced oxidative damage and lipid peroxidation in different rat organs. Food Chem. Toxicol. 2008, 47, 249–254. [Google Scholar] [CrossRef] [PubMed]
- Altıntoprak, N.; Kar, M.; Acar, M.; Berkoz, M.; Muluk, N.B.; Cingi, C. Antioxidant activities of curcumin in allergic rhinitis. Eur. Arch. Oto-Rhino-Laryngol. 2016, 273, 3765–3773. [Google Scholar]
- Kensler, T.W.; Wakabayashi, N.; Biswal, S. Cell survival responses to environmental stresses via the Keap1-Nrf2-ARE pathway. Annu. Rev. Pharmacol. Toxicol. 2007, 47, 89–116. [Google Scholar] [CrossRef]
- Joris, M.; Maartje, D.V.; Joris, M.; Anneke, O.; Stefaan, D.S.; Christa, V.G. Maturation of digestive function is retarded and plasma antioxidant capacity lowered in fully weaned low birth weight piglets. Br. J. Nutr. 2013, 109, 65–75. [Google Scholar]
- Farombi, E.O.; Shrotriya, S.; Na, H.K.; Kim, S.H.; Surh, Y.J. Curcumin attenuates dimethylnitrosamine-induced liver injury in rats through Nrf2-mediated induction of heme oxygenase-1. Food Chem. Toxicol. 2008, 46, 1279–1287. [Google Scholar] [CrossRef]


| Items | Experiment Groups | p-Value | |||||
|---|---|---|---|---|---|---|---|
| NBW | NC | IUGR | IC | B | D | B × D | |
| BWG (kg) | 6.02 ± 0.04 a | 5.95 ± 0.08 ab | 4.44 ± 0.04 c | 5.31 ± 0.05 b | <0.01 | <0.01 | <0.01 |
| FI (kg) | 7.23 ± 0.14 a | 7.45 ± 0.10 a | 5.13 ± 0.10 c | 6.17 ± 0.17 b | <0.01 | 0.68 | <0.01 |
| G:F (kg/kg) | 0.83 ± 0.02 | 0.80 ± 0.01 | 0.87 ± 0.01 | 0.86 ± 0.03 | 0.43 | 0.56 | 0.20 |
| Items | Experiment Groups | p-Value | |||||
|---|---|---|---|---|---|---|---|
| NBW | NC | IUGR | IC | B | D | B × D | |
| TAOC (U/mL) | 1.94 ± 0.50 b | 2.08 ± 0.64 a | 1.03 ± 0.37 c | 1.89 ± 0.57 b | 0.01 | 0.01 | 0.06 |
| CAT (U/mL) | 4.68 ± 1.15 b | 6.88 ± 1.08 a | 1.77 ± 0.43 c | 3.59 ± 1.27 b | <0.01 | <0.01 | 0.61 |
| GSH-Px (U/mL) | 421.06 ± 63.75 a | 388.53 ± 38.06 ab | 355.29 ± 50.57 b | 376.87 ± 25.39 ab | 0.03 | 0.74 | 0.11 |
| GR (U/L) | 23.98 ± 2.73 bc | 25.79 ± 4.34 a | 21.47 ± 1.38 c | 30.14 ± 1.24 a | 0.35 | <0.01 | <0.01 |
| Items | NBW | IUGR | p-Value |
|---|---|---|---|
| TAOC (U/mg protein) | 0.65 ± 0.10 | 0.48 ± 0.05 | <0.01 |
| CAT (U/mg protein) | 12.66 ± 1.44 | 12.81 ± 1.43 | 0.83 |
| GSH (µmol/g protein) | 66.78 ± 17.84 | 80.78 ± 13.29 | 0.10 |
| GSSG (µmol/g protein) | 21.06 ± 2.69 | 17.92 ± 4.16 | 0.10 |
| GSSG:GSH | 0.22 ± 0.05 | 0.34 ± 0.13 | 0.04 |
| GSH-Px (U/mg protein) | 26.03 ± 0.70 | 22.43 ± 1.19 | <0.01 |
| GR (U/g protein) | 15.13 ± 2.79 | 11.67 ± 3.47 | 0.03 |
| Items | Experiment Groups | p-Value | |||||
|---|---|---|---|---|---|---|---|
| NBW | NC | IUGR | IC | B | D | B × D | |
| Serum | |||||||
| AST (U/L) | 21.65 ± 0.90 c | 18.69 ± 1.07 d | 25.93 ± 0.84 a | 23.27 ± 0.89 b | 0.02 | 0.01 | 0.07 |
| ALT (U/L) | 13.52 ± 1.53 c | 13.21 ± 1.43 c | 20.78 ± 1.67 a | 18.23 ± 1.97 b | <0.01 | 0.07 | 0.03 |
| Liver | |||||||
| TAOC (U/mg protein) | 1.00 ± 0.11 ab | 1.00 ± 0.06 ab | 0.88 ± 0.14 b | 1.21 ± 0.22 a | 0.37 | <0.01 | <0.01 |
| CAT (U/mg protein) | 7.92 ± 0.60 ab | 7.43 ± 0.55 b | 8.97 ± 0.79 a | 7.73 ± 0.63 b | 0.01 | <0.01 | 0.12 |
| GSH-Px (U/mg protein) | 47.05 ± 6.73 b | 43.62 ± 7.36 b | 36.23 ± 2.04 c | 58.30 ± 5.17 a | 0.35 | <0.01 | <0.01 |
| GR (U/g protein) | 15.17 ± 1.27 b | 19.86 ± 3.57 a | 16.11 ± 1.22 b | 18.94 ± 3.36 a | 0.99 | 0.32 | <0.01 |
| Items | NBW | IUGR | p-Value |
|---|---|---|---|
| Nfe2l2 | 1.00 ± 0.01 | 0.36 ± 0.03 | <0.01 |
| Hmox1 | 1.00 ± 0.03 | 0.76 ± 0.05 | <0.01 |
| Cat | 1.00 ± 0.02 | 0.67 ± 0.02 | <0.01 |
| Gpx1 | 1.00 ± 0.04 | 0.69 ± 0.06 | <0.01 |
| Items | Experiment Groups | p-Value | |||||
|---|---|---|---|---|---|---|---|
| NBW | NC | IUGR | IC | B | D | B × D | |
| Nfe2l2 | 1.00 ± 0.07 b | 1.25 ± 0.32 b | 0.57 ± 0.16 c | 2.04 ± 0.05 a | 0.01 | <0.01 | <0.01 |
| Hmox1 | 1.00 ± 0.26 a | 1.05 ± 0.09 a | 0.54 ± 0.10 b | 0.59 ± 0.13 b | <0.01 | 0.36 | 0.98 |
| Cat | 1.00 ± 0.26 b | 1.24 ± 0.11 a | 0.55 ± 0.10 c | 0.52 ± 0.05 c | <0.01 | 0.06 | 0.02 |
| Gpx1 | 1.00 ± 0.17 b | 1.15 ± 0.16 b | 0.60 ± 0.09 c | 1.76 ± 0.12 a | 0.05 | <0.01 | <0.01 |
© 2019 by the authors. Licensee MDPI, Basel, Switzerland. This article is an open access article distributed under the terms and conditions of the Creative Commons Attribution (CC BY) license (http://creativecommons.org/licenses/by/4.0/).
Share and Cite
Niu, Y.; He, J.; Ahmad, H.; Shen, M.; Zhao, Y.; Gan, Z.; Zhang, L.; Zhong, X.; Wang, C.; Wang, T. Dietary Curcumin Supplementation Increases Antioxidant Capacity, Upregulates Nrf2 and Hmox1 Levels in the Liver of Piglet Model with Intrauterine Growth Retardation. Nutrients 2019, 11, 2978. https://doi.org/10.3390/nu11122978
Niu Y, He J, Ahmad H, Shen M, Zhao Y, Gan Z, Zhang L, Zhong X, Wang C, Wang T. Dietary Curcumin Supplementation Increases Antioxidant Capacity, Upregulates Nrf2 and Hmox1 Levels in the Liver of Piglet Model with Intrauterine Growth Retardation. Nutrients. 2019; 11(12):2978. https://doi.org/10.3390/nu11122978
Chicago/Turabian StyleNiu, Yu, Jintian He, Hussain Ahmad, Mingming Shen, Yongwei Zhao, Zhending Gan, Lili Zhang, Xiang Zhong, Chao Wang, and Tian Wang. 2019. "Dietary Curcumin Supplementation Increases Antioxidant Capacity, Upregulates Nrf2 and Hmox1 Levels in the Liver of Piglet Model with Intrauterine Growth Retardation" Nutrients 11, no. 12: 2978. https://doi.org/10.3390/nu11122978
APA StyleNiu, Y., He, J., Ahmad, H., Shen, M., Zhao, Y., Gan, Z., Zhang, L., Zhong, X., Wang, C., & Wang, T. (2019). Dietary Curcumin Supplementation Increases Antioxidant Capacity, Upregulates Nrf2 and Hmox1 Levels in the Liver of Piglet Model with Intrauterine Growth Retardation. Nutrients, 11(12), 2978. https://doi.org/10.3390/nu11122978