Article

Comparison of the Effects of Fasting Glucose, Hemoglobin A1c, and Triglyceride–Glucose Index on Cardiovascular Events in Type 2 Diabetes Mellitus

1
Department of General Medicine, Kaohsiung Medical University Hospital, Kaohsiung 807, Taiwan
2
Division of Nephrology, Department of Internal Medicine, Kaohsiung Medical University Hospital, Kaohsiung Medical University, Kaohsiung 807, Taiwan
3
Department of Internal Medicine, Kaohsiung Municipal Siaogang Hospital, Kaohsiung Medical University, Kaohsiung 812, Taiwan
4
Faculty of Medicine, College of Medicine, Kaohsiung Medical University, Kaohsiung 807, Taiwan
5
Division of Medical Statistics and Bioinformatics, Department of Medical Research, Kaohsiung Medical University Hospital, Kaohsiung Medical University, Kaohsiung 807, Taiwan
6
Division of Endocrinology and Metabolism, Department of Internal Medicine, Kaohsiung Medical University Hospital, Kaohsiung Medical University, Kaohsiung 807, Taiwan
*
Author to whom correspondence should be addressed.
These two contribute equally to this article.
Nutrients 2019, 11(11), 2838; https://doi.org/10.3390/nu11112838
Submission received: 25 September 2019 / Revised: 12 November 2019 / Accepted: 15 November 2019 / Published: 19 November 2019

Abstract

:
The triglyceride–glucose (TyG) index has been correlated with insulin resistance. We aim to investigate the role of the TyG index on cardiovascular (CV) events in type 2 diabetes mellitus and compare the roles of fasting glucose, hemoglobin A1c, and the TyG index in predicting CV events. This retrospective study enrolled 3524 patients with type 2 diabetes from the Kaohsiung Medical University Research Database in 2009 in this longitudinal study and followed them until 2015. The TyG index was calculated as log (fasting triglyceride level (mg/dL) × fasting glucose level (mg/dL)/2). CV events included myocardial infarction, unstable angina, stroke, hospitalization for coronary artery disease, peripheral artery disease, and CV-related death. The association between variables and CV events was assessed using a multivariable stepwise Cox proportional hazard analysis. Two hundred and fifteen CV events (6.1%) were recorded during a follow-up period of 5.93 years. The multivariable stepwise analysis showed that high fasting glucose (HR, 1.007; p < 0.001) and a high TyG index (HR, 1.521; p = 0.004) but not hemoglobin A1c or triglycerides were associated with a higher rate of CV events. Adding fasting glucose and the TyG index to the basic model improved the predictive ability of progression to a CV event (p < 0.001 and p = 0.018, respectively), over that of hemoglobin A1c (p = 0.084) and triglyceride (p = 0.221). Fasting glucose and the TyG index are useful parameters and stronger predictive factors than hemoglobin A1c and triglyceride for CV events and may offer an additional prognostic benefit in patients with type 2 diabetes.

1. Introduction

It was estimated that there are 451 million people aged 18–99 years with diabetes worldwide in 2017; these numbers were expected to rise to 693 million by 2045. In 2017, approximately 374 million people with impaired glucose tolerance, and 5 million deaths worldwide were attributed to diabetes [1]. The risk of developing cardiovascular (CV) disease has been reported to be two- to three-fold higher in people with diabetes, in whom CV disease is the major cause of death [2,3]. Therefore, it is crucial to identify patients with type 2 DM at high risk of developing future CV events so that optimal management can be provided. Previous studies have demonstrated a progressive increase in the risk of CV events or death with increasing levels of fasting plasma glucose in both patients with and without diabetes [4,5]. Besides fasting glucose, hemoglobin A1c is used as diagnostic criteria for type 2 DM. Several epidemiological studies have reported an association between hemoglobin A1c and adverse CV outcomes [6]; others have not identified hemoglobin A1c as a risk factor for adverse CV outcomes [7]. In a systematic review of 74 published studies and 46 studies of meta-analysis, hemoglobin A1c is a dependable risk factor of overall and cardiovascular mortality in both diabetics and non-diabetics. An optimal hemoglobin A1c level, ranging from 6.0% to 8.0% for people with diabetes and 5.0% to 6.0% for those without diabetes, results in the lowest all-cause and cardiovascular mortality [8].
High levels of triglycerides and fasting glucose are two components of the metabolic syndrome, which is one of the most important risk factors for CV disease [9]. The triglyceride-glucose (TyG) index combines both levels of triglycerides and fasting glucose, and it has been reported to be significantly correlated with insulin resistance and to be a reliable surrogate marker of insulin resistance [10]. Most previous studies have focused on the association between the TyG index and metabolic diseases [11,12,13], although several recent studies have shown an association between the TyG index and vascular disease [14,15] and CV outcomes in patients with non-ST-segment elevation acute coronary syndrome [16]. However, few studies have investigated an association between the TyG index and CV outcomes in patients with diabetes.
The aim of this study is to investigate whether the TyG index is associated with CV events in patients with type 2 DM and compare the roles of fasting glucose, hemoglobin A1c, and the TyG index in predicting CV events. To the best of our knowledge, this is the first study to compare the roles of fasting glucose, hemoglobin A1c, and the TyG index in predicting CV events in patients with type 2 DM.

2. Materials and Methods

2.1. Setting

Kaohsiung Medical University Hospital (KMUH) is a medical center located in southern Taiwan with around 1600 beds and 6000 patient visits per day. In this retrospective study, we used data from the KMUH research database (KMUHRD), which includes the data of approximately two million patients who attended KMUH from 2009 to 2015. The KMUHRD is comprised of data on hospital admissions, drug-dispensing records, ambulatory care, dental services, and biochemical test results. In addition, data on primary and secondary diagnoses coded according to the International Classification of Diseases (9th Revision, Clinical Modification; ICD-9-CM), dates of hospitalization, procedures, and discharge are recorded in the KMUHRD. The drug-dispensing data recorded in the KMUHRD include the type of prescriber, the name, date, amount, and prescribed dose regimen of the dispensed drug, and the length of the prescription (drug use period).
The KMUHRD is managed by the Division of Medical Statistics and Bioinformatics of KMUH. All personal identifiers are removed from data in the KMUHRD according to the Personal Information Protection Act in Taiwan and only authorized researchers are allowed to conduct data linkage, processing, and statistical analysis. Moreover, these researchers are required to use specific computers in a room with 24-h monitoring with encrypted identifiers, and they must also sign agreement forms. Furthermore, only tables and figures from the statistical analysis are permitted to be used after they have been inspected.

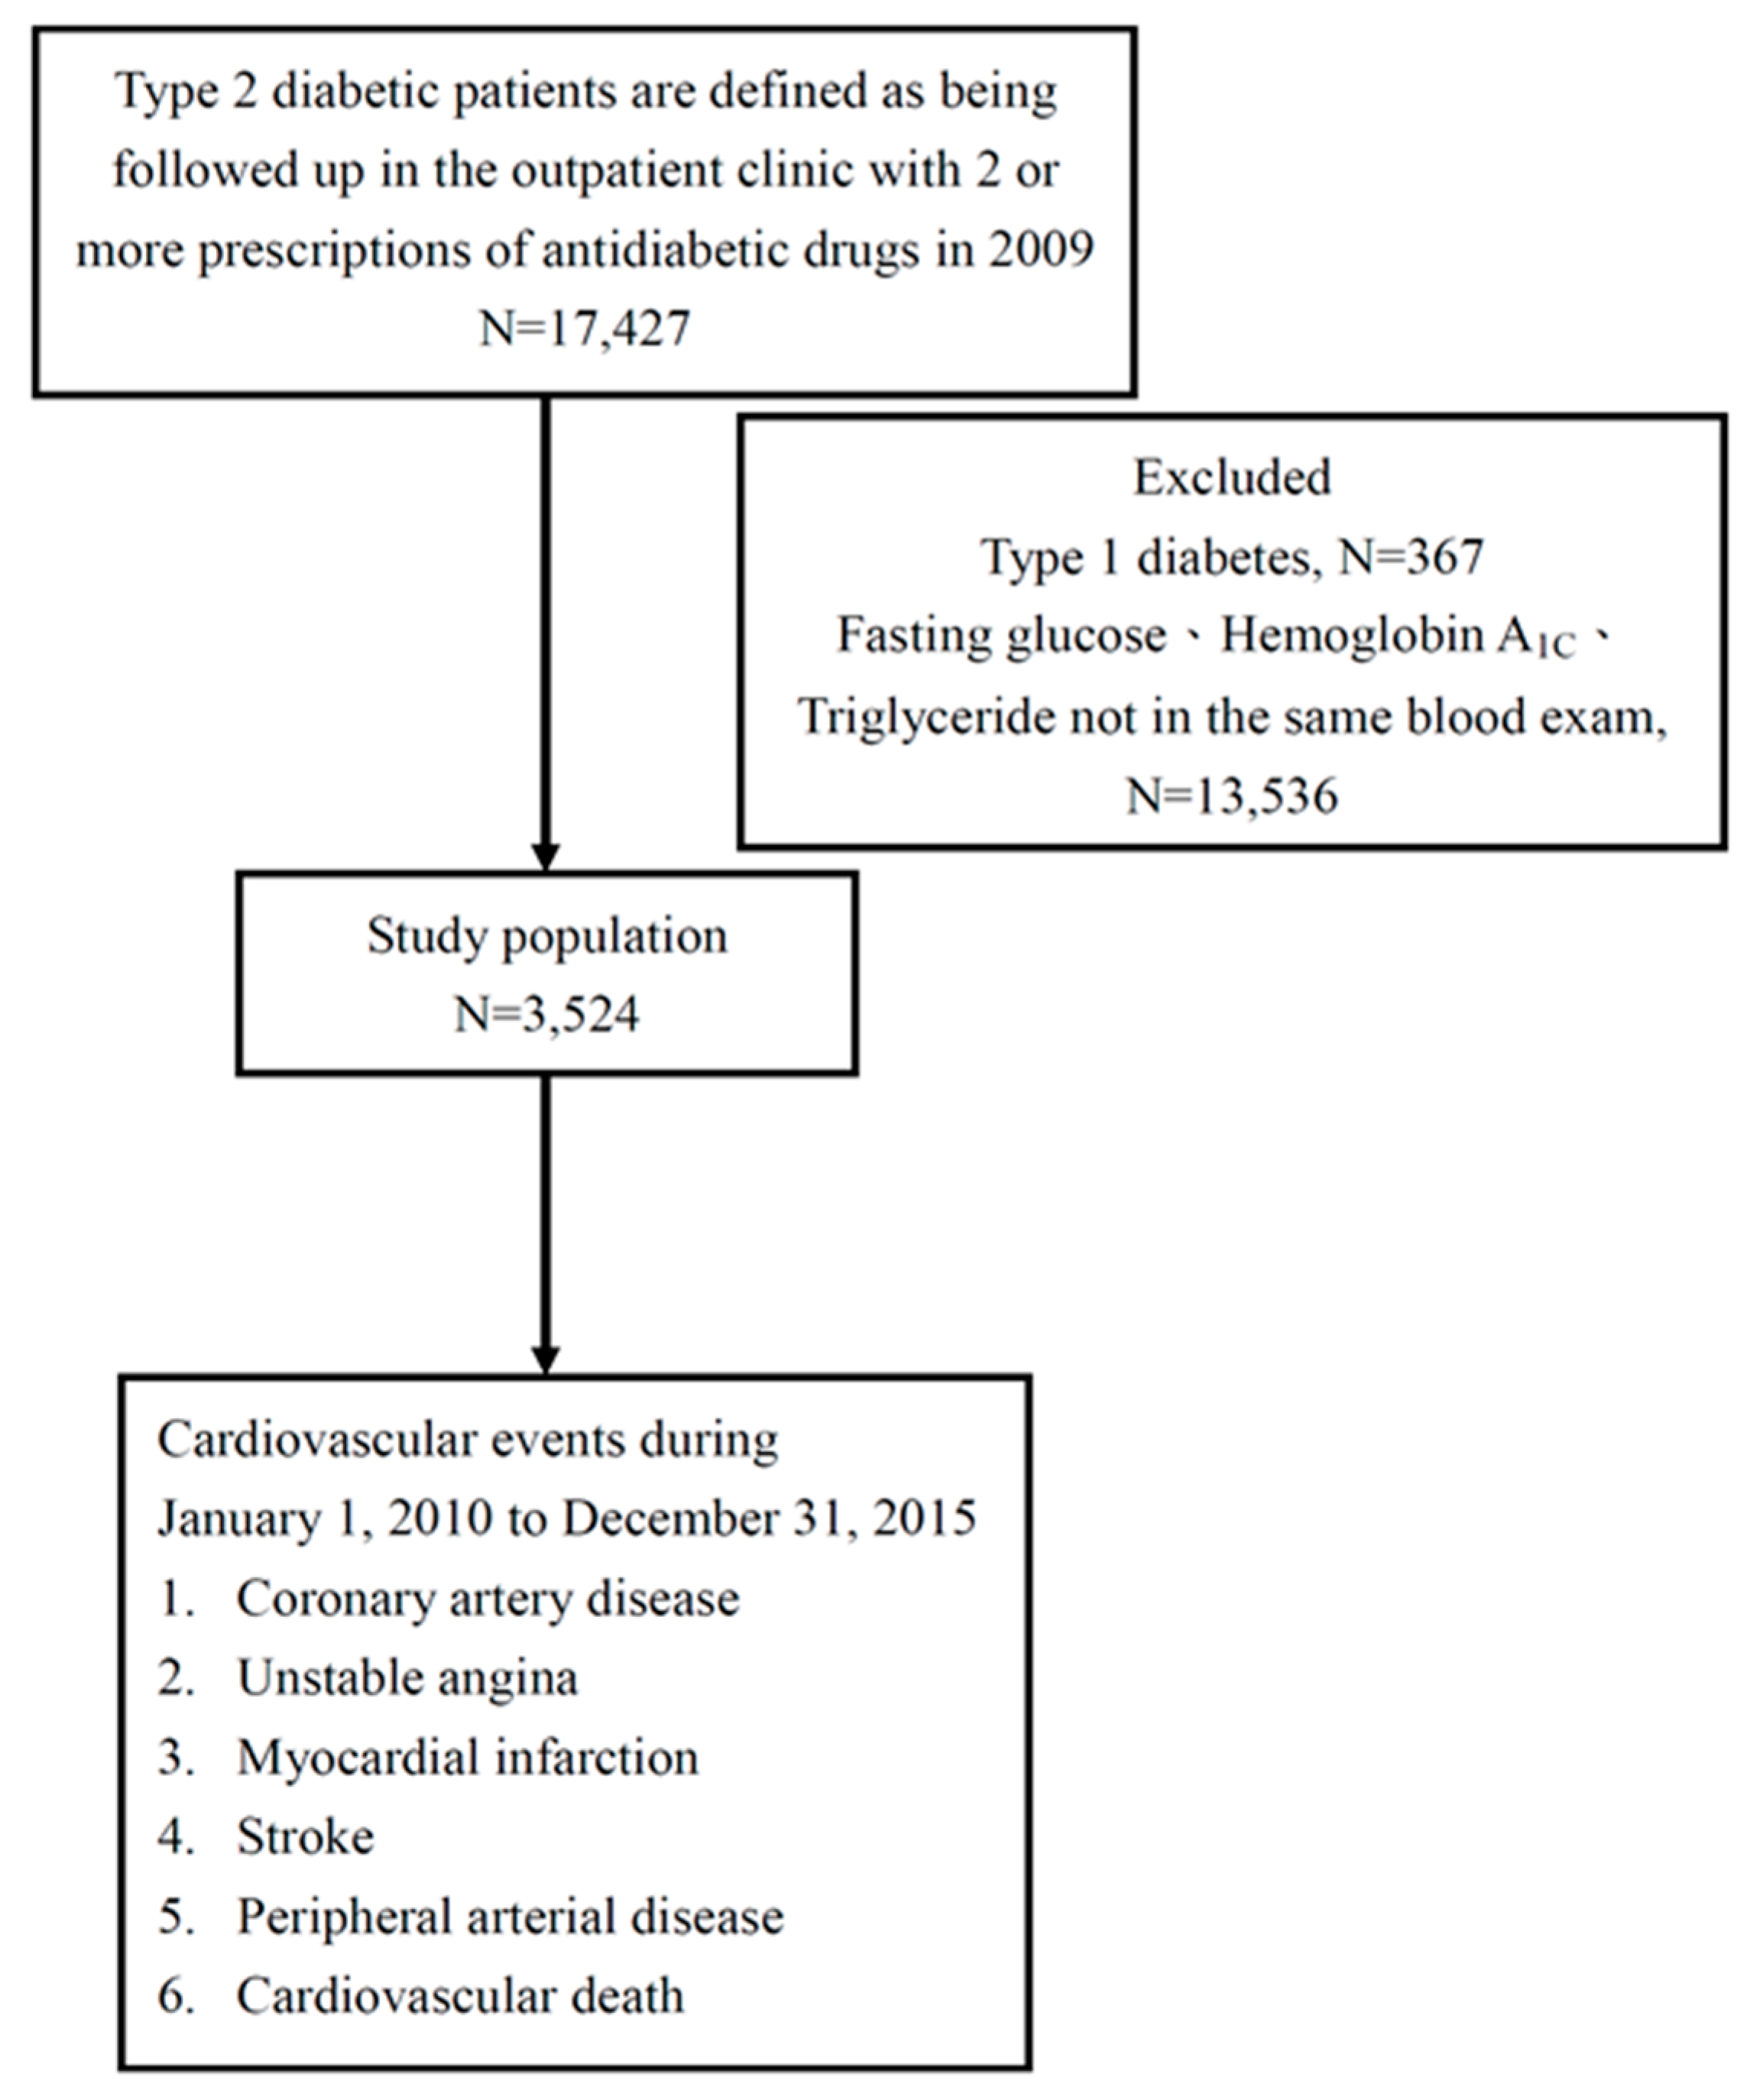
2.2. Study Population

All patients diagnosed with type 2 diabetes (ICD-9-CM codes 250.1–250.9) from 1 January 2009 to 31 December 2009, who were prescribed with hypoglycemic agents and who had a hemoglobin A1c level ≥6.5% were enrolled and followed from 1 January 2010 to 31 December 2015. The covariates such as medications, comorbidities, age, measured were confirmed in 2009, which means if they used medications in 2009 or comorbidities according to ICD-9-CM code in 2009. In this study, CV events were defined as myocardial infarction (ICD-9-CM codes 410–412), coronary artery disease (ICD-9-CM code 414), unstable angina (ICD-9-CM code 411), ischemic stroke (ICD-9-CM codes 435–438), peripheral arterial disease (ICD-9-CM codes 443 and 25070) and CV death (ICD-9-CM code 785.51). Patients with type 1 diabetes, a hemoglobin A1c level <6.5%, and those diagnosed with DM after the occurrence of a CV event were excluded (Figure 1).
In addition, the following data were recorded before entry into the study: age, sex, duration of diabetes, hyperlipidemia (ICD-9-CM code 272), hypertension (ICD-9-CM codes 401 and 405), retinopathy (ICD-9-CM code 250.50), nephropathy (ICD-9-CM codes 580–589), and neuropathy (ICD-9-CM codes 249.60 and 250.60).

2.3. Ethics Statement

The Institutional Review Board of KMUH approved this study (KMUHIRB-E(I)-20160032), and all of the patients provided written informed consent, including for the publication of clinical details. In addition, all clinical investigations were carried out according to the principles conveyed in the Declaration of Helsinki.

2.4. Definition of Study Endpoint

The study endpoint was defined as the occurrence of any CV event, including coronary artery disease, unstable angina, myocardial infarction, stroke, peripheral arterial disease, and CV-related death. Coronary artery disease was defined as ST- and non-ST-elevation myocardial infarction, history of angina, unstable angina, ischemic changes on electrocardiography, and having received angioplasty or coronary bypass surgery. In patients reaching study endpoints, data were censored at the CV events. The other patients were followed until death or December 2015.

2.5. TyG Index

The TyG index was calculated as log (fasting triglycerides (mg/dL) × fasting glucose (mg/dL)/2) [17], with at least three triglyceride and fasting glucose measurements, which product was the average of all blood draws in 2009. Laboratory data, including fasting glucose, triglyceride, and hemoglobin A1c, were measured from fasting blood samples.

2.6. Statistical Analysis

Data were expressed as percentages for categorical variables or mean ± standard deviation for continuous variables. Multivariable stepwise Cox proportional hazard analysis was used to evaluate associations between variables and CV events. Hemoglobin A1c and significant variables in univariable analysis were used in the stepwise multivariable analysis. Associations among fasting glucose level, the TyG index, and CV events were assessed using three models. The first model included hemoglobin A1c and significant variables in the univariable analysis except for the TyG index. The second model included hemoglobin A1c and significant variables in the univariable analysis except for fasting glucose. Increases in model performance were assessed according to changes in the χ2 value. Statistical significance was set at p < 0.05. All statistical analyses were performed using SPSS 19.0 for Windows (SPSS Inc., Chicago, IL, USA).

3. Results

A total of 3524 patients (1731 males and 1793 females) with type 2 DM were included, and their clinical characteristics are shown in Table 1. Their mean age was 61.68 ± 11.90 years, and the average levels of fasting glucose and hemoglobin A1C and TyG index were 154.83 ± 58.53 mg/dL, 7.85 ± 1.76%, and 9.09 ± 0.73, respectively.

3.1. Determinants of CV Events in the Study Patients

During the follow-up period of 5.93 ± 1.14 years, 215 CV events (6.1%) were recorded. Table 2 presents the univariable analysis of the factors associated with CV events in the study patients, which included old age, male sex, the prevalence of hypertension, neuropathy, nephropathy, coronary artery disease, peripheral artery disease, episodes of hypoglycemia, high fasting glucose, high triglycerides, low low-density lipoprotein (LDL) cholesterol, low estimated glomerular filtration rate (eGFR), high TyG index, and high urine albumin-creatinine ratio (UACR) were associated with increased CV events. In addition, medications including angiotensin-converting enzyme inhibitors and/or angiotensin II receptor blockers, anti-hypertensive drugs, aspirin, statins and/or fibrates, meglitinides, acarbose, and insulin were associated with increased CV events, whereas metformin use was associated with decreased CV events.
Table 3 shows the multivariable stepwise analysis of three models of the factors associated with CV events in the study patients. In multivariable stepwise Model 1, after adjusting for hemoglobin A1c and significant variables in the univariable analysis (Table 2) except for the TyG index, old age, a history of coronary artery disease and peripheral artery disease, high fasting glucose (hazard ratio (HR), 1.007; 95% confidence interval (CI), 1.005 to 1.010; p < 0.001), low eGFR, high UACR, and the use of anti-hypertensive drugs and aspirin were independently associated with increased CV events. In multivariable stepwise Model 2, after adjusting for hemoglobin A1c and significant variables in the univariable analysis (Table 2) except for fasting glucose, old age, a history of coronary artery disease, stroke and peripheral artery disease, a high TyG index (HR, 1.521; 95% CI, 1.141 to 2.027; p = 0.004), high UACR, and the use of anti-hypertensive drugs, aspirin, and insulin were independently associated with increased CV events. We further added the TyG index in Model 1 but did not change the results. Fasting glucose was significantly correlated with increased CV events, but the TyG index was not.
We have further performed subgroup analysis after excluding a history of CV events (n = 82) in Table 4, which shows the similar results. In Model 1, high fasting glucose (HR, 1.003; 95% CI, 1.001 to 1.005; p = 0.004), and a high TyG index (HR, 1.228; 95% CI, 1.015 to 1.486; p = 0.035) in Model 2 were associated with increased CV events.

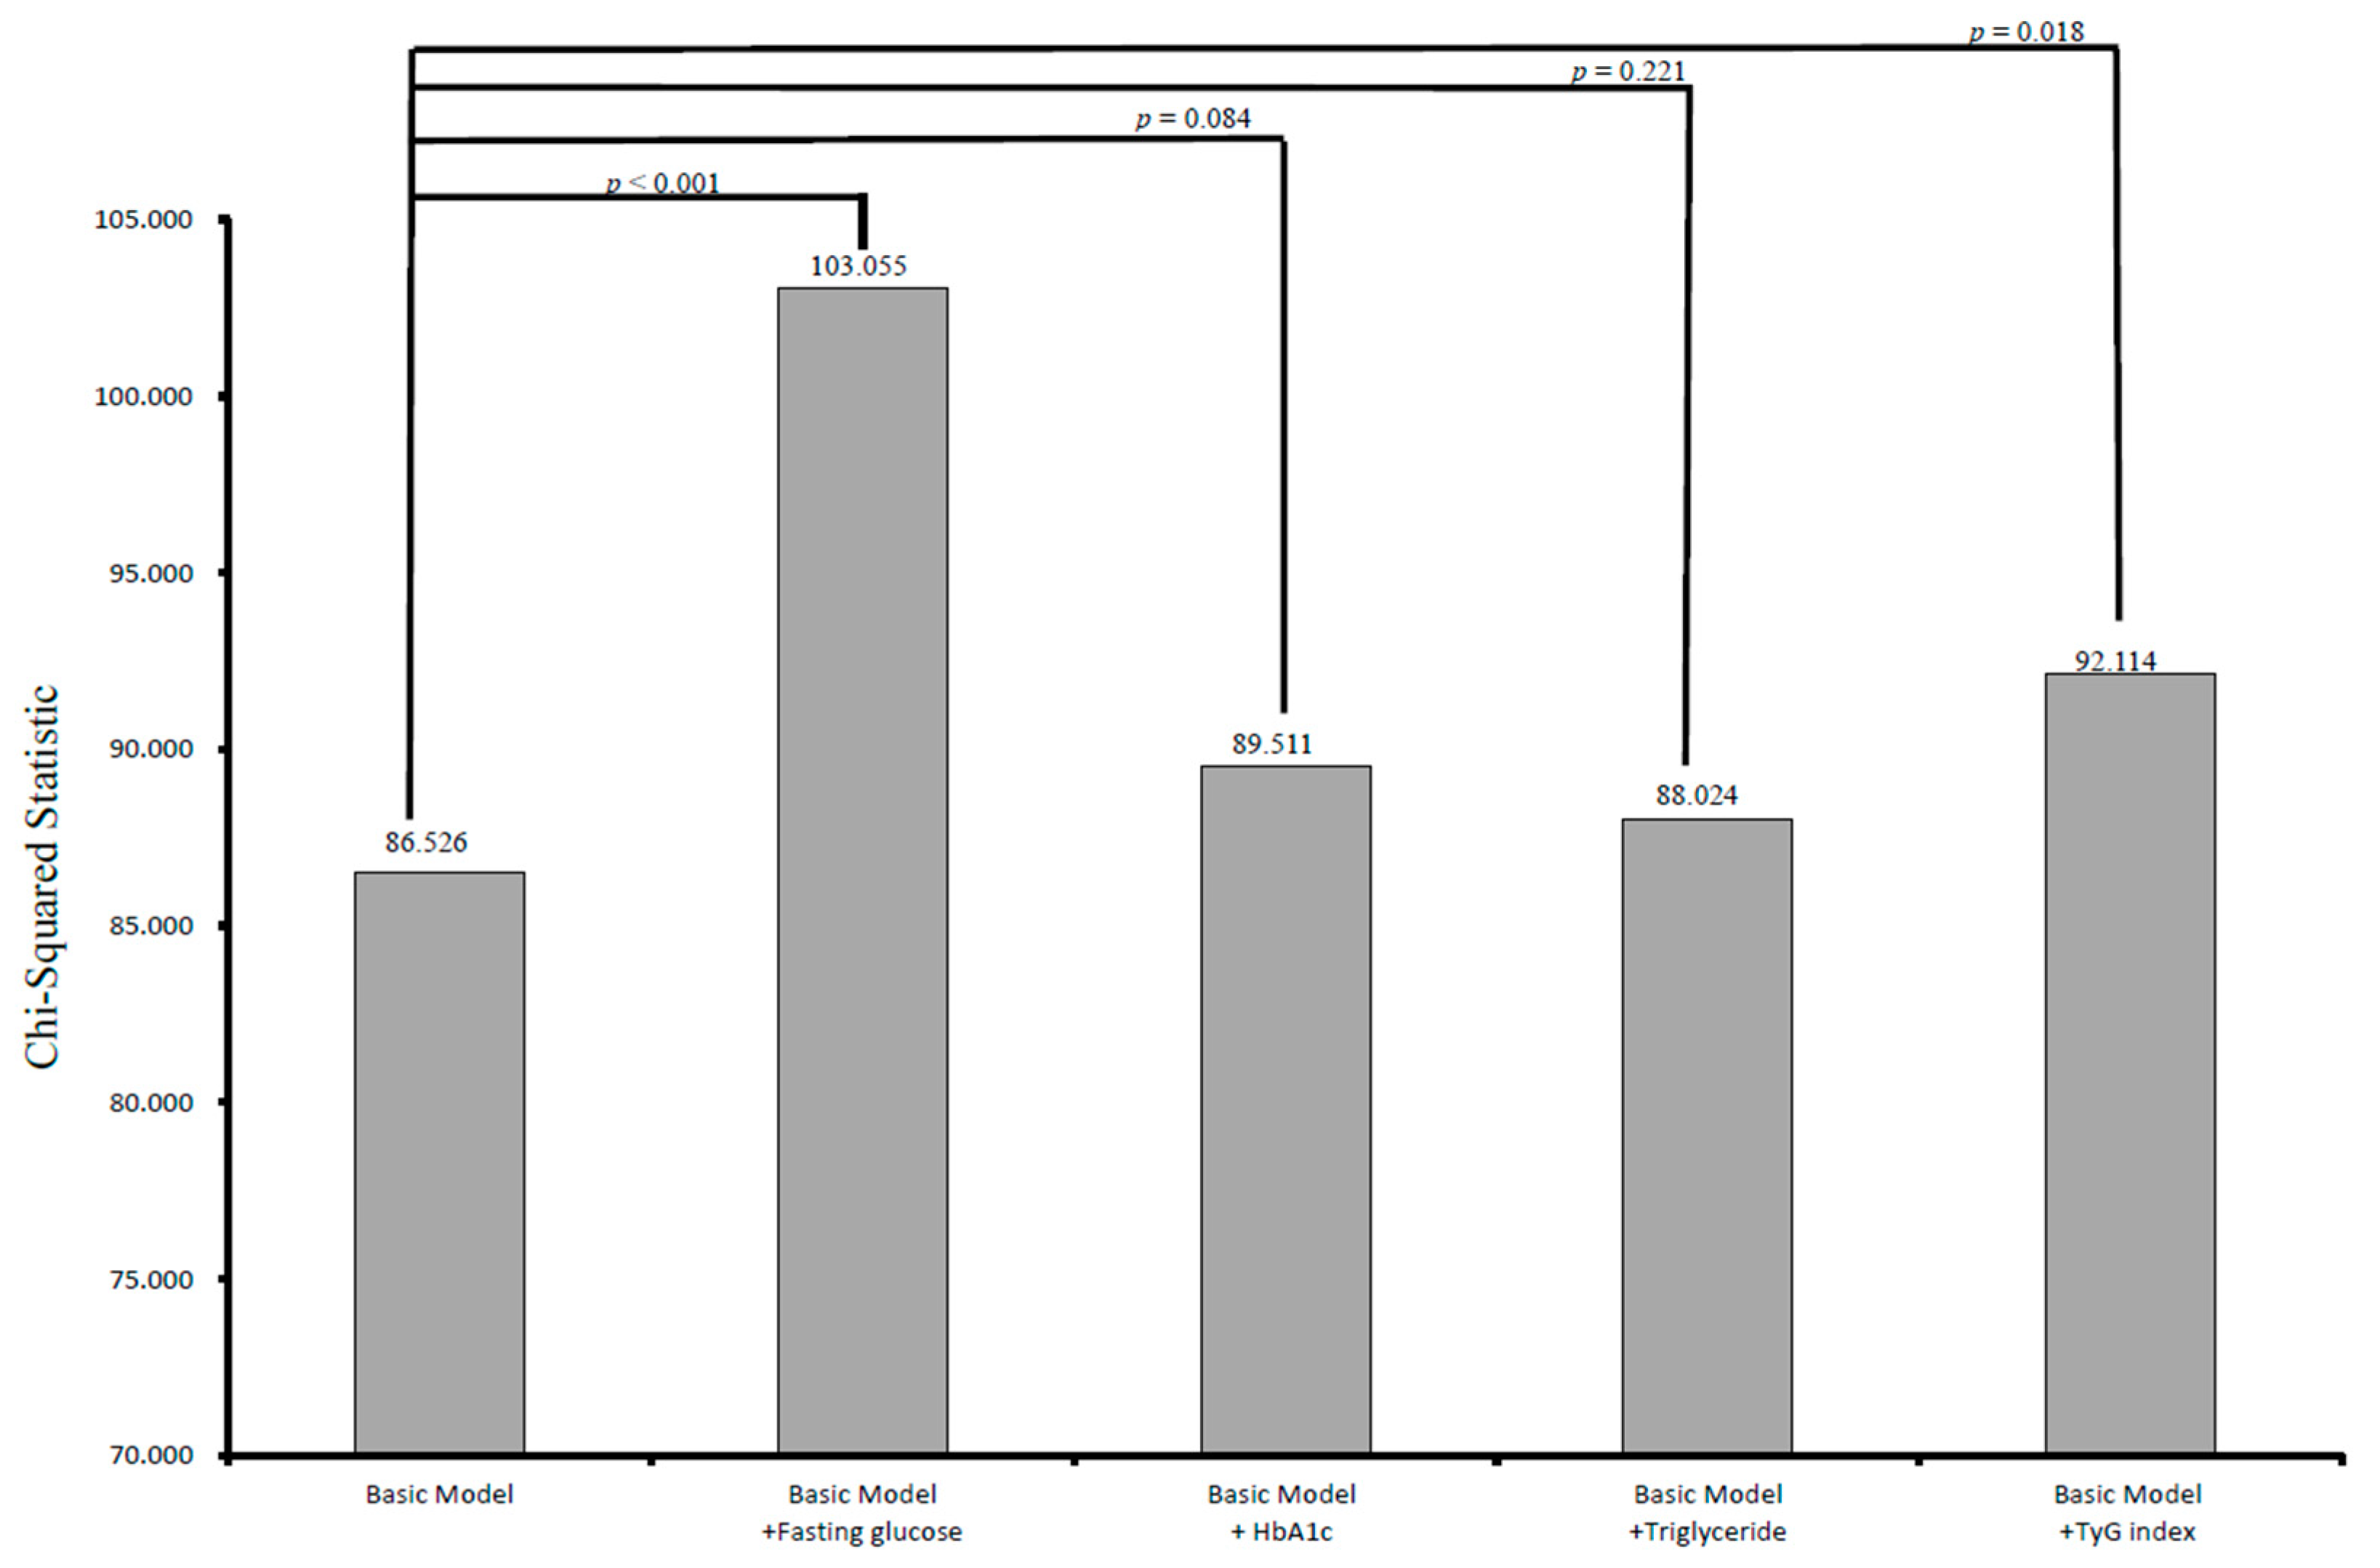
3.2. Incremental Values of Fasting Glucose, Hemoglobin A1c, Triglyceride, and the Tyg Index in Relation to CV Events

The incremental values of fasting glucose, hemoglobin A1c, triglycerides, and the TyG index in outcome prediction are shown in Figure 2. The basic model included significant variables (Table 2) except for fasting glucose and the TyG index, including age, sex, the prevalence of hypertension, neuropathy, nephropathy, hypoglycemia episode, fasting glucose, triglycerides, LDL-cholesterol, eGFR, the TyG index, UACR, and the use of medications (χ2 = 86.526). Adding fasting glucose to the basic model improved the predictive ability of progression to CV events (χ2 = 103.055, p < 0.001). In addition, adding the TyG index to the basic model resulted in a significant improvement in the prediction of CV events (χ2 = 92.114, p = 0.018). However, adding hemoglobin A1c and triglycerides to the basic model did not significantly improve the prediction of CV events (χ2 = 89.511, p = 0.084; χ2 = 88.024, p = 0.221, respectively).

4. Discussion

This study investigated the role of the TyG index in predicting CV events and compared the roles of fasting glucose, hemoglobin A1c, and the TyG index in predicting CV events in patients with type 2 DM over a follow-up period of 5.93 years. The results showed that fasting glucose and the TyG index were associated with increased CV events, but that hemoglobin A1c was not associated with increased CV events. Furthermore, our results showed that fasting glucose and the TyG index may improve the prognostic ability in patients with type 2 diabetes.
The first important finding in this study is that a higher level of fasting glucose was associated with an increased risk of CV events in the patients with DM and that it offered an additional prognostic benefit. An increasing number of studies have shown that abnormal glucose metabolism can accelerate the formation of atherosclerotic plaque, contributes to plaque rupture and thrombosis, and impair normal endothelial function. [18]. As mentioned in the Rotterdam Study which included elderly participants with a fasting blood glucose <110 mg/dL, those with higher blood glucose levels had higher levels of arterial stiffness [19]. Moreover, arterial endothelial dysfunction and intima-media thickening were associated with higher levels of glycemia (102–124 mg/dL) in the Chinese Atherosclerosis in the Aged and Young (CATHAY) study, [20], and Andreozzi et al. identified positive dose–response relationships between various CV disease biomarkers and fasting glucose levels [21]. Furthermore, in a study with a large multiethnic cohort, Anand et al. reported that the risk of CV events or death increased by 17% for each 1 mmol/L increase in fasting plasma glucose among individuals who were normoglycemic, those who had impaired fasting glucose or impaired glucose tolerance, and those newly diagnosed with diabetes [4]. In a meta-regression analysis of published data from 20 studies of 95,783 individuals followed for 12.4 years (range: 4–19 years), compared with a glucose level of 4.2 mmol/L (75 mg/dL), fasting and 2-h glucose levels of 6.1 mmol/dL (110 mg/dL) and 7.8 mmol/l (140 mg/dL) were associated with relative CV event risks of 1.33 and 1.58, respectively [5]. The results from the present study provide additional evidence of an association between an increased fasting plasma glucose level and the risk of CV events in patients with type 2 DM.
The second important finding in this study is that the TyG index was also associated with an increased risk of CV events and that it offered an additional prognostic benefit in predicting CV events in patients with type 2 diabetes. The TyG index includes both triglycerides and fasting glucose, and it has been demonstrated to be a good marker of insulin resistance and a predictor of type 2 DM [11,13]. In Korean adults, the TyG index has been associated with the progression of coronary artery calcification, which is considered to be a surrogate marker to predict the risk of CV disease [22]. In addition, a higher TyG index was significantly associated with an increased risk of developing CV disease in the vascular, metabolic CUN (VMCUN) cohort [23]. Other studies on the relationship between the TyG index and CV disease have also been reported. Sánchez-Íñigo et al. [23] reported a significant association between the TyG index and a high risk of developing CV disease in the VMCUN cohort, and that it was a good predictor for the Framingham model in these patients. However, Vega et al. [24] reported that the TyG index could only predict type 2 diabetes rather than CV disease compared to the ratio of triglycerides to high-density lipoprotein cholesterol. In addition, Mao et al. [16] investigated associations between the TyG index and CV outcomes in patients with non-ST-segment elevation acute coronary syndrome and found increased prevalence rates of glucose metabolism disorders, metabolic syndrome, and major adverse CV events with an increase in the TyG index. Pathophysiologically, insulin resistance is caused by GLUT4 reducing glycogen synthesis in skeletal muscles and is also influenced by circulating fatty acid levels. This oxidation impairment and utilization of fatty acids results in the flow of free fatty acids from adipose to non-adipose tissues and worsens many of the basic metabolic derangements that characterize insulin resistance, thereby increasing the risk of CV disease [23,25,26]. Insulin resistance as estimated by the homeostasis model assessment index (HOMA-index) has been shown to be able to predict the progression of atherosclerotic plaques in patients with coronary heart disease both with and without diabetes [27]. Furthermore, prospective data from the Verona Diabetes Complications Study showed that the HOMA index is an independent predictor of CV disease in patients with type 2 diabetes [28].
The third important finding of this study is that an increased level of hemoglobin A1c was not associated with increased CV events in our cohort of diabetic patients. This finding is consistent with a previous study that showed no association between hemoglobin A1c and the risk of new CV events during follow-up [7]. Trials using intensive blood glucose control have not shown to improved CV disease risk in populations with type 2 DM; however, in the general population, there are inconsistent reports about the effects of maintaining lower glucose levels. Some may assume that low glycemic values are associated with increased glycemic variability, which is in turn is associated with higher CV disease risk. It has also been proposed that fasting glucose and hemoglobin A1c in the lower levels have a different relationship with CV disease and mortality. The Action in Diabetes and Vascular Disease: Preterax and Diamicron MR Controlled Evaluation (ADVANCE) study reported that visit-to-visit variability in both hemoglobin A1c and fasting glucose could predict the future development of macrovascular and microvascular events and all-cause mortality. Furthermore, increases in the variability of hemoglobin A1c and fasting glucose in the first two years were associated with increased risks of subsequent vascular events and mortality in diabetic patients [29]. In the Multi-Ethnic Study of Atherosclerosis (MESA) study, 4990 participants with low baseline glucose and hemoglobin A1c were positively associated with mortality, whereas low mean fasting glucose and hemoglobin A1c were significantly associated with the incidence of CV disease and mortality. Glucose variability, however, did not explain CV disease risk beyond the mean glucose levels, but long-standing low fasting glucose and hemoglobin A1c may be better indicators of risk rather than a single low measurement [30]. Recent studies also mentioned the J-shaped association between hemoglobin A1c and the risk of all-cause mortality among men and women with type 2 diabetes. Both high and low levels of hemoglobin A1c were associated with an increased risk of all-cause mortality [31,32]. These findings are similar to those of another study using the Veterans Affairs Diabetes Trial (VADT), which reported that variability in fasting glucose was significantly associated with CV disease in patients receiving intensive glycemic control even after adjusting for other risk factors. However, the level of hemoglobin A1c was not associated with CV disease after adjusting for multiple baseline risk factors [33]. Although findings of increased predictive value with visit-to-visit glucose variability with regards to the complications of diabetes have been inconclusive [33,34,35], a prior review and meta-analysis reported positive associations between hemoglobin A1c variability and adverse outcomes including diabetic retinopathy and neuropathy, renal disease, CV macrovascular events, and death in patients with diabetes [36].
The fourth important finding of this study is that after multivariable stepwise analysis, a high level of triglycerides was not associated with increased CV events. In a prospective cohort of women in the United States who were healthy, it was initially observed that higher non-fasting triglyceride levels were strongly associated with an increased risk of future CV events [26]. In Asian populations, a recent systemic review found that triglyceride is an independent but significant risk factor for coronary heart disease, but is not a significant risk factor for stroke or peripheral arterial disease [37]. The Fenofibrate Intervention and Event Lowering in Diabetes (FIELD) trial was designed to evaluate the effect of fenofibrate (n = 4895) compared to placebo (n = 4900) on CV events over a 5-year follow-up period among men and women (50~75 years of age) with type 2 DM [38]. The results revealed that plasma triglycerides, LDL-cholesterol, and high-density lipoprotein cholesterol levels responded favorably to fenofibrate treatment, but that there was no significant difference between the treatment groups in the primary outcome of coronary events (coronary heart disease, death, or nonfatal myocardial infarction). In addition, there was a non-significant reduction of 11% between the patients receiving fenofibrate compared to those receiving a placebo, which corresponded to a significant 24% reduction in nonfatal myocardial infarction and a non-significant increase in coronary heart disease mortality. Whether triglycerides are an independent risk factor for coronary artery disease remains controversial.
Another important finding of this study is that fasting glucose and the TyG index were significantly associated with increased CV events in Model 1 and 2 (Table 3), but that triglycerides were not. Further, we added the TyG index in Model 1 and found that fasting glucose was significantly correlated with increased CV events, but that the TyG index was not. Moreover, the predictive power of fasting glucose for CV events was stronger than the TyG index, which is influenced by both fasting glucose and triglycerides. Therefore, our results indicate that adding triglycerides as a surrogate marker may weaken the relationship between the TyG index and CV events. Thus, we suggest that fasting glucose is the most important marker to predict the risk of CV events in patients with type 2 DM.
Limited studies have explored the role of the TyG index on CV outcomes in diabetes. The strength in this study is that it is the first study to investigate the comparison of the effects between fasting glucose, hemoglobin A1c, and the TyG index on CV events in a large number of patients with type 2 DM over a follow-up period of 5.93 years. There are several limitations to this study. First, this was an observational study, and therefore there were individual variations in the number and frequency of triglyceride, hemoglobin A1c, and fasting glucose measurements. To minimize this, patients who were followed for <6 months and had fewer than three measurements during the follow-up period were excluded. Second, cardiac autonomic neuropathy has been reported to potentially be a predisposing factor for CV events [39]. However, we did not evaluate heart rate variability in this study, and therefore could not analyze the effect of cardiac autonomic neuropathy on CV events, although we did include a diagnosis of diabetic neuropathy (according to ICD-9-CM code) in the analysis. Third, we validated these comorbidities using ICD-9-CM code. However, if individuals with type 2 DM visited the KMUH, but ultimately were diagnosed with a CV event or condition at another location, this would cause an underestimation of the disease risk. In addition, we did not calculate the insulin resistance index with the HOMA index, so we could not compare the role of the TyG index and HOMA-index in this study. Lastly, we did not evaluate the effect of medications on CV events, as this was not the aim of the study. The positive association between the use of medications and CV events may be due to selection bias.

5. Conclusions

In conclusion, higher fasting glucose and a high TyG index were associated with an increased risk of CV events among our study cohort with type 2 DM, but hemoglobin A1c was not. Adding fasting glucose and the TyG index to the basic model offered an additional benefit in the prediction of progression to CV events. These findings support the potential role of fasting glucose and the TyG index as a major predictor of CV events, independently of hemoglobin A1c, in patients with type 2 DM. Assessments of fasting glucose and TyG index may be beneficial to allow for early stratification and interventions to prevent CV events.

Author Contributions

W.-Y.S., S.-C.C., Y.-T.H., J.-C.H., P.-Y.W., W.-H.H. and M.-Y.L. conceived and designed the experiments; W.-Y.S., S.-C.C., Y.-T.H. and M.-Y.L. performed the experiments; S.-C.C., Y.-T.H. and M.-Y.L. analyzed the data; W.-Y.S., S.-C.C., Y.-T.H., J.-C.H., P.-Y.W., W.-H.H. and M.-Y.L. contributed reagents/materials/analysis tools; W.-Y.S., S.-C.C. and M.-Y.L. wrote the paper.

Funding

This research was funded by the grant from Kaohsiung Municipal Hsiao-Kang Hospital (grant number: kmhk-107-036), Kaohsiung Medical University, Kaohsiung, Taiwan.

Conflicts of Interest

The authors declare no conflict of interest.

References

  1. Cho, N.H.; Shaw, J.E.; Karuranga, S.; Huang, Y.; da Rocha Fernandes, J.D.; Ohlrogge, A.W.; Malanda, B. IDF Diabetes Atlas: Global estimates of diabetes prevalence for 2017 and projections for 2045. Diabetes Res. Clin. Pract. 2018, 138, 271–281. [Google Scholar] [CrossRef] [PubMed]
  2. Seshasai, S.R.; Kaptoge, S.; Thompson, A.; Di Angelantonio, E.; Gao, P.; Sarwar, N.; Whincup, P.H.; Mukamal, K.J.; Gillum, R.F.; Holme, I.; et al. Emerging Risk Factors Collaboration, Diabetes mellitus, fasting glucose, and risk of cause-specific death. N. Engl. J. Med. 2011, 364, 829–841. [Google Scholar]
  3. Sarwar, N.; Gao, P.; Seshasai, S.R.; Gobin, R.; Kaptoge, S.; Di Angelantonio, E.; Ingelsson, E.; Lawlor, D.A.; Selvin, E.; Stampfer, M.; et al. Diabetes mellitus, fasting blood glucose concentration, and risk of vascular disease: A collaborative meta-analysis of 102 prospective studies. Lancet 2010, 375, 2215–2222. [Google Scholar] [PubMed]
  4. Anand, S.S.; Dagenais, G.R.; Mohan, V.; Diaz, R.; Probstfield, J.; Freeman, R.; Shaw, J.; Lanas, F.; Avezum, A.; Budaj, A.; et al. Glucose levels are associated with cardiovascular disease and death in an international cohort of normal glycaemic and dysglycaemic men and women: The EpiDREAM cohort study. Eur. J. Prev. Cardiol. 2012, 19, 755–764. [Google Scholar] [CrossRef] [PubMed]
  5. Coutinho, M.; Gerstein, H.C.; Wang, Y.; Yusuf, S. The relationship between glucose and incident cardiovascular events. A metaregression analysis of published data from 20 studies of 95,783 individuals followed for 12.4 years. Diabetes Care 1999, 22, 233–240. [Google Scholar] [CrossRef] [PubMed]
  6. Schottker, B.; Rathmann, W.; Herder, C.; Thorand, B.; Wilsgaard, T.; Njølstad, I.; Siganos, G.; Mathiesen, E.B.; Saum, K.U.; Peasey, A.; et al. HbA1c levels in non-diabetic older adults—No J-shaped associations with primary cardiovascular events, cardiovascular and all-cause mortality after adjustment for confounders in a meta-analysis of individual participant data from six cohort studies. BMC Med. 2016, 14, 26. [Google Scholar] [CrossRef]
  7. Bots, S.H.; van der Graaf, Y.; Nathoe, H.M.; de Borst, G.J.; Kappelle, J.L.; Visseren, F.L.; Westerink, J.; SMART Study Group. The influence of baseline risk on the relation between HbA1c and risk for new cardiovascular events and mortality in patients with type 2 diabetes and symptomatic cardiovascular disease. Cardiovasc. Diabetol. 2016, 15, 101. [Google Scholar] [CrossRef]
  8. Cavero-Redondo, I.; Peleteiro, B.; Álvarez-Bueno, C.; Rodriguez-Artalejo, F.; Martínez-Vizcaíno, V. Glycated haemoglobin A1c as a risk factor of cardiovascular outcomes and all-cause mortality in diabetic and non-diabetic populations: A systematic review and meta-analysis. BMJ Open 2017, 7, e015949. [Google Scholar] [CrossRef]
  9. Eckel, R.H.; Grundy, S.M.; Zimmet, P.Z. The metabolic syndrome. Lancet 2005, 365, 1415–1428. [Google Scholar] [CrossRef]
  10. Unger, G.; Benozzi, S.F.; Perruzza, F.; Pennacchiotti, G.L. Triglycerides and glucose index: A useful indicator of insulin resistance. Endocrinol. Nutr. 2014, 61, 533–540. [Google Scholar] [CrossRef]
  11. Navarro-González, D.; Sánchez-Íñigo, L.; Pastrana-Delgado, J.; Fernández-Montero, A.; Martinez, J.A. Triglyceride–glucose index (TyG index) in comparison with fasting plasma glucose improved diabetes prediction in patients with normal fasting glucose: The Vascular-Metabolic CUN cohort. Prev. Med. 2016, 86, 99–105. [Google Scholar] [CrossRef] [PubMed]
  12. Moon, S.; Park, J.S.; Ahn, Y. The Cut-off Values of Triglycerides and Glucose Index for Metabolic Syndrome in American and Korean Adolescents. J. Korean. Med. Sci. 2017, 32, 427–433. [Google Scholar] [CrossRef] [PubMed]
  13. Zhang, M.; Wang, B.; Liu, Y.; Sun, X.; Luo, X.; Wang, C.; Li, L.; Zhang, L.; Ren, Y.; Zhao, Y.; et al. Cumulative increased risk of incident type 2 diabetes mellitus with increasing triglyceride glucose index in normal-weight people: The Rural Chinese Cohort Study. Cardiovasc. Diabetol. 2017, 16, 30. [Google Scholar] [CrossRef] [PubMed]
  14. Lee, S.B.; Ahn, C.W.; Lee, B.K.; Kang, S.; Nam, J.S.; You, J.H.; Kim, M.J.; Kim, M.K.; Park, J.S. Association between triglyceride glucose index and arterial stiffness in Korean adults. Cardiovasc. Diabetol. 2018, 17, 41. [Google Scholar] [CrossRef]
  15. Kim, M.K.; Ahn, C.W.; Kang, S.; Nam, J.S.; Kim, K.R.; Park, J.S. Relationship between the triglyceride glucose index and coronary artery calcification in Korean adults. Cardiovasc. Diabetol. 2017, 16, 108. [Google Scholar] [CrossRef]
  16. Mao, Q.; Zhou, D.; Li, Y.; Wang, Y.; Xu, S.C.; Zhao, X.H. The Triglyceride-Glucose Index Predicts Coronary Artery Disease Severity and Cardiovascular Outcomes in Patients with Non-ST-Segment Elevation Acute Coronary Syndrome. Dis. Markers 2019, 2019, 6891537. [Google Scholar] [CrossRef]
  17. Guerrero-Romero, F.; Simental-Mendia, L.E.; Gonzalez-Ortiz, M.; Martínez-Abundis, E.; Ramos-Zavala, M.G.; Hernández-González, S.O.; Jacques-Camarena, O.; Rodríguez-Morán, M. The product of triglycerides and glucose, a simple measure of insulin sensitivity. Comparison with the euglycemic-hyperinsulinemic clamp. J. Clin. Endocrinol. Metab. 2010, 95, 3347–3351. [Google Scholar] [CrossRef]
  18. Quillard, T.; Franck, G.; Mawson, T.; Folco, E.; Libby, P. Mechanisms of erosion of atherosclerotic plaques. Curr. Opin. Lipidol. 2017, 28, 434–441. [Google Scholar] [CrossRef]
  19. Van Popele, N.M.; Elizabeth Hak, A.; Mattace-Raso, F.U.; Bots, M.L.; van der Kuip, D.A.; Reneman, R.S.; Hoeks, A.P.; Hofman, A.; Grobbee, D.E.; Witteman, J.C. Impaired fasting glucose is associated with increased arterial stiffness in elderly people without diabetes mellitus: The Rotterdam Study. J. Am. Geriatr. Soc. 2006, 54, 397–404. [Google Scholar] [CrossRef]
  20. Thomas, G.N.; Chook, P.; Qiao, M.; Huang, X.S.; Leong, H.C.; Celermajer, D.S.; Woo, K.S. Deleterious impact of “high normal” glucose levels and other metabolic syndrome components on arterial endothelial function and intima-media thickness in apparently healthy Chinese subjects: The CATHAY study. Arterioscler. Thromb. Vasc. Biol. 2004, 24, 739–743. [Google Scholar] [CrossRef]
  21. Andreozzi, F.; Succurro, E.; Mancuso, M.R.; Perticone, M.; Sciacqua, A.; Perticone, F.; Sesti, G. Metabolic and cardiovascular risk factors in subjects with impaired fasting glucose: The 100 versus 110 mg/dL threshold. Diabetes Metab. Res. Rev. 2007, 23, 547–550. [Google Scholar] [CrossRef] [PubMed]
  22. Park, K.; Ahn, C.W.; Lee, S.B.; Kang, S.; Nam, J.S.; Lee, B.K.; Kim, J.H.; Park, J.S. Elevated TyG Index Predicts Progression of Coronary Artery Calcification. Diabetes Care 2019, 42, 1569–1573. [Google Scholar] [CrossRef] [PubMed]
  23. Sanchez-Inigo, L.; Navarro-Gonzalez, D.; Fernandez-Montero, A.; Pastrana-Delgado, J.; Martinez, J.A. The TyG index may predict the development of cardiovascular events. Eur. J. Clin. Investig. 2016, 46, 189–197. [Google Scholar] [CrossRef] [PubMed]
  24. Vega, G.L.; Barlow, C.E.; Grundy, S.M.; Leonard, D.; DeFina, L.F. Triglyceride-to-high-density-lipoprotein-cholesterol ratio is an index of heart disease mortality and of incidence of type 2 diabetes mellitus in men. J. Investig. Med. 2014, 62, 345–349. [Google Scholar] [CrossRef]
  25. Simental-Mendia, L.E.; Rodriguez-Moran, M.; Guerrero-Romero, F. The product of fasting glucose and triglycerides as surrogate for identifying insulin resistance in apparently healthy subjects. Metab. Syndr. Relat. Disord. 2008, 6, 299–304. [Google Scholar] [CrossRef]
  26. Bansal, S.; Buring, J.E.; Rifai, N.; Mora, S.; Sacks, F.M.; Ridker, P.M. Fasting Compared With Nonfasting Triglycerides and Risk of Cardiovascular Events in Women. JAMA 2007, 298, 309–316. [Google Scholar] [CrossRef]
  27. An, X.; Yu, D.; Zhang, R.; Zhu, J.; Du, R.; Shi, Y.; Xiong, X. Insulin resistance predicts progression of de novo atherosclerotic plaques in patients with coronary heart disease: A one-year follow-up study. Cardiovascu. Diabetol. 2012, 11, 71. [Google Scholar] [CrossRef]
  28. Bonora, E.; Formentini, G.; Calcaterra, F.; Lombardi, S.; Marini, F.; Zenari, L.; Saggiani, F.; Poli, M.; Perbellini, S.; Raffaelli, A.; et al. HOMA-estimated insulin resistance is an independent predictor of cardiovascular disease in type 2 diabetic subjects: Prospective data from the Verona Diabetes Complications Study. Diabetes Care 2002, 25, 1135–1141. [Google Scholar] [CrossRef]
  29. Hirakawa, Y.; Arima, H.; Zoungas, S.; Ninomiya, T.; Cooper, M.; Hamet, P.; Mancia, G.; Poulter, N.; Harrap, S.; Woodward, M.; et al. Impact of visit-to-visit glycemic variability on the risks of macrovascular and microvascular events and all-cause mortality in type 2 diabetes: The ADVANCE trial. Diabetes Care 2014, 37, 2359–2365. [Google Scholar] [CrossRef]
  30. Mongraw-Chaffin, M.; Bertoni, A.G.; Golden, S.H.; Mathioudakis, N.; Sears, D.D.; Szklo, M.; Anderson, C.A.M. Association of Low Fasting Glucose and HbA1c With Cardiovascular Disease and Mortality: The MESA Study. J. Endocr. Soc. 2019, 3, 892–901. [Google Scholar] [CrossRef]
  31. Arnold, L.W.; Wang, Z. The HbA1c and all-cause mortality relationship in patients with type 2 diabetes is J-shaped: A meta-analysis of observational studies. Rev. Diabet. Stud. 2014, 11, 138–152. [Google Scholar] [CrossRef] [PubMed]
  32. Li, W.; Katzmarzyk, P.T.; Horswell, R.; Wang, Y.; Johnson, J.; Hu, G. HbA1c and all-cause mortality risk among patients with type 2 diabetes. Int. J. Cardiol. 2016, 202, 490–496. [Google Scholar] [CrossRef] [PubMed] [Green Version]
  33. Zhou, J.J.; Schwenke, D.C.; Bahn, G.; Reaven, P. Glycemic Variation and Cardiovascular Risk in the Veterans Affairs Diabetes Trial. Diabetes Care 2018, 41, 2187. [Google Scholar] [CrossRef] [PubMed] [Green Version]
  34. Lachin, J.M.; Genuth, S.; Nathan, D.M.; Zinman, B.; Rutledge, B.N. Effect of glycemic exposure on the risk of microvascular complications in the diabetes control and complications trial—Revisited. Diabetes 2008, 57, 995–1001. [Google Scholar] [CrossRef] [Green Version]
  35. Kilpatrick, E.S.; Rigby, A.S.; Atkin, S.L. The effect of glucose variability on the risk of microvascular complications in type 1 diabetes. Diabetes Care 2006, 29, 1486–1490. [Google Scholar] [CrossRef] [Green Version]
  36. Gorst, C.; Kwok, C.S.; Aslam, S.; Buchan, I.; Kontopantelis, E.; Myint, P.K.; Heatlie, G.; Loke, Y.; Rutter, M.K.; Mamas, M.A. Long-term Glycemic Variability and Risk of Adverse Outcomes: A Systematic Review and Meta-analysis. Diabetes Care 2015, 38, 2354–2369. [Google Scholar] [CrossRef] [Green Version]
  37. Chen, A.H.; Tseng, C.H. The role of triglyceride in cardiovascular disease in asian patients with type 2 diabetes—A systematic review. Rev. Diabet. Stud. 2013, 10, 101–109. [Google Scholar] [CrossRef] [Green Version]
  38. Scott, R.; Best, J.; Forder, P.; Taskinen, M.R.; Simes, J.; Barter, P.; Keech, A.; FIELD Study Investigators. Fenofibrate Intervention and Event Lowering in Diabetes (FIELD) study: Baseline characteristics and short-term effects of fenofibrate [ISRCTN64783481]. Cardiovasc. Diabetol. 2005, 4, 13. [Google Scholar]
  39. Gerstein, H.C.; Miller, M.E.; Genuth, S.; Ismail-Beigi, F.; Buse, J.B.; Goff, D.C., Jr.; Probstfield, J.L.; Cushman, W.C.; Ginsberg, H.N.; Bigger, J.T.; et al. Long-term effects of intensive glucose lowering on cardiovascular outcomes. N. Engl. J. Med. 2011, 364, 818–828. [Google Scholar]
Figure 1. Flow chart of study participants for the evaluation of the effects of fasting glucose on cardiovascular events in type 2 diabetes.
Nutrients 11 02838 g001
Figure 2. Comparison of the prediction power of addition of fasting glucose, hemoglobin A1c, triglyceride, and the TyG index to a basic model in the prediction of increased cardiovascular events. Addition of fasting glucose and TyG index resulted in a significant improvement in the prediction of increased cardiovascular events (p < 0.001 and p = 0.018, respectively), but hemoglobin A1c and triglyceride (p = 0.084 and p = 0.221, respectively) did not.
Nutrients 11 02838 g002
Table 1. Clinical characteristics of the study patients.
CharacteristicsAll (n = 3524)
Age (year)61.68 ± 11.90
Male gender (%)49.1
Hypertension (%)69.7
Dyslipidemia (%)69.8
Retinopathy (%)5.4
Neuropathy (%)13.4
Nephropathy (%)5.0
Coronary artery disease (%)1.8
Stroke (%)0.4
Peripheral artery disease (%)0.1
DM duration > 5 years (%)87.5
Hypoglycemia episode (%)3.6
Laboratory parameters
 Fasting glucose (mg/dL)154.83 ± 58.53
 Hemoglobin A1c (%)7.85 ± 1.76
 Triglyceride (mg/dL)150.8 ± 217.81
 Total cholesterol (mg/dL)179.37 ± 44.00
 HDL-cholesterol (mg/dL)41.16 ± 13.04
 LDL-cholesterol (mg/dL)104.08 ± 33.86
 eGFR (mL/min/1.73 m2)87.66 ± 35.89
 TyG index 9.09 ± 0.73
 UACR (mg/g)149.37 ± 531.69
Medications
 ACEI and/or ARB use (%)65.6
 Anti-hypertensive drugs use (%)53.6
 Aspirin use (%)33.2
 Statin and/or fibrate use (%)70.7
 Sulfonyurea use (%)72.8
 Metformin use (%)82.2
 Meglitinides use (%)13.3
 Pioglitazone use (%)36.3
 Acarbose use (%)20.4
 DPP-4 inhibitor use (%)34.4
 Insulin use (%)25.9
CV events (%)6.1
Follow-up time (year)5.93 ± 1.14
Abbreviations: DM, diabetes mellitus; HDL, high-density lipoprotein; LDL, low-density lipoprotein; eGFR, estimated glomerular filtration rate; TyG, triglyceride-glucose; UACR, urine albumin-creatinine ratio; ACEI, angiotensin-converting enzyme inhibitor; ARB, angiotensin II receptor blocker; DPP-4, Dipeptidyl peptidase-4 inhibitor; CV, cardiovascular. The TyG index was calculated as log (fasting triglyceride (mg/dL) × fasting glucose (mg/dL)/2).
Table 2. Determinants for cardiovascular events using the Cox proportional hazards model (univariable analysis).
ParametersUnivariable
HR (95% CI)p
Age (per 1 year)1.035 (1.022–1.047)<0.001
Male gender 1.422 (1.084–1.864)0.011
Hypertension 2.435 (1.680–3.528)<0.001
Dyslipidemia 1.057 (0.786–1.420)0.715
Retinopathy 1.615 (0.997–2.618)0.052
Neuropathy 1.425 (1.004–2.023)0.048
Nephropathy1.924 (1.201–3.082)0.007
Coronary artery disease8.524 (5.528–13.144)<0.001
Stroke2.924 (0.727–11.767)0.131
Peripheral artery disease17.399 (5.566–54.390)<0.001
DM duration > 5 years 1.508 (0.930–2.445)0.096
Hypoglycemia episode 2.238 (1.345–3.724)0.002
Laboratory parameters
 Fasting glucose (per 1 mg/dL)1.003 (1.001–1.005)0.001
 Hemoglobin A1c (per 1%)1.069 (0.996–1.146)0.064
 Triglyceride (log per 1 mg/dL)1.387 (1.125–1.709)0.002
 Total cholesterol (per 1 mg/dL)1.001 (0.999–1.004)0.310
 HDL-cholesterol (per 1 mg/dL)0.971 (0.958–0.983)<0.001
 LDL-cholesterol (per 1 mg/dL)0.999 (0.995–1.004)0.776
 eGFR (per 1 mL/min/1.73 m2)0.979 (0.975–0.984)<0.001
 TyG index (per 1)1.342 (1.136–1.586)<0.001
 UACR (per 10 mg/g)1.005 (1.003–1.006)<0.001
Medications
 ACEI and/or ARB use 2.838 (1.967–4.094)<0.001
 Anti-hypertensive drugs use 3.774 (2.685–5.304)<0.001
 Aspirin use 3.066 (2.334–4.027)<0.001
 Statin and/or fibrate use1.664 (1.191–2.325)0.003
 Sulfonyurea use0.891 (0.664–1.196)0.443
 Metformin use 0.514 (0.382–0.690)<0.001
 Meglitinides use 1.921 (1.393–2.649)<0.001
 Pioglitazone use 0.995 (0.753–1.315)0.974
 Acarbose use1.683 (1.256–2.255)<0.001
 DPP-4 inhibitor use 0.792 (0.590–1.062)0.120
 Insulin use 2.450 (1.872–3.207)<0.001
Values expressed as hazard ratios and 95% confidence interval (CI). Abbreviations are the same as in Table 1.
Table 3. Determinants for cardiovascular events using the Cox proportional hazards model (multivariable stepwise analysis).
ModelMultivariable (Stepwise)
HR (95% CI)p
Model 1
 Age (per 1 year)1.028 (1.004–1.053)0.021
 Coronary artery disease3.338 (1.084–10.273)0.036
 Peripheral artery disease12.362 (1.171–130.56)0.037
 Fasting glucose (per 1 mg/dL)1.007 (1.005–1.010)<0.001
 eGFR (per 1 mL/min/1.73 m2)0.989 (0.981–0.998)0.012
 UACR (per 10 mg/g)1.003 (1.001–1.005)0.004
 Anti-hypertensive drugs use 2.185 (1.177–4.056)0.013
 Aspirin use 2.238 (1.418–3.532)<0.001
Model 2
 Age (per 1 year)1.040 (1.017–1.065)<0.001
 Coronary artery disease3.143 (1.024–9.648)0.045
 Stroke6.189 (1.448–26.457)0.014
 Peripheral artery disease22.958 (2.317–227.45)0.007
 TyG index (per 1)1.521 (1.141–2.027)0.004
 UACR (per 10 mg/g)1.003 (1.002–1.005)<0.001
 Anti-hypertensive drugs use 2.358 (1.272–4.372)0.007
 Aspirin use 2.022 (1.276–3.206)0.003
 Insulin use2.031 (1.273–3.239)0.003
Values expressed as hazard ratios (HR) and 95% confidence intervals (CI). Abbreviations are the same as in Table 1. Multivariable stepwise Model 1: adjusted for hemoglobin A1c and significant variables in the univariable analysis except for the TyG index. Multivariable stepwise Model 2: adjusted for hemoglobin A1c and significant variables in the univariable analysis except fasting glucose.
Table 4. Determinants for cardiovascular events using the Cox proportional hazards model (multivariable stepwise analysis) after excluding a history of cardiovascular events (n = 82).
ModelMultivariable (Stepwise)
HR (95% CI)p
Model 1
 Fasting glucose (per 1 mg/dL)1.003 (1.001–1.005)0.004
 eGFR (per 1 mL/min/1.73 m2)0.983 (0.978–0.988)<0.001
 Anti-hypertensive drugs use1.992 (1.378–2.880)<0.001
 Aspirin use2.382 (1.769–3.209)<0.001
Model 2
 eGFR (per 1 mL/min/1.73 m2)0.985 (0.980–0.990)<0.001
 TyG index (per 1)1.228 (1.015–1.486)0.035
 Anti-hypertensive drugs use1.911 (1.324–2.759)<0.001
 Aspirin use1.800 (1.329–2.437)<0.001
 Insulin use2.306 (1.711–3.107)<0.001
Values expressed as hazard ratios (HR) and 95% confidence intervals (CI). Abbreviations are the same as in Table 1. Multivariable stepwise Model 1: adjusted for hemoglobin A1c and significant variables in the univariable analysis except for the TyG index. Multivariable stepwise Model 2: adjusted for hemoglobin A1c and significant variables in the univariable analysis except fasting glucose.

