Soy Products Ameliorate Obesity-Related Anthropometric Indicators in Overweight or Obese Asian and Non-Menopausal Women: A Meta-Analysis of Randomized Controlled Trials
Abstract
1. Introduction
2. Materials and Methods
2.1. Data Sources and Search Strategy
2.2. Criteria of Inclusion
2.3. Data Extraction and Quality Assessment
2.4. Statistical Analysis
3. Results
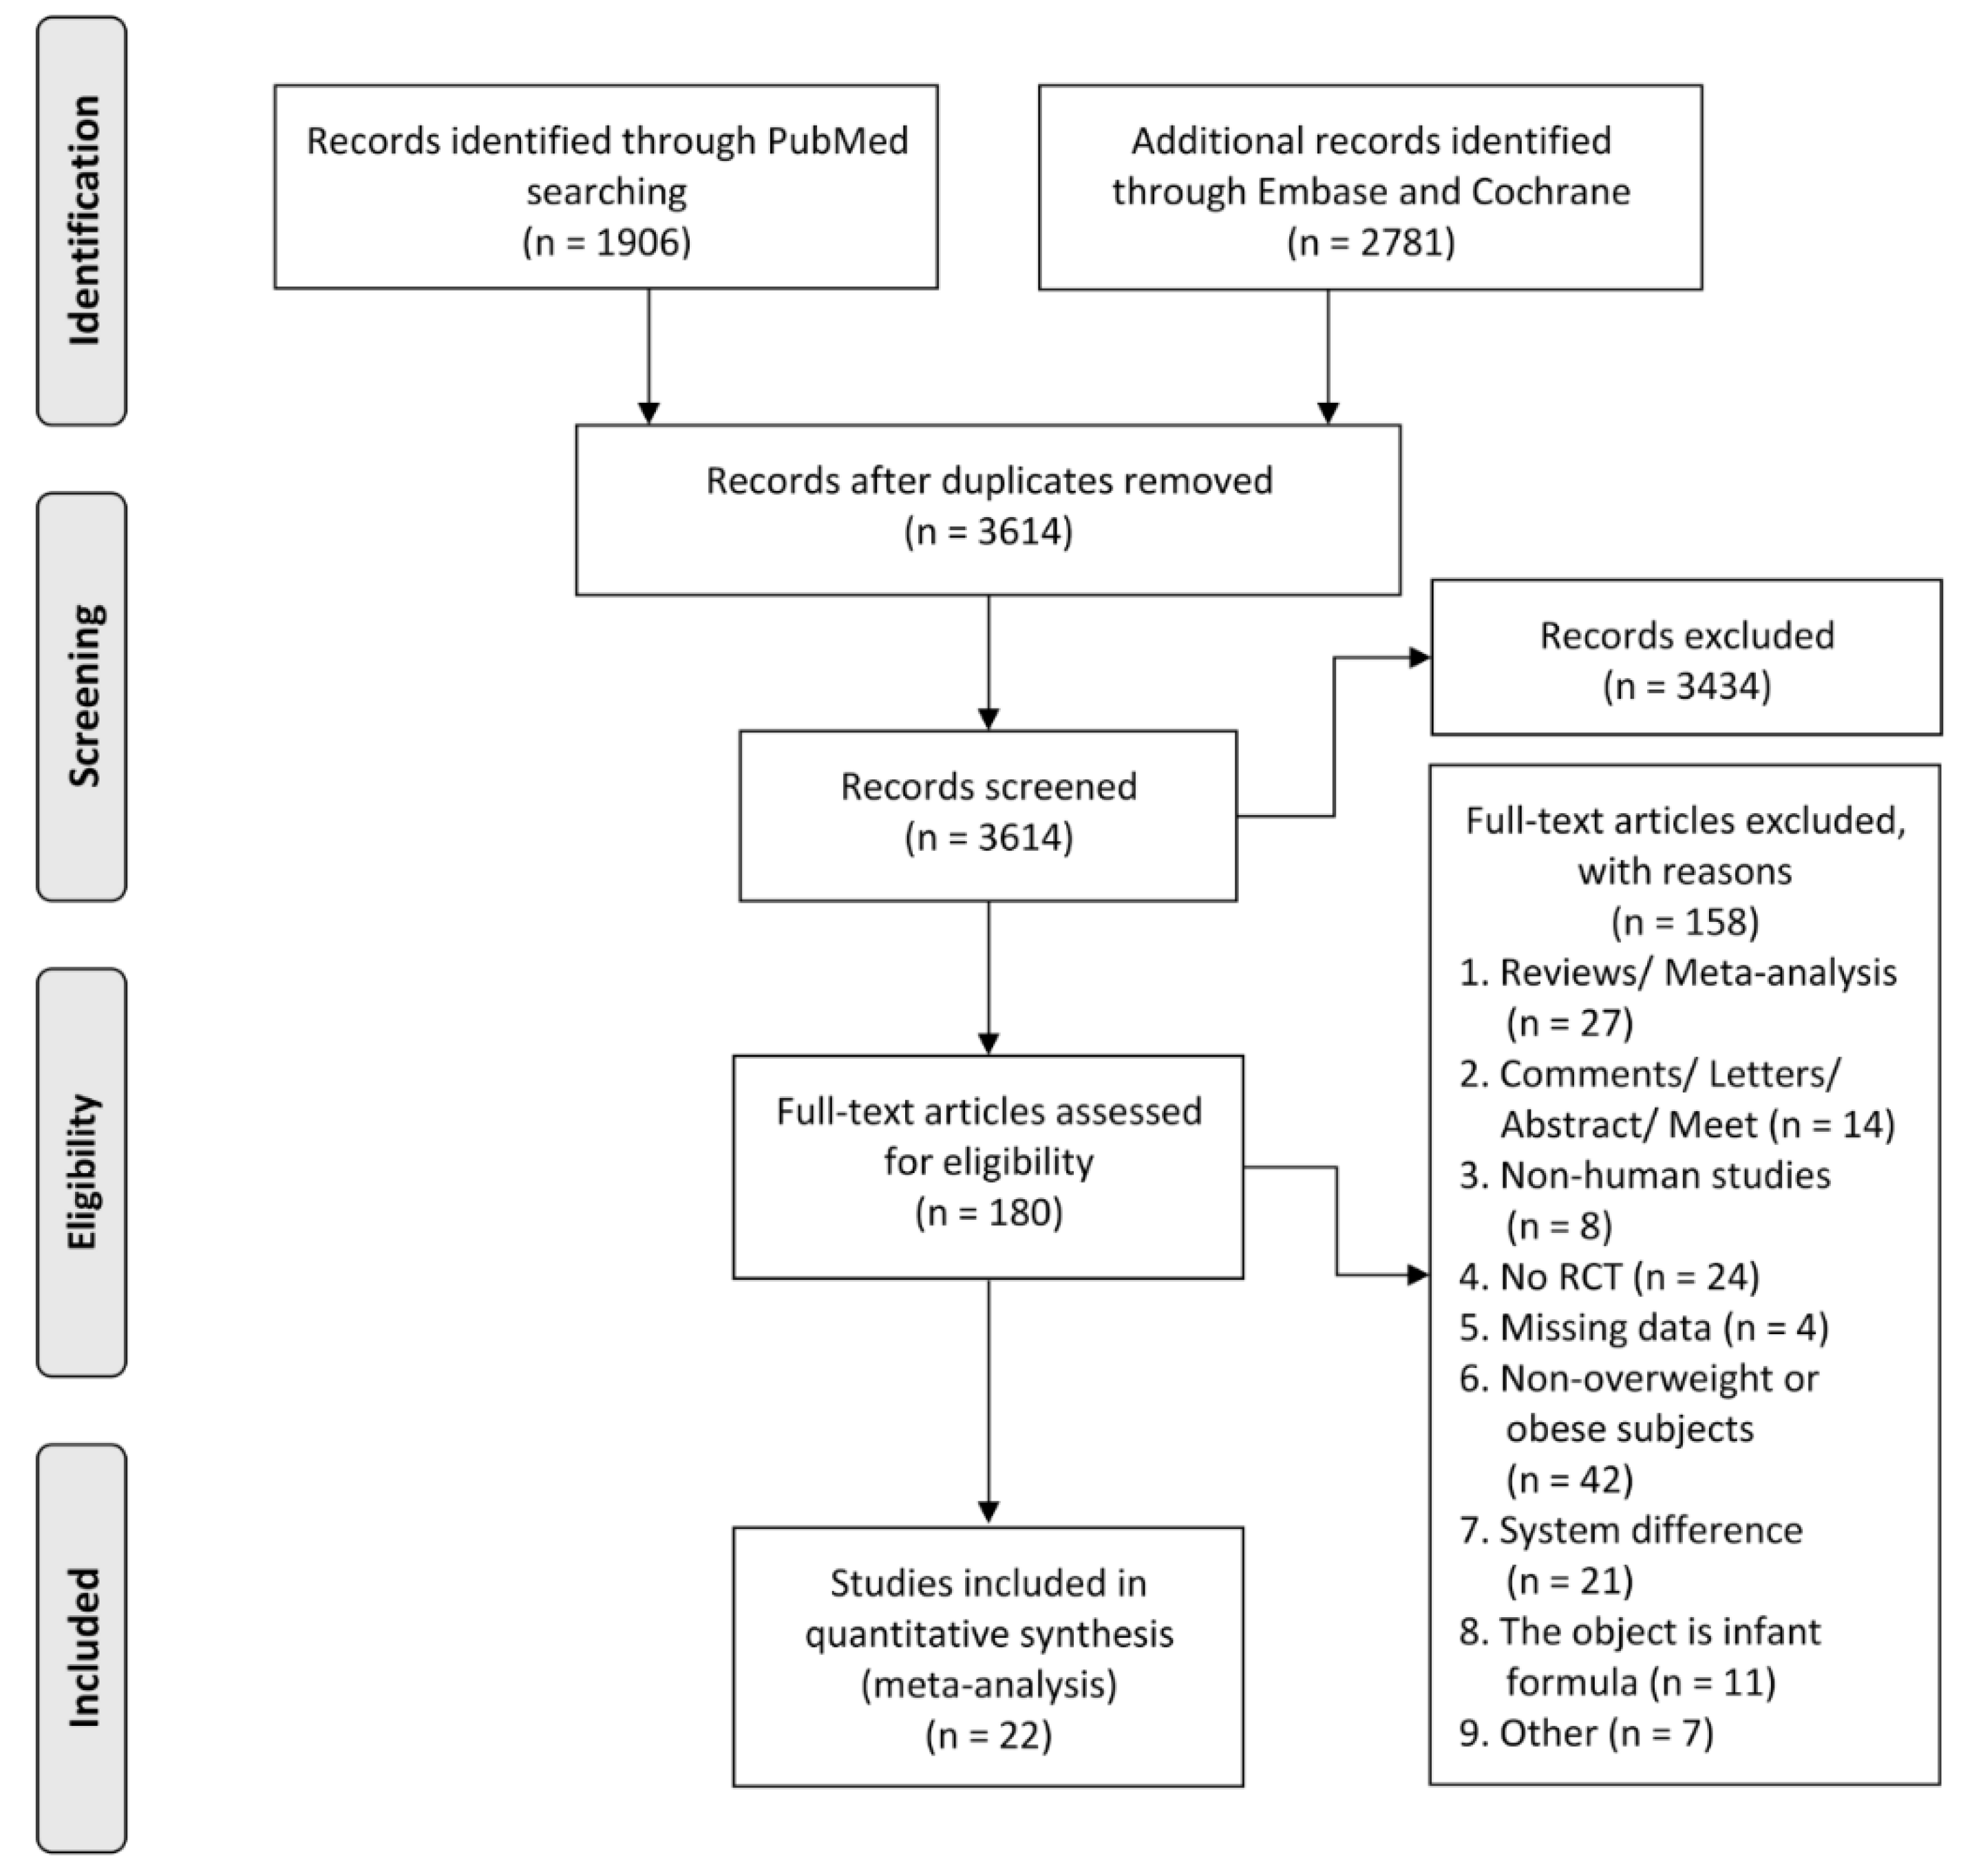
3.1. Search Results
3.2. Study Characteristics
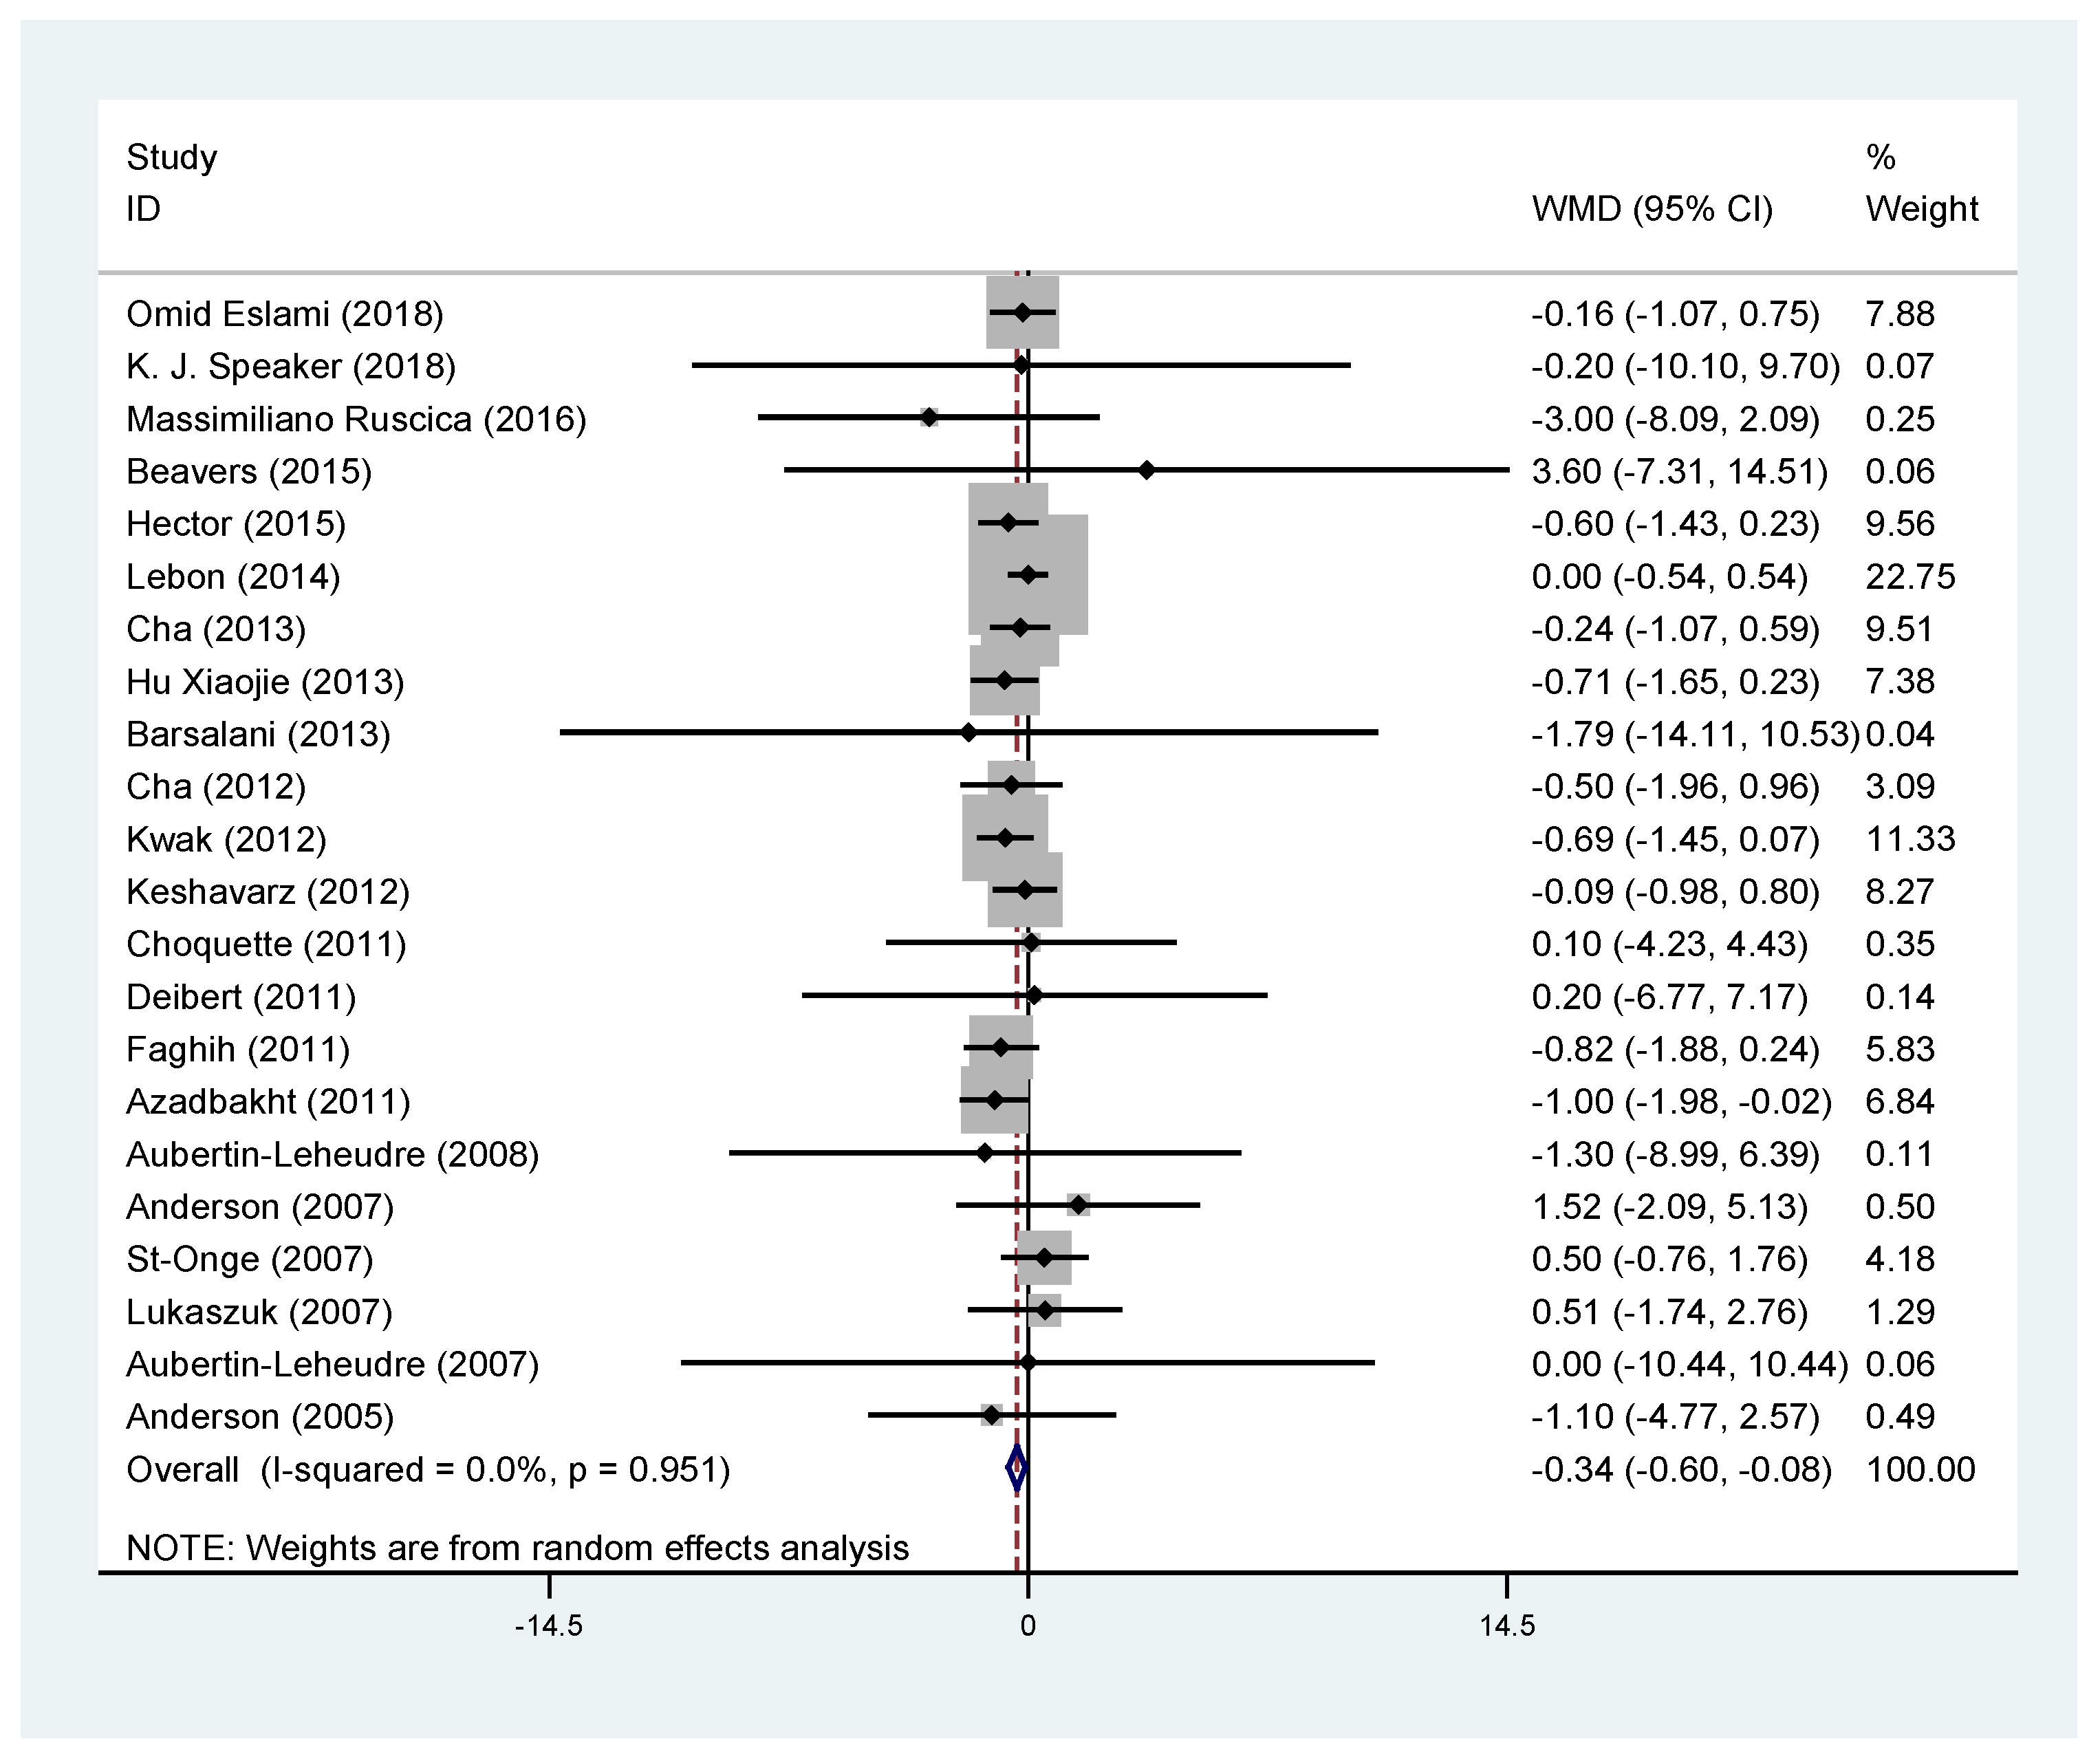
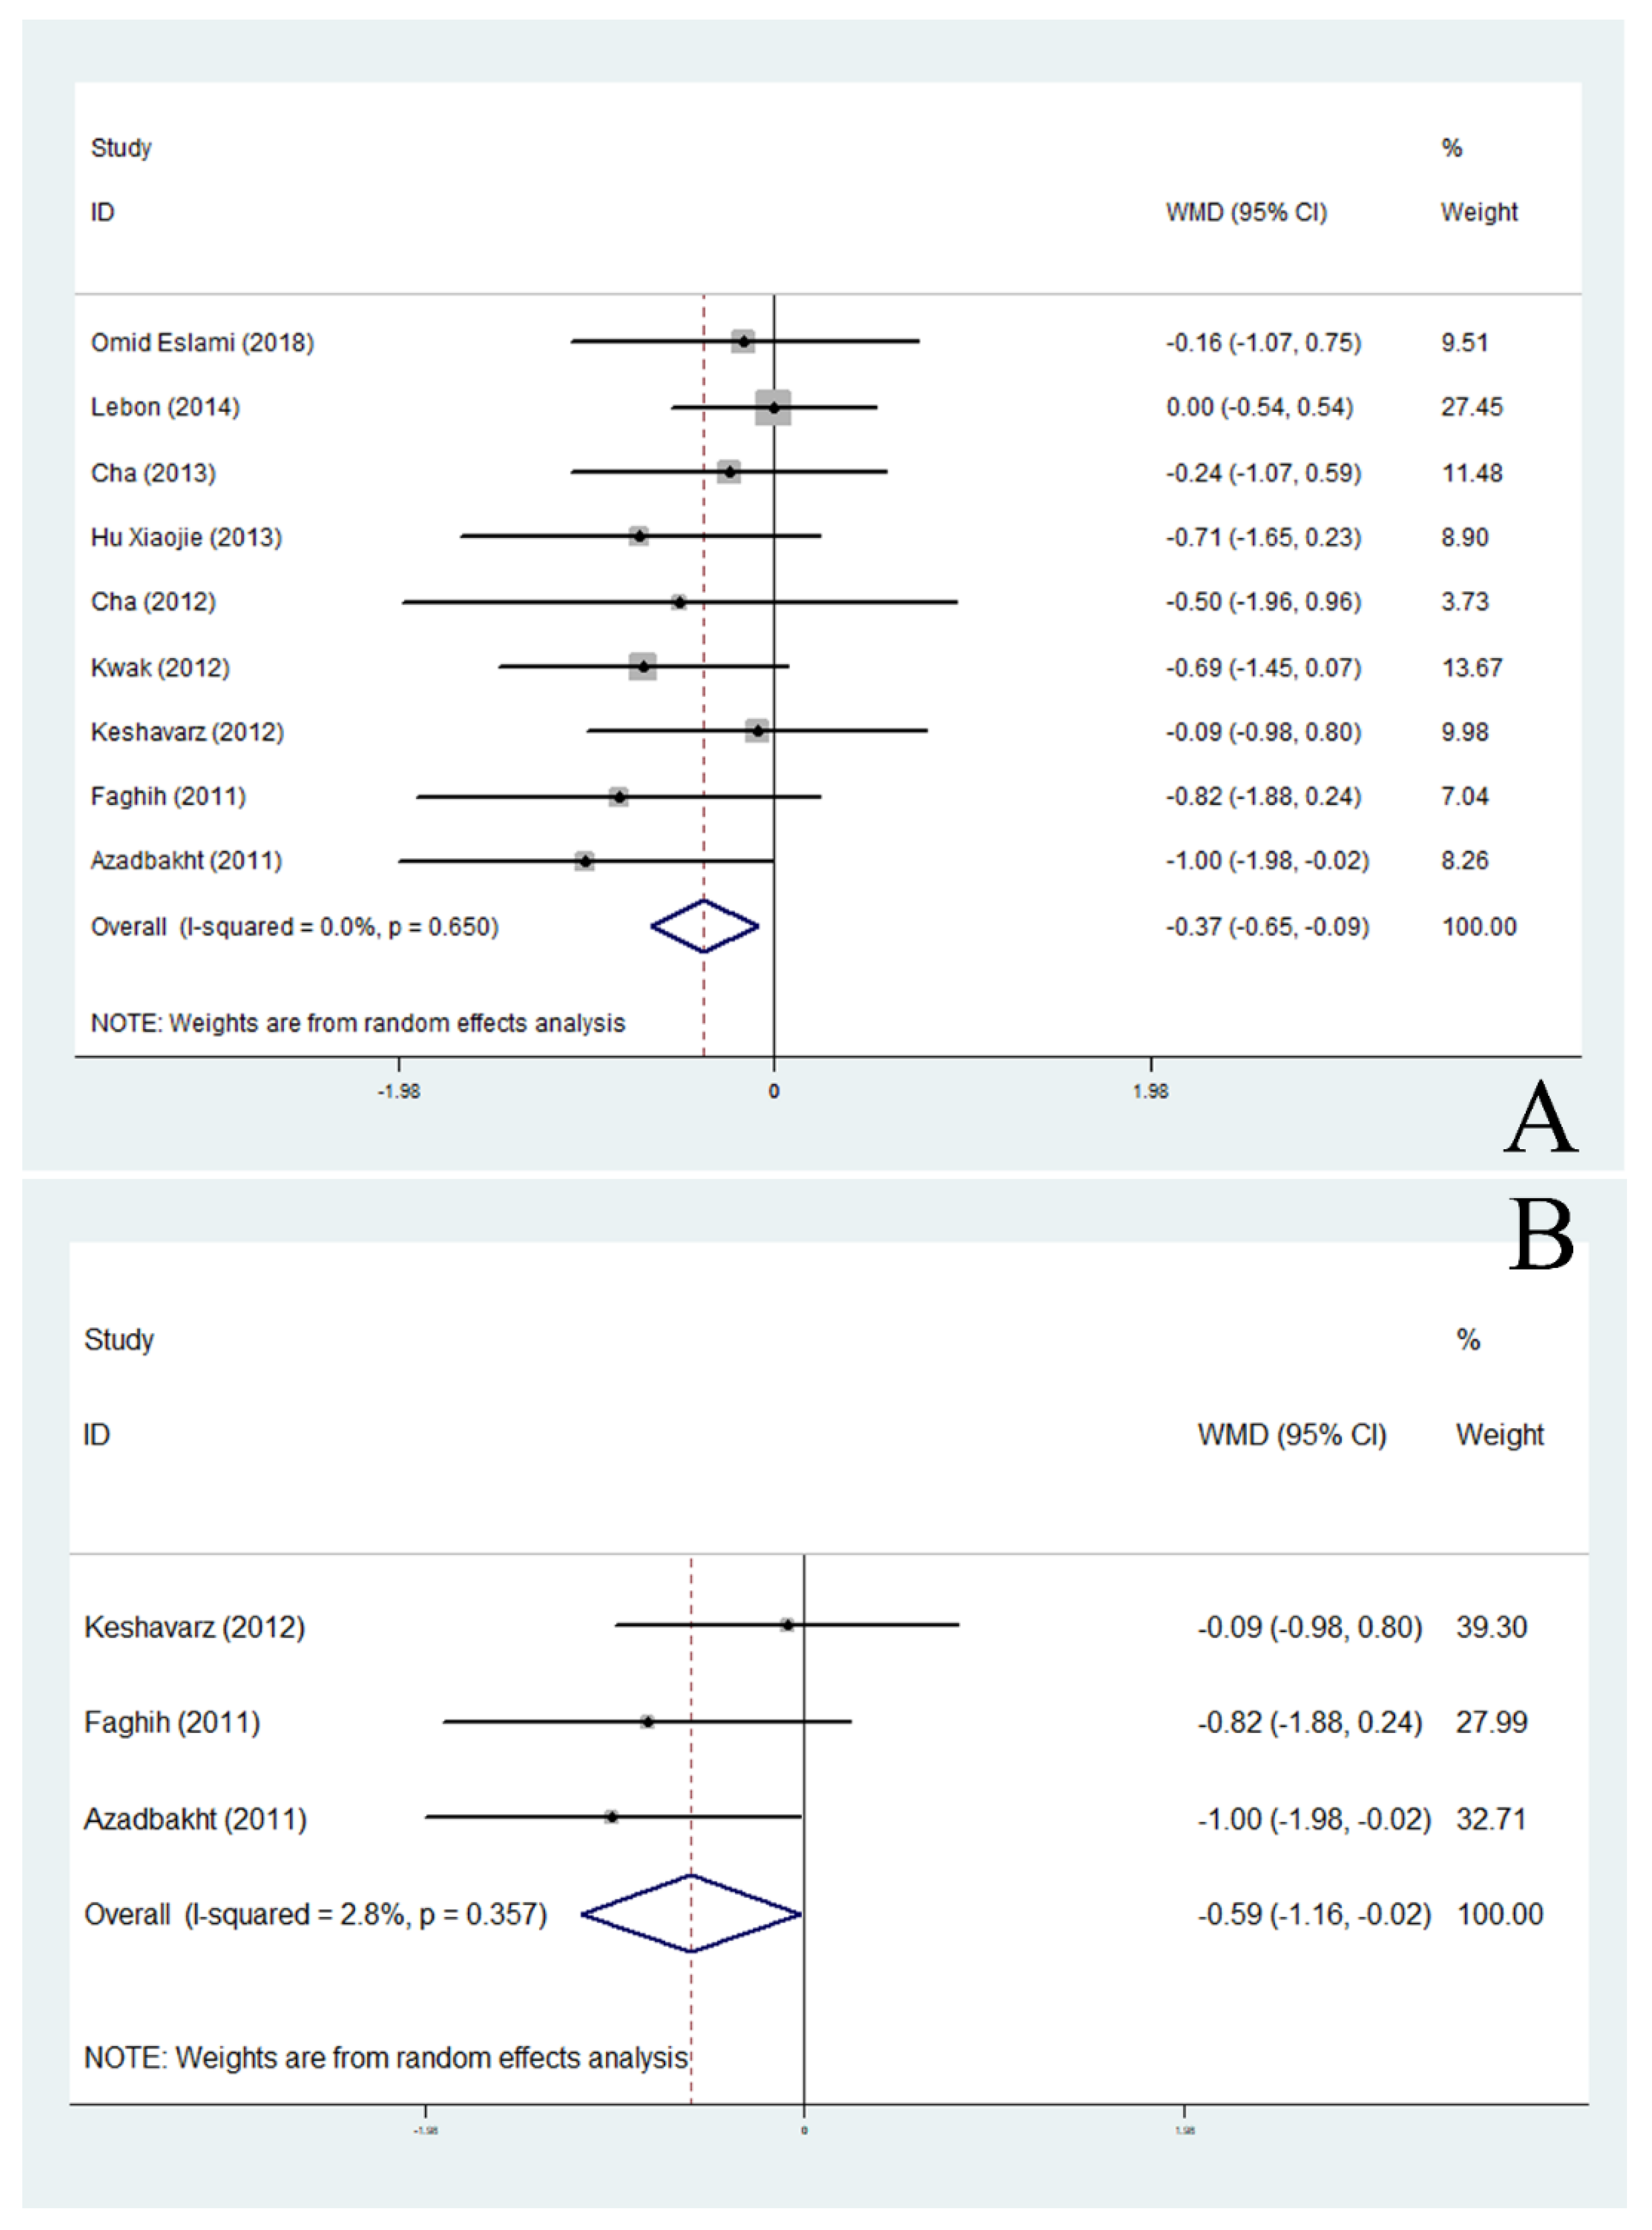
3.3. Effects of Soy Products on Body Weight
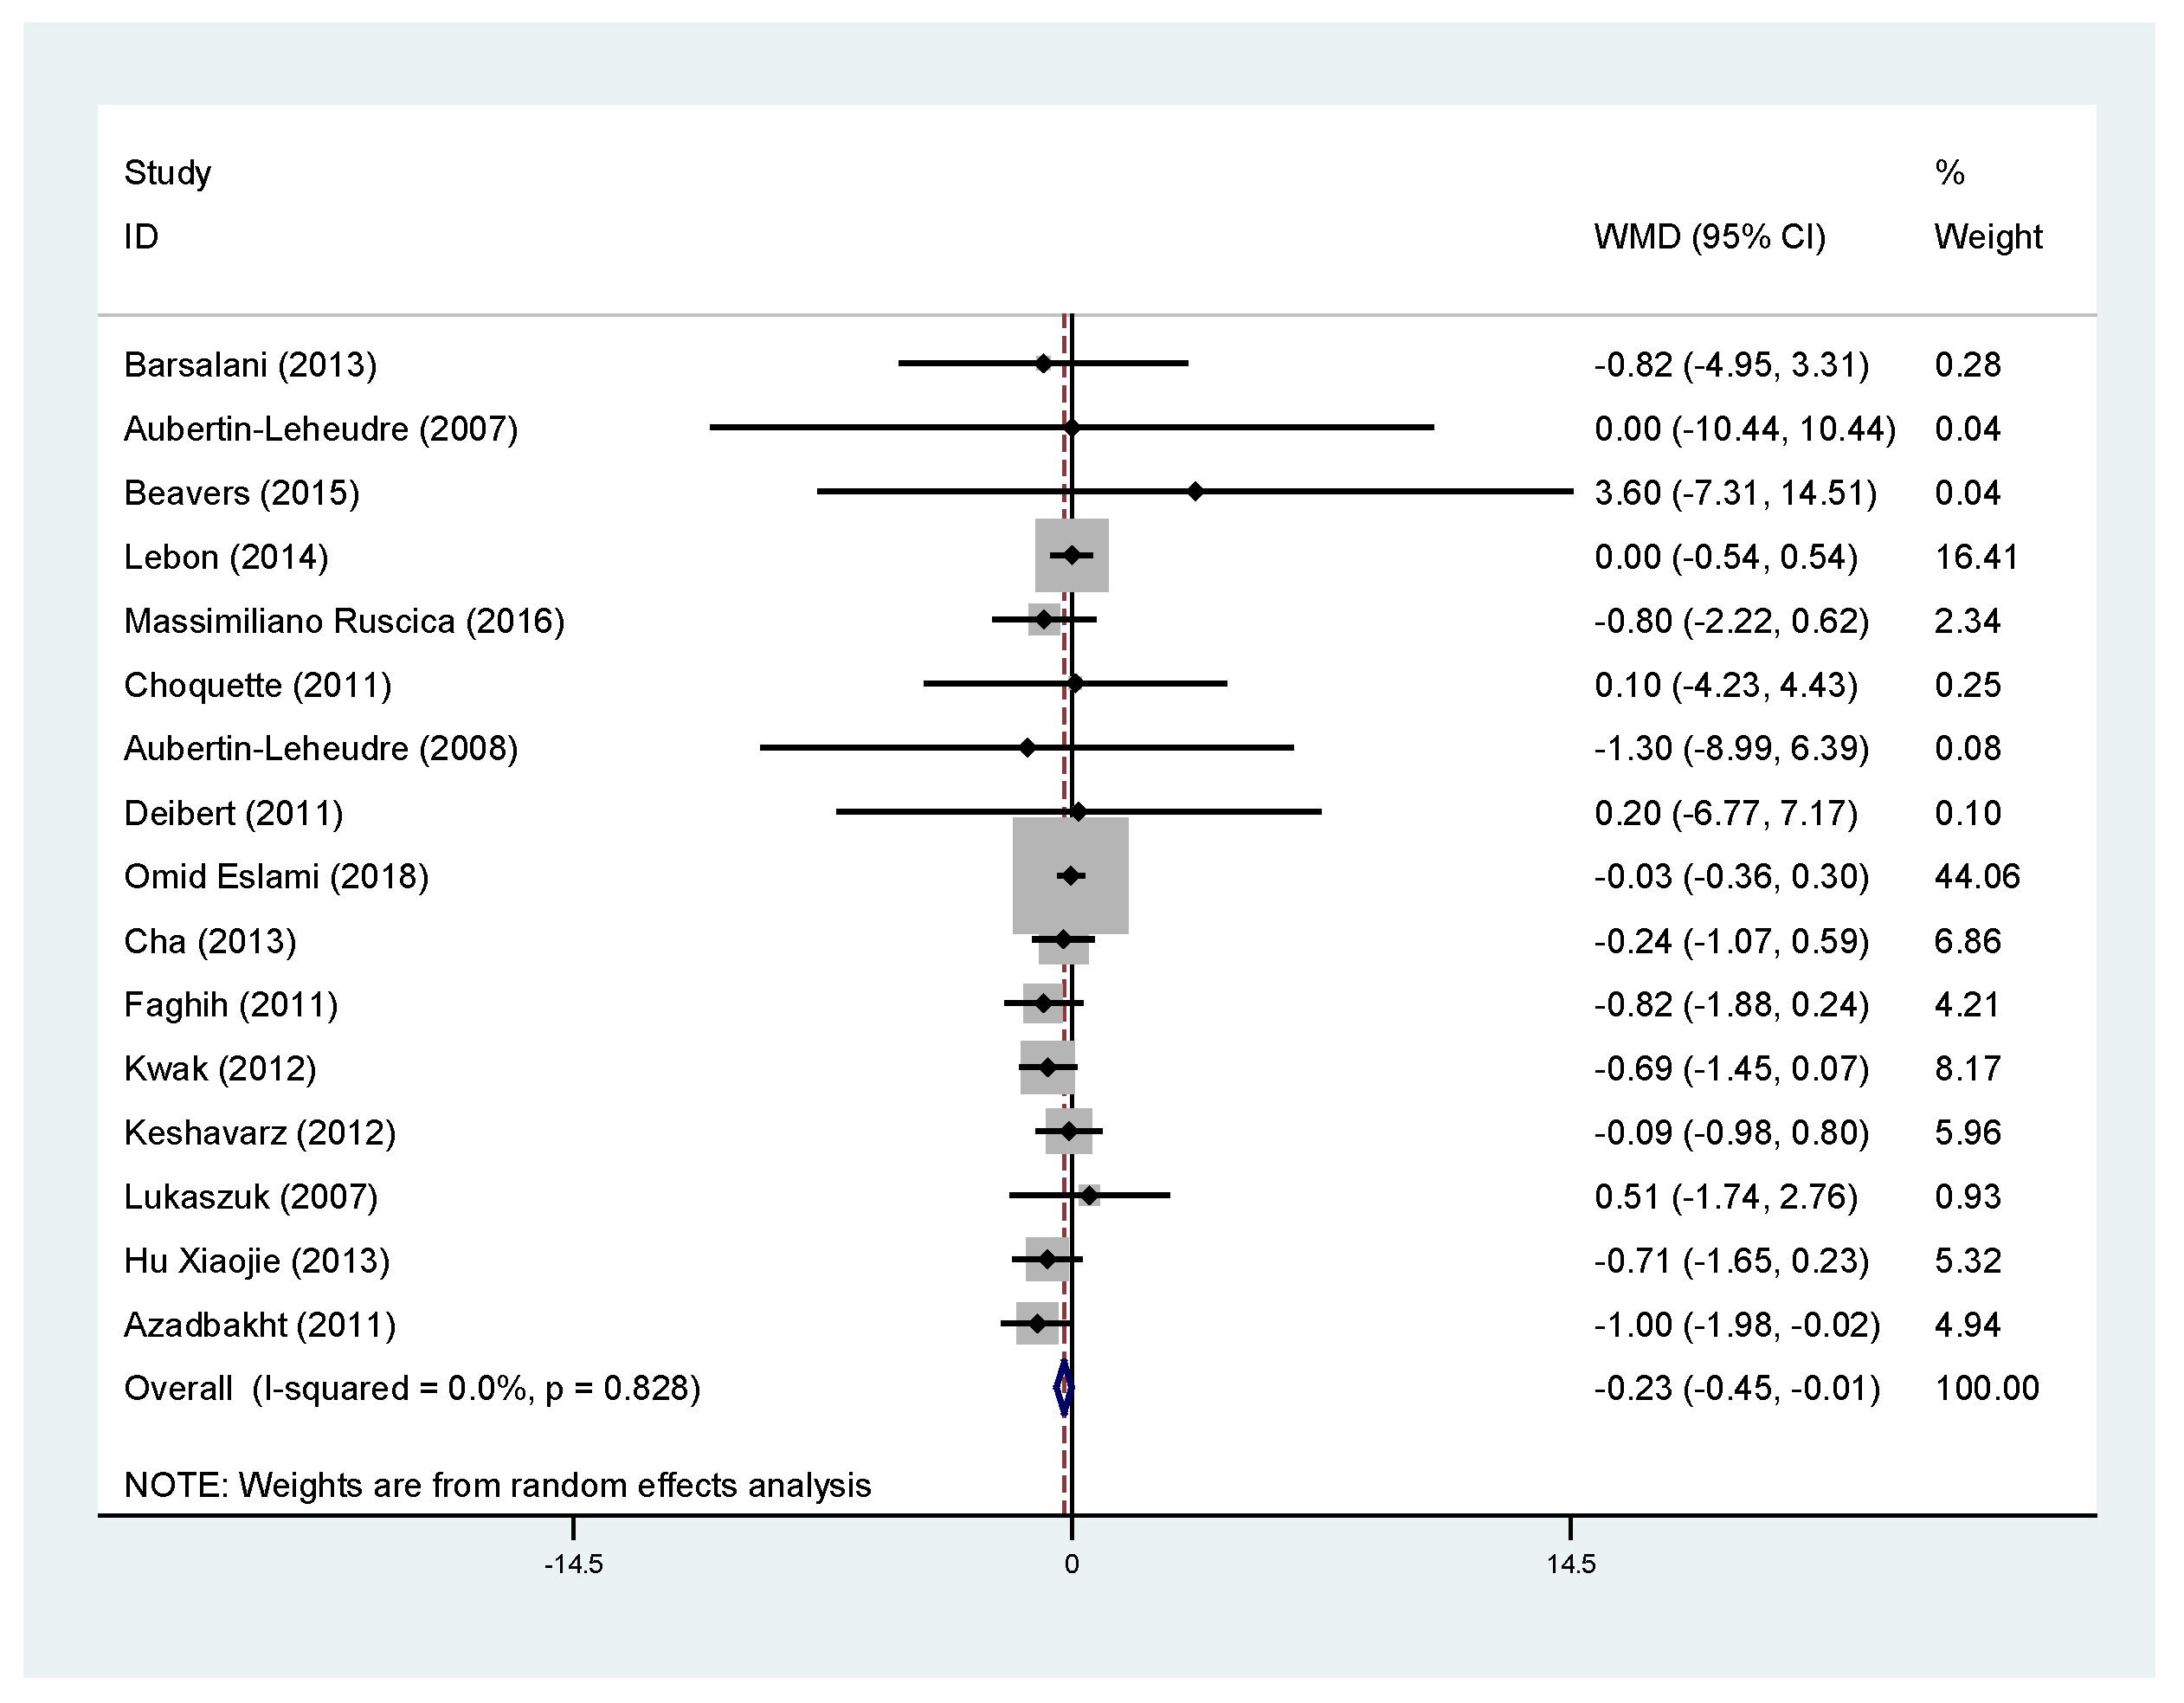
3.4. Effects of Soy Products on BMI
3.5. Effects of Soy Products on Body Fat Percentage and Fat Mass
3.6. Effects of Soy Products on Waist Circumference and Hip Circumference
3.7. Publication Bias
4. Discussion
5. Conclusions
Author Contributions
Funding
Acknowledgments
Conflicts of Interest
References
- Bhurosy, T.; Jeewon, R. Overweight and obesity epidemic in developing countries: A problem with diet, physical activity, or socioeconomic status? Sci. World J. 2014, 2014, 964236. [Google Scholar] [CrossRef] [PubMed]
- World Health Organization. Obesity and Overweight; World Health Organization: Geneva, Switzerland, 2013. [Google Scholar]
- Hales, C.M.; Carroll, M.D.; Fryar, C.D.; Ogden, C.L. Prevalence of Obesity Among Adults and Youth: United States, 2015–2016; National Center for Health Statistics: Hyattsville, MD, USA, 2017; pp. 1–8.
- Hammond, R.A.; Levine, R. The economic impact of obesity in the United States. Diabetes Metab. Syndr. Obes. Targets Ther. 2010, 3, 285–295. [Google Scholar] [CrossRef]
- Benjamin, E.J.; Virani, S.S.; Callaway, C.W.; Chamberlain, A.M.; Chang, A.R.; Cheng, S.; Chiuve, S.E.; Cushman, M.; Delling, F.N.; Deo, R.; et al. Heart disease and stroke statistics-2018 update: A report from the American Heart Association. Circulation 2018, 137, e67–e492. [Google Scholar] [CrossRef] [PubMed]
- Nie, P.; Ding, L.; Sousa-Poza, A. Decomposing adult obesity trends in China (1991–2011). Econ. Hum. Biol. 2019, 34, 5–15. [Google Scholar] [CrossRef] [PubMed]
- Qin, X.; Pan, J. The medical cost attributable to obesity and overweight in China: Estimation based on longitudinal surveys. Health Econ. 2016, 25, 1291–1311. [Google Scholar] [CrossRef]
- Jastreboff, A.M.; Kotz, C.M.; Kahan, S.; Kelly, A.S.; Heymsfield, S.B. Obesity as a disease: The Obesity Society 2018 position statement. Obesity 2019, 27, 7–9. [Google Scholar] [CrossRef]
- Muller, M.J.; Geisler, C. Defining obesity as a disease. Eur. J. Clin. Nutr. 2017, 71, 1256–1258. [Google Scholar] [CrossRef]
- Zhang, X.; Decker, F.H.; Luo, H.; Geiss, L.S.; Pearson, W.S.; Saaddine, J.B.; Gregg, E.W.; Albright, A. Trends in the prevalence and comorbidities of diabetes mellitus in nursing home residents in the United States: 1995-2004. J. Am. Geriatr. Soc. 2010, 58, 724–730. [Google Scholar] [CrossRef]
- McEwen, L.N.; Karter, A.J.; Waitzfelder, B.E.; Crosson, J.C.; Marrero, D.G.; Mangione, C.M.; Herman, W.H. Predictors of mortality over 8 years in type 2 diabetic patients: Translating Research Into Action for Diabetes (TRIAD). Diabetes Care 2012, 35, 1301–1309. [Google Scholar] [CrossRef]
- Vainio, H.; Kaaks, R.; Bianchini, F. Weight control and physical activity in cancer prevention: International evaluation of the evidence. Eur. J. Cancer Prev. Off. J. Eur. Cancer Prev. Organ. (ECP) 2002, 11, S94–S100. [Google Scholar]
- Marmot, M.; Atinmo, T.; Byers, T.; Chen, J.; Hirohata, T.; Jackson, A.; James, W.; Kolonel, L.; Kumanyika, S.; Leitzmann, C.; et al. Food, Nutrition, Physical Activity, and the Prevention of Cancer: A Global Perspective. Available online: http://discovery.ucl.ac.uk/4841/ 2016 (accessed on 6 August 2019).
- Conti, C.R. Obesity and weight loss. Eur. Cardiol. 2018, 13, 93–94. [Google Scholar] [CrossRef] [PubMed]
- Herpertz, S.; Kessler, H.; Jongen, S. Psychosomatic and psychosocial questions regarding bariatric surgery: What do we know, or what do we think we know? Z. Psychosom. Med. Psychother. 2017, 63, 344–369. [Google Scholar] [CrossRef] [PubMed]
- Castaneda, D.; Popov, V.B.; Wander, P.; Thompson, C.C. Risk of suicide and self-harm is increased after bariatric surgery-a systematic review and meta-analysis. Obes. Surg. 2019, 29, 322–333. [Google Scholar] [CrossRef] [PubMed]
- Lukaszuk, J.M.; Luebbers, P.; Gordon, B.A. Preliminary study: Soy milk as effective as skim milk in promoting weight loss. J. Am. Diet. Assoc. 2007, 107, 1811–1814. [Google Scholar] [CrossRef]
- Speaker, K.J.; Sayer, R.D. Effects of consuming a high-protein diet with or without soy protein during weight loss and maintenance: A non-inferiority, randomized clinical efficacy trial. Obes. Sci. Pract. 2018, 4, 357–366. [Google Scholar] [CrossRef]
- Aubertin-Leheudre, M.; Lord, C.; Khalil, A.; Dionne, I.J. Effect of 6 months of exercise and isoflavone supplementation on clinical cardiovascular risk factors in obese postmenopausal women: A randomized, double-blind study. Menopause 2007, 14, 624–629. [Google Scholar] [CrossRef]
- Xiao, C.W. Health effects of soy protein and isoflavones in humans. J. Nutr. 2008, 138, 1244s–1249s. [Google Scholar] [CrossRef]
- Sacks, F.M.; Lichtenstein, A.; Van Horn, L.; Harris, W.; Kris-Etherton, P.; Winston, M. Soy protein, isoflavones, and cardiovascular health: An American Heart Association Science Advisory for professionals from the Nutrition Committee. Circulation 2006, 113, 1034–1044. [Google Scholar] [CrossRef]
- Kwak, J.H.; Ahn, C.W.; Park, S.H.; Jung, S.U.; Min, B.J.; Kim, O.Y.; Lee, J.H. Weight reduction effects of a black soy peptide supplement in overweight and obese subjects: Double blind, randomized, controlled study. Food Funct. 2012, 3, 1019–1024. [Google Scholar] [CrossRef]
- Faghih, S.; Abadi, A.R.; Hedayati, M.; Kimiagar, S.M. Comparison of the effects of cows’ milk, fortified soy milk, and calcium supplement on weight and fat loss in premenopausal overweight and obese women. Nutr. Metab. Cardiovasc. Dis. NMCD 2011, 21, 499–503. [Google Scholar] [CrossRef]
- Cha, Y.S.; Yang, J.A.; Back, H.I.; Kim, S.R.; Kim, M.G.; Jung, S.J.; Song, W.O.; Chae, S.W. Visceral fat and body weight are reduced in overweight adults by the supplementation of Doenjang, a fermented soybean paste. Nutr. Res. Pract. 2012, 6, 520–526. [Google Scholar] [CrossRef] [PubMed]
- Keshavarz, S.A.; Nourieh, Z.; Attar, M.J.; Azadbakht, L. Effect of soymilk consumption on waist circumference and cardiovascular risks among overweight and obese female adults. Int. J. Prev. Med. 2012, 3, 798–805. [Google Scholar] [PubMed]
- Aubertin-Leheudre, M.; Lord, C.; Khalil, A.; Dionne, I.J. Isoflavones and clinical cardiovascular risk factors in obese postmenopausal women: A randomized double-blind placebo-controlled trial. J. Women’s Health 2008, 17, 1363–1369. [Google Scholar] [CrossRef]
- Eslami, O.; Shidfar, F.; Maleki, Z.; Jazayeri, S.; Hosseini, A.F.; Agah, S.; Ardiyani, F. Effect of soy milk on metabolic status of patients with nonalcoholic fatty liver disease: A randomized clinical trial. J. Am. Coll. Nutr. 2019, 38, 51–58. [Google Scholar] [CrossRef] [PubMed]
- Ruscica, M.; Pavanello, C.; Gandini, S.; Gomaraschi, M.; Vitali, C.; Macchi, C.; Morlotti, B.; Aiello, G.; Bosisio, R.; Calabresi, L.; et al. Effect of soy on metabolic syndrome and cardiovascular risk factors: A randomized controlled trial. Eur. J. Nutr. 2018, 57, 499–511. [Google Scholar] [CrossRef] [PubMed]
- Hector, A.J.; Marcotte, G.R.; Churchward-Venne, T.A.; Murphy, C.H.; Breen, L.; von Allmen, M.; Baker, S.K.; Phillips, S.M. Whey protein supplementation preserves postprandial myofibrillar protein synthesis during short-term energy restriction in overweight and obese adults. J. Nutr. 2015, 145, 246–252. [Google Scholar] [CrossRef] [PubMed]
- Beavers, K.M.; Gordon, M.M.; Easter, L.; Beavers, D.P.; Hairston, K.G.; Nicklas, B.J.; Vitolins, M.Z. Effect of protein source during weight loss on body composition, cardiometabolic risk and physical performance in abdominally obese, older adults: A pilot feeding study. J. Nutr. Health Aging 2015, 19, 87–95. [Google Scholar] [CrossRef] [PubMed]
- Lebon, J.; Riesco, E.; Tessier, D.; Dionne, I.J. Additive effects of isoflavones and exercise training on inflammatory cytokines and body composition in overweight and obese postmenopausal women: A randomized controlled trial. Menopause 2014, 21, 869–875. [Google Scholar] [CrossRef]
- Hu, X.; Gao, J.; Zhang, Q.; Fu, Y.; Li, K.; Zhu, S.; Li, D. Soy fiber improves weight loss and lipid profile in overweight and obese adults: A randomized controlled trial. Mol. Nutr. Food Res. 2013, 57, 2147–2154. [Google Scholar] [CrossRef]
- Cha, Y.S.; Kim, S.R.; Yang, J.A.; Back, H.I.; Kim, M.G.; Jung, S.J.; Song, W.O.; Chae, S.W. Kochujang, fermented soybean-based red pepper paste, decreases visceral fat and improves blood lipid profiles in overweight adults. Nutr. Metab. 2013, 10, 24. [Google Scholar] [CrossRef]
- Barsalani, R.; Riesco, E.; Lavoie, J.M.; Dionne, I.J. Effect of exercise training and isoflavones on hepatic steatosis in overweight postmenopausal women. Climacteric J. Int. Menopause Soc. 2013, 16, 88–95. [Google Scholar] [CrossRef] [PubMed]
- Deibert, P.; Solleder, F.; Konig, D.; Vitolins, M.Z.; Dickhuth, H.H.; Gollhofer, A.; Berg, A. Soy protein based supplementation supports metabolic effects of resistance training in previously untrained middle aged males. The aging male. Off. J. Int. Soc. Study Aging Male 2011, 14, 273–279. [Google Scholar] [CrossRef] [PubMed]
- Choquette, S.; Riesco, E.; Cormier, E.; Dion, T.; Aubertin-Leheudre, M.; Dionne, I.J. Effects of soya isoflavones and exercise on body composition and clinical risk factors of cardiovascular diseases in overweight postmenopausal women: A 6-month double-blind controlled trial. Br. J. Nutr. 2011, 105, 1199–1209. [Google Scholar] [CrossRef] [PubMed]
- Azadbakht, L.; Nurbakhsh, S. Effect of soy drink replacement in a weight reducing diet on anthropometric values and blood pressure among overweight and obese female youths. Asia Pac. J. Clin. Nutr. 2011, 20, 383–389. [Google Scholar]
- St-Onge, M.P.; Claps, N.; Wolper, C.; Heymsfield, S.B. Supplementation with soy-protein-rich foods does not enhance weight loss. J. Am. Diet. Assoc. 2007, 107, 500–505. [Google Scholar] [CrossRef]
- Anderson, J.W.; Fuller, J.; Patterson, K.; Blair, R.; Tabor, A. Soy compared to casein meal replacement shakes with energy-restricted diets for obese women: Randomized controlled trial. Metab. Clin. Exp. 2007, 56, 280–288. [Google Scholar] [CrossRef]
- Anderson, J.W.; Hoie, L.H. Weight loss and lipid changes with low-energy diets: Comparator study of milk-based versus soy-based liquid meal replacement interventions. J. Am. Coll. Nutr. 2005, 24, 210–216. [Google Scholar] [CrossRef]
- Akhlaghi, M.; Zare, M.; Nouripour, F. Effect of soy and soy isoflavones on obesity-related anthropometric measures: A systematic review and meta-analysis of randomized controlled clinical trials. Adv. Nutr. 2017, 8, 705–717. [Google Scholar] [CrossRef]
- Masood, M.; Reidpath, D.D. Effect of national wealth on BMI: An analysis of 206, 266 individuals in 70 low- middle- and high-income countries. PLoS ONE 2017, 12, e0178928. [Google Scholar] [CrossRef]
- Campos-Uscanga, Y.; Gutierrez-Ospina, G.; Morales-Romero, J.; Romo-Gonzalez, T. Self-regulation of eating and physical activity is lower in obese female college students as compared to their normal weight counterparts. Eat. Weight Disord. EWD 2017, 22, 311–319. [Google Scholar] [CrossRef]
- Batterink, L.; Yokum, S.; Stice, E. Body mass correlates inversely with inhibitory control in response to food among adolescent girls: An FMRI study. NeuroImage 2010, 52, 1696–1703. [Google Scholar] [CrossRef] [PubMed]
- Frayling, T.M.; Timpson, N.J.; Weedon, M.N.; Zeggini, E.; Freathy, R.M.; Lindgren, C.M.; Perry, J.R.; Elliott, K.S.; Lango, H.; Rayner, N.W.; et al. A common variant in the FTO gene is associated with body mass index and predisposes to childhood and adult obesity. Science 2007, 316, 889–894. [Google Scholar] [CrossRef] [PubMed]
- Liu, S.J.; Tang, H.L.; He, Q.; Lu, P.; Fu, T.; Xu, X.L.; Su, T.; Gao, M.M.; Duan, S.; Luo, Y.; et al. FTO is a transcriptional repressor to auto-regulate its own gene and potentially associated with homeostasis of body weight. J. Mol. Cell Biol. 2018, 11, 118–132. [Google Scholar] [CrossRef] [PubMed]
- Abdella, H.M.; El Farssi, H.O.; Broom, D.R. Eating behaviours and food cravings; influence of age, sex, BMI and FTO genotype. Nutrients 2019, 11, 377. [Google Scholar] [CrossRef] [PubMed]
- Kalantari, N.; Keshavarz Mohammadi, N.; Izadi, P.; Doaei, S. A haplotype of three SNPs in FTO had a strong association with body composition and BMI in Iranian male adolescents. PLoS ONE 2018, 13, e0195589. [Google Scholar] [CrossRef] [PubMed]
- Kamura, Y.; Iwata, M.; Maeda, S.; Shinmura, S.; Koshimizu, Y.; Honoki, H.; Fukuda, K.; Ishiki, M.; Usui, I.; Fukushima, Y.; et al. FTO gene polymorphism is associated with type 2 diabetes through its effect on increasing the maximum BMI in Japanese men. PLoS ONE 2016, 11, e0165523. [Google Scholar] [CrossRef]
- Reddon, H.; Patel, Y.; Turcotte, M.; Pigeyre, M.; Meyre, D. Revisiting the evolutionary origins of obesity: Lazy versus peppy-thrifty genotype hypothesis. Obes. Rev. 2018, 19, 1525–1543. [Google Scholar] [CrossRef]
- Li, X.; Sun, X.; Jin, L.; Xue, F. Worldwide spatial genetic structure of angiotensin-converting enzyme gene: A new evolutionary ecological evidence for the thrifty genotype hypothesis. Eur. J. Hum. Genet. EJHG 2011, 19, 1002–1008. [Google Scholar] [CrossRef]
- Misso, M.L.; Jang, C.; Adams, J.; Tran, J.; Murata, Y.; Bell, R.; Boon, W.C.; Simpson, E.R.; Davis, S.R. Differential expression of factors involved in fat metabolism with age and the menopause transition. Maturitas 2005, 51, 299–306. [Google Scholar] [CrossRef]
- Edwards, M.H.; Gregson, C.L.; Patel, H.P.; Jameson, K.A.; Harvey, N.C.; Sayer, A.A.; Dennison, E.M.; Cooper, C. Muscle size, strength, and physical performance and their associations with bone structure in the Hertfordshire Cohort Study. J. Bone Miner. Res. Off. J. Am. Soc. Bone Miner. Res. 2013, 28, 2295–2304. [Google Scholar] [CrossRef]
- Ibeneme, S.; Ezeigwe, C.; Ibeneme, G.C.; Ezuma, A.; Okoye, I.; Nwankwo, J.M. Response of gait output and handgrip strength to changes in body fat mass in pre- and postmenopausal women. Curr. Ther. Res. Clin. Exp. 2017, 90, 92–98. [Google Scholar] [CrossRef] [PubMed]
- Zhang, Y.B.; Chen, W.H.; Guo, J.J.; Fu, Z.H.; Yi, C.; Zhang, M.; Na, X.L. Soy isoflavone supplementation could reduce body weight and improve glucose metabolism in non-Asian postmenopausal women A meta-analysis. Nutrition 2013, 29, 8–14. [Google Scholar] [CrossRef] [PubMed]
- Malaypally, S.P.; Ismail, B. Effect of protein content and denaturation on the extractability and stability of isoflavones in different soy systems. J. Agric. Food Chem. 2010, 58, 8958–8965. [Google Scholar] [CrossRef] [PubMed]
- Akhlaghi, M. Non-alcoholic fatty liver disease: Beneficial effects of flavonoids. Phytother. Res. 2016, 30, 1559–1571. [Google Scholar] [CrossRef]
- Sites, C.K.; Cooper, B.C.; Toth, M.J.; Gastaldelli, A.; Arabshahi, A.; Barnes, S. Effect of a daily supplement of soy protein on body composition and insulin secretion in postmenopausal women. Fertil. Steril. 2007, 88, 1609–1617. [Google Scholar] [CrossRef]
- Villa, P.; Costantini, B.; Suriano, R.; Perri, C.; Macri, F.; Ricciardi, L.; Panunzi, S.; Lanzone, A. The differential effect of the phytoestrogen genistein on cardiovascular risk factors in postmenopausal women: Relationship with the metabolic status. J. Clin. Endocrinol. Metab. 2009, 94, 552–558. [Google Scholar] [CrossRef]
- Atteritano, M.; Marini, H.; Minutoli, L.; Polito, F.; Bitto, A.; Altavilla, D.; Mazzaferro, S.; D’Anna, R.; Cannata, M.L.; Gaudio, A.; et al. Effects of the phytoestrogen genistein on some predictors of cardiovascular risk in osteopenic, postmenopausal women: A two-year randomized, double-blind, placebo-controlled study. J. Clin. Endocrinol. Metab. 2007, 92, 3068–3075. [Google Scholar] [CrossRef]
- Crisafulli, A.; Altavilla, D.; Marini, H.; Bitto, A.; Cucinotta, D.; Frisina, N.; Corrado, F.; D’Anna, R.; Squadrito, G.; Adamo, E.B.; et al. Effects of the phytoestrogen genistein on cardiovascular risk factors in postmenopausal women. Menopause 2005, 12, 186–192. [Google Scholar] [CrossRef]
- Charles, C.; Yuskavage, J.; Carlson, O.; John, M.; Tagalicud, A.S.; Maggio, M.; Muller, D.C.; Egan, J.; Basaria, S. Effects of high-dose isoflavones on metabolic and inflammatory markers in healthy postmenopausal women. Menopause 2009, 16, 395–400. [Google Scholar] [CrossRef]
- Khaodhiar, L.; Ricciotti, H.A.; Li, L.; Pan, W.; Schickel, M.; Zhou, J.; Blackburn, G.L. Daidzein-rich isoflavone aglycones are potentially effective in reducing hot flashes in menopausal women. Menopause 2008, 15, 125–132. [Google Scholar] [CrossRef]
- Hall, W.L.; Vafeiadou, K.; Hallund, J.; Bugel, S.; Reimann, M.; Koebnick, C.; Zunft, H.J.; Ferrari, M.; Branca, F.; Dadd, T.; et al. Soy-isoflavone-enriched foods and markers of lipid and glucose metabolism in postmenopausal women: Interactions with genotype and equol production. Am. J. Clin. Nutr. 2006, 83, 592–600. [Google Scholar] [CrossRef] [PubMed]
- Mauvais-Jarvis, F.; Clegg, D.J.; Hevener, A.L. The role of estrogens in control of energy balance and glucose homeostasis. Endocr. Rev. 2013, 34, 309–338. [Google Scholar] [CrossRef] [PubMed]
- Rietjens, I.; Louisse, J.; Beekmann, K. The potential health effects of dietary phytoestrogens. Br. J. Pharmacol. 2017, 174, 1263–1280. [Google Scholar] [CrossRef] [PubMed]
- Mullen, E.; Brown, R.M.; Osborne, T.F.; Shay, N.F. Soy isoflavones affect sterol regulatory element binding proteins (SREBPs) and SREBP-regulated genes in HepG2 cells. J. Nutr. 2004, 134, 2942–2947. [Google Scholar] [CrossRef] [PubMed]
- Ronis, M.J.; Chen, Y.; Badeaux, J.; Badger, T.M. Dietary soy protein isolate attenuates metabolic syndrome in rats via effects on PPAR, LXR, and SREBP signaling. J. Nutr. 2009, 139, 1431–1438. [Google Scholar] [CrossRef]
- Mezei, O.; Li, Y.; Mullen, E.; Ross-Viola, J.S.; Shay, N.F. Dietary isoflavone supplementation modulates lipid metabolism via PPARalpha-dependent and -independent mechanisms. Physiol. Genom. 2006, 26, 8–14. [Google Scholar] [CrossRef]
- Mezei, O.; Banz, W.J.; Steger, R.W.; Peluso, M.R.; Winters, T.A.; Shay, N. Soy isoflavones exert antidiabetic and hypolipidemic effects through the PPAR pathways in obese Zucker rats and murine RAW 264.7 cells. J. Nutr. 2003, 133, 1238–1243. [Google Scholar] [CrossRef]
- Shin, E.S.; Lee, H.H.; Cho, S.Y.; Park, H.W.; Lee, S.J.; Lee, T.R. Genistein downregulates SREBP-1 regulated gene expression by inhibiting site-1 protease expression in HepG2 cells. J. Nutr. 2007, 137, 1127–1131. [Google Scholar] [CrossRef]
- Crespillo, A.; Alonso, M.; Vida, M.; Pavon, F.J.; Serrano, A.; Rivera, P.; Romero-Zerbo, Y.; Fernandez-Llebrez, P.; Martinez, A.; Perez-Valero, V.; et al. Reduction of body weight, liver steatosis and expression of stearoyl-Coa desaturase 1 by the isoflavone daidzein in diet-induced obesity. Br. J. Pharmacol. 2011, 164, 1899–1915. [Google Scholar] [CrossRef]
- Roberts, S.B.; McCrory, M.A.; Saltzman, E. The influence of dietary composition on energy intake and body weight. J. Am. Coll. Nutr. 2002, 21, 140s–145s. [Google Scholar] [CrossRef]
- Holt, S.H.; Delargy, H.J.; Lawton, C.L.; Blundell, J.E. The effects of high-carbohydrate vs high-fat breakfasts on feelings of fullness and alertness, and subsequent food intake. Int. J. Food Sci. Nutr. 1999, 50, 13–28. [Google Scholar] [CrossRef] [PubMed]
- Raben, A.; Christensen, N.J.; Madsen, J.; Holst, J.J.; Astrup, A. Decreased postprandial thermogenesis and fat oxidation but increased fullness after a high-fiber meal compared with a low-fiber meal. Am. J. Clin. Nutr. 1994, 59, 1386–1394. [Google Scholar] [CrossRef] [PubMed]
- Turconi, G.; Bazzano, R.; Caramella, R.; Porrini, M.; Crovetti, R.; Lanzola, E. The effects of high intakes of fibre ingested at breakfast on satiety. Eur. J. Clin. Nutr. 1995, 49, S281–S285. [Google Scholar] [PubMed]
- Delargy, H.J.; O’Sullivan, K.R.; Fletcher, R.J.; Blundell, J.E. Effects of amount and type of dietary fibre (soluble and insoluble) on short-term control of appetite. Int. J. Food Sci. Nutr. 1997, 48, 67–77. [Google Scholar] [CrossRef]
- Pasman, W.J.; Saris, W.H.; Wauters, M.A.; Westerterp-Plantenga, M.S. Effect of one week of fibre supplementation on hunger and satiety ratings and energy intake. Appetite 1997, 29, 77–87. [Google Scholar] [CrossRef]
- Ludwig, D.S.; Pereira, M.A.; Kroenke, C.H.; Hilner, J.E.; Van Horn, L.; Slattery, M.L.; Jacobs, D.R., Jr. Dietary fiber, weight gain, and cardiovascular disease risk factors in young adults. Jama 1999, 282, 1539–1546. [Google Scholar] [CrossRef]
- Liu, S.; Willett, W.C.; Manson, J.E.; Hu, F.B.; Rosner, B.; Colditz, G. Relation between changes in intakes of dietary fiber and grain products and changes in weight and development of obesity among middle-aged women. Am. J. Clin. Nutr. 2003, 78, 920–927. [Google Scholar] [CrossRef]
- Birketvedt, G.S.; Aaseth, J.; Florholmen, J.R.; Ryttig, K. Long-term effect of fibre supplement and reduced energy intake on body weight and blood lipids in overweight subjects. Acta Med. 2000, 43, 129–132. [Google Scholar] [CrossRef][Green Version]
- Koh-Banerjee, P.; Franz, M.; Sampson, L.; Liu, S.; Jacobs, D.R., Jr.; Spiegelman, D.; Willett, W.; Rimm, E. Changes in whole-grain, bran, and cereal fiber consumption in relation to 8-y weight gain among men. Am. J. Clin. Nutr. 2004, 80, 1237–1245. [Google Scholar] [CrossRef]
- Porikos, K.P.; Hesser, M.F.; van Itallie, T.B. Caloric regulation in normal-weight men maintained on a palatable diet of conventional foods. Physiol. Behav. 1982, 29, 293–300. [Google Scholar] [CrossRef]
| Search Terms | |
|---|---|
| 1 | Soy Milk[Mesh] OR Soybean Oil[Mesh] OR Soybean Proteins[Mesh] OR Soybeans[Mesh] OR Soy Foods[Mesh] OR Isoflavones[Mesh] |
| 2 | soy[Title/Abstract] OR soybean*[Title/Abstract] OR legume*[Title/Abstract] OR soya[Title/Abstract] OR soybean oil[Title/Abstract] OR soybean protein[Title/Abstract] OR isoflavone*[Title/Abstract] OR phytoestrogens[Title/Abstract] OR genistein[Title/Abstract] OR daidzein[Title/Abstract] OR soy milk[Title/Abstract] OR tofu[Title/Abstract] OR miso[Title/Abstract] OR natto[Title/Abstract] |
| 3 | 1 OR 2 |
| 4 | Body Weight[Mesh] OR Weight Loss[Mesh] OR Weight Gain[Mesh] OR Body Weight Changes[Mesh] OR Body Mass Index[Mesh] OR Obesity[Mesh] OR Overweight[Mesh] |
| 5 | body mass index[Title/Abstract] OR fatness[Title/Abstract] OR body fatness[Title/Abstract] OR weight change[Title/Abstract] OR weight variability[Title/Abstract] OR weight gain[Title/Abstract] OR weight loss[Title/Abstract] OR obesity[Title/Abstract] OR overweight[Title/Abstract] OR body weight[Title/Abstract] OR adiposity[Title/Abstract] OR fat mass[Title/Abstract] OR body fat[Title/Abstract] OR body size[Title/Abstract] OR body composition[Title/Abstract] OR central obesity[Title/Abstract] |
| 6 | 4 OR 5 |
| 7 | Humans[Mesh] |
| 8 | 3 AND 6 AND 7 |
| Author, Year, (Reference) Country | Design | Sample Size, Mean Age, Subject, Duration (Week) | Dietary Assessment | Experimental Group Type | Control Group Type | Index |
|---|---|---|---|---|---|---|
| Speaker, 2018 America [18] | NB, P | 57, 42.00, BMI 27~40 people, 4 | NR | Soy protein | No-soy protein diet | a; b; c; d; e; |
| Eslami, 2018 Iran [27] | NB, P | 64, 45.70 Overweight or obese adults with nonalcoholic fatty liver disease, 8 | NR | Soy milk | No-soy milk diet | a; b; f; |
| Ruscica, 2016 Italy [28] | NB, P | 53, 58.90 Overweight or obese males and postmenopausal women, 12 | NR | Soy protein | / | a; b; f; g; h |
| Hector, 2015, Canada [29] | DB, P | 28, 52.00, BMI 28~50, nondiabetic, 2 | Three-day food record | Soy protein | Whey | a; d; e; |
| Beavers, 2015, America [30] | SB; P | 24, 68.40 ± 5.50 Older and abdominally obese adults, 12 | Keep a log of all foods consumed | Isoflavones | Whey and egg proteins | a; b; c; d; e; f; g; |
| Lebon, 2014, Canada [31] | DB; P | 30, 59.50 ± 4.50 Overweight or obese women, 24 | NR | Isoflavone + exercise | Placebo + exercise/four capsules | a; b; c; d; f; g; |
| Hu, 2013, China [32] | NR; P | 39, 23.17 Overweight and obese college adults, 12 | Self-administered dietary questionnaire | Soy fiber + biscuit | Biscuit | a; b; c; d; f; g; |
| Cha, 2013, South Korea [33] | DB; P | 53, 42.55 Overweight adults, 12 | Three-day food record | Kochujang (KCJ) supplement | Placebo supplement | a; b; c; d; h; |
| Barsalani, 2013, Canada [34] | DB; P | 39, NR Overweight women, 24 | Three-day food record | Isoflavone + exercise | Placebo + exercise | a; b; d; e; f; |
| Kwak, 2012, South Korea [22] | DB; P | 64, 37.73 Overweight or obese people, 12 | 24h recall and a semi-quantitative food frequency questionnaire | Black soy peptide | Casein | a; b; c; d; |
| Keshavarz, 2012, Iran [25] | NB; X | 24, 37.70 ± 1.30 Overweight or obese women, 4 | Three-day food record | Soy milk | Cow’s milk | a; b; f; h; |
| Cha, 2012, South Korea [24] | DB; P | 51, 39.87 Overweight adults, 12 | Three-day food record | Freeze-dried Doenjang | Inactive ingredients | a; c; d; h; |
| Faghih, 2011, Iran [23] | NB; P | 41, 37.88 Overweight or obese women, 8 | 24-h dietary records | Soy milk | A 500 kcal/day deficit diet | a; b; c; d; f; h; |
| Deibert, 2011, Germany [35] | NB, P | 26, 55.70 ± 4.10 Moderately overweight middle aged males, 12 | Self-reported records | Soy–yogurt–honey + the resistance training | The resistance training | a; b; d; e; f; |
| Choquette, 2011, Canada [36] | DB; P | 45, 58.49 Overweight or obese women, 24 | Three-day food record | Isoflavones | Placebo capsules | a; b; c; d; e; f; g; |
| Azadbakht, 2011, Iran [37] | NB; X | 23, 22.08 ± 2.71 Overweight and obese female youths, 6 | Three-day food record | Soy milk | Cow’s milk | a; b; f; g; |
| Aubertin-Leheudre, 2008, Canada [26] | DB, P | 39, 57.40 Obese women, 24 | Three-day food record | Isoflavones | Placebo capsules | a; b; c; d; e; f; |
| St-Onge, 2007, America [38] | NR, P | 47, 39.04 Overweight women, 12 | Three-day food record | Soy protein | / | a; f; |
| Lukaszuk, 2007, America [17] | NB, P | 14, 31.57 Overweight or obese adults, 8 | Three-day food record | Soy milk | Skim milk | a; b; c; d; e; |
| Aubertin-Leheudre, 2007, Canada [19] | DB; P | 22, NR Obese women, 24 | NR | Isoflavones | Placebo capsules | a; b; c; d; |
| Anderson, 2007, America [39] | SB; P | 35, 45.20 Obese women, 16 | Keep daily records | Soy shakes | Casein shakes | a; d; e; f; |
| Anderson, 2005, America [40] | NB, P | 52, 47.40 Overweight or obese adults, 12 | Lifestyle dairy | Soy-based meal replacement | Milk-based meal replacement | a; f; |
| Indicators | Subgroups | No. of Studies | Net Change | 95% CI | p Value | I2 (%) |
|---|---|---|---|---|---|---|
| Body weight (kg) | All trials | 22 | −0.34 | −0.60, −0.08 | 0.009 * | 0.0 |
| Area | ||||||
| Asia | 9 | −0.37 | −0.65, −0.09 | 0.010 * | 0.0 | |
| North America | 11 | −0.17 | −0.79, 0.46 | 0.606 | 0.0 | |
| Menopausal status | ||||||
| Post-menopausal | 5 | −0.01 | −0.54, 0.52 | 0.976 | 0.0 | |
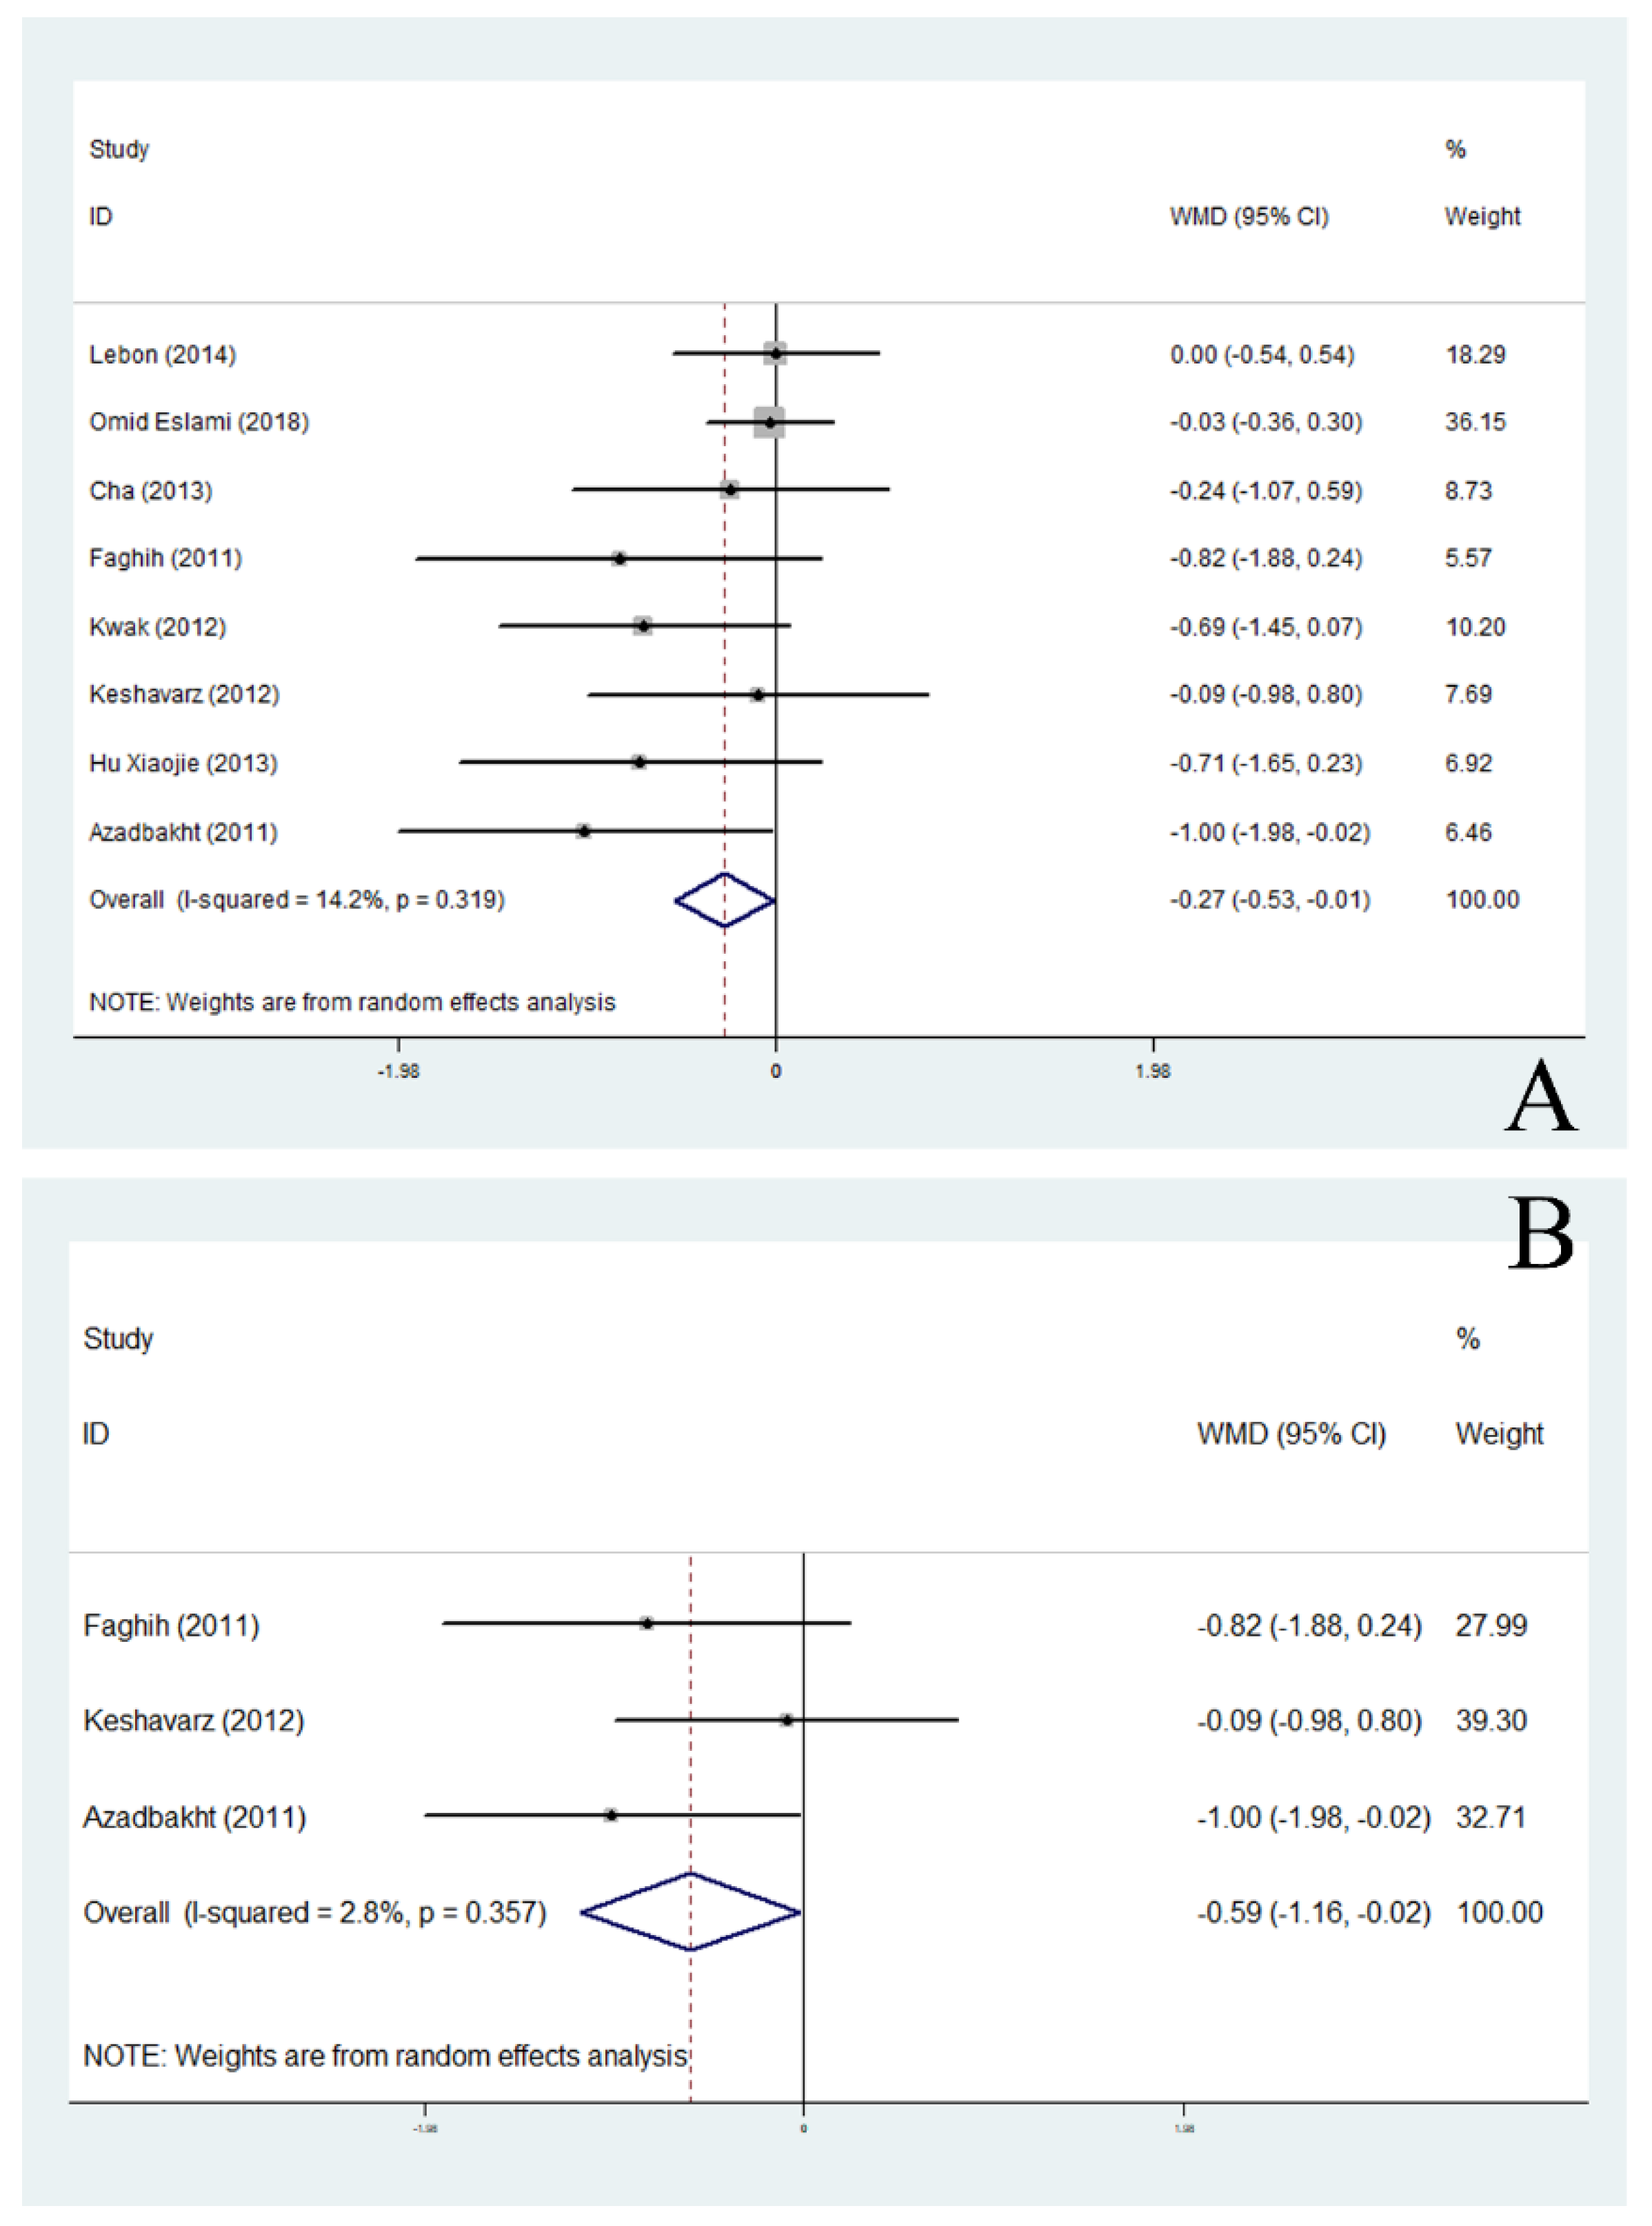
| Non-menopausal | 3 | −0.59 | −1.16, −0.02 | 0.041 * | 2.8 | |
| Sample | ||||||
| >Median | 10 | −0.39 | −0.78, −0.00 | 0.049 | 0.0 | |
| ≤Median | 12 | −0.30 | −0.64, 0.04 | 0.083 | 0.0 | |
| Blind method | ||||||
| DB | 9 | −0.31 | −0.65, 0.03 | 0.075 | 0.0 | |
| SB | 2 | 1.73 | −1.70, 5.16 | 0.324 | 0.0 | |
| BMI (kg/m2) | All trials | 16 | −0.23 | −0.45, −0.01 | 0.040 * | 0.0 |
| Area | ||||||
| Asia | 8 | −0.27 | −0.53, −0.01 | 0.042 * | 14.2 | |
| North America | 6 | 0.19 | −1.51, 1.90 | 0.826 | 0.0 | |
| Menopausal status | ||||||
| Post-menopausal | 5 | −0.02 | −0.55, 0.51 | 0.947 | 0.0 | |
| Non-menopausal | 3 | −0.59 | −1.16, −0.02 | 0.041 * | 2.8 | |
| Sample | ||||||
| >Median | 6 | −0.21 | −0.48, 0.06 | 0.463 | 0.0 | |
| ≤Median | 10 | 0.00 | −10.44, 10.44 | 0.818 | 0.0 | |
| Blind method | ||||||
| DB | 7 | −0.24 | −0.62, 0.15 | 0.228 | 0.0 | |
| SB | 1 | 3.60 | −7.31, 14.51 | 0.518 | - | |
| Body fat percentage (%) | All trials | 12 | −0.23 | −0.56, 0.09 | 0.154 | 0.0 |
| Area | ||||||
| Asia | 6 | −0.36 | −0.69, −0.03 | 0.032 * | 0.0 | |
| North America | 6 | 0.71 | −0.16, 1.58 | 0.108 | 0.0 | |
| Menopausal status | ||||||
| Post-menopausal | 4 | −0.01 | −0.54, 0.53 | 0.986 | 0.0 | |
| Non-menopausal | 1 | −0.82 | −1.88, 0.24 | 0.130 | - | |
| Sample | ||||||
| >Median | 4 | −0.16 | −0.83, 0.50 | 0.630 | 0.0 | |
| ≤Median | 8 | −0.25 | −0.66, 0.17 | 0.250 | 0.0 | |
| Blind method | ||||||
| DB | 7 | −0.25 | −0.62, 0.12 | 0.191 | 0.0 | |
| SB | 1 | 3.60 | −7.31, 14.51 | 0.518 | - | |
| Fat mass (kg) | All trials | 16 | −0.32 | −0.61, −0.03 | 0.031 * | 0.0 |
| Area | ||||||
| Asia | 6 | −0.36 | −0.69, −0.03 | 0.032 * | 0.0 | |
| North America | 9 | −0.18 | −0.80, 0.44 | 0.566 | 0.0 | |
| Menopausal status | ||||||
| Post-menopausal | 5 | −0.02 | −0.55, 0.51 | 0.947 | 0.0 | |
| Non-menopausal | 1 | −0.82 | −1.88, 0.24 | 0.130 | - | |
| Sample | ||||||
| >Median | 5 | −0.35 | −0.83, 0.13 | 0.149 | 0.0 | |
| ≤Median | 11 | −0.30 | −0.67, 0.07 | 0.109 | 0.0 | |
| Blind method | ||||||
| DB | 9 | −0.31 | −0.65, 0.03 | 0.072 | 0.0 | |
| SB | 2 | 1.73 | −1.70, 5.16 | 0.324 | 0.0 | |
| Waist circumference (cm) | All trials | 15 | −0.29 | −0.62, 0.04 | 0.083 | 0.0 |
| Area | ||||||
| Asia | 6 | −0.35 | −0.70, −0.00 | 0.049 * | 0.0 | |
| North America | 7 | 0.34 | −0.70, 1.39 | 0.517 | 0.0 | |
| Menopausal status | ||||||
| Post-menopausal | 4 | −0.02 | −0.55, 0.51 | 0.946 | 0.0 | |
| Non-menopausal | 3 | −0.59 | −1.16, −0.02 | 0.041 * | 2.8 | |
| Sample | ||||||
| >Median | 6 | −0.38 | −1.05, 0.30 | 0.275 | 0.0 | |
| ≤Median | 9 | −0.27 | −0.64, 0.11 | 0.168 | 0.0 | |
| Blind method | ||||||
| DB | 4 | −0.02 | −0.55, 0.51 | 0.946 | 0.0 | |
| SB | 2 | 1.73 | −1.70, 5.16 | 0.324 | 0.0 | |
| Hip circum-ference (cm) | All trials | 6 | −0.39 | −0.85, 0.07 | 0.099 | 6.1 |
| Area | ||||||
| Asia | 3 | −0.46 | −1.10, 0.18 | 0.161 | 48.2 | |
| North America | 2 | 0.58 | −3.45, 4.60 | 0.779 | 0.0 | |
| Menopausal status | ||||||
| Post-menopausal | 2 | 0.00 | −0.53, 0.54 | 0.996 | 0.0 | |
| Non-menopausal | 1 | −1.00 | −1.98, −0.02 | 0.046 | - | |
| Sample | ||||||
| >Median | 2 | −1.19 | −3.65, 1.27 | 0.343 | - | |
| ≤Median | 4 | −0.43 | −1.02, 0.17 | 0.157 | 31.1 | |
| Blind method | ||||||
| DB | 2 | 0.00 | −0.53, 0.54 | 0.996 | 0.0 | |
| SB | 1 | 3.60 | −7.31, 14.51 | 0.518 | - |
© 2019 by the authors. Licensee MDPI, Basel, Switzerland. This article is an open access article distributed under the terms and conditions of the Creative Commons Attribution (CC BY) license (http://creativecommons.org/licenses/by/4.0/).
Share and Cite
Mu, Y.; Kou, T.; Wei, B.; Lu, X.; Liu, J.; Tian, H.; Zhang, W.; Liu, B.; Li, H.; Cui, W.; et al. Soy Products Ameliorate Obesity-Related Anthropometric Indicators in Overweight or Obese Asian and Non-Menopausal Women: A Meta-Analysis of Randomized Controlled Trials. Nutrients 2019, 11, 2790. https://doi.org/10.3390/nu11112790
Mu Y, Kou T, Wei B, Lu X, Liu J, Tian H, Zhang W, Liu B, Li H, Cui W, et al. Soy Products Ameliorate Obesity-Related Anthropometric Indicators in Overweight or Obese Asian and Non-Menopausal Women: A Meta-Analysis of Randomized Controlled Trials. Nutrients. 2019; 11(11):2790. https://doi.org/10.3390/nu11112790
Chicago/Turabian StyleMu, Yuze, Tingyan Kou, Boyang Wei, Xuezhao Lu, Jingyao Liu, Huimin Tian, Wenwen Zhang, Bingkun Liu, Huihui Li, Wenbo Cui, and et al. 2019. "Soy Products Ameliorate Obesity-Related Anthropometric Indicators in Overweight or Obese Asian and Non-Menopausal Women: A Meta-Analysis of Randomized Controlled Trials" Nutrients 11, no. 11: 2790. https://doi.org/10.3390/nu11112790
APA StyleMu, Y., Kou, T., Wei, B., Lu, X., Liu, J., Tian, H., Zhang, W., Liu, B., Li, H., Cui, W., & Wang, Q. (2019). Soy Products Ameliorate Obesity-Related Anthropometric Indicators in Overweight or Obese Asian and Non-Menopausal Women: A Meta-Analysis of Randomized Controlled Trials. Nutrients, 11(11), 2790. https://doi.org/10.3390/nu11112790


