Meeting Minimum ESPEN Energy Recommendations Is Not Enough to Maintain Muscle Mass in Head and Neck Cancer Patients

 and
and
Abstract
:1. Introduction
2. Materials and Methods
2.1. Dietary Intake Analysis
2.2. European Society of Parenteral and Enteral Nutrition Recommendations
2.3. Body Composition Assessment
2.4. Statistical Analysis
3. Results
3.1. Patient Characteristics
3.2. Changes in Body Composition and Dietary Intake
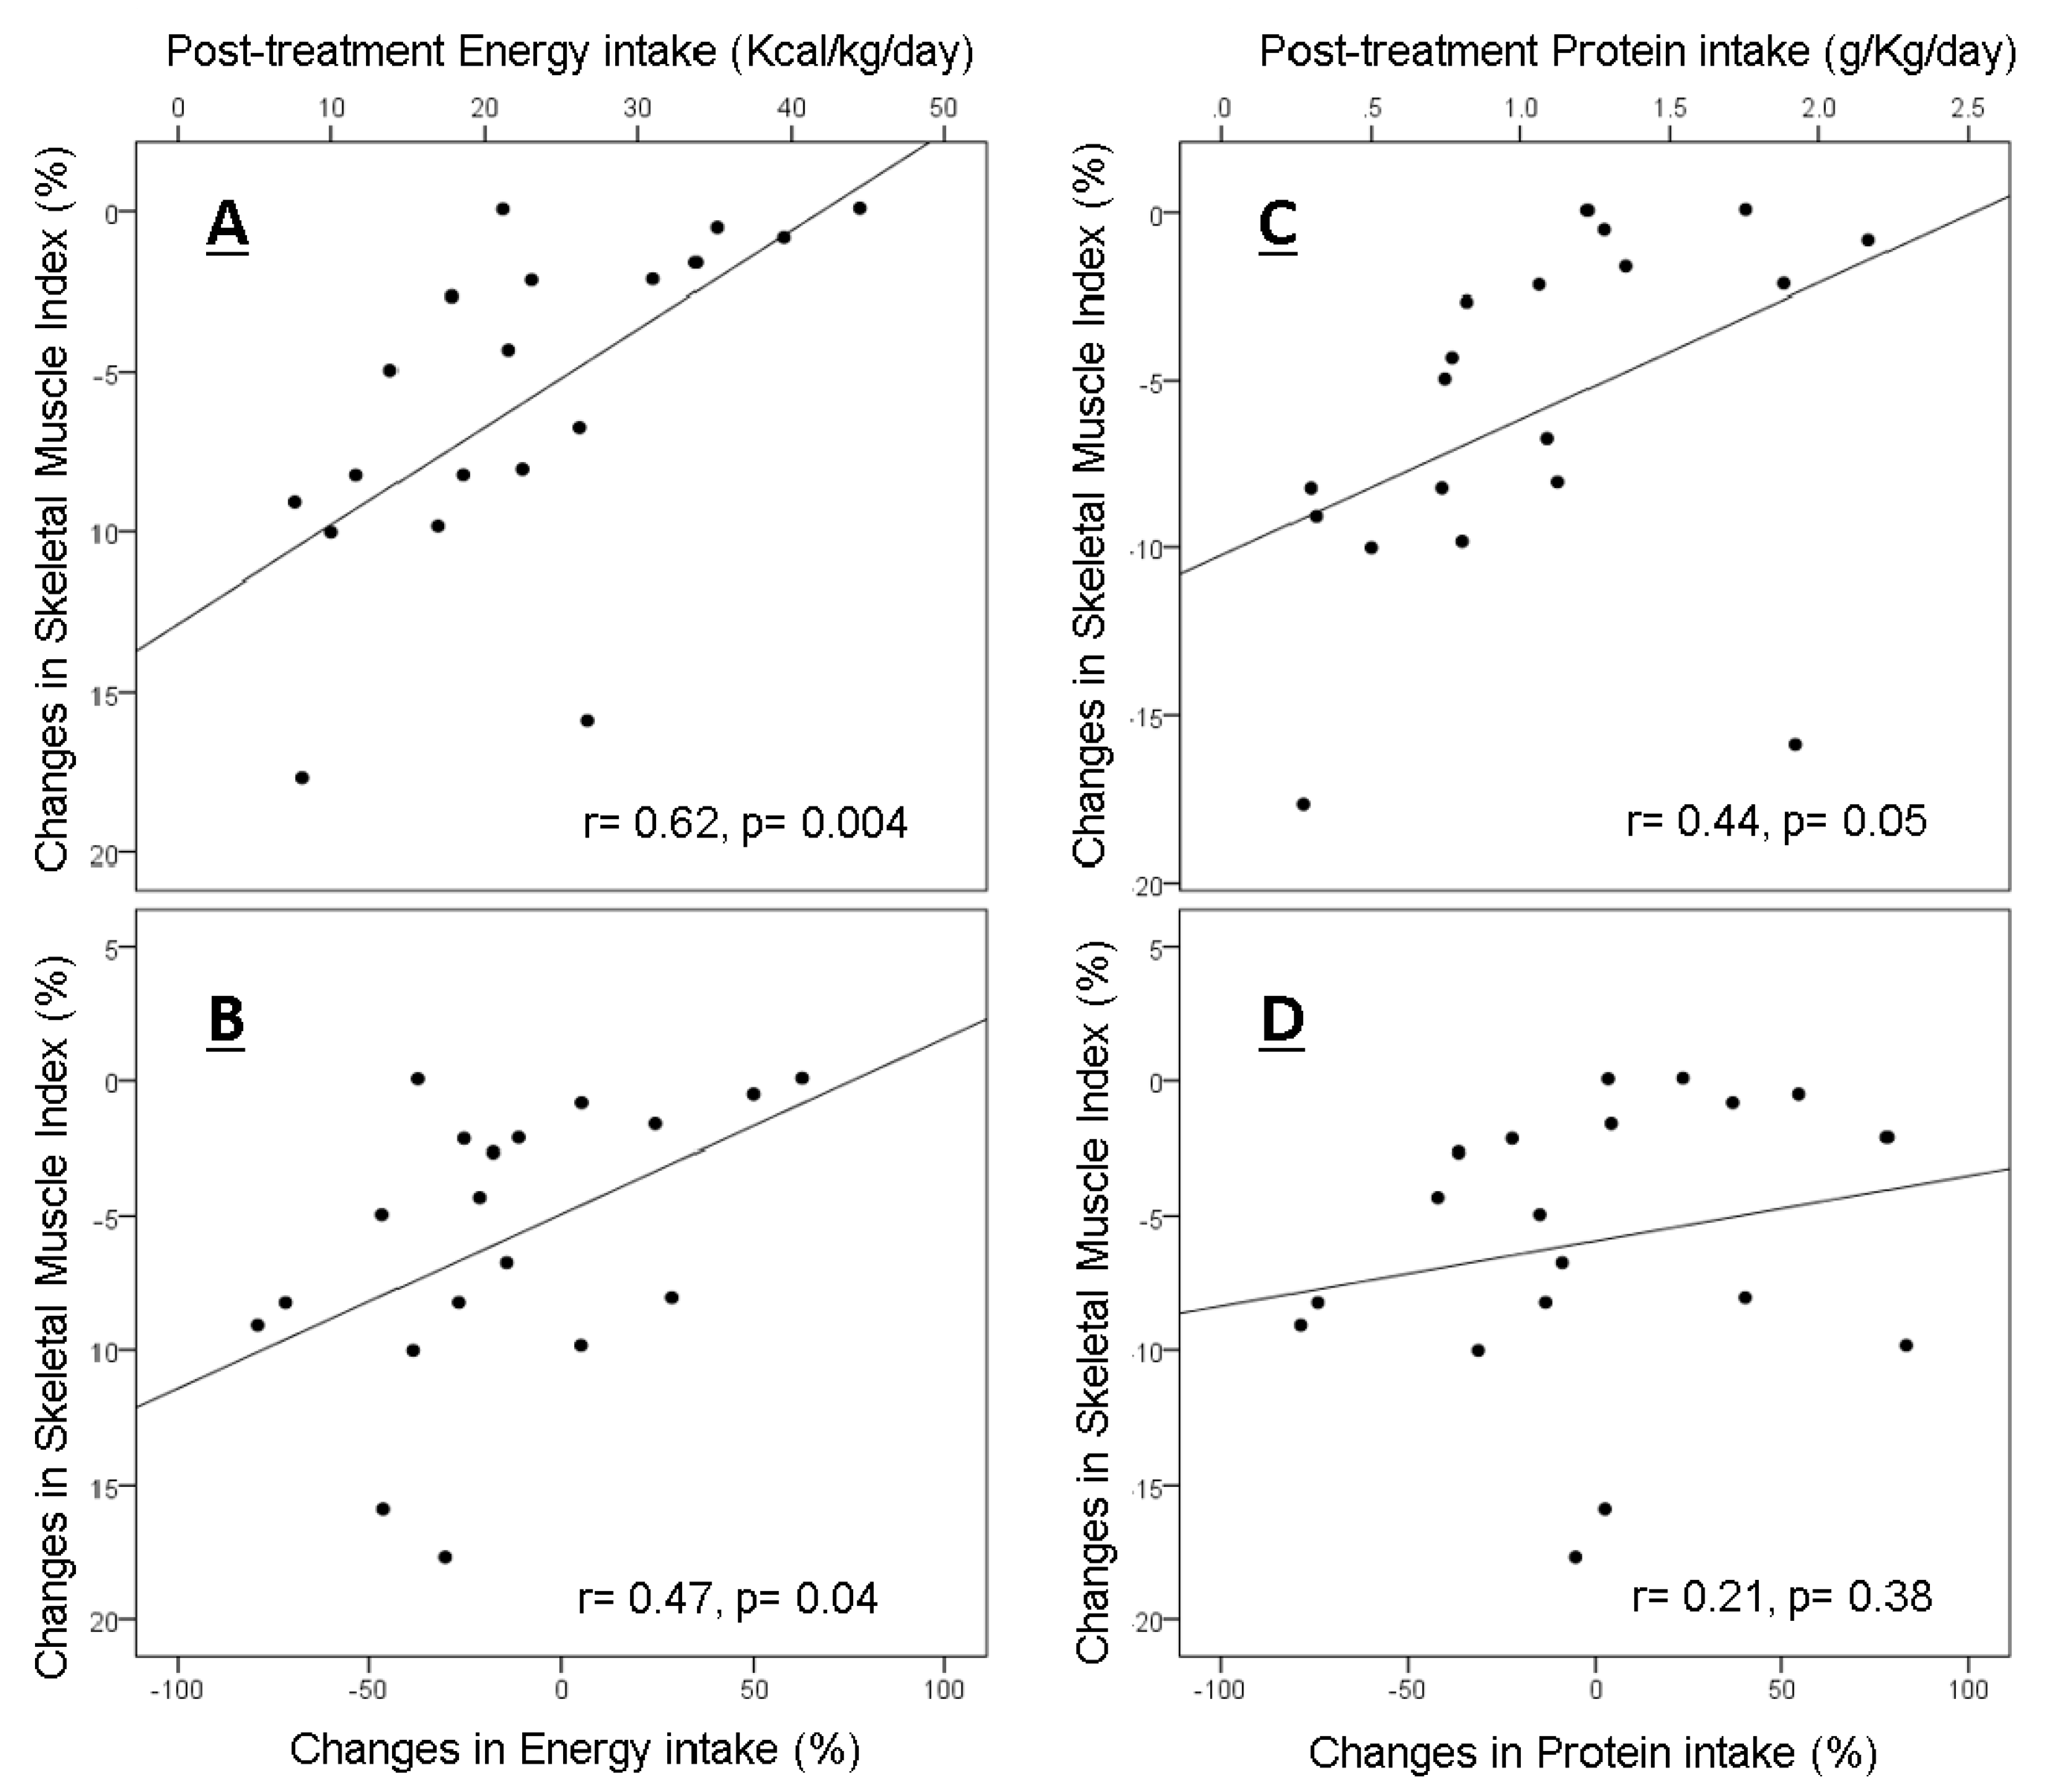
3.3. Correlations between Post-Treatment Intakes and Changes in Skeletal Muscle
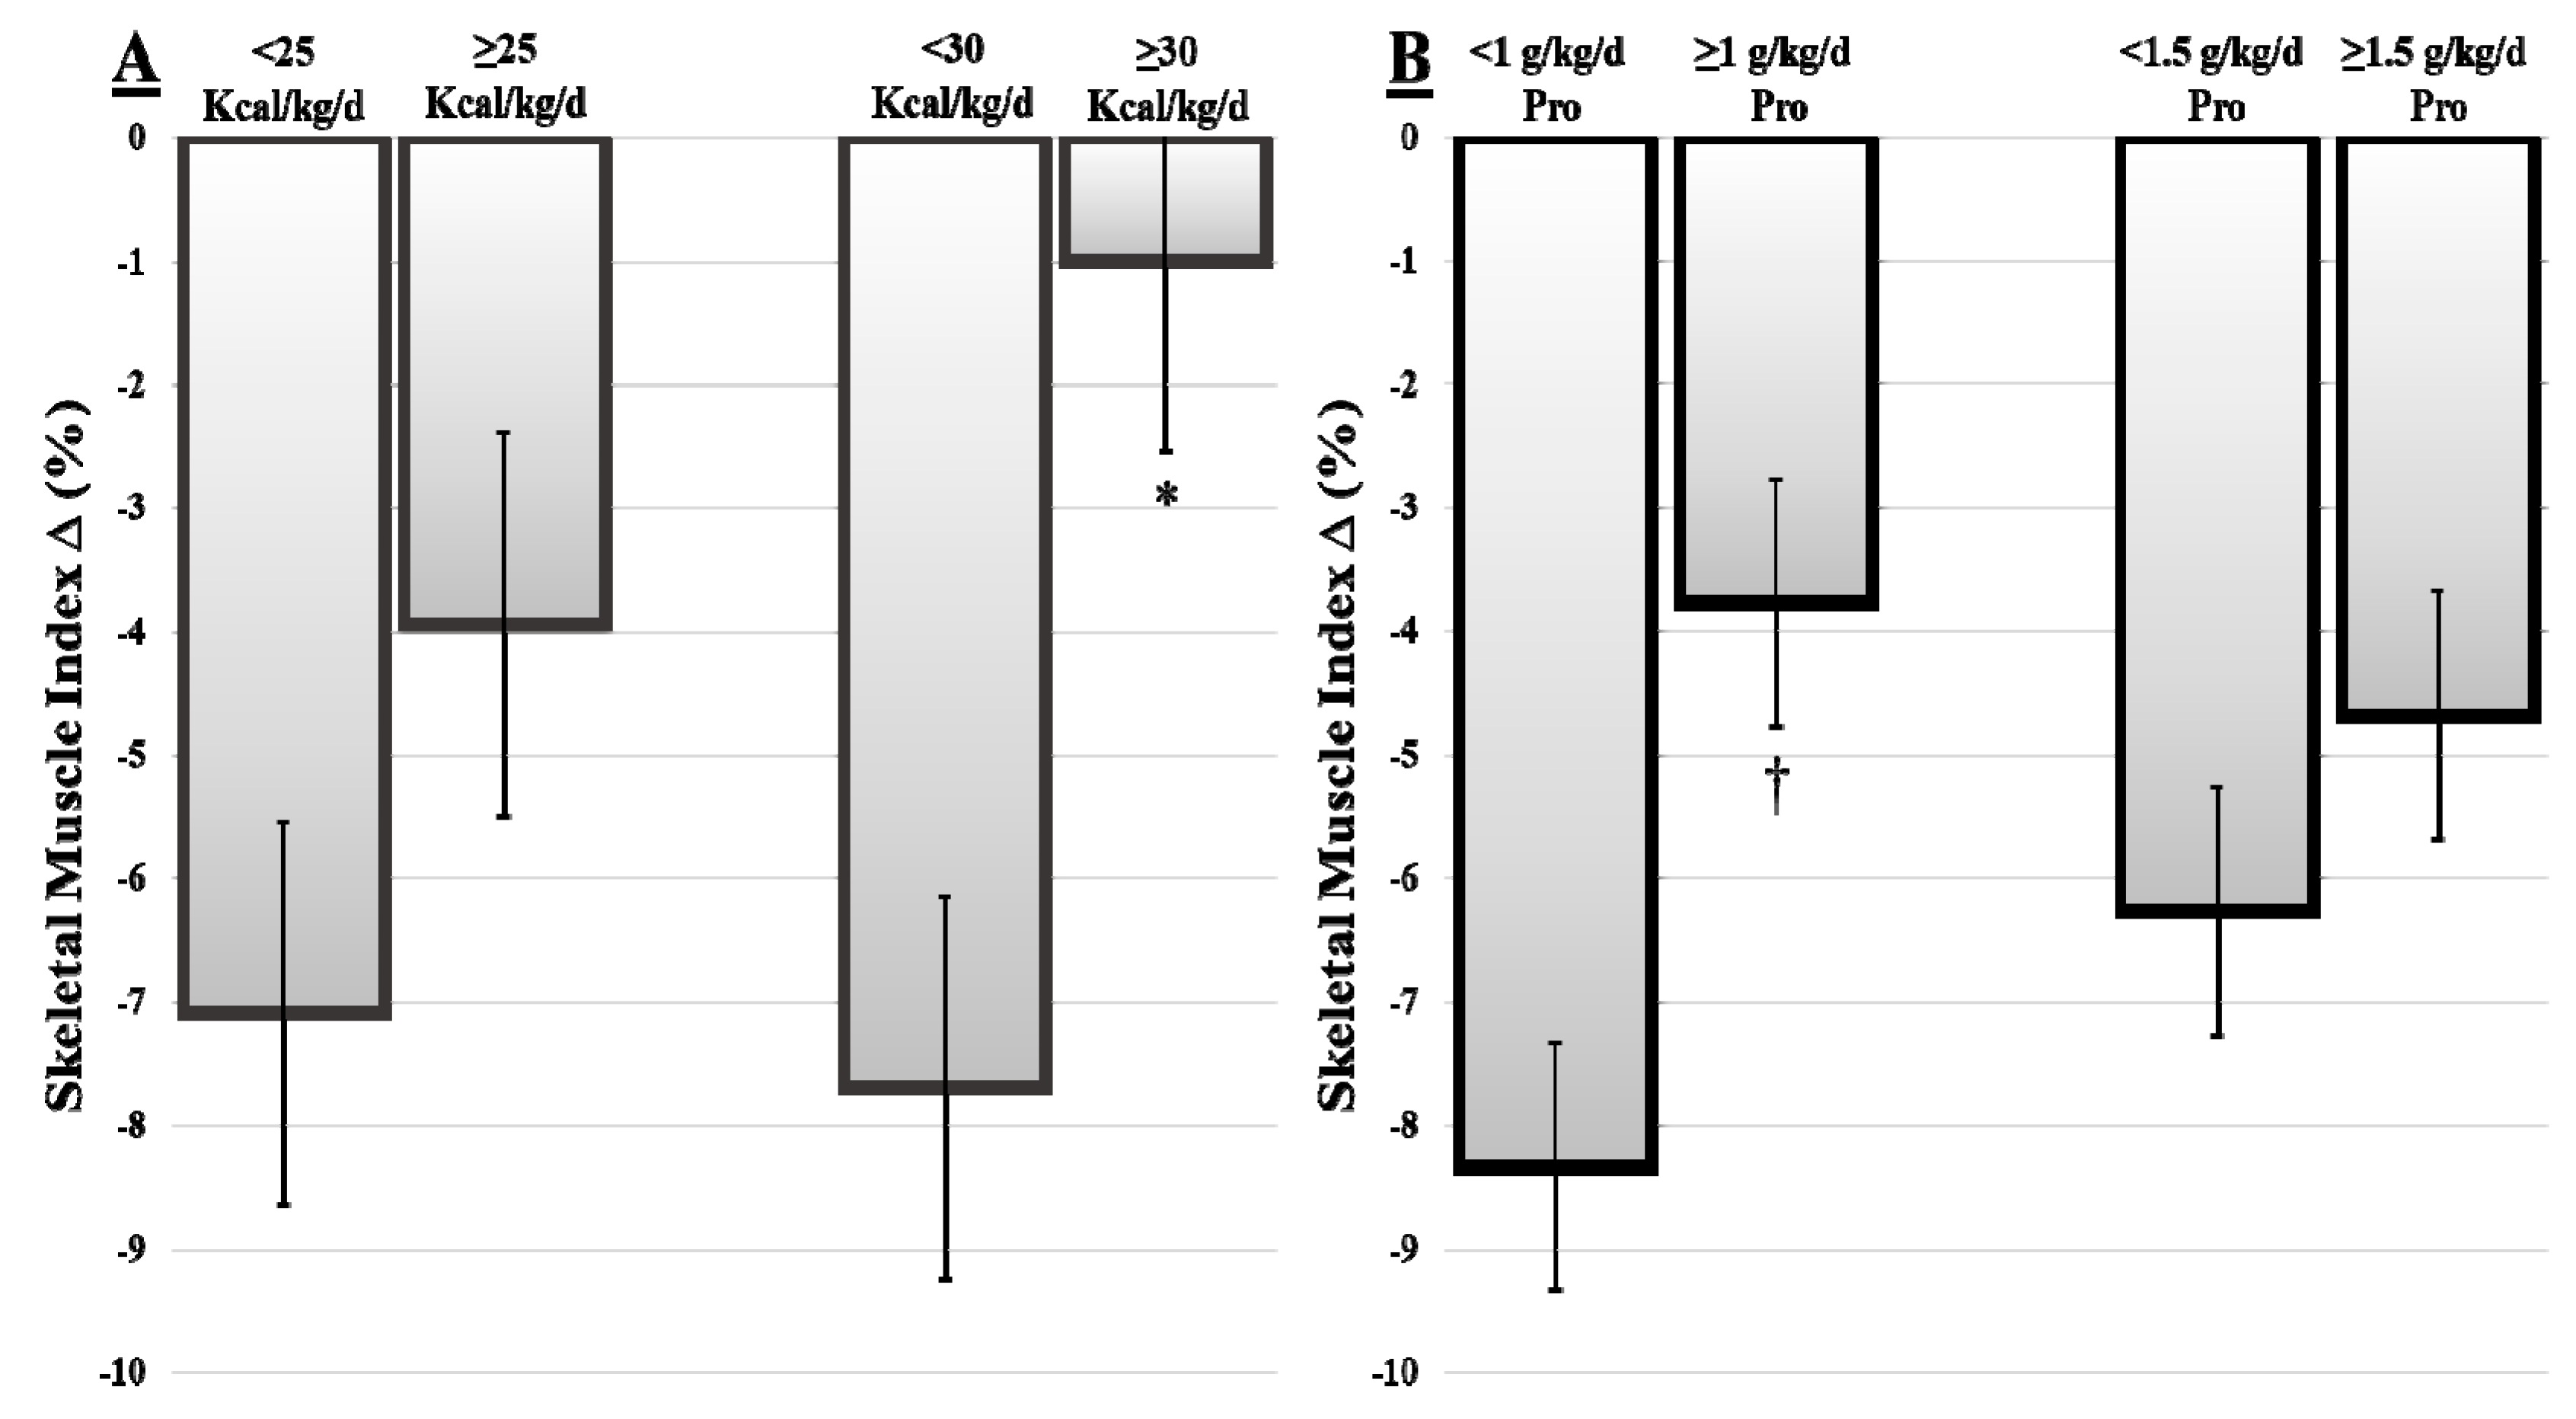
3.4. Skeletal Muscle Loss Based on Dietary Intake Stratifications
3.5. Skeletal Muscle Loss Based on Baseline Adiposity
4. Discussion
5. Conclusions
Author Contributions
Funding
Acknowledgments
Conflicts of Interest
References
- Jager-Wittenaar, H.; Dijkstra, P.U.; Vissink, A.; Langendijk, J.A.; Van Der Laan, B.F.A.M.; Pruim, J.; Roodenburg, J.L. Changes in nutritional status and dietary intake during and after head and neck cancer treatment. Head Neck 2011, 33, 863–870. [Google Scholar] [CrossRef] [PubMed]
- Baxi, S.S.; Jones, L.; Eaton, A.; Gandelman, S.; Halpenny, D.; Jackson, J.; Kurtzman, R.; McBride, S.M.; Plodkowski, A.; Pfister, D.G. Changes in body composition and prognostic importance of sarcopenia in patients receiving CTRT for oropharyngeal cancer. J. Clin. Oncol. 2016, 34 (Suppl. 15), 6077. [Google Scholar] [CrossRef]
- Sealy, M.J.; Dechaphunkul, T.; van der Schans, C.P.; Krijnen, W.P.; Roodenburg, J.L.N.; Walker, J.; Harriët, J.W.; Baracos, V.E. Low muscle mass is associated with early termination of chemotherapy related to toxicity in patients with head and neck cancer. Clin. Nutr. 2019, in press. [Google Scholar] [CrossRef] [PubMed]
- Kubrak, C.; Olson, K.; Jha, N.; Jensen, L.; McCargar, L.; Seikaly, H.; Harris, J.; Scrimger, R.; Parliament, M. Baracos VE Nutrition impact symptoms: Key determinants of reduced dietary intake, weight loss, and reduced functional capacity of patients with head and neck cancer before treatment. Head Neck 2010, 32, 290–300. [Google Scholar] [PubMed]
- Kubrak, C.; Olson, K.; Jha, N.; Scrimger, R.; Parliament, M.; McCargar, L.; Koski, S.; Baracos, V.E. Clinical determinants of weight loss in patients receiving radiation and chemoirradiation for head and neck cancer: A prospective longitudinal view. Head Neck 2013, 35, 695–703. [Google Scholar] [CrossRef] [PubMed]
- Kazemi-Bajestani, S.M.R.; Mazurak, V.C.; Baracos, V. Computed tomography-defined muscle and fat wasting are associated with cancer clinical outcomes. Semin. Cell Dev. Biol. 2016, 54, 2–10. [Google Scholar] [CrossRef] [PubMed]
- Martin, L.; Birdsell, L.; Macdonald, N.; Reiman, T.; Clandinin, M.T.; McCargar, L.J.; Murphy, R.; Ghosh, S.; Sawyer, M.B.; Baracos, V.E. Cancer cachexia in the age of obesity: Skeletal muscle depletion is a powerful prognostic factor, independent of body mass index. J. Clin. Oncol. 2013, 31, 1539–1547. [Google Scholar] [CrossRef] [PubMed]
- Fearon, K.C.H.; Glass, D.J.; Guttridge, D.C. Cancer cachexia: Mediators, signaling, and metabolic pathways. Cell Metab. 2012, 16, 153–166. [Google Scholar] [CrossRef] [PubMed]
- Ebadi, M.; Mazurak, V.C. Evidence and mechanisms of fat depletion in cancer. Nutrients 2014, 6, 5280–5297. [Google Scholar] [CrossRef] [PubMed]
- Silver, H.J.; Dietrich, M.S.; Murphy, B.A. Changes in body mass, energy balance, physical function, and inflammatory state in patients with locally advanced head and neck cancer treated with concurrent chemoradiation after low-dose induction chemotherapy. Head Neck 2007, 29, 893–900. [Google Scholar] [CrossRef] [PubMed]
- Giles, K.H.; Kubrak, C.; Baracos, V.E.; Olson, K.; Mazurak, V.C. Recommended European Society of Parenteral and Enteral Nutrition protein and energy intakes and weight loss in patients with head and neck cancer. Head Neck 2016, 38, 1248–1257. [Google Scholar] [CrossRef] [PubMed]
- Prado, C.; Maia, Y.; Ormsbee, M.; Sawyer, M.; Baracos, V. Assessment of Nutritional Status in Cancer—The Relationship Between Body Composition and Pharmacokinetics. Anti-Cancer Agents Med. Chem. 2013, 13, 1197–1203. [Google Scholar] [CrossRef] [PubMed]
- Arends, J.; Bachmann, P.; Baracos, V.; Barthelemy, N.; Bertz, H.; Bozzetti, F.; Fearon, K.; Hütterer, E.; Isenring, E.; Kaasa, S.; et al. ESPEN guidelines on nutrition in cancer patients. Clin. Nutr. 2017, 36, 11–48. [Google Scholar] [CrossRef] [PubMed]
- Alvarez-Camacho, M.; Martınez-Michel, L.; Gonella, S.; Scrimger, R.A.; Chu, K.P.; Wismer, W.V. Physical symptom burden of post-treatment head and neck cancer patients influences their characterization of food: Findings of a repertory grid study. Eur. J. Oncol. Nurs. 2016, 22, 54–62. [Google Scholar] [CrossRef] [PubMed]
- Nejatinamini, S.; Debenham, B.J.; Clugston, R.D.; Mawani, A.; Parliament, M.; Wismer, W.V.; Mazurak, V.C. Poor vitamin status is associated with skeletal muscle loss and mucositis in head and neck cancer patients. Nutrients 2018, 10, 1236. [Google Scholar] [CrossRef] [PubMed]
- Shen, W.; Punyanitya, M.; Wang, Z.; Gallagher, D.; St-Onge, M.-P.; Albu, J.; Heymsfield, S.B.; Heshka, S. Visceral adipose tissue: Relations between single-slice areas and total volume. Am. J. Clin. Nutr. 2004, 80, 271–278. [Google Scholar] [CrossRef] [PubMed]
- Mourtzakis, M.; Prado, C.M.; Lieffers, J.R.; Reiman, T.; McCargar, L.J.; Baracos, V.E. A practical and precise approach to quantification of body composition in cancer patients using computed tomography images acquired during routine care. Appl. Physiol. Nutr. Metab. 2008, 33, 997–1006. [Google Scholar] [CrossRef] [PubMed]
- Murphy, R.A.; Mourtzakis, M.; Chu, Q.S.C.; Baracos, V.E.; Reiman, T.; Mazurak, V.C. Nutritional intervention with fish oil provides a benefit over standard of care for weight and skeletal muscle mass in patients with nonsmall cell lung cancer receiving chemotherapy. Cancer 2011, 117, 1775–1782. [Google Scholar] [CrossRef] [PubMed]
- Cederholm, T.; Bosaeus, I.; Barazzoni, R.; Bauer, J.; Van Gossum, A.; Klek, S.; Muscaritoli, M.; Nyulasi, I.; Ockenga, J.; Schneider, S.M.; et al. Diagnostic criteria for malnutrition—An ESPEN Consensus Statement. Clin. Nutr. 2015, 34, 335–340. [Google Scholar] [CrossRef] [PubMed]
- Cho, Y.; Kim, J.W.; Keum, K.C.; Lee, C.G.; Jeung, H.C.; Lee, I.J. Prognostic significance of sarcopenia with inflammation in patients with head and neck cancer who underwent definitive chemoradiotherapy. Front. Oncol. 2018, 8, 457. [Google Scholar] [CrossRef] [PubMed]
- Baracos, V.E. Skeletal muscle anabolism in patients with advanced cancer. Lancet Oncol. 2015, 16, 13–14. [Google Scholar] [CrossRef]
- Bozzetti, F. Nutritional support of the oncology patient. Crit. Rev. Oncol. Hematol. 2013, 87, 172–200. [Google Scholar] [CrossRef] [PubMed]
- Gonzalez, M.C.; Pastore, C.A.; Orlandi, S.P.; Heymsfield, S.B. Obesity paradox in cancer: New insights provided by body composition. Am. J. Clin. Nutr. 2014, 99, 999–1005. [Google Scholar] [CrossRef] [PubMed]
- Kasenda, B.; Bass, A.; Koeberle, D.; Pestalozzi, B.; Borner, M.; Herrmann, R.; Jost, L.; Lohri, A.; Hess, V. Survival in overweight patients with advanced pancreatic carcinoma: A multicentre cohort study. BMC Cancer 2014, 14, 728. [Google Scholar] [CrossRef] [PubMed] [Green Version]
- Vrieling, A.; Kampman, E. The role of body mass index, physical activity, and diet in colorectal cancer recurrence and survival: A review of the literature. Am. J. Clin. Nutr. 2010, 92, 471–490. [Google Scholar] [CrossRef] [PubMed]
- Koster, A.; Ding, J.; Stenholm, S.; Caserotti, P.; Houston, D.K.; Nicklas, B.J.; You, T.; Lee, J.S.; Visser, M.; Newman, A.B.; et al. Does the amount of fat mass predict age-related loss of lean mass, muscle strength, and muscle quality in older adults? J. Gerontol. Ser. A Biol. Sci. Med. Sci. 2011, 66, 888–895. [Google Scholar] [CrossRef] [PubMed]
- Dalal, S.; Hui, D.; Bidaut, L.; Lem, K.; Del Fabbro, E.; Crane, C.; Reyes-Gibby, C.C.; Bedi, D.; Bruera, E. Relationships among body mass index, longitudinal body composition alterations, and survival in patients with locally advanced pancreatic cancer receiving chemoradiation: A pilot study. J. Pain Symptom Manag. 2012, 44, 181–191. [Google Scholar] [CrossRef] [PubMed]
- Ebadi, M.; Martin, L.; Ghosh, S.; Field, C.J.; Lehner, R.; Baracos, V.E.; Mazurak, V.C. Subcutaneous adiposity is an independent predictor of mortality in cancer patients. Br. J. Cancer 2017, 117, 148–155. [Google Scholar] [CrossRef] [PubMed] [Green Version]
- Swartz, J.E.; Pothen, A.J.; Wegner, I.; Smid, E.J.; Swart, K.M.A.; de Bree, R.; Leenen, L.P.; Grolman, W. Feasibility of using head and neck CT imaging to assess skeletal muscle mass in head and neck cancer patients. Oral Oncol. 2016, 62, 28–33. [Google Scholar] [CrossRef] [PubMed]
- Tisdale, M.J. Cancer anorexia and cachexia. Nutrition 2001, 17, 438–442. [Google Scholar] [CrossRef]
- Fearon, K.; Arends, J.; Baracos, V. Understanding the mechanisms and treatment options in cancer cachexia. Nat. Rev. Clin. Oncol. 2013, 10, 90–99. [Google Scholar] [CrossRef] [PubMed]
- Salas, S.; Deville, J.L.; Giorgi, R.; Pignon, T.; Bagarry, D.; Barrau, K.; Zanaret, M.; Giovanni, A.; Bourgeois, A.; Favre, R.; et al. Nutritional factors as predictors of response to radio-chemotherapy and survival in unresectable squamous head and neck carcinoma. Radiother. Oncol. 2008, 87, 195–200. [Google Scholar] [CrossRef] [PubMed]
- MacDonald, A.J.; Johns, N.; Stephens, N.; Greig, C.; Ross, J.A.; Small, A.C.; Husi, H.; Fearon, K.C.; Preston, T. Habitual myofibrillar protein synthesis is normalin patients with upper GI cancer cachexia. Clin. Cancer Res. 2015, 21, 1734–1740. [Google Scholar] [CrossRef] [PubMed]
- Solheim, T.S.; Laird, B.J.A.; Balstad, T.R.; Bye, A.; Stene, G.; Baracos, V.; Strasser, F.; Griffiths, G.; Maddocks, M.; Fallon, M.; et al. Cancer cachexia: Rationale for the MENAC (Multimodal-Exercise, Nutrition and Anti-inflammatory medication for Cachexia) trial. BMJ Support. Palliat. Care 2018, 8, 258–265. [Google Scholar] [CrossRef] [PubMed] [Green Version]
- Lonbro, S.; Dalgas, U.; Primdahl, H.; Johansen, J.; Nielsen, J.L.; Overgaard, J.; Overgaard, K. Lean body mass and muscle function in head and neck cancer patients and healthy individuals-results from the DAHANCA 25 study. Acta. Oncol. 2013, 52, 1543–1551. [Google Scholar] [CrossRef] [PubMed] [Green Version]
- Capozzi, L.C.; Lau, H.; Reimer, R.A.; McNeely, M.; Giese-Davis, J.; Culos-Reed, S.N. Exercise and nutrition for head and neck cancer patients: A patient oriented, clinic-supported randomized controlled trial. BMC Cancer 2012, 12, 446. [Google Scholar] [CrossRef] [PubMed] [Green Version]

| Characteristics | Baseline |
|---|---|
| Age, years | |
| Mean ± SD | 57.8 ± 10.8 |
| Range | 41–84 |
| Sex | |
| Male n (%) | 32 (78) |
| BMI, (kg/m2) | |
| Mean ± SD | 28.4 ± 5.1 |
| Range | 19.1–43.6 |
| AJCC staging * n (%) | |
| I | 1 (2) |
| II | 3 (7) |
| III | 21 (51) |
| IV | 16 (39) |
| Tumor Site; n (%) | |
| Lip/oral cavity | 15 (36) |
| Pharynx | 22 (54) |
| Larynx | 2 (5) |
| Salivary gland | 2 (5) |
| Mode of Treatment; n (%) | |
| RT | 6 (15) |
| Surgery RT | 5 (12) |
| Chemoradiotherapy | 25 (61) |
| Surgery chemoradiotherapy | 5 (12) |
| Baseline | Post-Treatment | Mean ∆ | p-Value | |
|---|---|---|---|---|
| Weight (kg) | 85.5 ± 16.4 | 78.5 ± 13.9 | −6.9 ± 4.9 | <0.001 |
| SMI (cm2/m2) | 52.2 ± 10.4 | 45.7 ± 8.6 | −5.9 ± 4.3 | <0.001 |
| Estimated Skeletal Muscle (kg) | 27.9 ± 6.1 | 24.8 ± 5.2 | −5.3 ± 2.2 | <0.001 |
| TATI (cm2/m2) | 128.0 ± 56.3 | 92.2 ± 49.2 | −36.4 ± 38.4 | <0.001 |
| SATI (cm2/m2) | 67.1 ± 41.9 | 51.4 ± 32.9 | −18.0 ± 22.5 | <0.001 |
| VATI (cm2/m2) | 57.7 ± 27.6 | 38.1 ± 23.5 | −18.1 ± 22.8 | <0.001 |
| Energy Intake (kcal/day) | 2054 ± 720 | 1637 ± 599 | −416 ± 933 | 0.029 |
| Energy Intake (kcal/kg/day) | 25.1 ± 7.9 | 22.2 ± 9.6 | −2.8 ± 11 | NS |
| Protein Intake (g/day) | 91.7 ± 34 | 73.9 ± 33 | −17.8 ± 39.6 | 0.028 |
| Protein Intake (g/kg/day) | 1.1 ± 0.4 | 1.0 ± 0.5 | −0.1 ± 0.4 | NS |
© 2019 by the authors. Licensee MDPI, Basel, Switzerland. This article is an open access article distributed under the terms and conditions of the Creative Commons Attribution (CC BY) license (http://creativecommons.org/licenses/by/4.0/).
Share and Cite
McCurdy, B.; Nejatinamini, S.; Debenham, B.J.; Álvarez-Camacho, M.; Kubrak, C.; Wismer, W.V.; Mazurak, V.C. Meeting Minimum ESPEN Energy Recommendations Is Not Enough to Maintain Muscle Mass in Head and Neck Cancer Patients. Nutrients 2019, 11, 2743. https://doi.org/10.3390/nu11112743
McCurdy B, Nejatinamini S, Debenham BJ, Álvarez-Camacho M, Kubrak C, Wismer WV, Mazurak VC. Meeting Minimum ESPEN Energy Recommendations Is Not Enough to Maintain Muscle Mass in Head and Neck Cancer Patients. Nutrients. 2019; 11(11):2743. https://doi.org/10.3390/nu11112743
Chicago/Turabian StyleMcCurdy, Benjamin, Sara Nejatinamini, Brock J. Debenham, Mirey Álvarez-Camacho, Catherine Kubrak, Wendy V. Wismer, and Vera C. Mazurak. 2019. "Meeting Minimum ESPEN Energy Recommendations Is Not Enough to Maintain Muscle Mass in Head and Neck Cancer Patients" Nutrients 11, no. 11: 2743. https://doi.org/10.3390/nu11112743
APA StyleMcCurdy, B., Nejatinamini, S., Debenham, B. J., Álvarez-Camacho, M., Kubrak, C., Wismer, W. V., & Mazurak, V. C. (2019). Meeting Minimum ESPEN Energy Recommendations Is Not Enough to Maintain Muscle Mass in Head and Neck Cancer Patients. Nutrients, 11(11), 2743. https://doi.org/10.3390/nu11112743