Amino Acid Availability of a Dairy and Vegetable Protein Blend Compared to Single Casein, Whey, Soy, and Pea Proteins: A Double-Blind, Cross-Over Trial


Abstract
:1. Introduction
2. Materials and Methods
2.1. Subjects
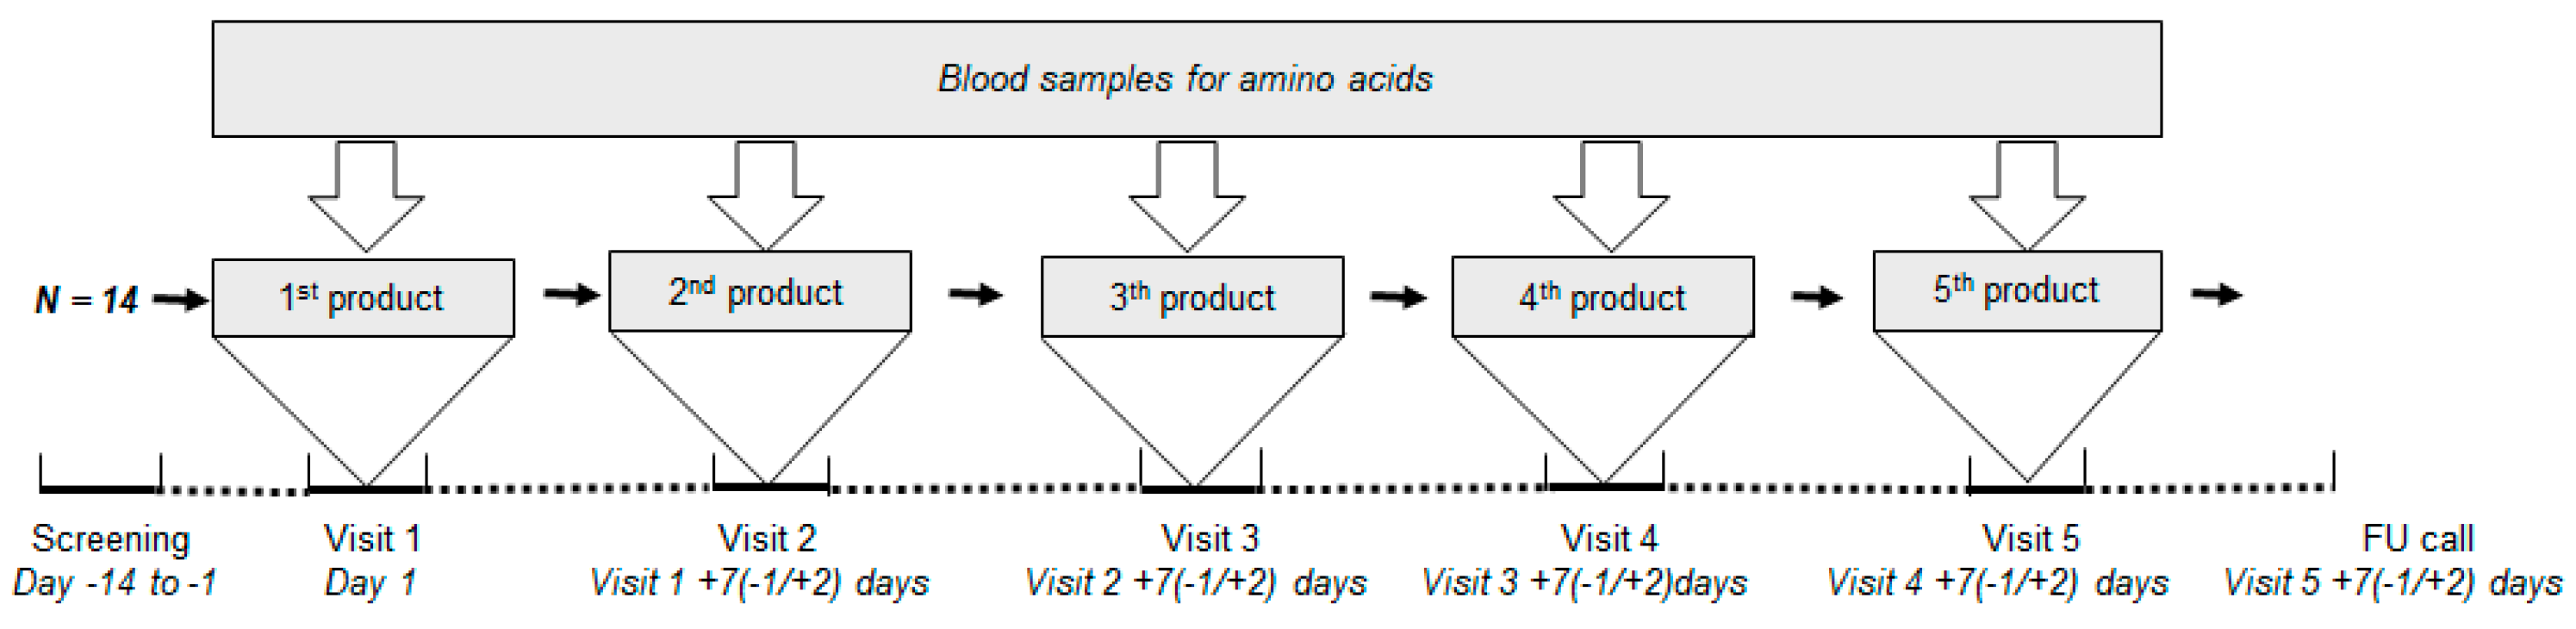
2.2. Study Design
2.3. Study Products
2.4. Blood Analysis
2.5. Outcome Parameters and Statistical Analysis
3. Results
3.1. Subjects
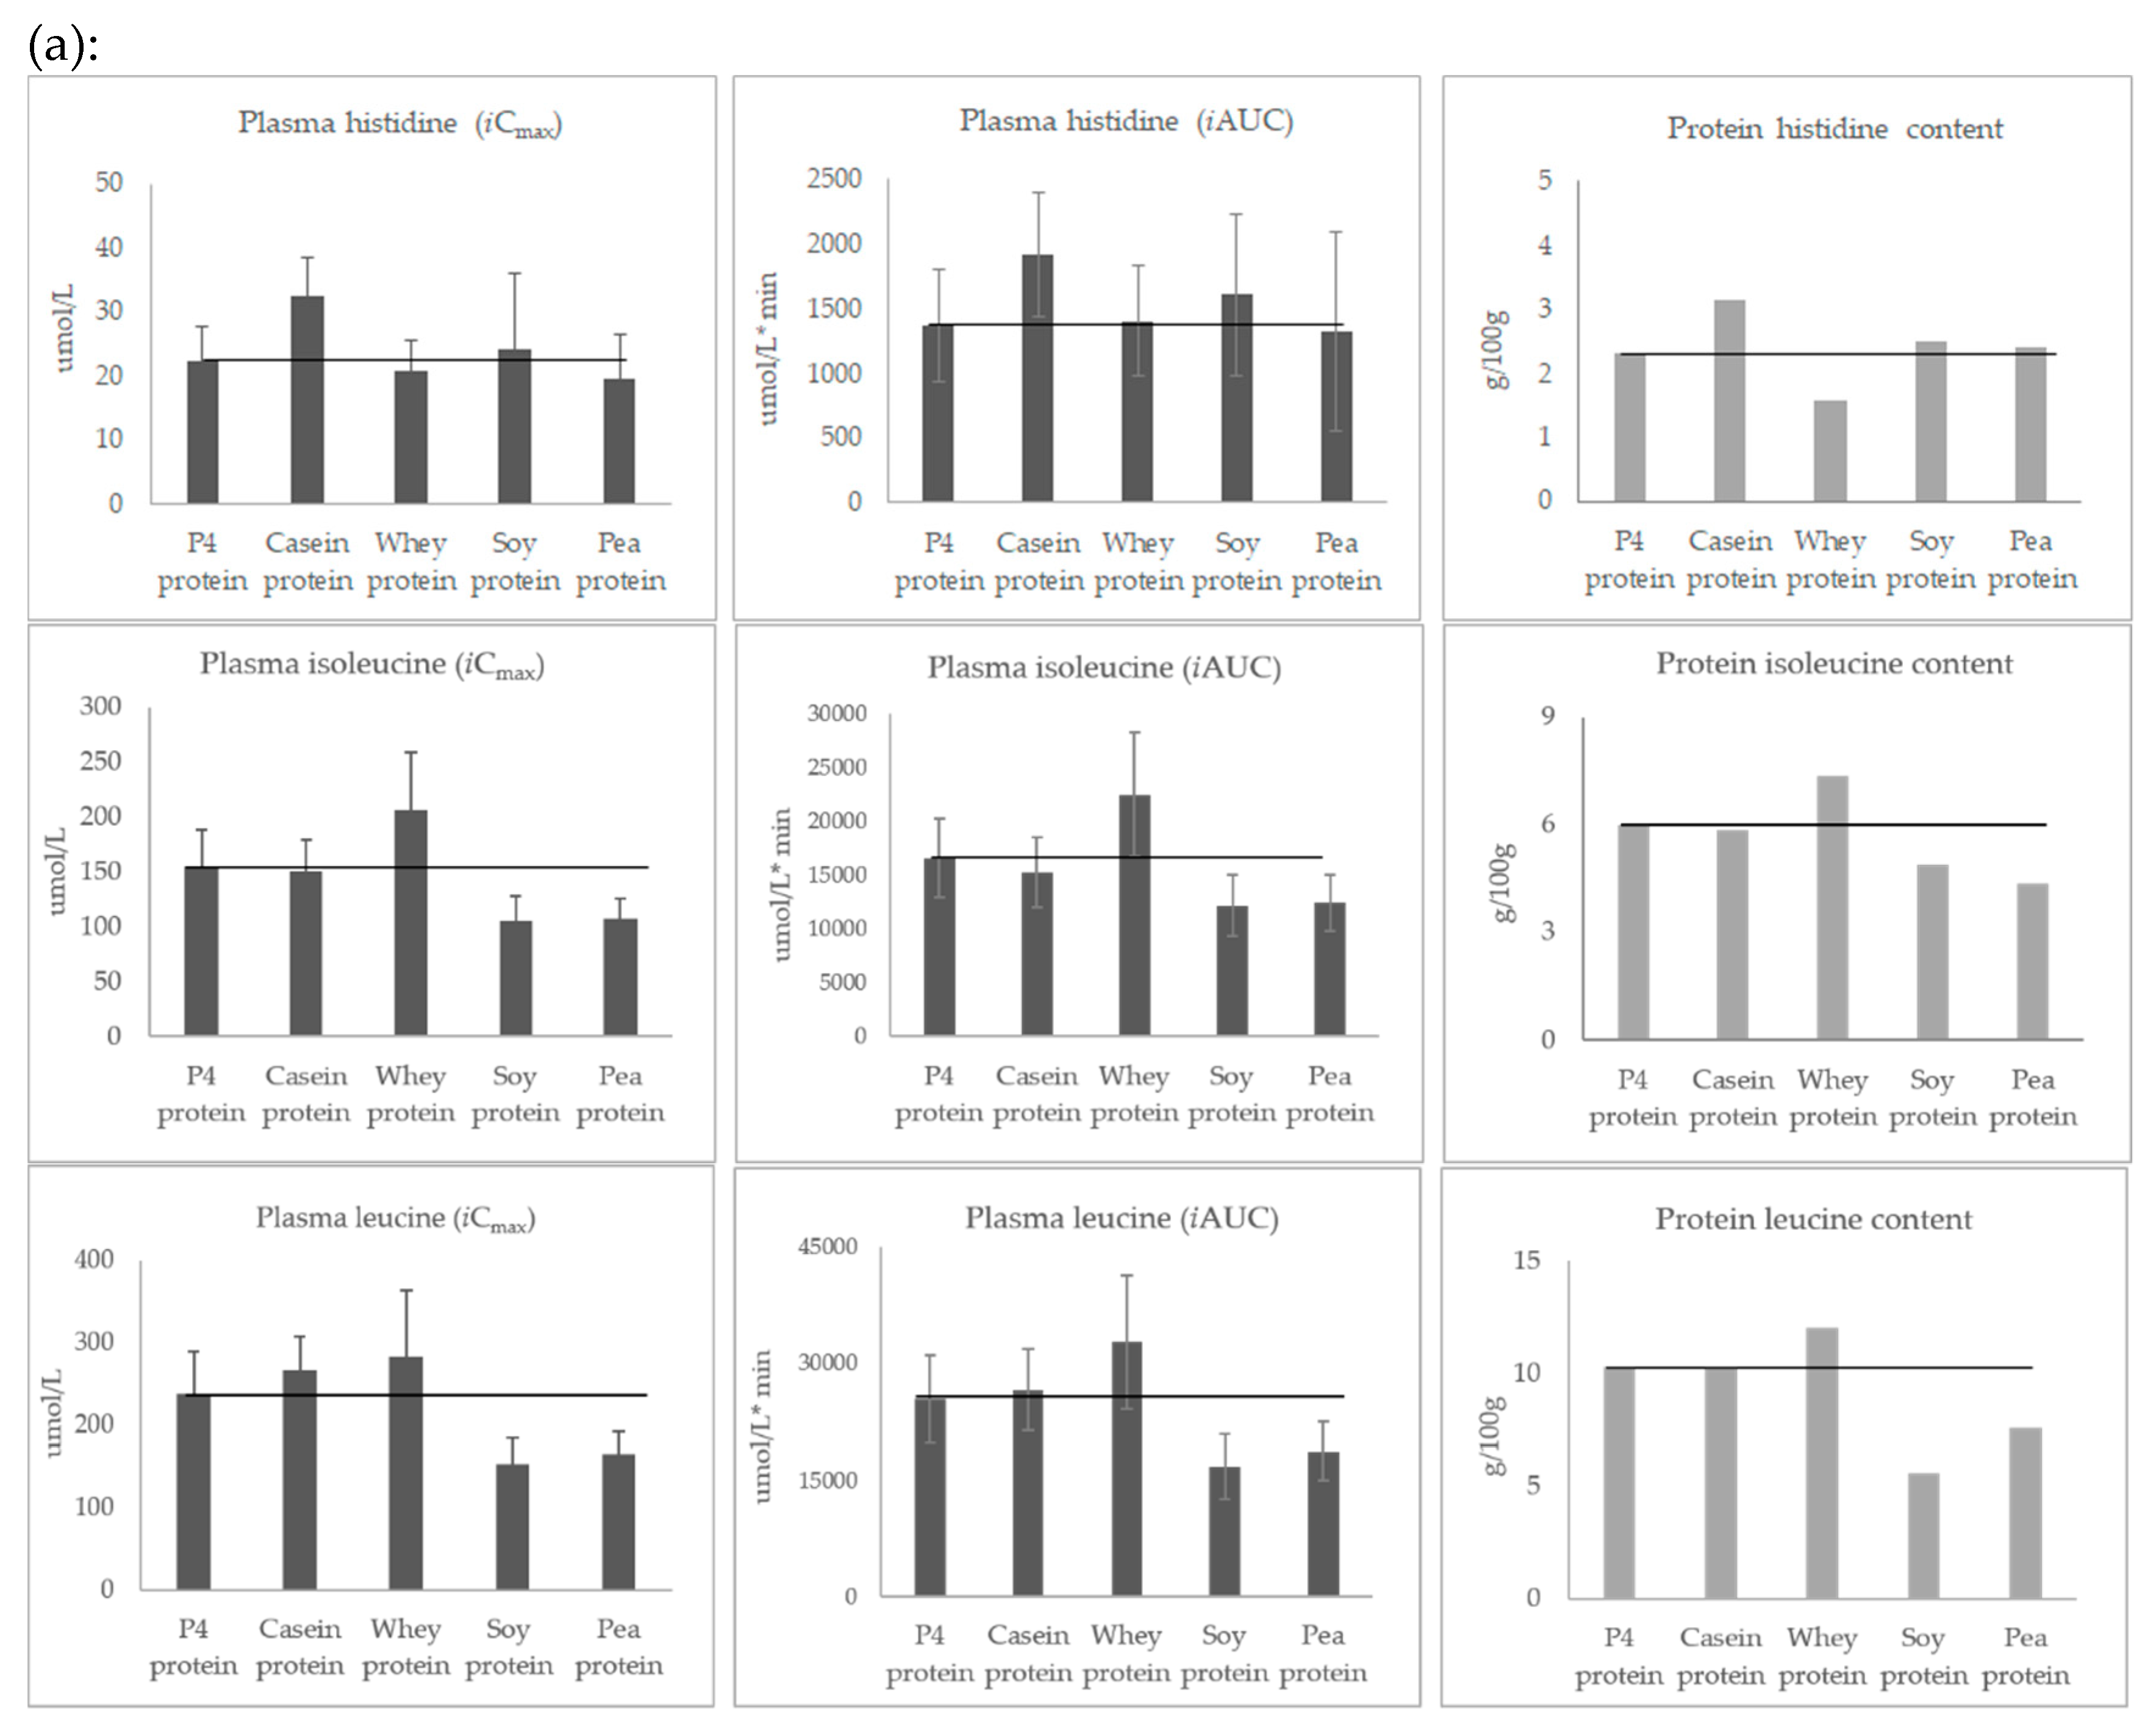
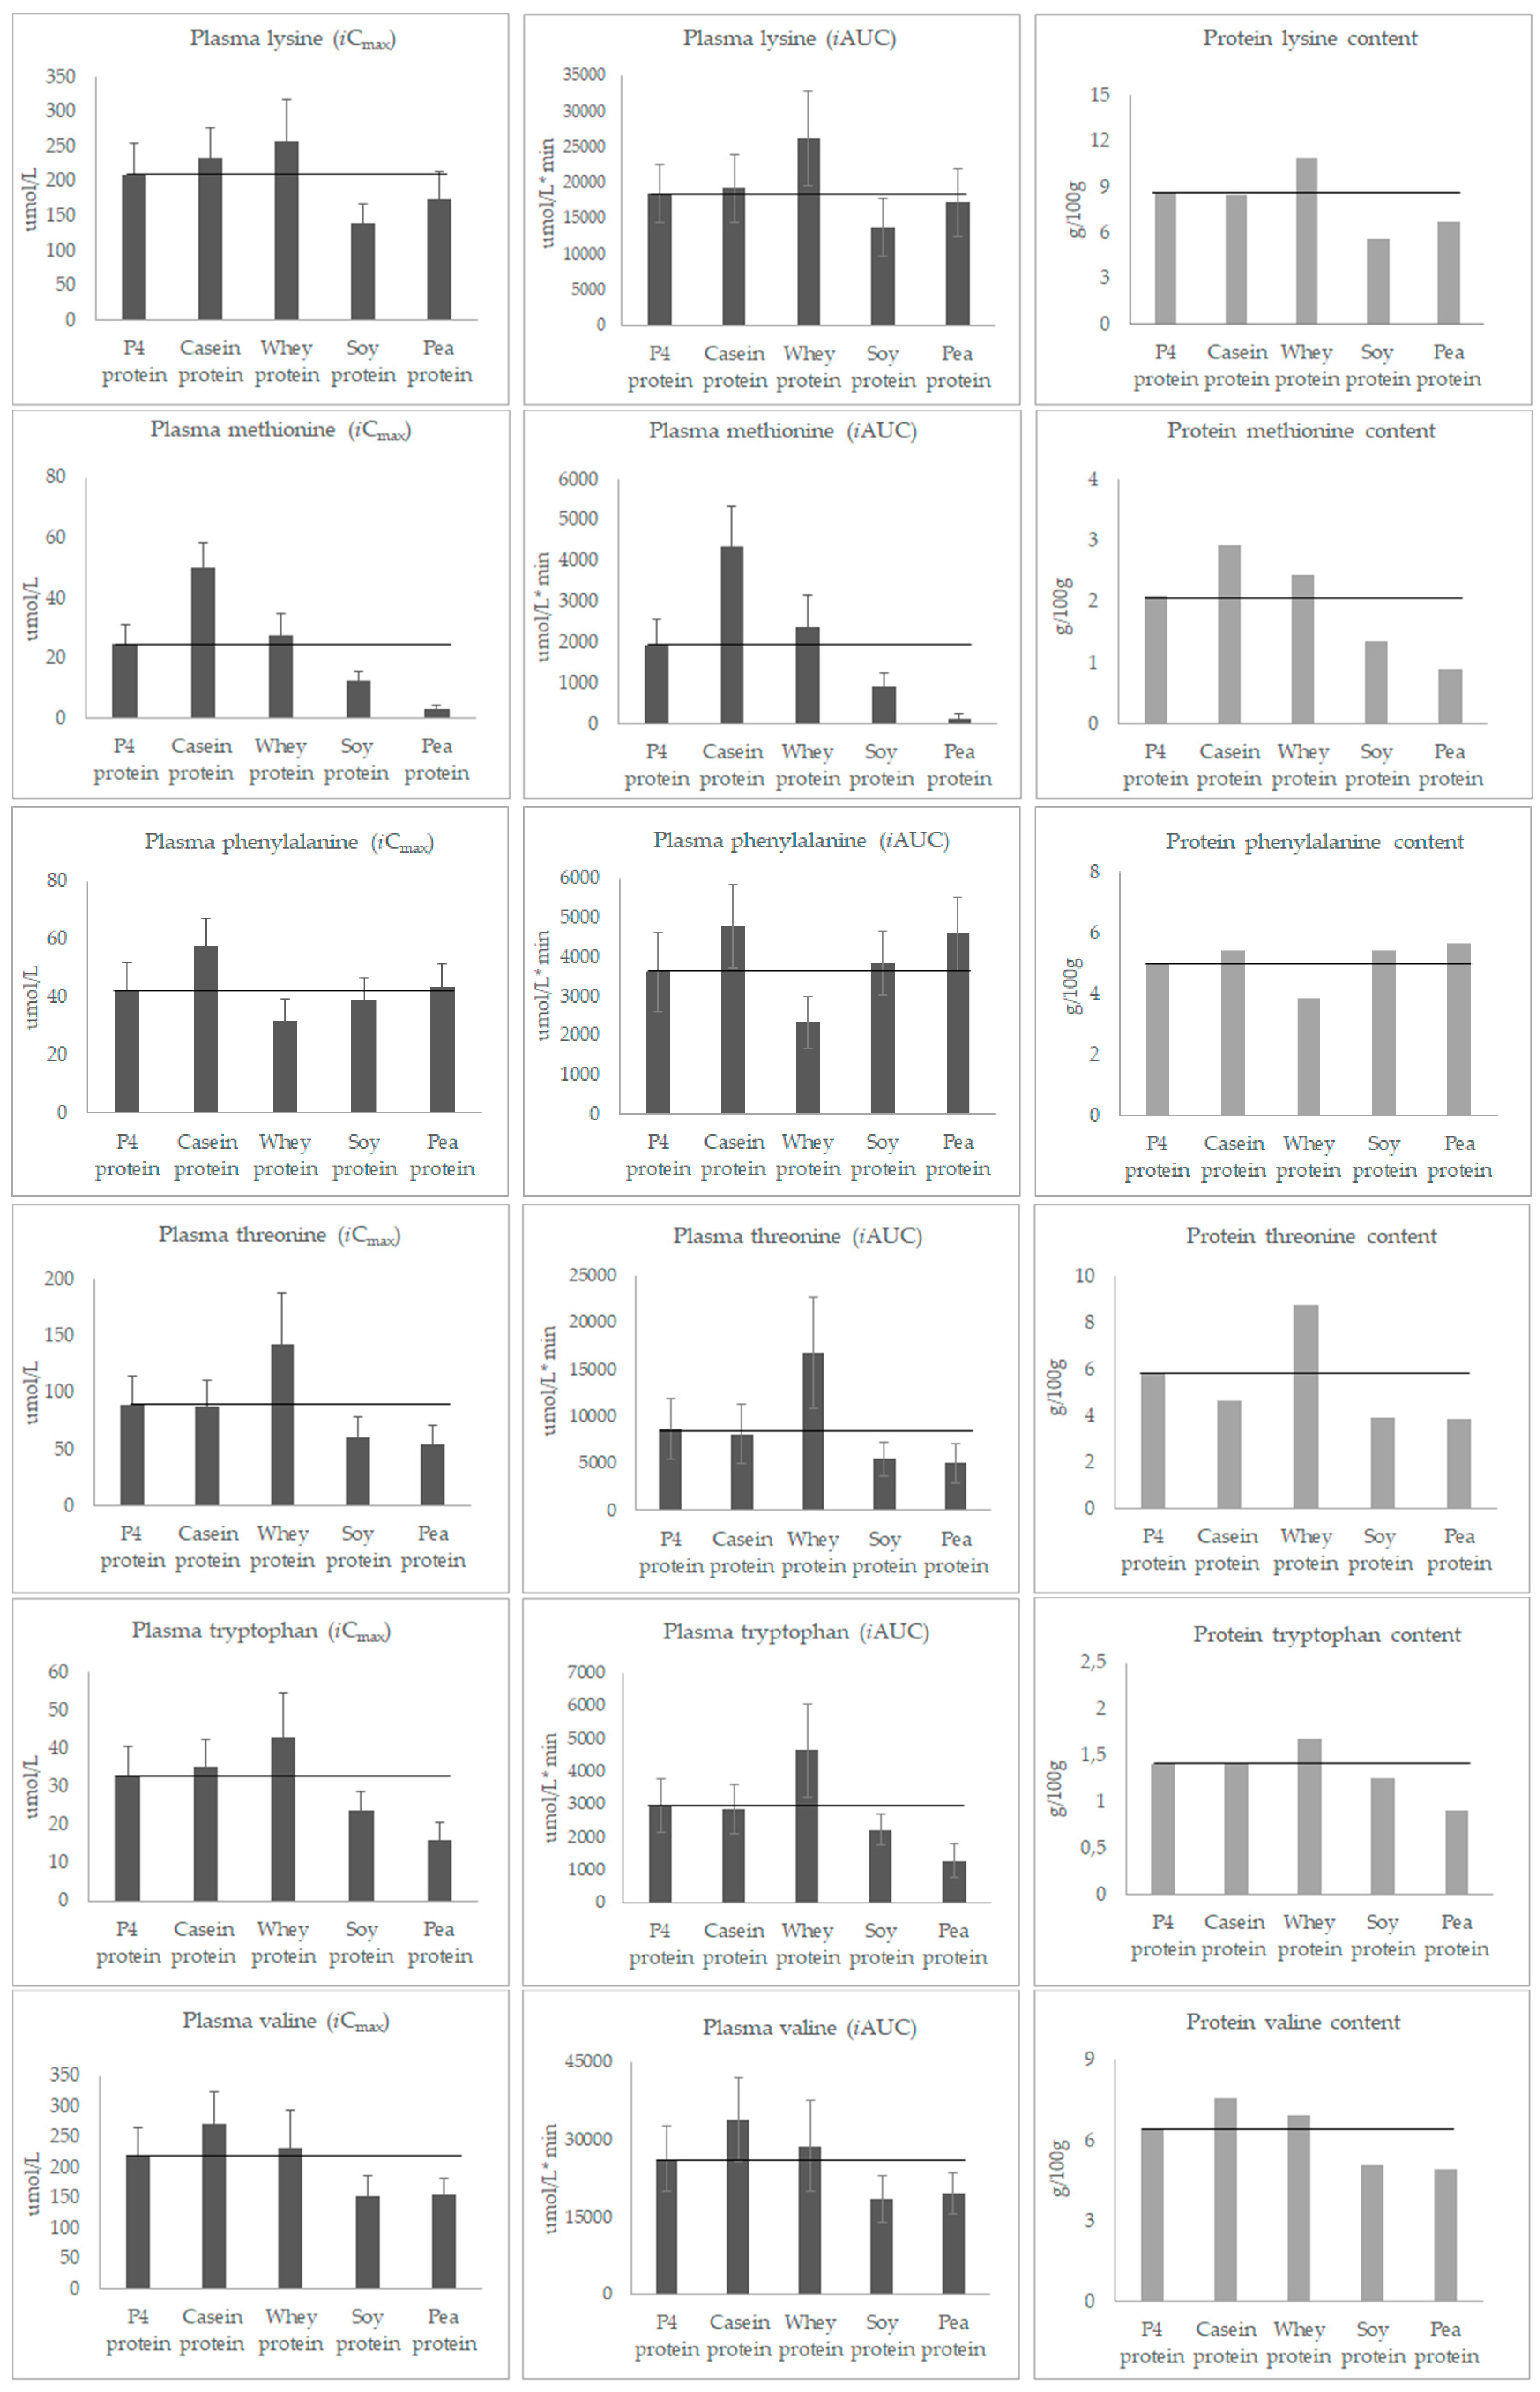
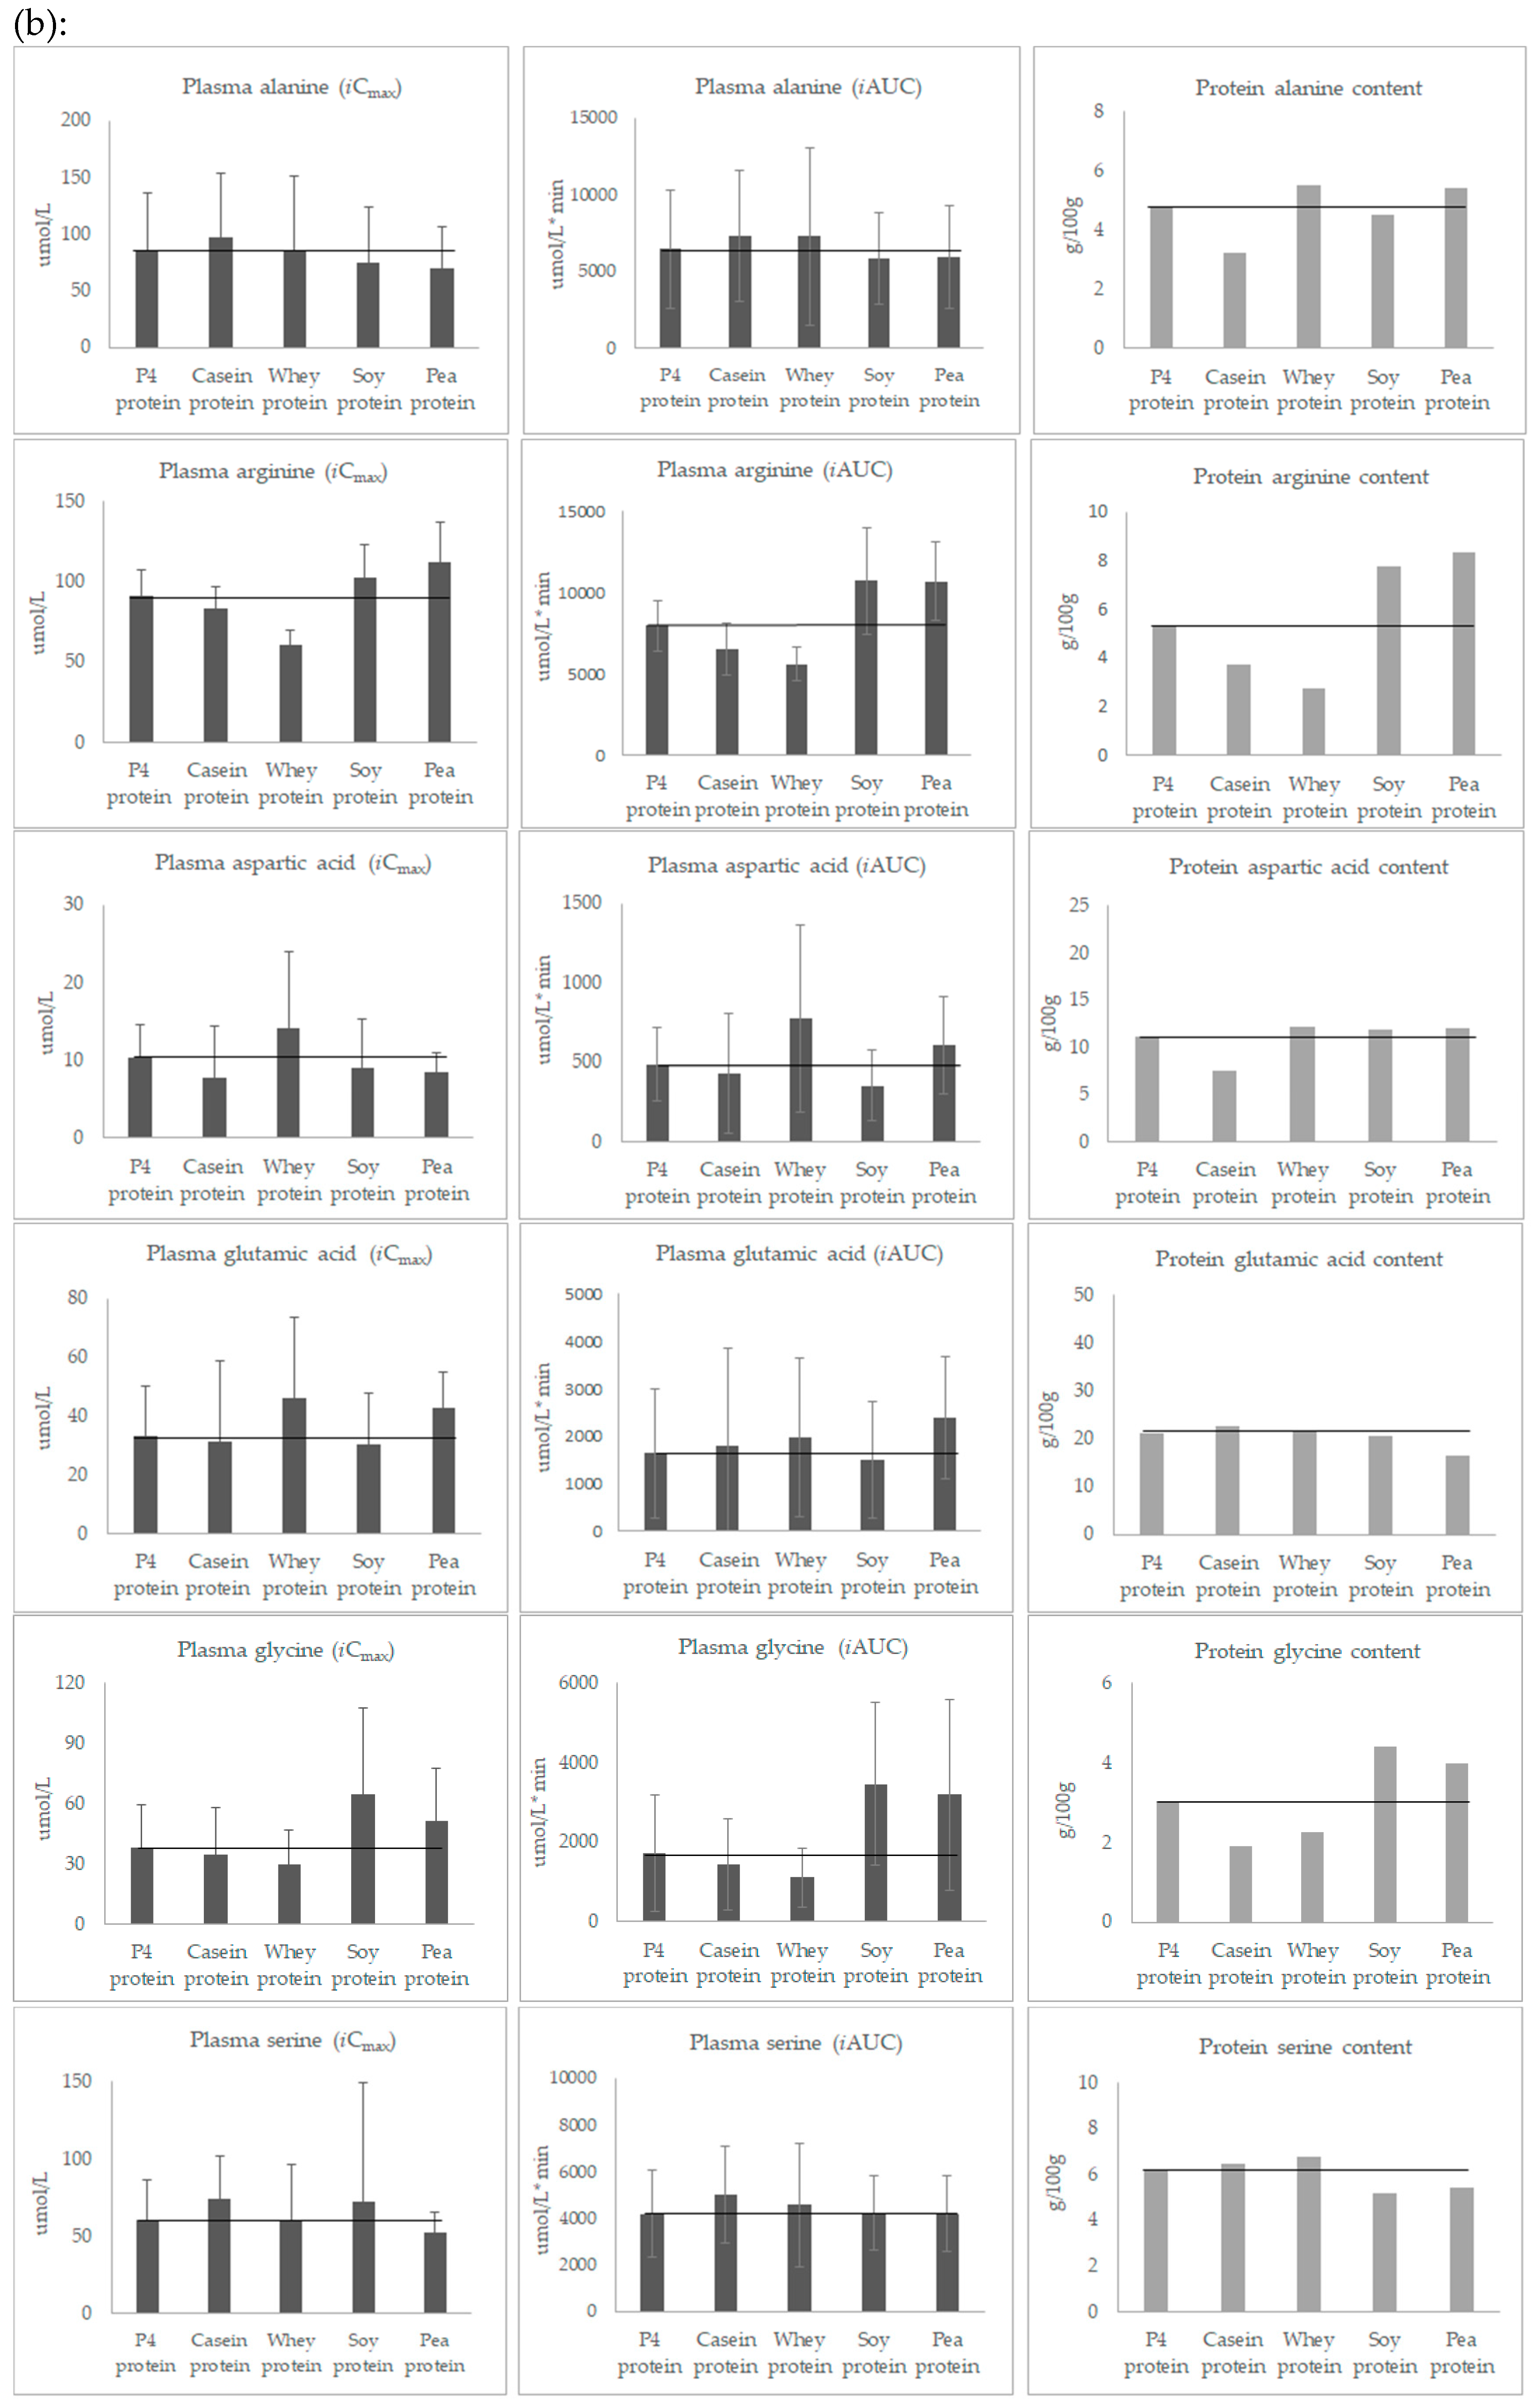
3.2. Post-Prandial Plasma Concentration of the Sum of TAA
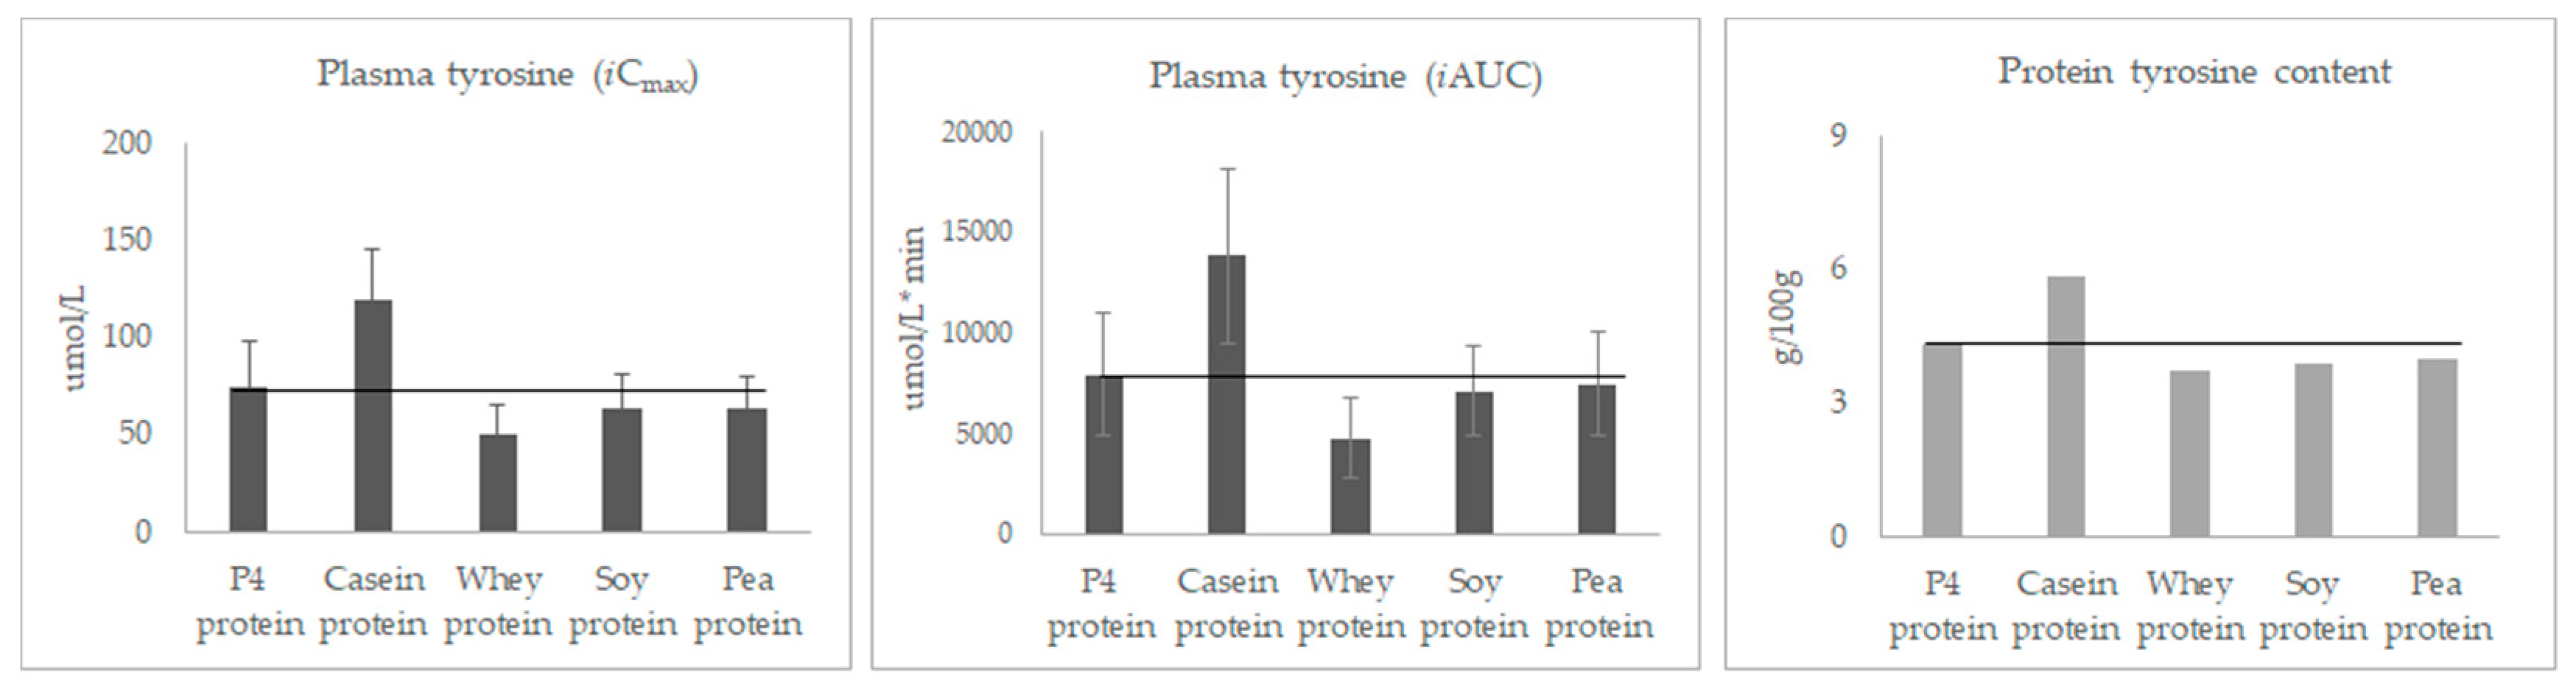
3.3. Post-Prandial Plasma Concentration of Individual Amino Acids
4. Discussion
5. Conclusions
Author Contributions
Funding
Acknowledgments
Conflicts of Interest
References
- Ochoa Gautier, J.B. How much and what type of protein should a critically ill patient receive? Nutr. Clin. Pract. 2017, 32, 6S–14S. [Google Scholar] [CrossRef] [PubMed]
- Hurt, R.T.; McClave, S.A.; Martindale, R.G.; Ochoa Gautier, J.B.; Coss-Bu, J.A.; Dickerson, R.N.; Heyland, D.K.; Hoffer, L.J.; Moore, F.A.; Morris, C.R. Summary points and consensus recommendations from the International Protein Summit. Nutr. Clin. Pract. 2017, 32, 142S–151S. [Google Scholar] [CrossRef] [PubMed]
- Hussam Rostom, B.S. Basic metabolism: Proteins. Surgery 2018, 36, 153–158. [Google Scholar] [CrossRef]
- World Health Organization; Food and Agriculture Organization of the United Nations; United Nations University. Protein and Amino Acid Requirements in Human Nutrition: Report of a Joint FAO/WHO/UNU Expert Consultation; WHO Technical Report Series 935; World Health Organization: Geneva, Switzerland, 2002; Volume 56, pp. 1–265. Available online: http://www.who.int/iris/handle/10665/43411 (accessed on 25 July 2019).
- Wolfe, R.R.; Baum, J.I.; Starck, C.; Moughan, P.J. Factors contributing to the selection of dietary protein food sources. Clin. Nutr. 2018, 37, 130–138. [Google Scholar] [CrossRef]
- Reeds, P.J. Dispensable and indispensable amino acids for humans. J. Nutr. 2000, 130, 1835S–1840S. [Google Scholar] [CrossRef]
- Jonker, R.; Engelen, M.P.; Deutz, N.E. Role of specific dietary amino acids in clinical conditions. Br. J. Nutr. 2012, 108, 139–148. [Google Scholar] [CrossRef]
- Børsheim, E.; Bui, Q.U.; Wolfe, R.R. Plasma amino acid concentrations during late rehabilitation in patients with traumatic brain injury. Arch. Phys. Med. Rehabil. 2007, 88, 234–238. [Google Scholar] [CrossRef]
- Wu, G. Dietary protein intake and human health. Food Funct. 2016, 7, 1251–1265. [Google Scholar] [CrossRef] [Green Version]
- Hou, Y.; Yin, Y.; Wu, G. Dietary essentiality of “nutritionally non-essential amino acids” for animals and humans. Exp. Biol. Med. (Maywood) 2015, 240, 997–1007. [Google Scholar] [CrossRef]
- Wu, G. Functional amino acids in nutrition and health. Amino Acids 2013, 45, 407–411. [Google Scholar] [CrossRef] [Green Version]
- Davis, J.S.; Anstey, N.M. Is plasma arginine concentration decreased in patients with sepsis? A systematic review and meta-analysis. Crit. Care Med. 2011, 39, 380–385. [Google Scholar] [CrossRef] [PubMed]
- McCarty, M.F.; O’Keefe, J.H.; DiNicolantonio, J.J. Dietary glycine is rate-limiting for glutathione synthesis and may have broad potential for health protection. Ochsner J. 2018, 18, 81–87. [Google Scholar] [PubMed]
- Bos, C.; Metges, C.C.; Gaudichon, C.; Petzke, K.J.; Pueyo, M.E.; Morens, C.; Everwand, J.; Benamouzig, R.; Tom, D. Postprandial kinetics of dietary amino acids are the main determinant of their metabolism after soy or milk protein ingestion in humans. J. Nutr. 2003, 133, 1308–1315. [Google Scholar] [CrossRef] [PubMed]
- Luiking, Y.C.; Deutz, N.E.; Jäkel, M.; Soeters, P.B. Casein and soy protein meals differentially affect whole-body and splanchnic protein metabolism in healthy humans. J. Nutr. 2005, 35, 1080–1087. [Google Scholar] [CrossRef] [PubMed]
- Groen, B.B.; Horstman, A.M.; Hamer, H.M.; De Haan, M.; Van Kranenburg, J.; Bierau, J.; Poeze, M.; Wodzig, W.K.; Rasmussen, B.B.; van Loon, L.J. Post-prandial protein handling: You are what you just ate. PLoS ONE 2015, 10, e0141582. [Google Scholar] [CrossRef] [PubMed]
- Lee, W.T.; Weisell, R.; Albert, J.; Tomé, D.; Kurpad, A.V.; Uauy, R. Research approaches and methods for evaluating the protein quality of human foods proposed by an FAO expert working group in 2014. J. Nutr. 2016, 146, 929–932. [Google Scholar] [CrossRef]
- Hamarsland, H.; Nordengen, A.L.; Aas, S.N.; Holte, K.; Garthe, I.; Paulsen, G.; Cotter, M.; Børsheim, E.; Benestad, H.B.; Raastad, T. Native whey protein with high levels of leucine results in similar post-exercise muscular anabolic responses as regular whey protein: A randomized controlled trial. J. Int. Soc. Sports Nutr. 2017, 14, 43. [Google Scholar] [CrossRef]
- Paddon-Jones, D.; Børsheim, E.; Wolfe, R.R. Potential ergogenic effects of arginine and creatine supplementation. J. Nutr. 2004, 134, 2888S–2894S. [Google Scholar] [CrossRef]
- Gregory, L.P. The rationale for consuming protein blends in sports nutrition. J. Am. Coll. Nutr. 2009, 28, 464S–472S. [Google Scholar] [CrossRef]
- Butteiger, D.N.; Cope, M.; Liu, P.; Mukherjea, R.; Volpi, E.; Rasmussen, B.B.; Krul, E.S. A soy, whey and caseinate blend extends postprandial skeletal muscle protein synthesis in rats. Clin. Nutr. 2013, 32, 585–591. [Google Scholar] [CrossRef]
- Reidy, P.T.; Walker, D.K.; Dickinson, J.M.; Gundermann, D.M.; Drummond, M.J.; Timmerman, K.L.; Cope, M.B.; Mukherjea, R.; Jennings, K.; Volpi, E.; et al. Soy-dairy protein blend and whey protein ingestion after resistance exercise increases amino acid transport and transporter expression in human skeletal muscle. J. Appl. Physiol. 2014, 116, 1353–1364. [Google Scholar] [CrossRef] [PubMed]
- Lonnie, M.; Hooker, E.; Brunstrom, J.; Corfe, B.; Green, M.; Watson, A.; Williams, E.; Stevenson, E.; Penson, S.; Johnstone, A. Protein for life: Review of optimal protein intake, sustainable dietary sources and the effect on appetite in ageing adults. Nutrients 2018, 10, 360. [Google Scholar] [CrossRef] [PubMed]
- Luttikhold, J.; van Norren, K.; Rijna, H. Jejunal feeding is followed by a greater rise in plasma cholecystokinin, peptide YY, glucagon-like peptide 1, and glucagon-like peptide 2 concentrations compared with gastric feeding in vivo in humans: A randomized trial. Am. J. Clin. Nutr. 2016, 103, 435–443. [Google Scholar] [CrossRef] [PubMed]
- Preiser, J.C.; van Zanten, A.R.; Berger, M.M.; Biolo, G.; Casaer, M.P.; Doig, G.S.; Griffiths, R.D.; Heyland, D.K.; Hiesmayr, M.; Iapichino, G.; et al. Metabolic and nutritional support of critically ill patients: Consensus and controversies. Crit. Care 2015, 19, 33. [Google Scholar] [CrossRef] [PubMed]
- Viña, J.; Gimenez, A.; Puertes, I.R.; Gasco, E.; Viña, J.R. Impairment of cysteine synthesis from methionine in rats exposed to surgical stress. Br. J. Nutr. 1992, 68, 421–429. [Google Scholar] [CrossRef] [Green Version]


| P4 Protein | Casein Protein | Whey Protein | Soy Protein | Pea Protein | FAO/WHO 2007 1 | Wu 2016 2 | |
|---|---|---|---|---|---|---|---|
| Histidine | 2.3 | 3.1 | 1.6 | 2.5 | 2.4 | 1.5 | |
| Isoleucine | 6.0 | 5.9 | 7.4 | 4.9 | 4.4 | 3.0 | |
| Leucine | 10.3 | 10.2 | 12.1 | 5.6 | 7.6 | 5.9 | |
| Lysine | 8.7 | 8.5 | 10.9 | 5.6 | 6.7 | 4.5 | |
| Methionine | 2.1 | 2.9 | 2.5 | 1.4 | 0.9 | 1.6 | |
| Phenylalanine | 5.0 | 5.5 | 3.8 | 5.5 | 5.7 | ||
| Threonine | 5.8 | 4.6 | 8.8 | 3.9 | 3.8 | 2.3 | |
| Tryptophan | 1.4 | 1.4 | 1.7 | 1.3 | 0.9 | 0.6 | |
| Valine | 6.4 | 7.6 | 6.9 | 5.1 | 4.9 | 3.9 | |
| Alanine | 4.8 | 3.2 | 5.5 | 4.5 | 5.4 | 6.9 | |
| Arginine | 5.3 | 3.7 | 2.7 | 7.8 | 8.4 | 7.1 | |
| Aspartic acid | 11.1 | 7.5 | 12.2 | 11.8 | 11.9 | 6.9 | |
| Cysteine | 1.5 | 0.4 | 2.7 | 1.2 | 1.0 | 0.6 | |
| Glutamic acid | 21.2 | 22.7 | 21.5 | 20.5 | 16.4 | 12.1 | |
| Glycine | 3.0 | 1.9 | 2.3 | 4.4 | 4.0 | 7.7 | |
| Proline | 6.7 | 10.5 | 6.1 | 4.9 | 4.4 | 8.2 | |
| Serine | 6.2 | 6.5 | 6.7 | 5.2 | 5.4 | 4.2 | |
| Tyrosine | 4.3 | 5.9 | 3.7 | 3.9 | 4.0 | 4.0 | |
| Chemical score of the first and second limiting amino acid, according to FAO/WHO 2007 | |||||||
| Methionine | Cysteine | Histidine | Methionine | Methionine | |||
| 1.31 | 0.67 | 1.05 | 0.84 | 0.56 | |||
| Histidine | Leucine | Methione | Leucine | Valine | |||
| 1.53 | 1.73 | 1.56 | 0.95 | 1.26 | |||
| Chemical score of the first and second limiting amino acid, according to Wu 2016 | |||||||
| Glycine | Glycine | Glycine | Glycine | Glycine | |||
| 0.39 | 0.25 | 0.3 | 0.57 | 0.52 | |||
| Alanine | Alanine | Arginine | Proline | Proline | |||
| 0.66 | 0.47 | 0.39 | 0.60 | 0.54 | |||
| Characteristics | Total (n = 14) |
|---|---|
| Age (years) | 67.43 ± 1.5 |
| Race | Caucasian |
| Gender | Female (n = 8), Male (n = 6) |
| Body height (m) | 1.64 ± 0.10 |
| Body weight (kg) | 68.16 ± 11.38 |
| Body mass index (kg/m2) | 25.11 ± 2.31 |
| P4 Protein | Casein Protein | Whey Protein | Soy Protein | Pea Protein | |
|---|---|---|---|---|---|
| Baseline, μmol/L | 2646.29 ± 114.08 | 2637.48 ± 125.26 | 2651.96 ± 146.36 | 2667.79 ± 166.52 | 2562.55 ± 145.35 |
| iCmax, μmol/L | 1555.90 ± 351.18 | 1789.53 ± 314.11 | 1725.03 ± 419.07 | 1258.32 ± 322.08 abc | 1255.48 ± 287.84 abc |
| iAUC, μmol/L*min | 136213 ± 35888 | 153421 ± 35253 | 168149 ± 44156 a | 114336 ± 27033 abc | 118105 ± 35794 bc |
| P4 Protein | Casein Protein | Whey Protein | Soy Protein | Pea Protein | |
|---|---|---|---|---|---|
| Leucine | |||||
| Baseline, μmol/L | 116.13 ± 23.59 | 116.12 ± 19.87 | 115.76 ± 19.96 | 118/83 ± 20.37 | 113.92 ± 21.43 |
| iCmax, μmol/L | 237.70 ± 51.22 | 266.38 ± 41.30 | 282.64 ± 80.86 a | 152.46 ± 32.79 abc | 165.52 ± 27.22 abc |
| iAUC,μmol/L*min | 25448 ± 5647 | 26623 ± 5210 c | 32799 ± 8505 a | 16754 ± 4122 abc | 18731 ± 3763 abc |
| Methionine | |||||
| Baseline, μmol/L | 24.7 ± 4.23 | 24.59 ± 2.60 | 24.98 ± 2.91 | 24.61 ± 2.26 | 23.74 ± 3.53 |
| iCmax, μmol/L | 24.62 ± 6.21 | 49.97 ± 8.24 ac | 27.33 ± 7.37 | 12.64 ± 2.99 abc | 2.88 ± 1.55 abc |
| iAUC, μmol/L*min | 1936 ± 635 | 4360 ± 970 ac | 2356 ± 794 | 931 ± 323 abc | 137 ± 105 abc |
| Arginine | |||||
| Baseline, μmol/L | 100.11 ± 17.20 | 101.54 ± 15.62 | 101.30 ± 14.68 | 96.13 ± 19.00 | 98.09 ± 12.46 |
| iCmax, μmol/L | 90.96 ± 16.55 | 83.46 ± 13.88 ac | 60.43 ± 9.58 a | 102.39 ± 20.58 bc | 112.45 ± 24.93 abc |
| iAUC, μmol/L*min | 7979 ±1551 | 6534 ± 1631 a | 5606 ± 1029 a | 10740 ± 3257 abc | 10719 ± 2426 abc |
| Glycine | |||||
| Baseline, μmol/L | 281.25 ± 80.84 | 289.62 ± 99.50 | 280.54 ± 81.82 | 290.37 ± 82.31 | 273.24 ± 86.45 |
| iCmax, μmol/L | 37.84 ± 21.02 | 34.50 ± 23.14 | 29.76 ±16.54 | 64.71 ± 43.01 bc | 50.97 ± 26.2 bc |
| iAUC, μmol/L*min | 1712 ± 1469 | 1447 ± 1147 | 1106 ± 735 | 3461 ± 2056 abc | 3189 ± 2413 bc |
© 2019 by the authors. Licensee MDPI, Basel, Switzerland. This article is an open access article distributed under the terms and conditions of the Creative Commons Attribution (CC BY) license (http://creativecommons.org/licenses/by/4.0/).
Share and Cite
Liu, J.; Klebach, M.; Visser, M.; Hofman, Z. Amino Acid Availability of a Dairy and Vegetable Protein Blend Compared to Single Casein, Whey, Soy, and Pea Proteins: A Double-Blind, Cross-Over Trial. Nutrients 2019, 11, 2613. https://doi.org/10.3390/nu11112613
Liu J, Klebach M, Visser M, Hofman Z. Amino Acid Availability of a Dairy and Vegetable Protein Blend Compared to Single Casein, Whey, Soy, and Pea Proteins: A Double-Blind, Cross-Over Trial. Nutrients. 2019; 11(11):2613. https://doi.org/10.3390/nu11112613
Chicago/Turabian StyleLiu, Jue, Marianne Klebach, Monique Visser, and Zandrie Hofman. 2019. "Amino Acid Availability of a Dairy and Vegetable Protein Blend Compared to Single Casein, Whey, Soy, and Pea Proteins: A Double-Blind, Cross-Over Trial" Nutrients 11, no. 11: 2613. https://doi.org/10.3390/nu11112613
APA StyleLiu, J., Klebach, M., Visser, M., & Hofman, Z. (2019). Amino Acid Availability of a Dairy and Vegetable Protein Blend Compared to Single Casein, Whey, Soy, and Pea Proteins: A Double-Blind, Cross-Over Trial. Nutrients, 11(11), 2613. https://doi.org/10.3390/nu11112613