Combined Supplementation with Glycine and Tryptophan Reduces Purine-Induced Serum Uric Acid Elevation by Accelerating Urinary Uric Acid Excretion: A Randomized, Single-Blind, Placebo-Controlled, Crossover Study

Abstract
1. Introduction
2. Materials and Methods
2.1. Volunteers
2.2. Test Samples
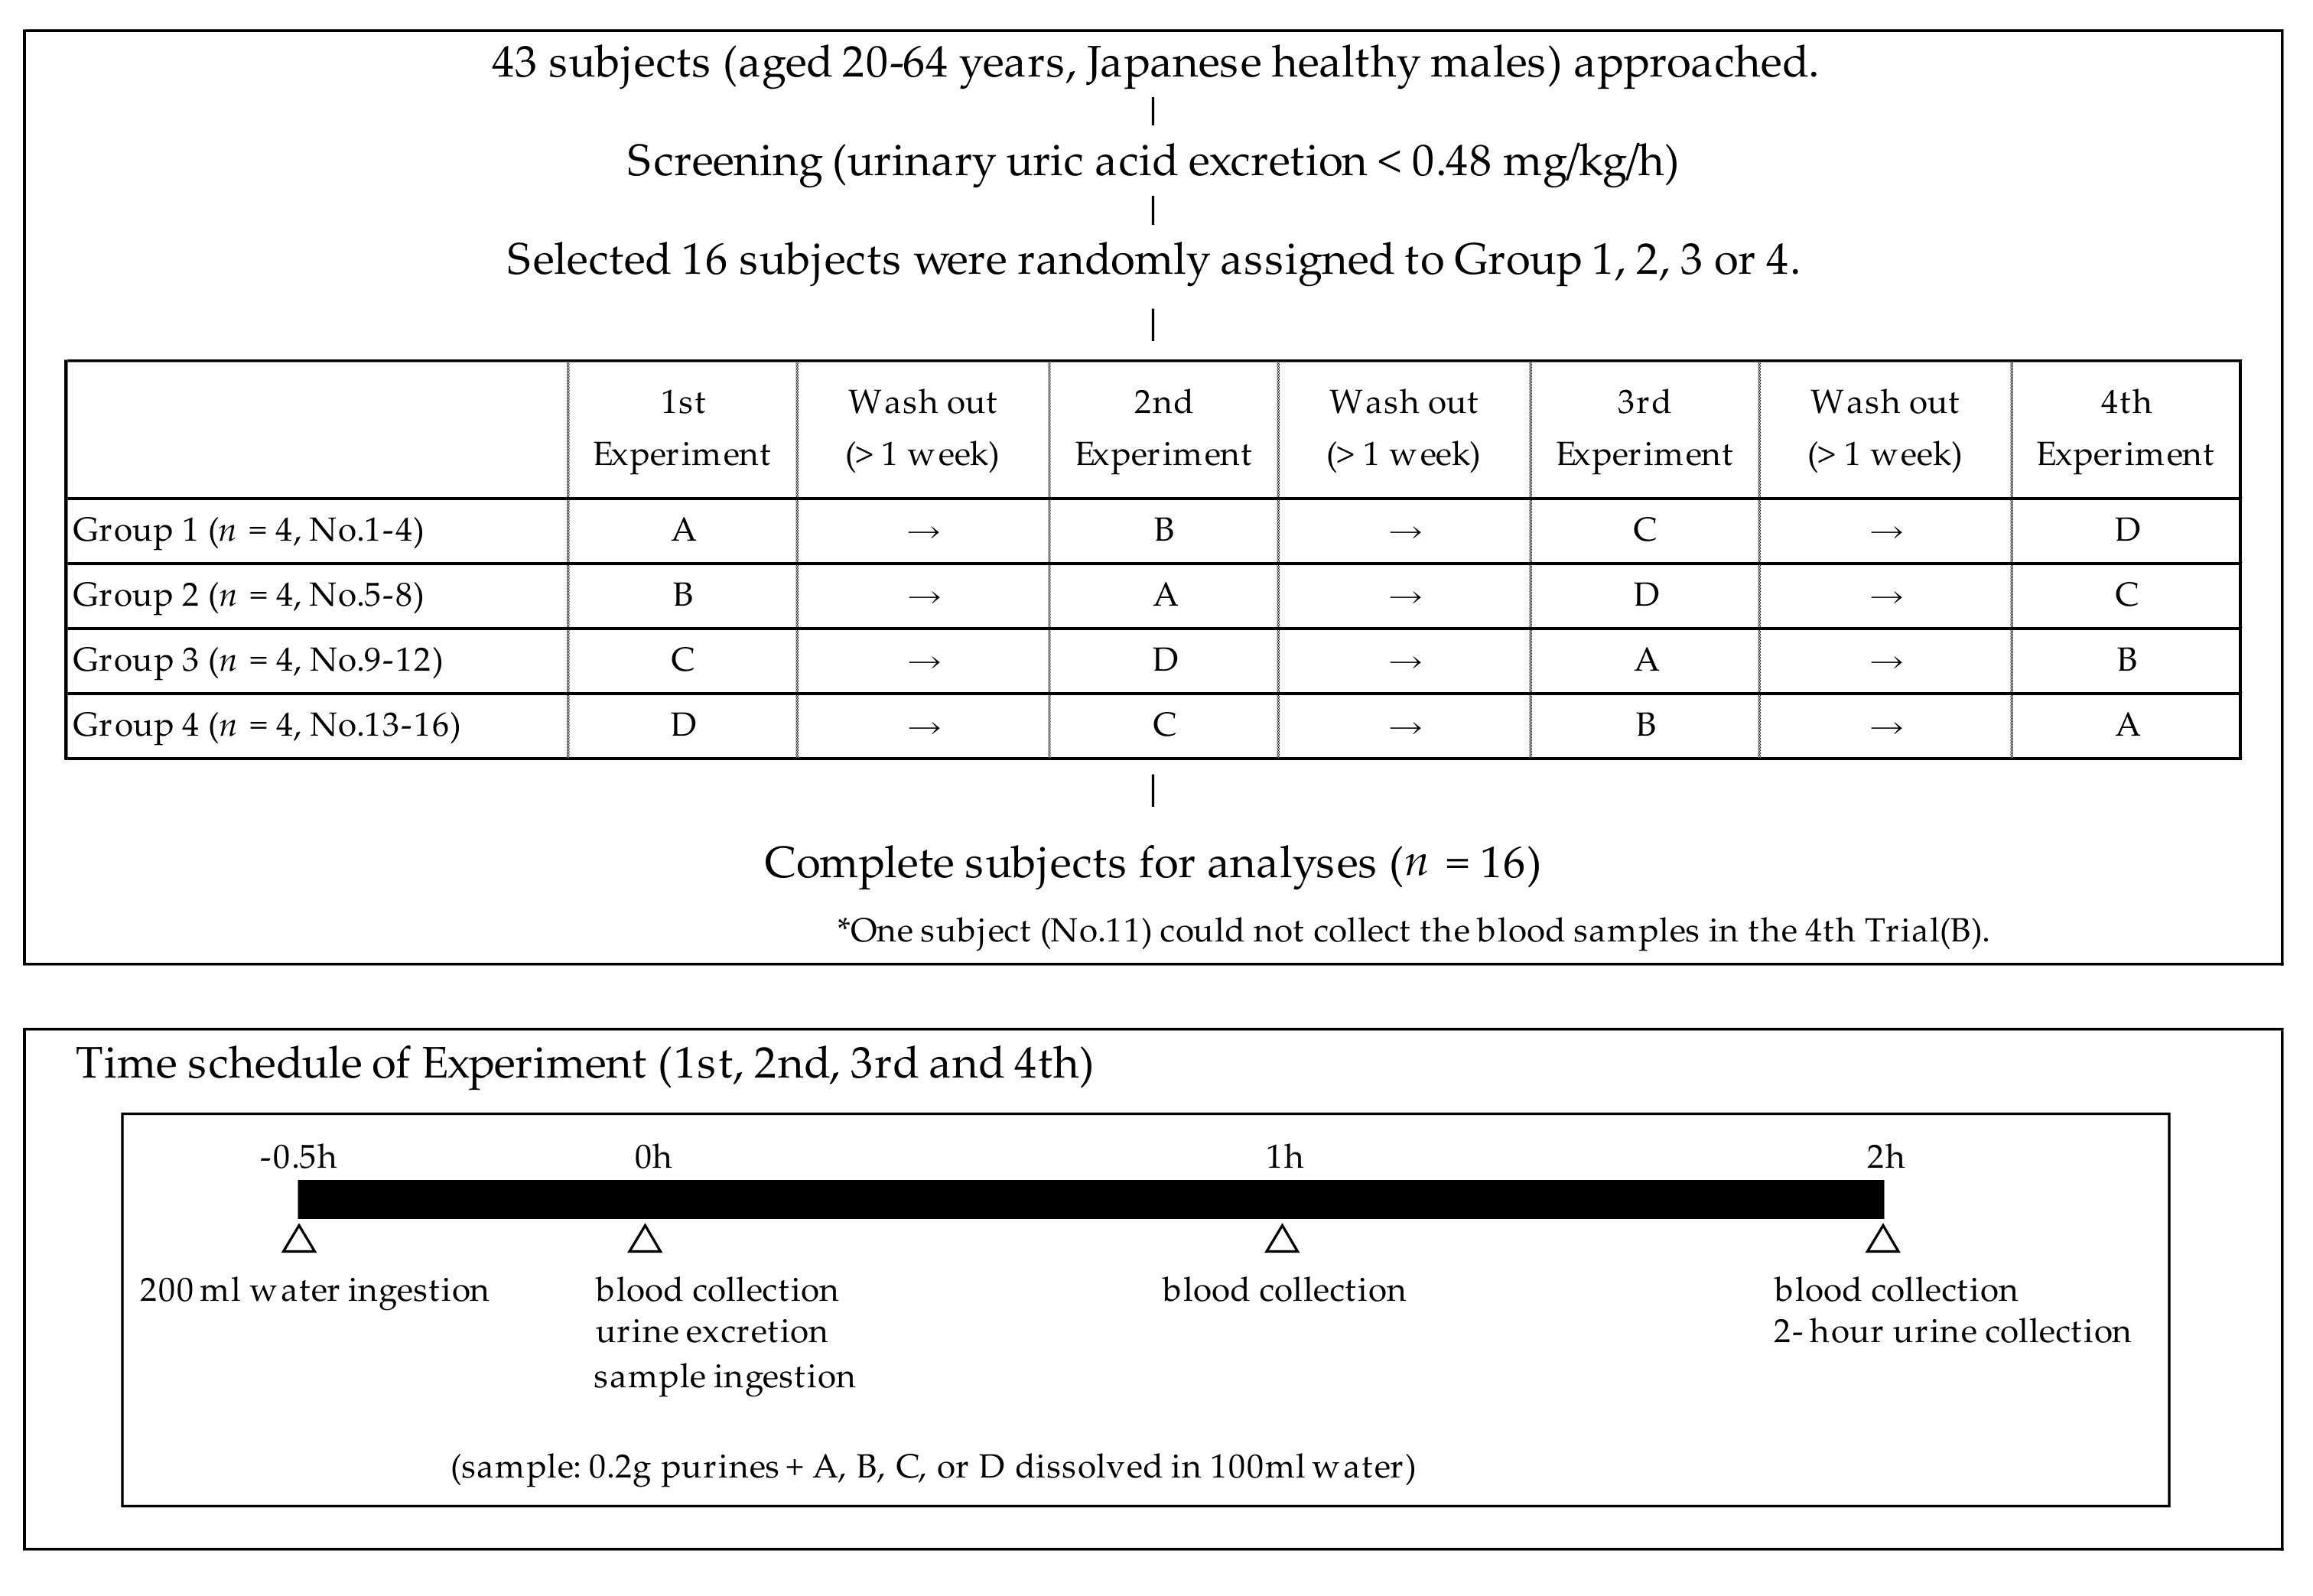
2.3. Study Design
2.4. Blood and Urine Analyses
2.5. Statistical Analysis
3. Results
4. Discussion
5. Conclusions
6. Patents
Author Contributions
Funding
Acknowledgments
Conflicts of Interest
References
- Rai, S.K.; Aviña-Zubieta, J.A.; McCormick, N.; de Vera, M.A.; Shojania, K.; Sayre, E.C.; Choi, H.K. The rising prevalence and incidence of gout in British Columbia, Canada: Population-based trends from 2000 to 2012. Semin. Arthritis Rheum. 2017, 46, 451–456. [Google Scholar] [CrossRef]
- Kuo, C.F.; Grainge, M.J.; Mallen, C.; Zhang, W.; Doherty, M. Rising burden of gout in the UK but continuing suboptimal management: A nationwide population study. Ann. Rheum. Dis. 2015, 74, 661–667. [Google Scholar] [CrossRef]
- Winnard, D.; Wright, C.; Taylor, W.J.; Jackson, G.; Te Karu, L.; Gow, P.J.; Arroll, B.; Thornley, S.; Gribben, B.; Dalbeth, N. National prevalence of gout derived from administrative health data in Aotearoa New Zealand. Rheumatology 2012, 51, 901–909. [Google Scholar] [CrossRef]
- Zhu, Y.; Pandya, B.J.; Choi, H.K. Prevalence of gout and hyperuricemia in the US general population: The National Health and Nutrition Examination Survey 2007-2008. Arthritis Rheum. 2011, 63, 3136–3141. [Google Scholar] [CrossRef]
- Roddy, E.; Zhang, W.; Doherty, M. Is gout associated with reduced quality of life? A case-control study. Rheumatology 2007, 46, 1441–1444. [Google Scholar] [CrossRef]
- Singh, J.A.; Strand, V. Gout is associated with more comorbidities, poorer health-related quality of life and higher healthcare utilisation in US veterans. Ann. Rheum. Dis. 2008, 67, 1310–1316. [Google Scholar] [CrossRef] [PubMed]
- Lee, S.J.; Hirsch, J.D.; Terkeltaub, R.; Khanna, D.; Singh, J.A.; Sarkin, A.; Kavanaugh, A. Perceptions of disease and health-related quality of life among patients with gout. Rheumatology 2009, 48, 582–586. [Google Scholar] [CrossRef] [PubMed]
- Yamanaka, H. Japanese guideline for the management of hyperuricemia and gout: Second edition. Nucleos. Nucleot. Nucl. 2011, 30, 1018–1029. [Google Scholar] [CrossRef] [PubMed]
- Brook, R.A.; Forsythe, A.; Smeeding, J.E.; Lawrence, E.N. Chronic gout: Epidemiology, disease progression, treatment and disease burden. Curr. Med. Res. Opin. 2010, 26, 2813–2821. [Google Scholar] [CrossRef]
- Anzai, N.; Endou, H. Drug discovery for hyperuricemia. Expert Opin. Drug Discov. 2007, 2, 1251–1261. [Google Scholar] [CrossRef]
- Christman, A.A.; Mosier, E.C. Purine metabolism. II. The effect of the ingestion of glycine on the excretion of endogenous uric acid. J. Biol. Chem. 1929, 83, 11–19. [Google Scholar]
- Friedman, M. The effect of glycine on the production and excretion of uric acid. J. Clin. Investig. 1947, 26, 815–819. [Google Scholar] [CrossRef] [PubMed]
- Kersley, G.D.; Mandel, L.; Bene, E. Gout: Observations on the effects of drugs on plasma uric acid and urinary uric acid. Ann. Rheum. Dis. 1951, 10, 353–358. [Google Scholar] [CrossRef] [PubMed]
- Oshima, S.; Shiiya, S.; Nakamura, Y. Serum Uric acid-lowering effects of combined glycine and tryptophan treatments in subjects with mild hyperuricemia: A randomized, double-blind, placebo-controlled, crossover study. Nutrients 2019, 11, 564. [Google Scholar] [CrossRef]
- Shio, H. Characteristics of the guideline for the management of hyperuricemia and gout, 2nd edition. Health Eval. Promot. 2012, 39, 313–322. (In Japanese) [Google Scholar] [CrossRef][Green Version]
- Du Bois, D.; Du Bois, E.F. Clinical calorimetry: Tenth paper a formula to estimate the approximate surface area if height and weight be known. Arch. Intern. Med. 1916, 17, 863–871. [Google Scholar] [CrossRef]
- Yoshida, H.; Kondo, K.; Yamamoto, H.; Kageyama, N.; Ozawa, S.; Shimbo, K.; Muramatsu, T.; Imaizumi, A.; Mizukoshi, T.; Masuda, J.; et al. Validation of an analytical method for human plasma free amino acids by high-performance liquid chromatography ionization mass spectrometry using automated precolumn derivatization. J. Chromatogr. B Analyt. Technol. Biomed. Life Sci. 2015, 15, 998–999. [Google Scholar] [CrossRef]
- Pérez-Torres, I.; Zuniga-Munoz, A.M.; Guarner-Lans, V. Beneficial effects of the amino acid glycine. Mini-Rev. Med. Chem. 2017, 17, 15–32. [Google Scholar] [CrossRef]
- Hiratsuka, C.; Fukuwatari, T.; Sano, M.; Saito, K.; Sasaki, S.; Shibata, K. Supplementing healthy women with up to 5.0 g/d of L-tryptophan has no adverse effects. J. Nutr. 2013, 143, 859–866. [Google Scholar] [CrossRef]
- Wilcox, W.R.; Khalaf, A.; Weinberger, A.; Kippen, I.; Klinenberg, J.R. Solubility of uric acid and monosodium urate. Med. Biol. Eng. 1972, 10, 522–531. [Google Scholar] [CrossRef]
- Kanbara, A.; Miura, Y.; Hyogo, H.; Chayama, K.; Seyama, I. Effect of urine pH changed by dietary intervention on uric acid clearance mechanism of pH-dependent excretion of urinary uric acid. Nutr. J. 2012, 11, 39. [Google Scholar] [CrossRef] [PubMed]
- Pak, C.Y.C.; Fuller, C.; Sakhaee, K.; Preminger, G.M.; Britton, F. Long-term treatment of calcium nephrolithiasis with potassium citrate. J. Urol. 1985, 134, 11–19. [Google Scholar] [CrossRef]
- Alvarez, M.A.; Traba, M.L.; Rapado, A. Hypocitraturia as a pathogenic risk factor in the mixed (calcium oxalate/uric acid) renal stones. Urol. Int. 1992, 48, 342–346. [Google Scholar]
- Sakhaee, K.; Nicar, M.; Hill, K.; Pak, C.Y.; Sakhaee, K. Contrasting effects of potassium citrate and sodium citrate therapies on urinary chemistries and crystallization of stone-forming salts. Kidney Int. 1983, 24, 348–352. [Google Scholar] [CrossRef]
- Ichida, K.; Hosoyamada, M.; Hisatome, I.; Enomoto, A.; Hikita, M.; Endou, H.; Hosoya, T. Clinical and molecular analysis of patients with renal hypouricemia in Japan-influence of URAT1 gene on urinary urate excretion. J. Am. Soc. Nephrol. 2004, 15, 164–173. [Google Scholar] [CrossRef] [PubMed]
- Kaung, C.; Gutman, A.B. Effect of glycine loading on plasma and urinary uric acid and amino acids in normal and gouty subjects. Am. J. Med. 1970, 49, 352–359. [Google Scholar] [CrossRef]
- Roch-Ramel, F.; Guisan, B.; Schild, L. Indirect coupling of urate and p-aminohippurate transport to sodium in human brush-border membrane vesicles. Am. J. Physiol. 1996, 270, F61–F68. [Google Scholar] [CrossRef]
- Reeds, P.J.; Mersmann, H.J. Protein and energy requirements of animals treated with β-adrenergic agonists: A discussion. J. Anim. Sci. 1991, 69, 1532–1550. [Google Scholar] [CrossRef]


| A | B | C | D | |
|---|---|---|---|---|
| Components | Placebo | Tryptophan | Glycine | Glycine+Tryptophan |
| Glycine (g) | - | - | 6.0 | 6.0 |
| L-Tryptophan (g) | - | 0.4 | - | 0.4 |
| Dextrin (g) | 6.4 | 6.0 | 0.4 | - |
| Purines (g) | 0.2 | 0.2 | 0.2 | 0.2 |
| Water (ml) | 100 | 100 | 100 | 100 |
| Parameters | Means (SD) | |
|---|---|---|
| Age (years) | 38.3 (9.2) | |
| Body weight (kg) | 74.8 (10.3) | |
| Body mass index (kg/m2) | 25.2 (3.9) | |
| Drinking habits | ||
| Drinker | 14 | |
| Non-Drinker | 2 | |
| Smoking habits | ||
| Smoker | 2 | |
| Non-Smoker | 12 | |
| Ex-Smoker | 2 | |
| Serum concentrations | ||
| Uric acid (mg/dL) | 6.7 (0.9) | |
| Creatinine (mg/dL) | 0.89 (0.10) | |
| BUN (mg/dL) | 15 (2) | |
| Albumin (g/dL) | 4.9 (0.2) | |
| Total protein (g/dL) | 7.4 (0.3) | |
| ALT (U/L) | 27 (12) | |
| AST (U/L) | 24 (5) | |
| GGT (U/L) | 27 (17) | |
| Total bilirubin (mg/dL) | 0.7 (0.3) | |
| Glucose (mg/dL) | 91 (6) | |
| Triglyceride (mg/dL) | 84 (44) | |
| Total cholesterol (mg/dL) | 190 (32) | |
| Change in Uric Acid Levels | |||||
|---|---|---|---|---|---|
| 0 h | 1 h | 2 h | 1 h | 2 h | |
| Placebo, n = 16 | 6.7 (1.1) | 7.0 (1.2) ** | 6.9 (1.1) ** | 0.30 (0.17) a | 0.23 (0.11) a |
| Tryptophan, n = 15 | 6.7 (0.9) | 7.0 (0.9) ** | 6.9 (0.9) ** | 0.26 (0.13) a,b | 0.15 (0.17) a,b |
| Glycine, n = 16 | 6.9 (1.0) | 7.1 (1.1) ** | 6.9 (1.1) | 0.19 (0.11) a,b | 0.05 (0.14) b |
| Glycine + Tryptophan, n = 16 | 6.7 (0.9) | 6.9 (0.9) ** | 6.7 (0.9) | 0.15 (0.15) b | 0.01 (0.21) b |
| Placebo | Tryptophan | Glycine | Glycine + Tryptophan | |
|---|---|---|---|---|
| Urinary uric acid excretion (mg/kg/h) | 0.441 (0.079) a | 0.453 (0.092) a | 0.596 (0.129) b | 0.653 (0.153) b |
| Urinary creatinine excretion (mg/kg/h) | 1.15 (0.19) a | 1.26 (0.22) a,b | 1.43 (0.33) b | 1.16 (0.26) a |
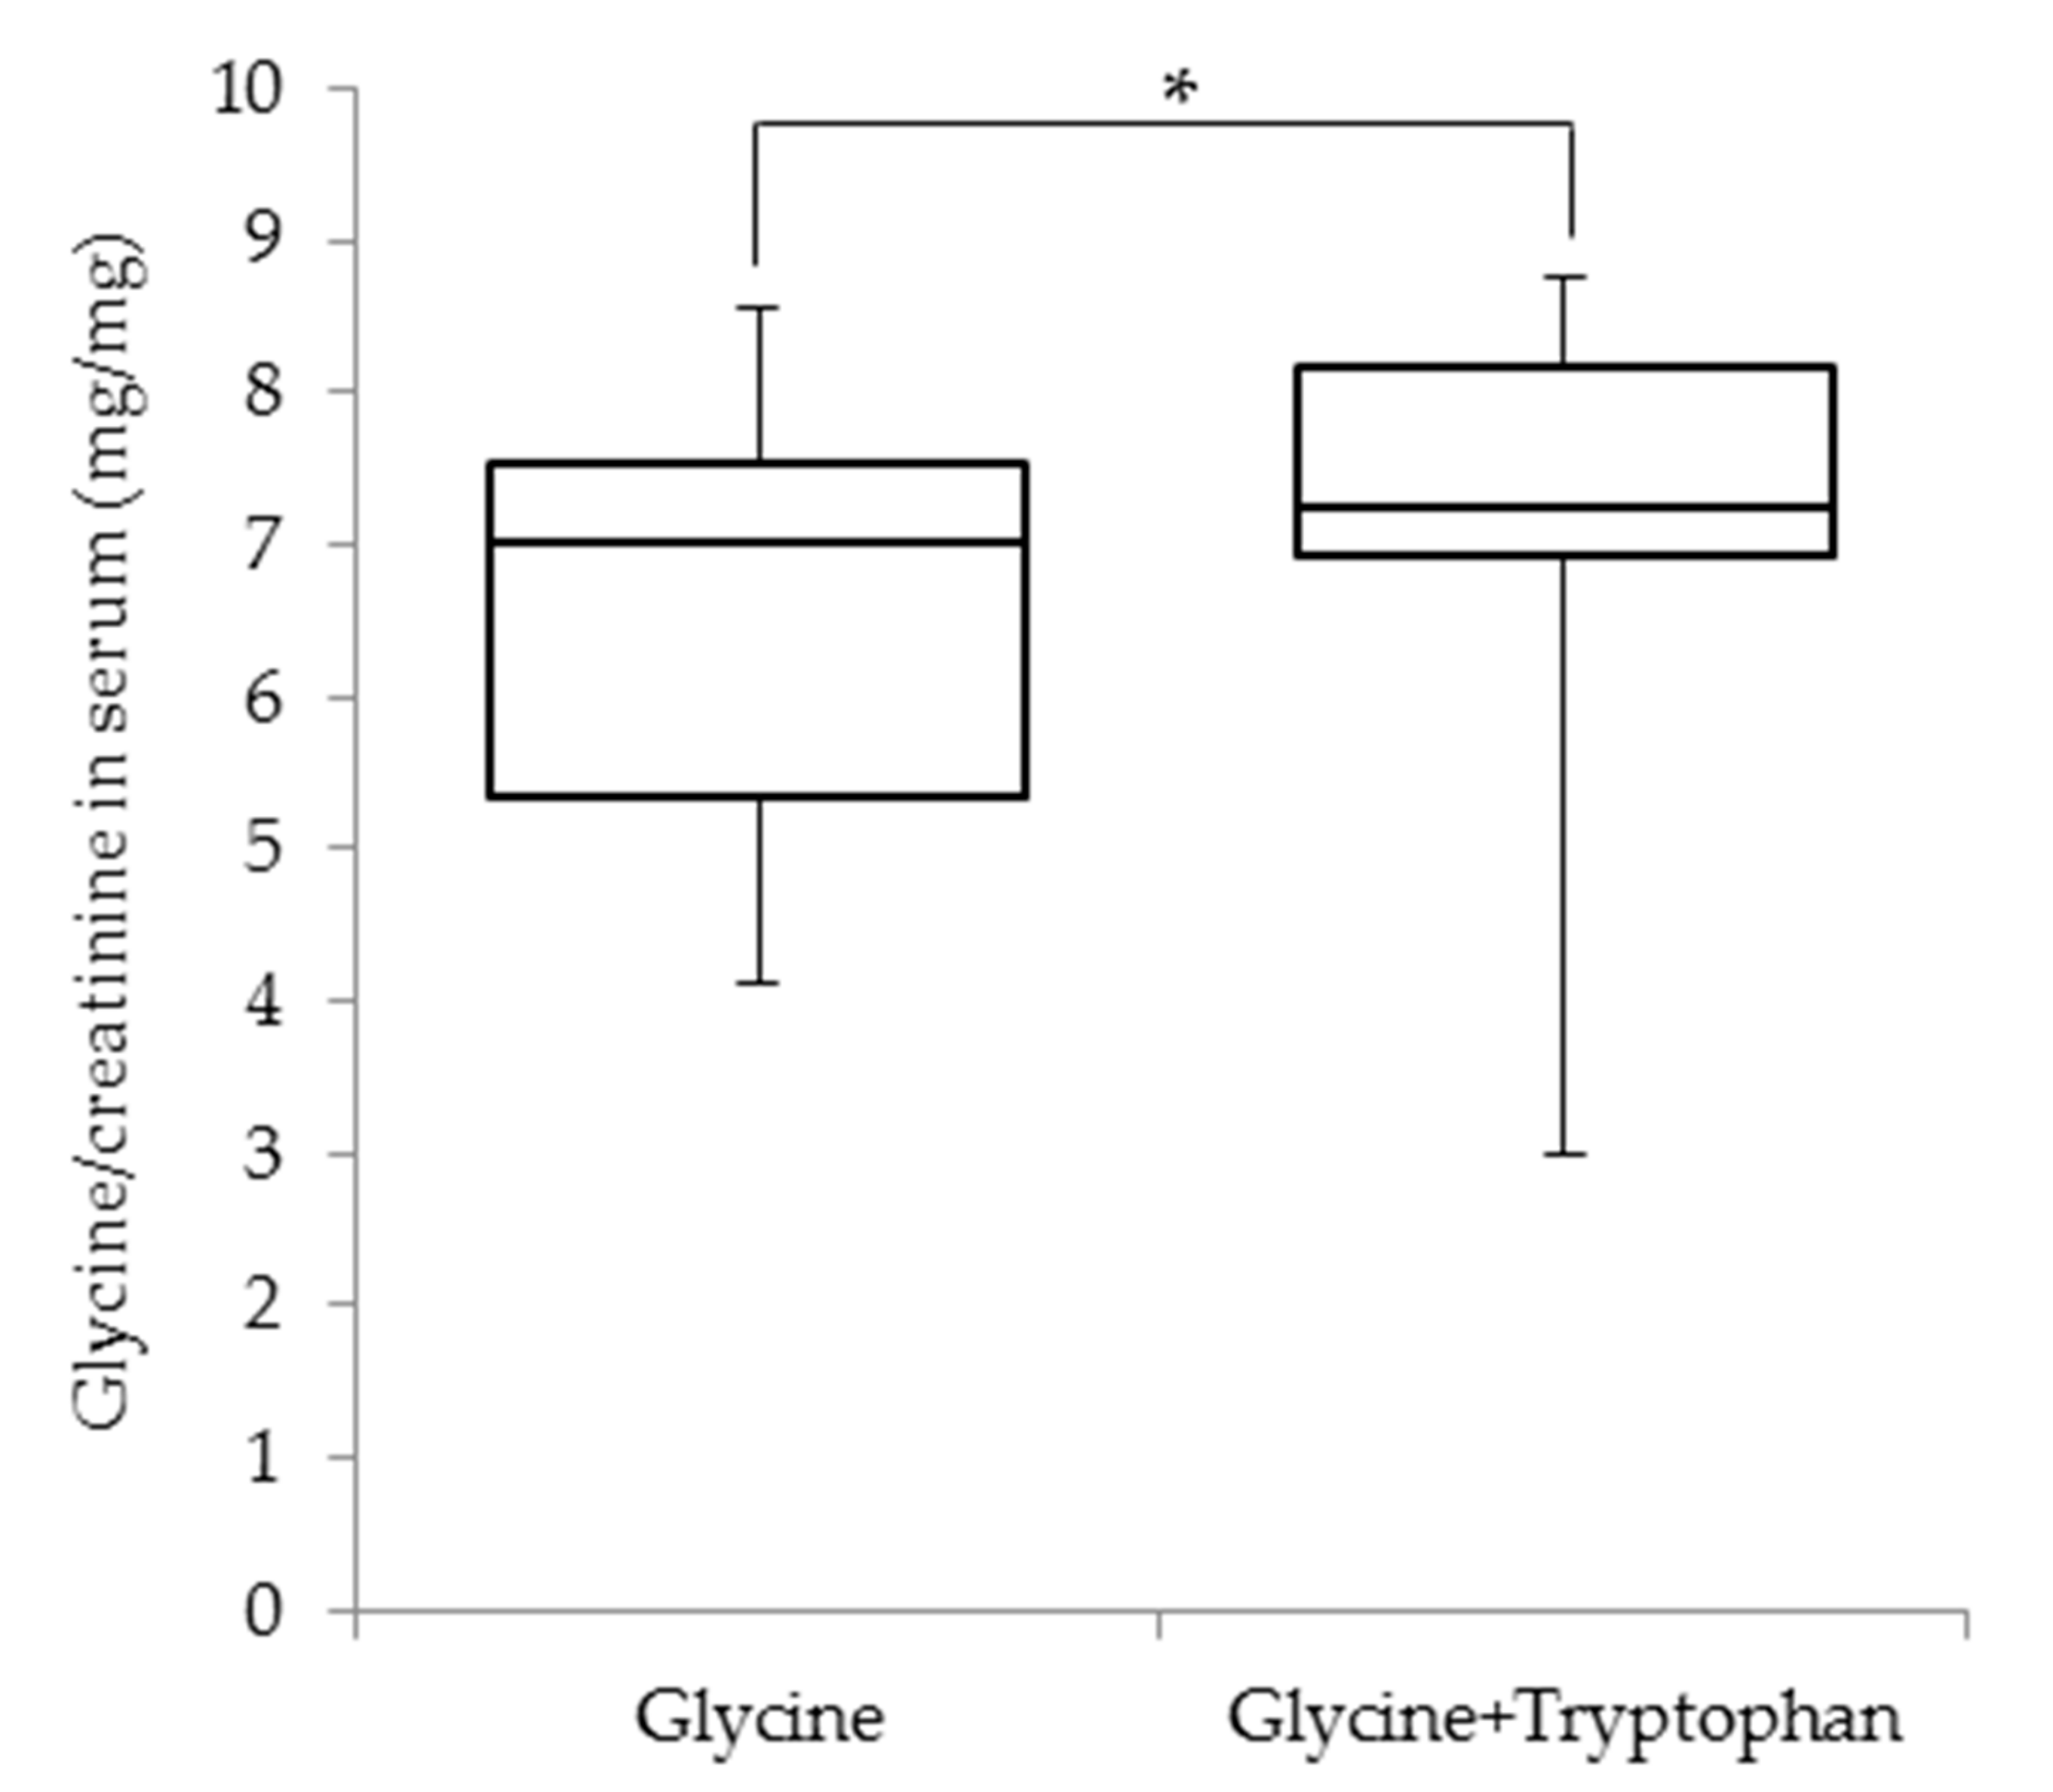
| Urinary uric acid/creatinine (mg/mg) | 0.40 (0.11) a | 0.37 (0.10) a | 0.44 (0.13) a | 0.58 (0.16) b |
| Urate clearance (mL/min) | 7.5 (1.5) a | 7.7 (1.9) a | 9.9 (2.6) b | 11.0 (2.5) b |
| Creatinine clearance (mL/min) | 150 (15) a | 176 (41) a,b | 187 (39) b | 156 (29) a |
| Urinary pH | 6.22 (0.44) a | 6.23 (0.55) a | 6.54 (0.64) a,b | 6.83 (0.35) b |
| Placebo | Tryptophan | Glycine | Glycine + Tryptophan | |||||||||
|---|---|---|---|---|---|---|---|---|---|---|---|---|
| 0 h | 1 h | 2 h | 0 h | 1 h | 2 h | 0 h | 1 h | 2 h | 0 h | 1 h | 2 h | |
| Serum glycine (mg/dL) | 1.2 (0.2) | 1.2 (0.2) | 1.2 (0.2) | 1.3 (0.2) | 1.2 (0.2) | 1.2 (0.2) | 1.3 (0.2) | 5.7 (1.4) ** | 2.6 (0.4) ** | 1.3 (0.2) | 6.0 (1.6) ** | 2.6 (0.5) ** |
| Serum L-tryptophan (mg/dL) | 1.1 (0.2) | 1.1 (0.2) | 1.0 (0.2) | 1.1 (0.1) | 2.4 (0.3) ** | 1.8 (0.3) ** | 1.1 (0.1) | 1.1 (0.2) | 1.1 (0.2) | 1.0 (0.1) | 2.2 (0.4) ** | 1.7 (0.2) ** |
| Serum creatinine (mg/dL) | 0.89 (0.11) | 0.86 (0.09) | 0.85 (0.09) * | 0.88 (0.10) | 0.81 (0.10) ** | 0.83 (0.10) * | 0.88 (0.10) | 0.87 (0.10) | 0.86 (0.10) | 0.88 (0.11) | 0.83 (0.11) ** | 0.84 (0.11) ** |
| Urinary glycine excretion (mg/kg/h) | 0.04 (0.02) a | 0.04 (0.02) a | 0.37 (0.23) b | 0.49 (0.35) b | ||||||||
| Urinary tryptophan excretion (mg/kg/h) | 0.007 (0.003) a | 0.014 (0.006) b | 0.007 (0.003) a | 0.015 (0.005) b | ||||||||
| Serum Glycine Levels | Serum Tryptophan Levels | |||||
|---|---|---|---|---|---|---|
| 0 h | 1 h | 2 h | 0 h | 1 h | 2 h | |
| Urinary uric acid excretion | −0.010 | 0.560 ** | 0.546 ** | −0.126 | 0.046 | 0.017 |
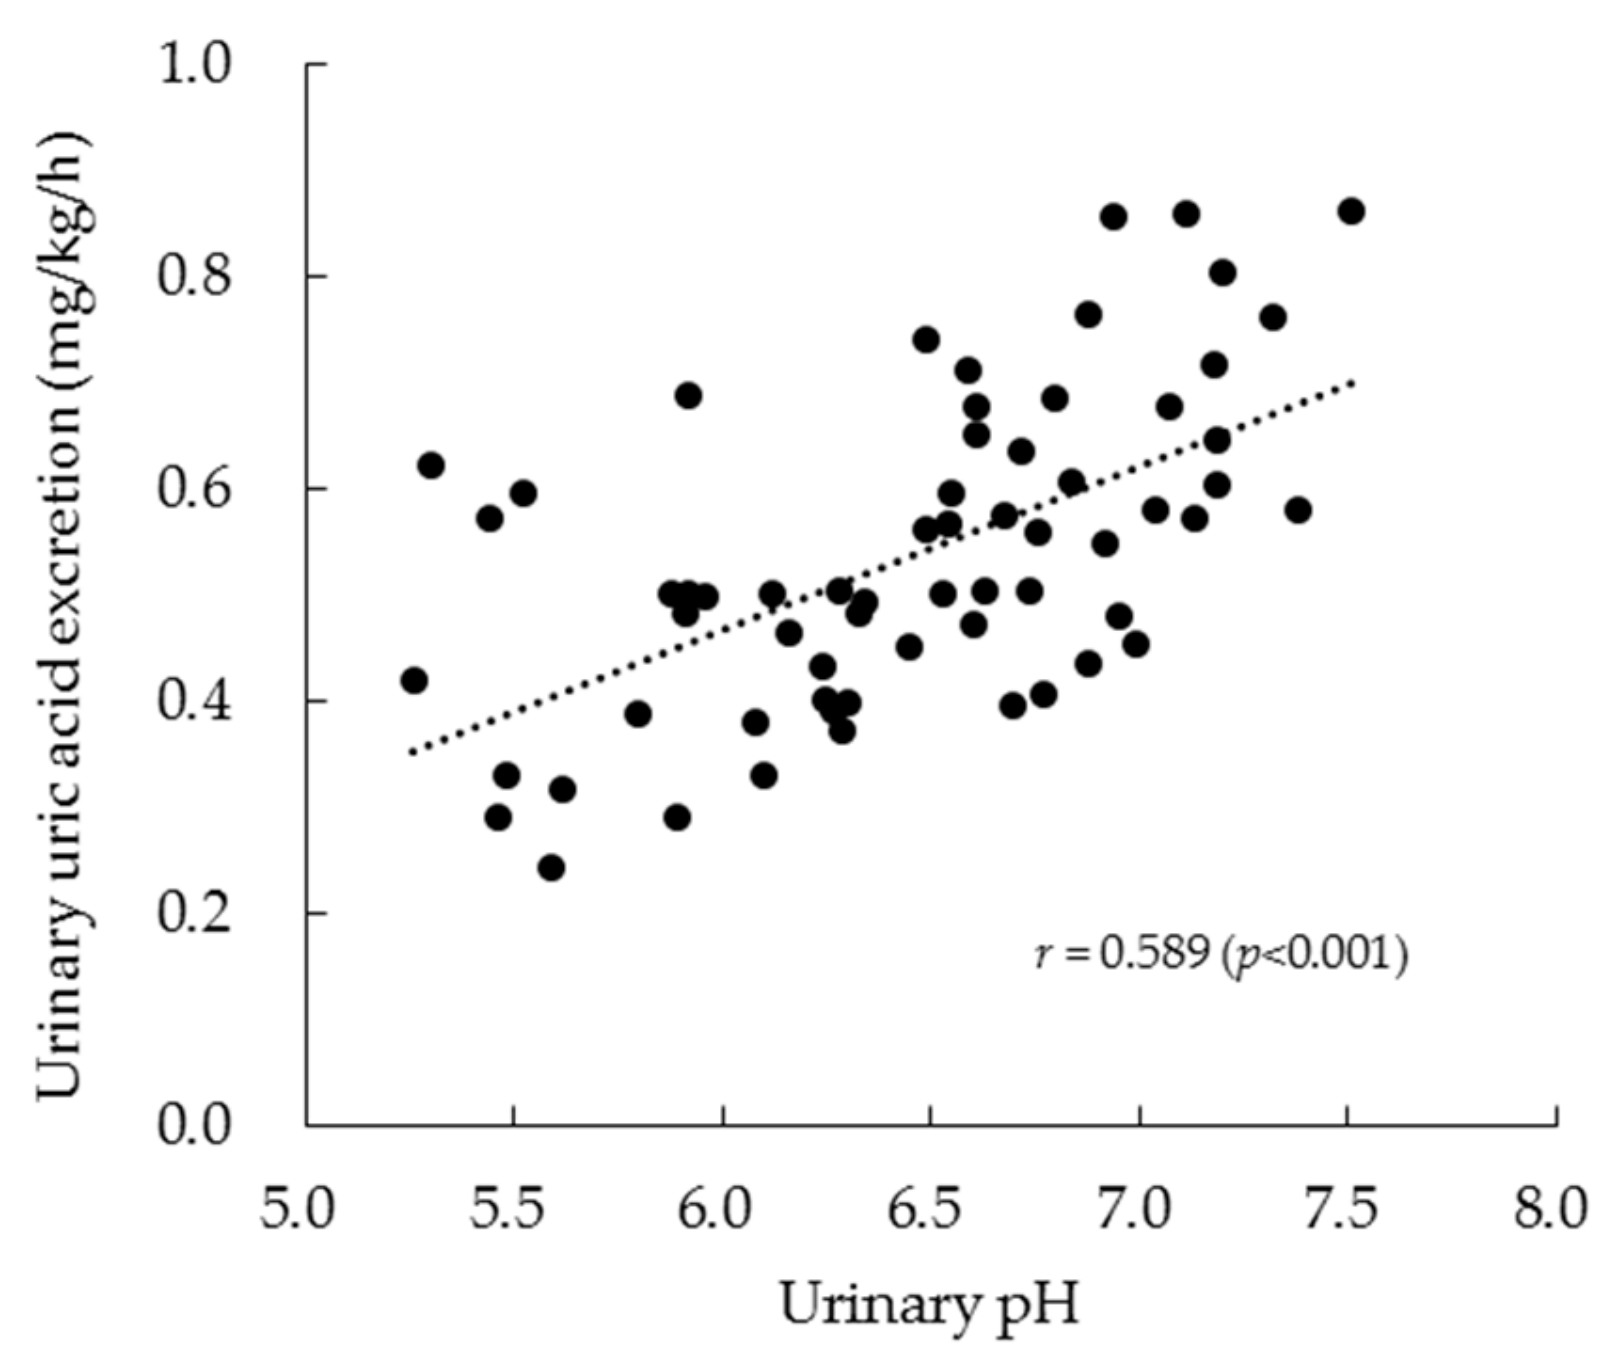
| Urinary pH | −0.006 | 0.385 ** | 0.419 ** | −0.147 | 0.087 | 0.052 |
© 2019 by the authors. Licensee MDPI, Basel, Switzerland. This article is an open access article distributed under the terms and conditions of the Creative Commons Attribution (CC BY) license (http://creativecommons.org/licenses/by/4.0/).
Share and Cite
Oshima, S.; Shiiya, S.; Nakamura, Y. Combined Supplementation with Glycine and Tryptophan Reduces Purine-Induced Serum Uric Acid Elevation by Accelerating Urinary Uric Acid Excretion: A Randomized, Single-Blind, Placebo-Controlled, Crossover Study. Nutrients 2019, 11, 2562. https://doi.org/10.3390/nu11112562
Oshima S, Shiiya S, Nakamura Y. Combined Supplementation with Glycine and Tryptophan Reduces Purine-Induced Serum Uric Acid Elevation by Accelerating Urinary Uric Acid Excretion: A Randomized, Single-Blind, Placebo-Controlled, Crossover Study. Nutrients. 2019; 11(11):2562. https://doi.org/10.3390/nu11112562
Chicago/Turabian StyleOshima, Shunji, Sachie Shiiya, and Yasunori Nakamura. 2019. "Combined Supplementation with Glycine and Tryptophan Reduces Purine-Induced Serum Uric Acid Elevation by Accelerating Urinary Uric Acid Excretion: A Randomized, Single-Blind, Placebo-Controlled, Crossover Study" Nutrients 11, no. 11: 2562. https://doi.org/10.3390/nu11112562
APA StyleOshima, S., Shiiya, S., & Nakamura, Y. (2019). Combined Supplementation with Glycine and Tryptophan Reduces Purine-Induced Serum Uric Acid Elevation by Accelerating Urinary Uric Acid Excretion: A Randomized, Single-Blind, Placebo-Controlled, Crossover Study. Nutrients, 11(11), 2562. https://doi.org/10.3390/nu11112562