Bone Mineral Density in Premenopausal Women Is Associated with the Dietary Intake of α-Tocopherol: A Cross-Sectional Study


Abstract
1. Introduction
2. Materials and Methods
2.1. Study Population
2.2. Measurements
2.3. Statistical Analyses
3. Results
4. Discussion
5. Conclusions
Author Contributions
Funding
Acknowledgments
Conflicts of Interest
References
- Yoshimura, N.; Muraki, S.; Oka, H.; Mabuchi, A.; En-Yo, Y.; Yoshida, M.; Suzuki, T.; Yamamoto, S.; Ishibashi, H.; Kawaguchi, H.; et al. Prevalence of knee osteoarthritis, lumbar spondylosis, and osteoporosis in Japanese men and women: The research on osteoarthritis/osteoporosis against disability study. J. Bone Miner. Mtab. 2009, 27, 620–628. [Google Scholar] [CrossRef] [PubMed]
- Guidelines for Prevention and Treatment of Osteoporosis 2015. Available online: http://www.josteo.com/ja/guideline/doc/15_1.pdf (accessed on 4 March 2019).
- Orimo, H.; Yaegashi, Y.; Onoda, T.; Fukushima, Y.; Hosoi, T.; Sakata, K. Hip fracture incidence in Japan: Estimates of new patients in 2007 and 20-year trends. Arch. Osteoporos. 2009, 4, 71–77. [Google Scholar] [CrossRef] [PubMed]
- Welten, D.C.; Kemper, H.C.; Post, G.B.; van Staveren, W.A. A meta-analysis of the effect of calcium intake on bone mass in young and middle aged females and males. J. Nutr. 1995, 125, 2802–2813. [Google Scholar] [CrossRef] [PubMed]
- Lips, P.; van Schoor, N.M. The effect of vitamin D on bone and osteoporosis. Best Pract. Res. Clin. Endocrinol. Metab. 2011, 25, 585–591. [Google Scholar] [CrossRef] [PubMed]
- Chen, L.R.; Wen, Y.T.; Kuo, C.L.; Chen, K.H. Calcium and vitamin D supplementation on bone health: Current evidence and recommendations. Int. J. Gerontol. 2014, 8, 183–188. [Google Scholar] [CrossRef]
- Tang, B.M.; Eslick, G.D.; Nowson, C.; Smith, C.; Bensoussan, A. Use of calcium or calcium in combination with vitamin D supplementation to prevent fractures and bone loss in people aged 50 years and older: A meta-analysis. Lancet 2007, 370, 657–666. [Google Scholar] [CrossRef]
- Dawon-Hughes, B.; Dallal, G.E.; Krall, E.A.; Sadowski, L.; Sahyoun, N.; Tannenbaum, S. A controlled trial of the effect of calcium supplementation on bone density in postmenopausal women. N. Engl. J. Med. 1990, 323, 878–883. [Google Scholar] [CrossRef]
- Inaba, N.; Sato, T.; Yamashita, T. Low-dose daily intake of vitamin K (menaquinone-7) improves osteocalcin γ-carboxylation: A double-blind, randomized controlled trials. J. Nutr. Sci. Vitaminol. 2015, 61, 471–480. [Google Scholar] [CrossRef]
- Booth, S.L.; Broe, K.E.; Gagnon, D.R.; Tucker, K.L.; Hannan, M.T.; McLean, R.R.; Dawson-Hughes, B.; Wilson, P.W.; Cupples, L.A.; Kiel, D.P. Vitamin K intake and bone mineral density in women and men. Am. J. Clin. Nutr. 2003, 77, 512–516. [Google Scholar] [CrossRef]
- Fang, Y.; Hu, C.; Tao, X.; Wan, Y.; Tao, F. Effect of vitamin K on bone mineral density: A meta-analysis of randomized controlled trials. J. Bone Miner. Metab. 2012, 30, 60–68. [Google Scholar] [CrossRef]
- Sasaki, S.; Yanagibori, R.; Amano, K. Validity of a self-administered diet history questionnaire for assessment of sodium and potassium: Comparison with single 24-hour urinary excretion. Jpn. Circ. J. 1998, 62, 431–435. [Google Scholar] [CrossRef] [PubMed]
- Kobayashi, S.; Murakami, K.; Sasaki, S.; Okubo, H.; Hirota, N.; Notsu, A.; Fukui, M.; Date, C. Comparison of relative validity of food group intakes estimated by comprehensive and brief-type self-administered diet history questionnaires against 16 d dietary records in Japanese adults. Public Health Nutr. 2011, 14, 1200–1211. [Google Scholar] [CrossRef] [PubMed]
- Kobayashi, S.; Honda, S.; Murakami, K.; Sasaki, S.; Okubo, H.; Hirota, N.; Notsu, A.; Fukui, M.; Date, C. Both comprehensive and brief self-administered diet history questionnaires satisfactorily rank nutrient intakes in Japanese adults. J. Epidemiol. 2012, 22, 151–159. [Google Scholar] [CrossRef] [PubMed]
- Frassetto, L.A.; Todd, K.M.; Morris, R.C., Jr.; Sebastian, A. Estimation of net endogenous noncarbonic acid production in humans from diet potassium and protein contents. Am. J. Clin. Nutr. 1998, 68, 576–583. [Google Scholar] [CrossRef]
- Remer, T.; Dimitriou, T.; Manz, F. Dietary potential renal acid load and renal net acid excretion in healthy, free-living children and adolescents. Am. J. Clin. Nutr. 2003, 77, 1255–1260. [Google Scholar] [CrossRef]
- Remer, T.; Manz, F. Estimation of the renal net acid excretion by adults consuming diets containing variable amounts of protein. Am. J. Clin. Nutr. 1994, 59, 1356–1361. [Google Scholar] [CrossRef]
- Traber, M.G.; Aktkinson, J. Vitamin E, antioxidant and nothing more. Free Radic. Biol. Med. 2007, 43, 4–15. [Google Scholar] [CrossRef]
- Overview of Dietary Reference Intakes for Japanese 2015. Available online: http://www.mhlw.go.jp/file/06-Seisakujouhou-10900000-Kenkoukyoku/Overview.pdf (accessed on 4 March 2019).
- Manolagas, S.C. From estrogen-centric to aging and oxidative stress: A revised perspective of the pathogenesis of osteoporosis. Endocr. Rev. 2010, 31, 266–300. [Google Scholar] [CrossRef]
- Yoshida, Y.; Itoh, N.; Hayakawa, M.; Habuchi, Y.; Saito, Y.; Tsukamoto, Y.; Cynshi, O.; Jishage, K.; Arai, H.; Niki, E. The role of α-tocopherol in motor hypofunction with aging in α-tocopherol transfer protein knockout mice as assessed by oxidative stress biomarkers. J. Nutr. Biochem. 2010, 21, 66–76. [Google Scholar] [CrossRef]
- Almeida, M.; Han, L.; Martin-Millan, M.; Plotkin, L.I.; Stewart, S.A.; Roberson, P.K.; Kousteni, S.; O’Brien, C.A.; Bellido, T.; Parfitt, A.M.; et al. Skeletal involution by age-associated oxidative stress and its acceleration by loss of sex steroids. J. Biol. Chem. 2007, 282, 27285–27297. [Google Scholar] [CrossRef]
- Garrett, I.R.; Boyce, B.F.; Oreffo, R.O.; Bonewald, L.; Poser, J.; Mundy, G.R. Oxygen-derived free radicals stimulate osteoclastic bone resorption in rodent bone in vitro and vivo. J. Clin. Investig. 1990, 85, 632–639. [Google Scholar] [CrossRef] [PubMed]
- Riggs, B.L.; Melton, L.J.; Robb, R.A.; Camp, J.J.; Atkinson, E.J.; McDaniel, L.; Amin, S.; Rouleau, P.A.; Khosla, S. A population-based assessment of rates of bone loss at multiple skeletal sites: Evidence for substantial trabecular bone loss in young adult women and men. J. Bone Miner. Res. 2008, 23, 205–214. [Google Scholar] [CrossRef] [PubMed]
- Glatt, V.; Canalis, E.; Stadmeyer, L.; Bouxsein, M.L. Age-related changes in trabecular architecture differ in female and male C57BL/6J mice. J. Bone Miner. Res. 2007, 22, 1197–1207. [Google Scholar] [CrossRef] [PubMed]
- Saito, M.; Marumo, K. Collagen cross-links as a determinant of bone quality: A possible explanation for bone fragility in aging, osteoporosis, and diabetes mellitus. Osteoporos. Int. 2010, 21, 195–214. [Google Scholar] [CrossRef] [PubMed]
- Saito, M.; Marumo, K. Effects of collagen crosslinking on bone material properties in health and disease. Calcif. Tissue Int. 2015, 97, 242–261. [Google Scholar] [CrossRef] [PubMed]
- Witting, P.K.; Westerlund, C.; Stocker, R. A rapid and simple screening test for potential inhibitors of tocopherol-mediated peroxidation of LDL lipids. J. Lipid Res. 1996, 37, 853–867. [Google Scholar]
- Tappel, A.L. Vitamin E and selenium protection from in vivo lipid peroxidation. Ann. N. Y. Acad. Sci. 1980, 355, 18–31. [Google Scholar] [CrossRef]
- Roob, J.M.; Khoschsorur, G.; Tiran, A.; Horina, J.H.; Holzer, H.; Winklhofer-Roob, B.M. Vitamin E attenuates oxidative stress induced by intravenous iron in patients on hemodialysis. J. Am. Soc. Nephol. 2000, 11, 539–549. [Google Scholar]
- Mata-Granados, J.M.; Cuenca-Acebedo, R.; Luque de Castro, M.D.; Quesada Gómez, J.M. Lower vitamin E serum levels are associated with osteoporosis in early postmenopausal women: A cross-sectional study. J. Bone Miner. Metab. 2013, 31, 455–460. [Google Scholar] [CrossRef]
- Shi, W.Q.; Liu, J.; Cao, Y.; Zhu, Y.Y.; Guan, K.; Chen, Y.M. Association of dietary and serum vitamin E with bone mineral density in middle-aged and elderly Chinese adults: A cross-sectional study. Br. J. Nutr. 2016, 115, 113–120. [Google Scholar] [CrossRef]
- Melhus, H.; Michaëlsson, K.; Holmberg, L.; Wolk, A.; Ljunghall, S. Smoking, antioxidant vitamins, and the risk of hip fracture. J. Bone Miner. Res. 1999, 14, 129–135. [Google Scholar] [CrossRef] [PubMed]
- Michaëlsson, K.; Wolk, A.; Byberg, L.; Ärnlöv, J.; Melhus, H. Intake and serum concentrations of α-tocopherol in relation to fractures in elderly women and men: 2 cohort studies. Am. J. Clin. Nutr. 2014, 99, 107–114. [Google Scholar] [CrossRef] [PubMed]
- Hampson, G.; Edwards, S.; Sankaralingam, A.; Harrington, D.J.; Voong, K.; Fogelman, I.; Frost, M.L. Circulating concentrations of vitamin E isomers: Association with bone turnover and arterial stiffness in post-menopausal women. Bone 2015, 81, 407–412. [Google Scholar] [CrossRef] [PubMed]
- Hamidi, M.S.; Corey, P.N.; Cheung, A.M. Effects of vitamin E on bone turnover markers among US postmenopausal women. J. Bone Miner. Res. 2012, 27, 1368–1380. [Google Scholar] [CrossRef]
- Zhang, J.; Hu, X.; Zhang, J. Associations between serum vitamin E concentration and bone mineral density in the US elderly population. Osteoporos. Int. 2017, 28, 1245–1253. [Google Scholar] [CrossRef]
- Fujita, K.; Iwasaki, M.; Ochi, H.; Fukuda, T.; Ma, C.; Miyamoto, T.; Takitani, K.; Negishi-Koga, T.; Sunamura, S.; Kodama, T.; et al. Vitamin E decreases bone mass by stimulating osteoclast fusion. Nat. Med. 2012, 18, 589–594. [Google Scholar] [CrossRef]
- Ilesanmi-Oyelere, B.L.; Brough, L.; Coad, J.; Roy, N.; Kruger, M.C. The Relationship between Nutrient Patterns and Bone Mineral Density in Postmenopausal Women. Nutrients 2019, 11, 1262. [Google Scholar] [CrossRef]
- Ikegami, H.; Kawawa, R.; Ichi, I.; Ishikawa, T.; Koike, T.; Aoki, Y.; Fujiwara, Y. Excessive vitamin E intake does not cause bone loss in male or ovariectomized female mice fed normal or high-fat diets. J. Nutr. 2017, 147, 1932–1937. [Google Scholar] [CrossRef]


| Study Participants (n = 157) | Premenopause (n = 46) | Postmenopause (n = 111) | p Value | |
|---|---|---|---|---|
| Protein, % energy | 16.5 (3.4) | 15.1 (2.7) | 17.0 (3.5) | 0.001 ** |
| Animal protein, % energy | 9.4 (3.5) | 8.2 (3.1) | 9.9 (3.5) | 0.004 ** |
| Vegetable protein, % energy | 7.1 (1.3) | 6.9 (1.4) | 7.2 (1.3) | 0.052 |
| Fat, % energy | 26.9 (5.5) | 26.9 (6.1) | 26.9 (5.3) | 0.767 |
| Animal fat, % energy | 12.7 (4.2) | 12.3 (5.0) | 12.9 (3.8) | 0.300 |
| Vegetable fat, % energy | 14.2 (3.6) | 14.6 (3.7) | 14.0 (3.5) | 0.164 |
| Carbohydrate, % energy | 53.5 (8.1) | 54.5 (7.7) | 53.1 (8.3) | 0.313 |
| Ash, g/MJ | 2.7 (0.6) | 2.5 (0.5) | 2.8 (0.6) | 0.005 ** |
| Sodium, mg/MJ | 575.4 (140.2) | 532.7 (115.5) | 593.1 (146.1) | 0.027 * |
| Potassium, mg/MJ | 411.6 (120.1) | 381.9 (104.6) | 423.9 (124.3) | 0.034 * |
| Calcium, mg/MJ | 88.4 (30.0) | 80.1 (25.2) | 91.9 (31.2) | 0.024 * |
| Magnesium, mg/MJ | 38.9 (9.1) | 36.2 (7.6) | 40.0 (9.4) | 0.017 * |
| Phosphorus, mg/MJ | 153.1 (33.8) | 141.4 (26.4) | 158.0 (35.4) | 0.005 ** |
| Iron, mg/MJ | 1.2 (0.3) | 1.1 (0.3) | 1.3 (0.3) | 0.007 ** |
| Zinc, mg/MJ | 1.1 (0.2) | 1.1 (0.2) | 1.2 (0.2) | 0.003 ** |
| Copper, mg/MJ | 0.2 (0.0) | 0.2 (0.0) | 0.2 (0.0) | 0.006 ** |
| Manganese, mg/MJ | 0.5 (0.1) | 0.4 (0.1) | 0.5 (0.1) | 0.010 * |
| Daidzein, mg/MJ | 2.3 (1.3) | 2.0 (1.4) | 2.5 (1.3) | 0.012 * |
| Genistein, mg/MJ | 3.9 (2.3) | 3.4 (2.3) | 4.2 (2.2) | 0.012 * |
| Retinol, μg/MJ | 54.7 (32.6) | 57.8 (36.3) | 53.4 (31.0) | 0.626 |
| β-Carotene equivalents, μg/MJ | 689.4 (457.5) | 631.4 (496.7) | 713.4 (440.3) | 0.102 |
| Retinol equivalents, μg/MJ | 112.5 (47.1) | 110.8 (50.5) | 113.2 (45.8) | 0.608 |
| Vitamin D, μg/MJ | 2.0 (1.3) | 1.6 (0.9) | 2.1 (1.4) | 0.039 * |
| α-Tocopherol, mg/MJ | 1.1 (0.3) | 1.0 (0.3) | 1.1 (0.3) | 0.220 |
| Vitamin K, μg/MJ | 53.6 (28.2) | 47.9 (25.6) | 56.0 (29.0) | 0.110 |
| Vitamin B1, mg/MJ | 0.1 (0.0) | 0.1 (0.0) | 0.1 (0.0) | 0.019 * |
| Vitamin B2, mg/MJ | 0.2 (0.0) | 0.2 (0.0) | 0.2 (0.0) | 0.004 ** |
| Niacin, mg NE/MJ | 2.4 (0.6) | 2.3 (0.6) | 1.4 (0.7) | 0.061 |
| VitaminB6, mg/MJ | 0.2 (0.1) | 0.2 (0.0) | 0.2 (0.1) | 0.014 * |
| VitaminB12, μg/MJ | 1.3 (0.6) | 1.1 (0.5) | 1.4 (0.7) | 0.043 * |
| Folic acid, μg/MJ | 56.1 (20.3) | 51.2 (18.4) | 58.1 (20.7) | 0.039 * |
| Pantothenic acid, mg/MJ | 1.0 (0.2) | 0.9 (0.2) | 1.0 (0.2) | 0.008 ** |
| Vitamin C, mg/MJ | 20.3 (9.2) | 18.2 (8.4) | 21.2 (9.5) | 0.064 |
| Saturated fatty acid, g/MJ | 1.8(0.5) | 1.8 (0.6) | 1.8 (0.4) | 0.531 |
| Monounsaturated fatty acid, g/MJ | 2.2 (0.5) | 2.2 (0.5) | 2.2 (0.5) | 0.756 |
| Polyunsaturated fatty acid, g/MJ | 1.6 (0.3) | 1.5 (0.3) | 1.6 (0.3) | 0.737 |
| Cholesterol, mg/MJ | 49.0 (15.7) | 45.7 (14.5) | 50.3 (16.0) | 0.118 |
| n-3 fatty acid, g/MJ | 0.3 (0.1) | 0.3 (0.1) | 0.3 (0.1) | 0.031 * |
| n-6 fatty acid, g/MJ | 1.2 (0.3) | 1.2 (0.3) | 1.2 (0.3) | 0.873 |
| Soluble dietary fiber, g/MJ | 0.5 (0.2) | 0.5 (0.2) | 0.5 (0.2) | 0.073 |
| Insoluble dietary fiber, g/MJ | 1.4 (0.5) | 1.3 (0.4) | 1.4 (0.5) | 0.089 |
| Dietary fiber, g/MJ | 2.0 (0.7) | 1.8 (0.6) | 2.0 (0.7) | 0.078 |
| Alcohol, g/MJ | 0.6 (1.5) | 0.7 (1.2) | 0.6 (1.6) | 0.053 |
| Potential renal acid load, mEq/d | −0.3 (14.5) | −0.2 (12.9) | −0.3 (15.1) | 0.989 |
| Net endogenous acid production, mEq/d | 43.3 (12.0) | 42.5 (11.2) | 43.5 (12.4) | 0.626 |
| Study Participants | Premenopause | Postmenopause | |
|---|---|---|---|
| (n = 157) | (n = 46) | (n = 111) | |
| Age, years | 54.5 (7.0) | 49.2 (2.9) | 56.6 (7.1) |
| Height, cm | 156.8 (6.1) | 158.1 (5.2) | 156.2 (6.4) |
| Weight, kg | 53.2 (8.2) | 53.5 (8.9) | 53.0 (7.9) |
| Body mass index, kg/m2 | 21.7 (3.5) | 21.5 (3.9) | 21.8 (3.4) |
| Bone mineral density, g/cm2 | 1.044 (0.167) | 1.124 (0.181) | 1.010 (0.148) |
| Bone mineral density Z-score | 0.15 (1.26) | 0.30 (1.35) | 0.09 (1.23) |
| Drinking, % | |||
| never/sometimes/daily | 59.9/31.2/8.9 | 45.7/45.7/8.6 | 65.8/25.2/9.0 |
| Smoking, % | |||
| none/less than 20/20 or more cigarettes per day | 89.8/6.4/3.8 | 84.8/8.7/6.5 | 91.9/5.4/2.7 |
| Exercise, % | |||
| yes/no | 55.3/44.7 | 50.0/50.0 | 57.5/42.5 |
| Study Participants | Premenopause | Postmenopause | ||||
|---|---|---|---|---|---|---|
| R | p | R | p | R | p | |
| Protein | 0.12 | 0.133 | 0.10 | 0.498 | 0.10 | 0.201 |
| Animal protein | 0.11 | 0.156 | 0.07 | 0.622 | 0.09 | 0.277 |
| Vegetable protein | <0.01 | 0.913 | 0.03 | 0.843 | 0.04 | 0.624 |
| Fat | 0.1 | 0.214 | 0.15 | 0.323 | 0.04 | 0.599 |
| Animal fat | 0.13 | 0.097 | 0.11 | 0.469 | 0.12 | 0.141 |
| Vegetable fat | <−0.01 | 0.983 | 0.09 | 0.527 | −0.06 | 0.457 |
| Carbohydrate | −0.08 | 0.306 | −0.08 | 0.594 | −0.05 | 0.569 |
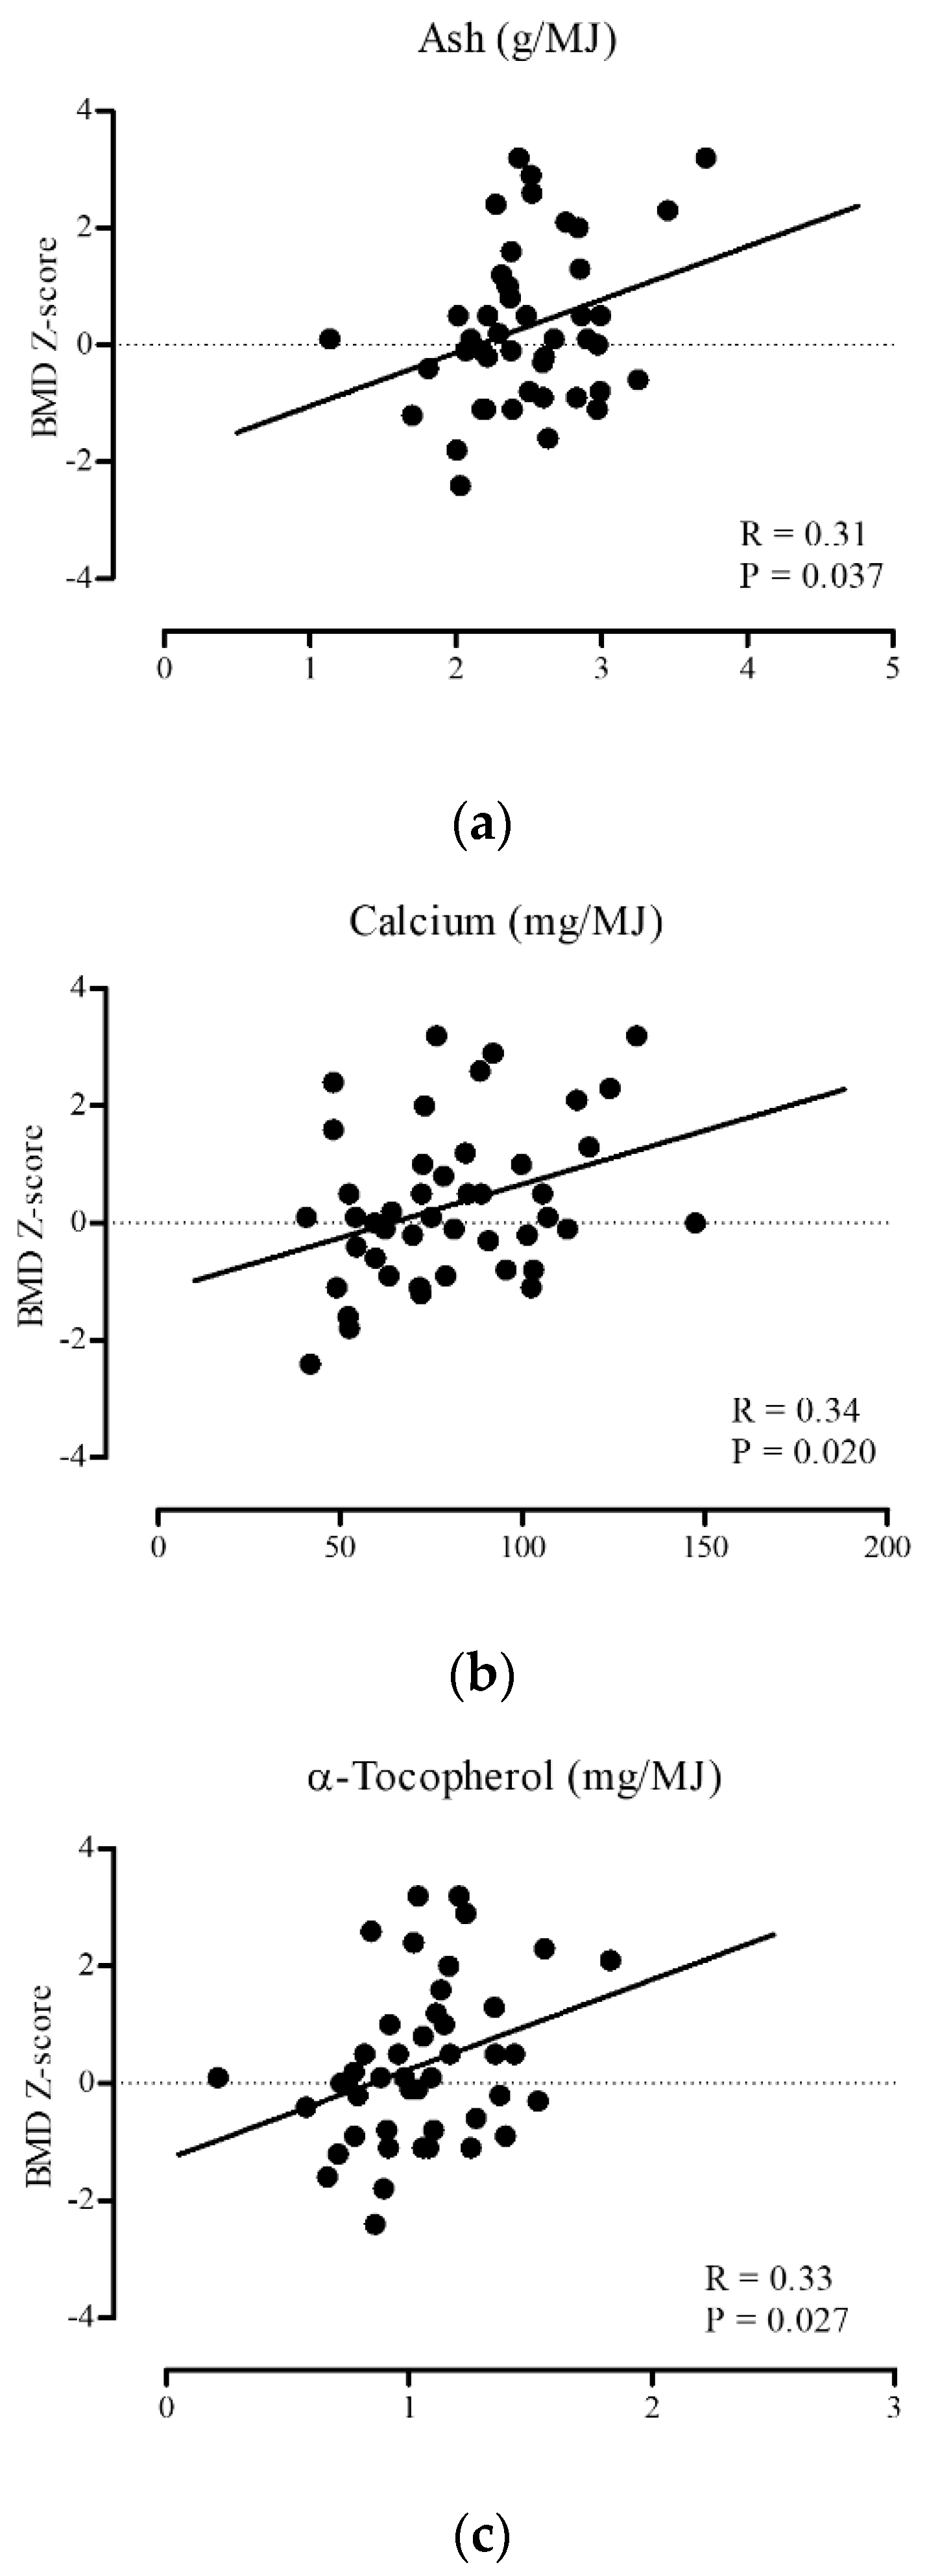
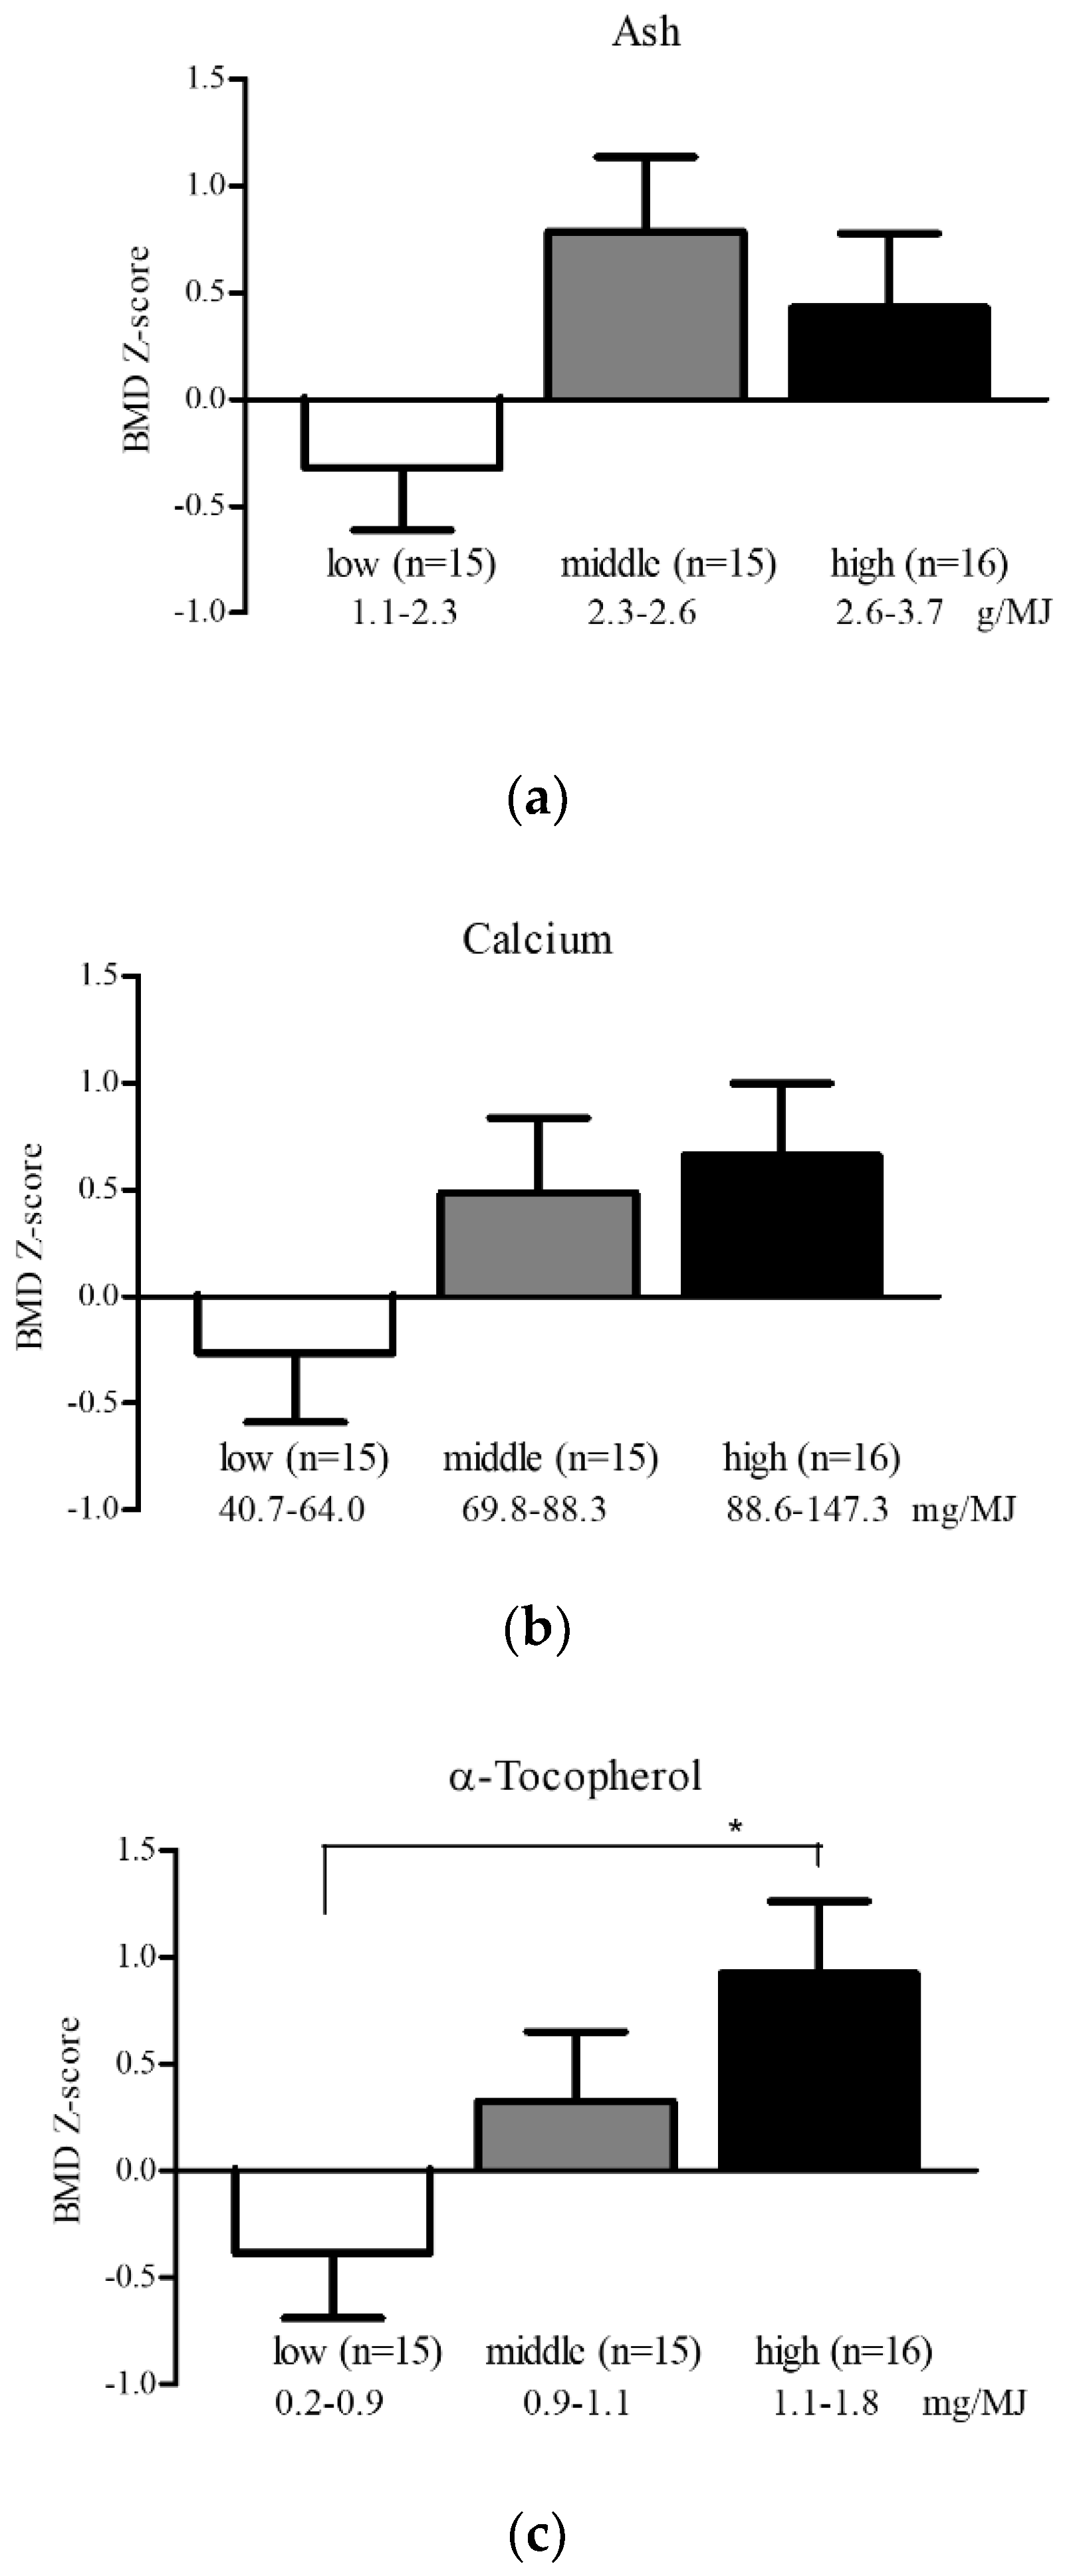
| Ash | 0.21 | 0.007 | 0.30 | 0.042 | 0.15 | 0.057 |
| Sodium | 0.2 | 0.012 | 0.20 | 0.175 | 0.14 | 0.070 |
| Potassium | 0.16 | 0.039 | 0.27 | 0.064 | 0.13 | 0.096 |
| Calcium | 0.15 | 0.059 | 0.33 | 0.023 | 0.05 | 0.545 |
| Magnesium | 0.15 | 0.053 | 0.23 | 0.123 | 0.10 | 0.189 |
| Phosphorus | 0.14 | 0.072 | 0.22 | 0.132 | 0.08 | 0.318 |
| Iron | 0.14 | 0.082 | 0.19 | 0.208 | 0.14 | 0.086 |
| Zinc | 0.05 | 0.526 | 0.05 | 0.745 | 0.0 | 0.412 |
| Copper | 0.08 | 0.315 | 0.08 | 0.593 | 0.09 | 0.250 |
| Manganese | 0.12 | 0.151 | 0.07 | 0.627 | 0.16 | 0.042 |
| Daidzein | 0.04 | 0.59 | 0.07 | 0.620 | 0.01 | 0.921 |
| Genistein | 0.04 | 0.588 | 0.08 | 0.604 | 0.01 | 0.918 |
| Retinol | −0.06 | 0.485 | −0.07 | 0.630 | −0.07 | 0.366 |
| β-Carotene equivalents | 0.11 | 0.165 | 0.27 | 0.067 | 0.09 | 0.284 |
| Retinol equivalents | 0.05 | 0.523 | 0.16 | 0.285 | 0.01 | 0.905 |
| Vitamin D | 0.11 | 0.14 | 0.10 | 0.499 | 0.06 | 0.447 |
| α-Tocopherol | 0.17 | 0.031 | 0.33 | 0.025 | 0.10 | 0.227 |
| Vitamin K | 0.1 | 0.228 | 0.13 | 0.371 | 0.06 | 0.443 |
| Vitamin B1 | 0.13 | 0.095 | 0.23 | 0.122 | 0.15 | 0.064 |
| Vitamin B2 | 0.16 | 0.041 | 0.16 | 0.281 | 0.13 | 0.098 |
| Niacin | 0.11 | 0.16 | −0.01 | 0.927 | 0.13 | 0.107 |
| Vitamin B6 | 0.16 | 0.045 | 0.11 | 0.477 | 0.19 | 0.014 |
| Vitamin B12 | 0.11 | 0.176 | <0.01 | 0.985 | 0.08 | 0.327 |
| Folic acid | 0.14 | 0.075 | 0.20 | 0.169 | 0.14 | 0.081 |
| Pantothenic acid | 0.12 | 0.13 | 0.11 | 0.446 | 0.11 | 0.179 |
| Vitamin C | 0.19 | 0.016 | 0.27 | 0.064 | 0.19 | 0.016 |
| Saturated fatty acid | 0.12 | 0.142 | 0.16 | 0.294 | 0.07 | 0.376 |
| Monounsaturated fatty acid | 0.06 | 0.442 | 0.09 | 0.558 | 0.03 | 0.732 |
| Polyunsaturated fatty acid | 0.05 | 0.527 | 0.14 | 0.356 | −0.03 | 0.665 |
| Cholesterol | 0.09 | 0.249 | 0.15 | 0.320 | 0.04 | 0.587 |
| n-3 fatty acid | 0.11 | 0.177 | 0.05 | 0.753 | 0.06 | 0.426 |
| n-6 fatty acid | 0.02 | 0.786 | 0.15 | 0.309 | −0.07 | 0.405 |
| Soluble dietary fiber | 0.1 | 0.219 | 0.16 | 0.282 | 0.11 | 0.185 |
| Insoluble dietary fiber | 0.14 | 0.074 | 0.21 | 0.148 | 0.15 | 0.059 |
| Dietary fiber | 0.13 | 0.103 | 0.20 | 0.172 | 0.14 | 0.073 |
| Alcohol | −0.01 | 0.869 | −0.03 | 0.817 | −0.01 | 0.870 |
| Potential renal acid load | −0.11 | 0.178 | −0.18 | 0.229 | −0.08 | 0.394 |
| Net endogenous acid production | −0.13 | 0.108 | −0.21 | 0.167 | −0.09 | 0.326 |
| β | SE | p-Value | R2 | |
|---|---|---|---|---|
| Model 1 | 0.366 | 0.158 | 0.027 | 0.107 |
| Model 2 | 0.366 | 0.160 | 0.029 | 0.178 |
| Model 3 | 0.452 | 0.184 | 0.022 | 0.270 |
© 2019 by the authors. Licensee MDPI, Basel, Switzerland. This article is an open access article distributed under the terms and conditions of the Creative Commons Attribution (CC BY) license (http://creativecommons.org/licenses/by/4.0/).
Share and Cite
Odai, T.; Terauchi, M.; Hirose, A.; Kato, K.; Miyasaka, N. Bone Mineral Density in Premenopausal Women Is Associated with the Dietary Intake of α-Tocopherol: A Cross-Sectional Study. Nutrients 2019, 11, 2474. https://doi.org/10.3390/nu11102474
Odai T, Terauchi M, Hirose A, Kato K, Miyasaka N. Bone Mineral Density in Premenopausal Women Is Associated with the Dietary Intake of α-Tocopherol: A Cross-Sectional Study. Nutrients. 2019; 11(10):2474. https://doi.org/10.3390/nu11102474
Chicago/Turabian StyleOdai, Tamami, Masakazu Terauchi, Asuka Hirose, Kiyoko Kato, and Naoyuki Miyasaka. 2019. "Bone Mineral Density in Premenopausal Women Is Associated with the Dietary Intake of α-Tocopherol: A Cross-Sectional Study" Nutrients 11, no. 10: 2474. https://doi.org/10.3390/nu11102474
APA StyleOdai, T., Terauchi, M., Hirose, A., Kato, K., & Miyasaka, N. (2019). Bone Mineral Density in Premenopausal Women Is Associated with the Dietary Intake of α-Tocopherol: A Cross-Sectional Study. Nutrients, 11(10), 2474. https://doi.org/10.3390/nu11102474