Free Sugars Intake, Sources and Determinants of High Consumption among Australian 2-Year-Olds in the SMILE Cohort

 ,
,  , ,
, ,  , , and
Abstract
1. Introduction
2. Materials and Methods
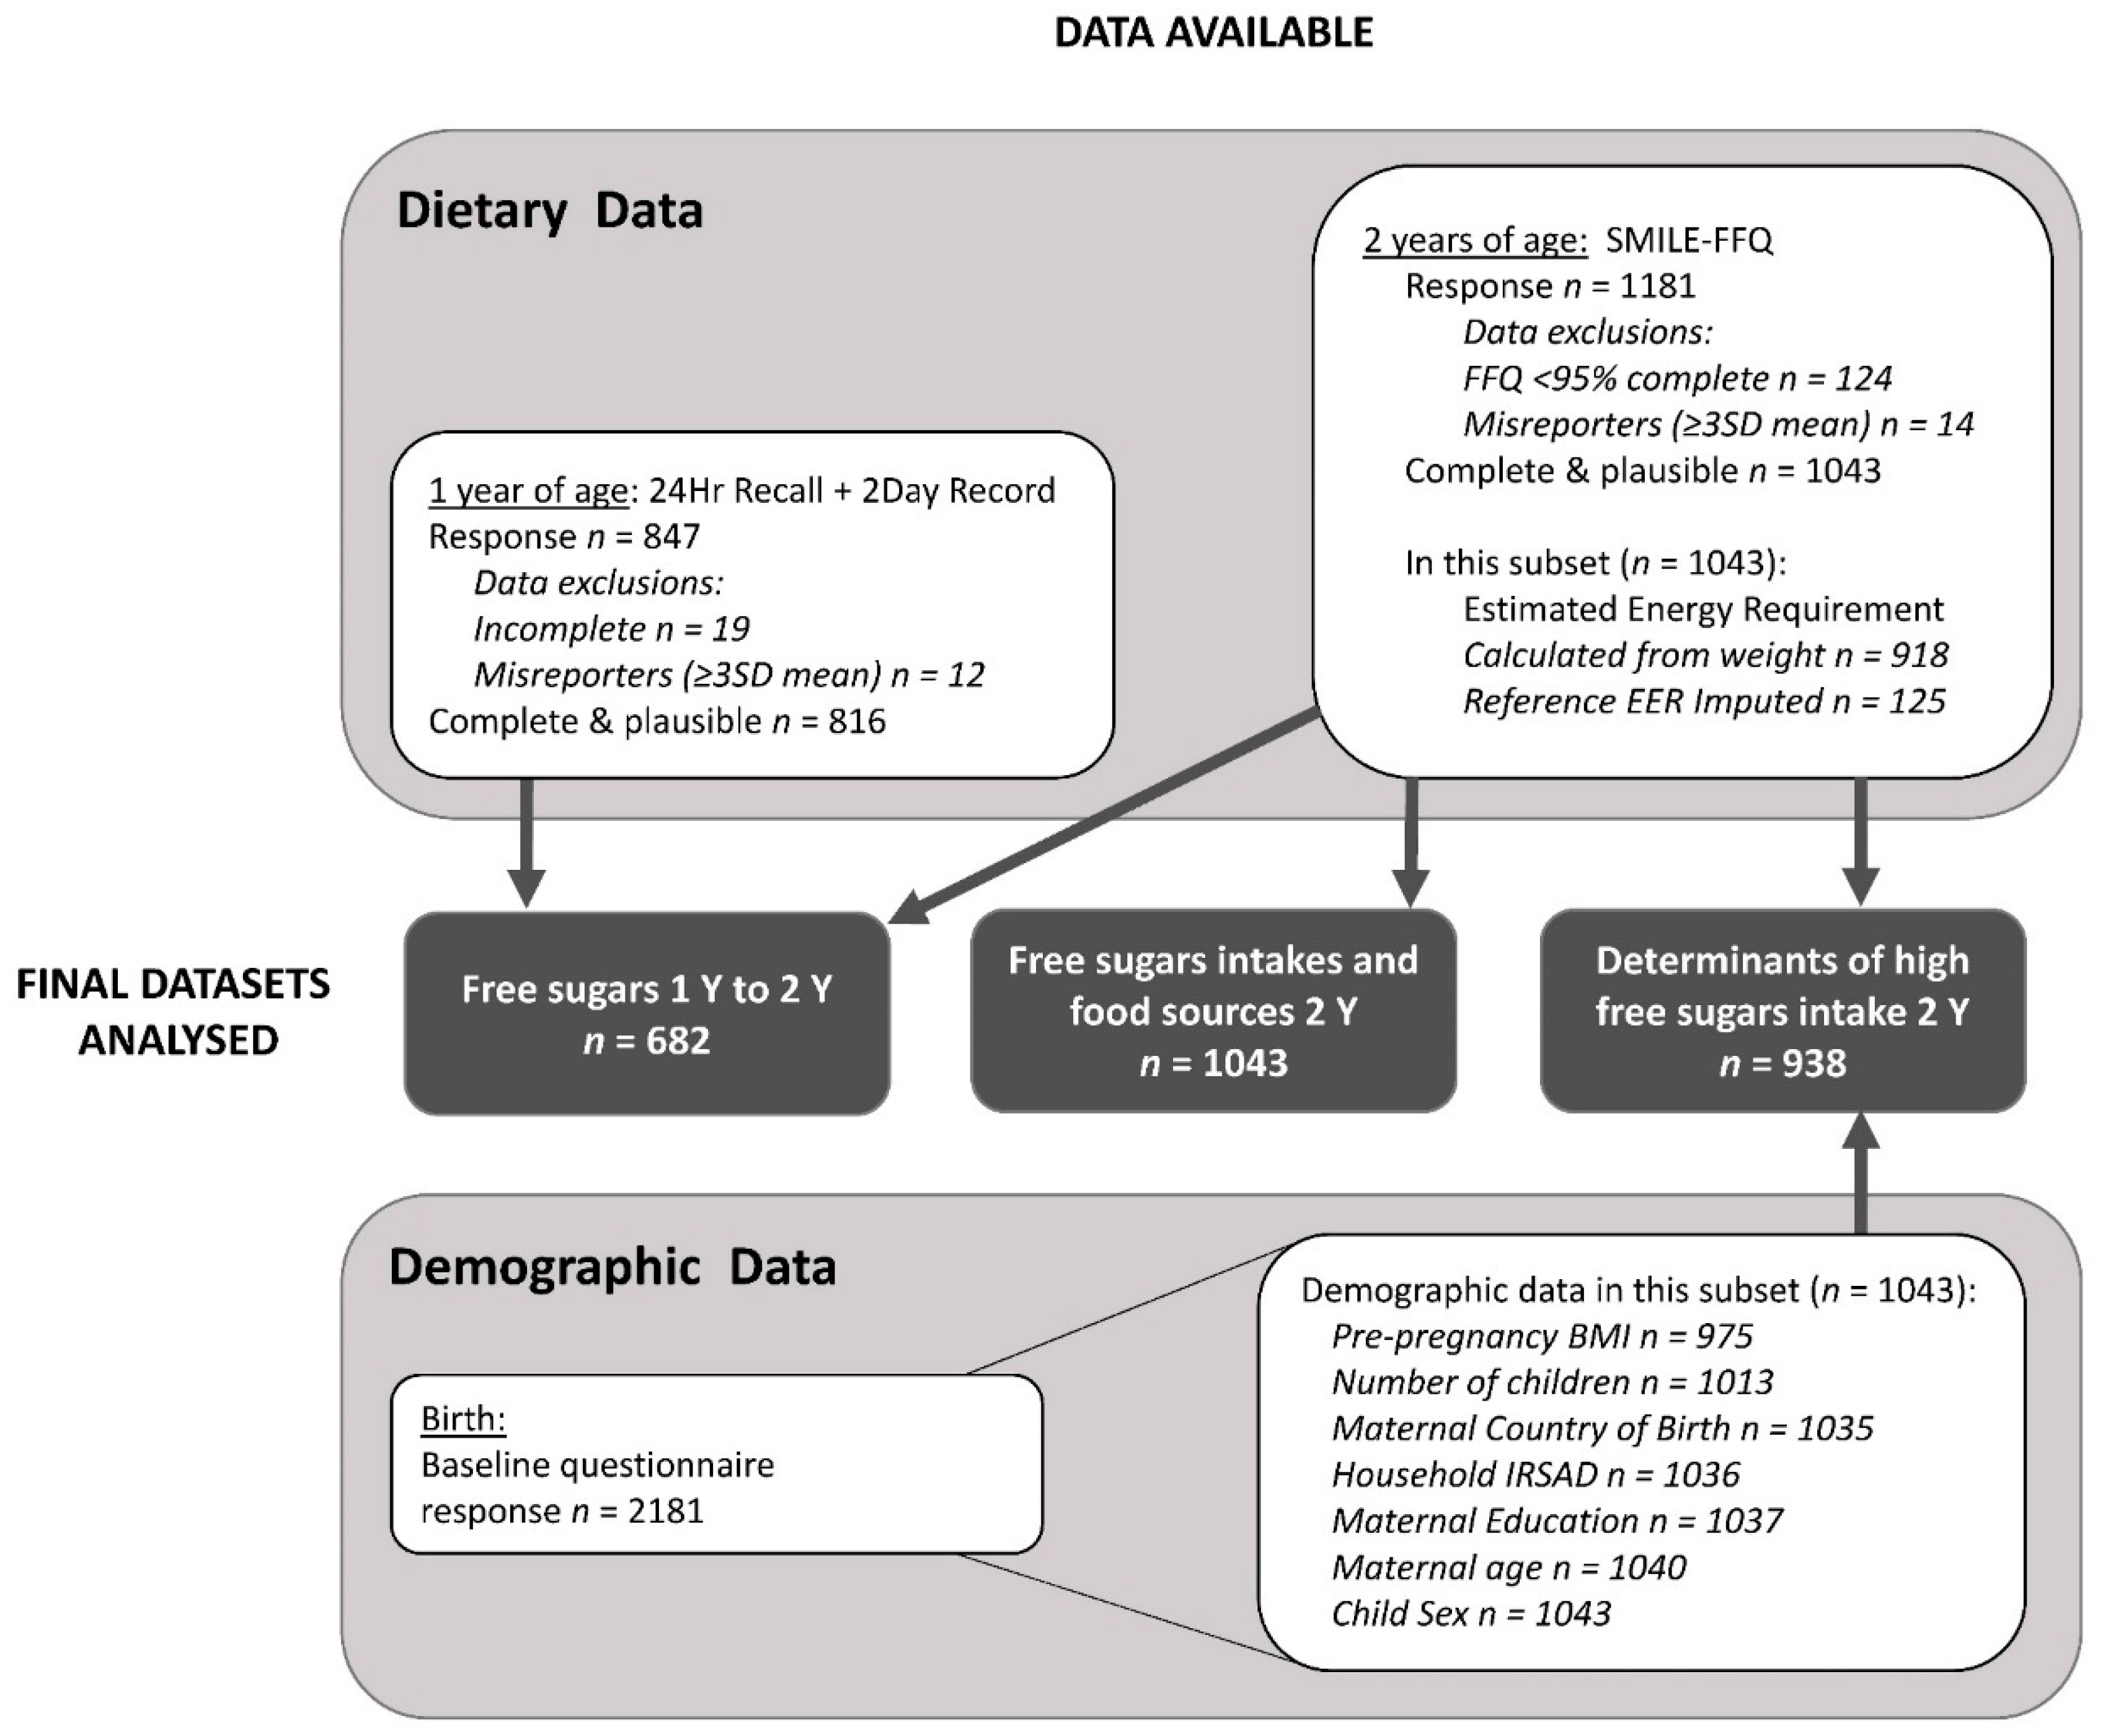
2.1. Recruitment and Data Source
2.2. Dietary Intake Data
2.3. Sociodemographic Data
2.4. Statistical Methods
3. Results
3.1. Participants
3.2. Free Sugars Intakes at 2 Years of Age
3.3. Food Group Contribution to Free Sugars Intakes
3.4. Changes in Free Sugars Consumption from 1 to 2 Years of Age
3.5. Determinants of High Free Sugars Intakes at 2 Years of Age
3.6. Sensitivity Analysis
4. Discussion
5. Conclusions
Supplementary Materials
Author Contributions
Funding
Acknowledgments
Conflicts of Interest
References
- Birch, L.L.; Doub, A.E. Learning to eat: Birth to age 2 y. Am. J. Clin. Nutr. 2014, 99, 723s–728s. [Google Scholar] [CrossRef] [PubMed]
- Nicklaus, S. Development of food variety in children. Appetite 2009, 52, 253–255. [Google Scholar] [CrossRef] [PubMed]
- National Health and Medical Research Council. Eat For Health: Australian Dietary Guidelines; No: N55; NHMRC: Canberra, Australia, 2013. Available online: http://www.eatforhealth.gov.au/guidelines (accessed on 6 December 2018).
- National Health and Medical Research Council. Infant Feeding Guidelines: Information for Health Workers; No: N56; NHMRC: Canberra, Australia, 2012. Available online: http://www.eatforhealth.gov.au/guidelines (accessed on 6 December 2018).
- World Health Organization. Guideline: Sugars Intake for Adults and Children; WHO: Geneva, Switzerland, 2015. [Google Scholar]
- Drewnowski, A.; Mennella, J.A.; Johnson, S.L.; Bellisle, F. Sweetness and Food Preference. J. Nutr. 2012, 142, 1142S–1148S. [Google Scholar] [CrossRef]
- Mennella, J.A. Ontogeny of taste preferences: Basic biology and implications for health. Am. J. Clin. Nutr. 2014, 99, 704s–711s. [Google Scholar] [CrossRef]
- Australian Bureau of Statistics. Australian Health Survey: Consumption of Added Sugars, 2011–2012; No: 4364.0.55.011; ABS: Canberra, Australia, 2017. Available online: http://www.abs.gov.au (accessed on 16 January 2018).
- Food Standards Australia and New Zealand. Determining the Amount of Added Sugars and Free Sugars in Foods Listed in the AUSNUT 2011–13 Dataset. Available online: http://www.foodstandards.gov.au (accessed on 19 February 2018).
- Koh, G.; Scott, J.; Oddy, W.; Graham, K.; Binns, C. Exposure to non-core foods and beverages in the first year of life: Results from a cohort study. Nutr. Diet. 2010. [Google Scholar] [CrossRef]
- Byrne, R.; Magarey, A.; Daniels, L. Food and beverage intake in Australian children aged 12–16 months participating in the NOURISH and SAIDI studies. Aust. N. Z. J. Public Health 2014, 38, 326–331. [Google Scholar] [CrossRef] [PubMed]
- Byrne, R.; Zhou, Y.; Perry, R.; Mauch, C.; Magarey, A. Beverage intake of Australian children and relationship with intake of fruit, vegetables, milk and body weight at 2, 3.7 and 5 years of age. Nutr. Diet. 2018. [Google Scholar] [CrossRef]
- Amezdroz, E.; Carpenter, L.; O’Callaghan, E.; Johnson, S.; Waters, E. Transition from milks to the introduction of solid foods across the first 2 years of life: Findings from an Australian birth cohort study. J. Hum. Nutr. Diet. 2015, 28, 375–383. [Google Scholar] [CrossRef]
- Bell, L.; Ullah, S.; Olds, T.; Magarey, A.; Leslie, E.; Jones, M.; Miller, M.; Cobiac, L. Prevalence and socio-economic distribution of eating, physical activity and sedentary behaviour among South Australian children in urban and rural communities: Baseline findings from the OPAL evaluation. Public Health 2016, 140, 196–205. [Google Scholar] [CrossRef]
- Conn, J.A.; Davies, M.J.; Walker, R.B.; Moore, V.M. Food and nutrient intakes of 9-month-old infants in Adelaide, Australia. Public Health Nutr. 2009, 12, 2448–2456. [Google Scholar] [CrossRef]
- Scott, J.; Davey, K.; Ahwong, E.; Devenish, G.; Ha, D.; Do, L. A Comparison by Milk Feeding Method of the Nutrient Intake of a Cohort of Australian Toddlers. Nutrients 2016, 8, 501. [Google Scholar] [CrossRef] [PubMed]
- Webb, K.; Rutihauser, I.; Knezevic, N. Foods, nutrients and portions consumed by a sample of Australian children aged 16-24 months. Nutr. Diet. 2008, 65, 56–65. [Google Scholar] [CrossRef]
- Atkins, L.A.; McNaughton, S.A.; Campbell, K.J.; Szymlek-Gay, E.A. Iron intakes of Australian infants and toddlers: Findings from the Melbourne Infant Feeding, Activity and Nutrition Trial (InFANT) Program. Br. J. Nutr. 2016, 115, 285–293. [Google Scholar] [CrossRef] [PubMed]
- Spence, A.C.; Campbell, K.J.; Lioret, S.; McNaughton, S.A. Early Childhood Vegetable, Fruit, and Discretionary Food Intakes Do Not Meet Dietary Guidelines, but Do Show Socioeconomic Differences and Tracking over Time. J. Acad. Nutr. Diet. 2018, 118, 1634–1643.e1. [Google Scholar] [CrossRef]
- Cameron, A.J.; Ball, K.; Pearson, N.; Lioret, S.; Crawford, D.A.; Campbell, K.; Hesketh, K.; McNaughton, S.A. Socioeconomic variation in diet and activity-related behaviours of Australian children and adolescents aged 2–16 years. Pediatr. Obes. 2012, 7, 329–342. [Google Scholar] [CrossRef] [PubMed]
- Chung, A.; Peeters, A.; Gearon, E.; Backholer, K. Contribution of discretionary food and drink consumption to socio-economic inequalities in children’s weight: Prospective study of Australian children. Int. J. Epidemiol. 2018, 1–9. [Google Scholar] [CrossRef] [PubMed]
- Devenish, G.; Ytterstad, E.; Begley, A.; Do, L.; Scott, J. Intake, sources, and determinants of free sugars intake in Australian children aged 12-14 months. Matern. Child Nutr. 2018, e12692. [Google Scholar] [CrossRef]
- Do, L.G.; Scott, J.A.; Thomson, W.M.; Stamm, J.W.; Rugg-Gunn, A.J.; Levy, S.M.; Wong, C.; Devenish, G.; Ha, D.H.; Spencer, A.J. Common risk factor approach to address socioeconomic inequality in the oral health of preschool children—A prospective cohort study. BMC Public Health 2014, 14, 429. [Google Scholar] [CrossRef]
- Scheil, W.; Jolly, K.; Scott, J.; Catcheside, B.; Sage, L.; Kennare, R. Pregnancy Outcome in South Australia 2013; Pregnancy Outcome Unit, SA Health, Government of South Australia: Adelaide, Australia, 2015. [Google Scholar]
- World Health Organization. Physical Status: Use and Interpretation of Anthropometry; WHO Expert Committee on Physical Status: Geneva, Switzerland, 1995. [Google Scholar]
- Devenish, G.; Mukhtar, A.; Begley, A.; Do, L.; Scott, J. Development and Relative Validity of a Food Frequency Questionnaire to Assess Intakes of Total and Free Sugars in Australian Toddlers. Int. J. Environ. Res. Public Health 2017, 14, 1361. [Google Scholar] [CrossRef]
- Louie, J.C.Y.; Moshtaghian, H.; Boylan, S.; Flood, V.M.; Rangan, A.M.; Barclay, A.W.; Brand-Miller, J.C.; Gill, T.P. A systematic methodology to estimate added sugar content of foods. Eur. J. Clin. Nutr. 2015, 69, 154–161. [Google Scholar] [CrossRef]
- National Health and Medical Research Council. Nutrient Reference Values for Australia and New Zealand; NHMRC: Canberra, Australia, 2006.
- Institute of Medicine. Dietary Reference Intakes: The Essential Guide to Nutrient Requirements; The National Academies Press: Washington, DC, USA, 2006. [Google Scholar]
- Australian Bureau of Statistics. Australian Health Survey Users’ Guide, 2011–2013: 24-Hour Dietary Recall; No: 4363.0.55.001; ABS: Canberra, Australia, 2014. Available online: http://www.abs.gov.au (accessed on 21 September 2018).
- Thompson, F.E.; Subar, A.F. Dietary Assessment Methodology. In Nutrition in the Prevention and Treatment of Disease, 3rd ed.; Coulston, A.M., Boushey, C., Ferruzzi, M., Eds.; Academic Press: London, UK, 2013. [Google Scholar]
- Food Standards Australia and New Zealand. AUSNUT 2011-13—Australian Food Composition Database; FSANZ: Canberra, Australia, 2014.
- Harttig, U.; Haubrock, J.; Knuppel, S.; Boeing, H. The MSM program: Web-based statistics package for estimating usual dietary intake using the Multiple Source Method. Eur. J. Clin. Nutr. 2011, 65 (Suppl. 1), S87–S91. [Google Scholar] [CrossRef]
- World Health Organization. Obesity: Preventing and Managing the Global Epidemic; Report of a WHO Consultation; WHO: Geneva, Switzerland, 2000. [Google Scholar]
- Australian Bureau of Statistics. Socio-Economic Indexes for Areas (SEIFA); No: 2033.0.55.001; ABS: Canberra, Australia, 2013. Available online: http://www.abs.gov.au (accessed on 6 March 2018).
- Masson, L.F.; McNeill, G.; Tomany, J.O.; Simpson, J.A.; Peace, H.S.; Wei, L.; Grubb, D.A.; Bolton-Smith, C. Statistical approaches for assessing the relative validity of a food-frequency questionnaire: Use of correlation coefficients and the kappa statistic. Public Health Nutr. 2003, 6, 313–321. [Google Scholar] [CrossRef] [PubMed]
- Nielsen Scantrack. The George Institute. Low Sugar Hitting a Sweet Spot in Australia; The Nielsen Company: New York, NY, USA, 2018. [Google Scholar]
- Singerman, D. The Shady History of Big Sugar. The New York Times. 16 September 2016. Available online: https://www.nytimes.com/2016/09/17/opinion/the-shady-history-of-big-sugar.html (accessed on 6 December 2018).
- Darmon, N.; Drewnowski, A. Does social class predict diet quality? Am. J. Clin. Nutr. 2008, 87, 1107–1117. [Google Scholar] [CrossRef] [PubMed]
- Australian Bureau of Statistics. Australian Health Survey: Nutrition First Results—Foods and Nutrients, 2011–2012; No: 4364.0.55.007; ABS: Canberra, Australia, 2015. Available online: http://www.abs.gov.au (accessed on 6 December 2018).
- North, K.; Emmett, P. Multivariate analysis of diet among three-year-old children and associations with socio-demographic characteristics. The Avon Longitudinal Study of Pregnancy and Childhood (ALSPAC) Study Team. Eur. J. Clin. Nutr. 2000, 54, 73–80. [Google Scholar] [CrossRef] [PubMed]
- Durao, C.; Severo, M.; Oliveira, A.; Moreira, P.; Guerra, A.; Barros, H.; Lopes, C. Association of maternal characteristics and behaviours with 4-year-old children’s dietary patterns. Matern. Child Nutr. 2017, 13. [Google Scholar] [CrossRef]
- Bell, L.K.; Golley, R.K.; Daniels, L.; Magarey, A.M. Dietary patterns of Australian children aged 14 and 24 months, and associations with socio-demographic factors and adiposity. Eur. J. Clin. Nutr. 2013, 67, 638–645. [Google Scholar] [CrossRef] [PubMed]
- Lioret, S.; Cameron, A.J.; McNaughton, S.A.; Crawford, D.; Spence, A.C.; Hesketh, K.; Campbell, K.J. Association between maternal education and diet of children at 9 months is partially explained by mothers’ diet. Matern. Child Nutr. 2015, 11, 936–947. [Google Scholar] [CrossRef]
- Backholer, K.; Spencer, E.; Gearon, E.; Magliano, D.J.; McNaughton, S.A.; Shaw, J.E.; Peeters, A. The association between socio-economic position and diet quality in Australian adults. Public Health Nutr. 2016, 19, 477–485. [Google Scholar] [CrossRef]
- Musher-Eizenman, D.R.; de Lauzon-Guillain, B.; Holub, S.C.; Leporc, E.; Charles, M.A. Child and parent characteristics related to parental feeding practices. A cross-cultural examination in the US and France. Appetite 2009, 52, 89–95. [Google Scholar] [CrossRef]
- Kiwanuka, S.N.; Åstrøm, A.N.; Trovik, T.A. Sugar snack consumption in Ugandan schoolchildren: Validity and reliability of a food frequency questionnaire. Community Dent. Oral Epidemiol. 2006, 34, 372–380. [Google Scholar] [CrossRef]
- Gulati, S.; Misra, A.; Colles, S.L.; Kondal, D.; Gupta, N.; Goel, K.; Bansal, S.; Mishra, M.; Madkaikar, V.; Bhardwaj, S. Dietary intakes and familial correlates of overweight/obesity: A four-cities study in India. Ann. Nutr. Metab. 2013, 62, 279–290. [Google Scholar] [CrossRef] [PubMed]
- Yothasamut, J.; Camfield, L.; Pfeil, M. Practices and values regarding milk consumption among pre-schoolers in Bangkok. Int. J. Qualitative Stud. Health Well-Being 2018, 13, 1461515. [Google Scholar] [CrossRef] [PubMed]
- Holmboe-Ottesen, G.; Wandel, M. Changes in dietary habits after migration and consequences for health: A focus on South Asians in Europe. Food Nutr. Res. 2012, 56. [Google Scholar] [CrossRef] [PubMed]
- Wang, M.C.; Naidoo, N.; Ferzacca, S.; Reddy, G.; Van Dam, R.M. The role of women in food provision and food choice decision-making in Singapore: A case study. Ecol. Food Nutr. 2014, 53, 658–677. [Google Scholar] [CrossRef]
- Satia, J.A. Dietary acculturation and the nutrition transition: An overview. Appl. Physiol. Nutr. Metab. 2010, 35, 219–223. [Google Scholar] [CrossRef] [PubMed]
- World Health Organization. Report of the Commission on Ending Childhood Obesity; WHO: Geneva, Switzerland, 2016. [Google Scholar]
- IBISWorld Australia. IBISWorld Industry Report OD5058 Baby Food Manufacturing in Australia; IBISWorld Australia: Melbourne, Australia, 2017. [Google Scholar]
- Rayner, M.; Wood, A.; Lawrence, M.; Mhurchu, C.N.; Albert, J.; Barquera, S.; Friel, S.; Hawkes, C.; Kelly, B.; Kumanyika, S.; et al. Monitoring the health-related labelling of foods and non-alcoholic beverages in retail settings. Obes. Rev. 2013, 14, 70–81. [Google Scholar] [CrossRef] [PubMed]
- Pulker, C.E.; Trapp, G.S.A.; Scott, J.A.; Pollard, C.M. Alignment of Supermarket Own Brand Foods’ Front-of-Pack Nutrition Labelling with Measures of Nutritional Quality: An Australian Perspective. Nutrients 2018, 10, 1465. [Google Scholar] [CrossRef] [PubMed]
- Australian Government. Australia New Zealand Food Standards Code—Standard 2.9.2—Food for Infants; No: F2017C00334; FSANZ: Canberra, Australia, 2017. Available online: https://www.legislation.gov.au/Details/F2017C00334 (accessed on 13 March 2018).
- Ha, D.H.; Do, L.G.; Spencer, A.J.; Thomson, W.M.; Golley, R.K.; Rugg-Gunn, A.J.; Levy, S.M.; Scott, J.A. Factors Influencing Early Feeding of Foods and Drinks Containing Free Sugars—A Birth Cohort Study. Int. J. Environ. Res. Public Health 2017, 14, 1270. [Google Scholar] [CrossRef]
- National Institutes of Health; National Cancer Institute. Dietary Assessment Primer. Available online: http://dietassessmentprimer.cancer.gov (accessed on 13 March 2018).
- Willett, W. Nutritional Epidemiology, 3rd ed.; Oxford University Press: Oxford, UK, 2013. [Google Scholar]
- Ortiz-Andrellucchi, A.; Henríquez-Sánchez, P.; Sánchez-Villegas, A.; Peña-Quintana, L.; Mendez, M.; Serra-Majem, L. Dietary assessment methods for micronutrient intake in infants, children and adolescents: A systematic review. Br. J. Nutr. 2010, 102, S87–S117. [Google Scholar] [CrossRef]
- Livingstone, M.B.; Robson, P.J.; Wallace, J.M. Issues in dietary intake assessment of children and adolescents. Br. J. Nutr. 2004, 92 (Suppl. 2), S213–S222. [Google Scholar] [CrossRef]
- Radnitz, C.; Todd, L.E. Social desirability may explain why some caregivers of overweight children report less frequent high calorie food intake. Eat. Behav. 2016, 23, 48–51. [Google Scholar] [CrossRef] [PubMed]


| All Participants (n = 2181) | Responders 2 Years (n = 1043) | Non-Responders 2 Years (n = 1138) | p a | |||||||
|---|---|---|---|---|---|---|---|---|---|---|
| n | mean | SD | n | mean | SD | n | mean | SD | ||
| Mother’s age at birth (years) | 2101 | 29.9 | 5.4 | 1040 | 30.6 | 5.0 | 1061 | 29.2 | 5.7 | <0.001 |
| Total number of children | 1867 | 1.8 | 1.0 | 1013 | 1.8 | 0.9 | 854 | 1.9 | 1.0 | 0.012 |
| Child’s birthweight (g) | 2083 | 3356 | 572 | 1032 | 3393 | 547 | 1051 | 3319 | 593 | 0.003 |
| n | % | n | % | n | % | |||||
| Mother’s age at birth (years) | <0.001 | |||||||||
| <25 | 336 | 16.0 | 105 | 10.1 | 231 | 21.8 | ||||
| 25–34.99 | 1353 | 64.4 | 717 | 68.9 | 636 | 59.9 | ||||
| ≥35 | 412 | 19.6 | 218 | 21.0 | 194 | 18.3 | ||||
| Mother’s pre-pregnancy BMI (kg/m2) | 0.274 | |||||||||
| <25 | 1086 | 56.2 | 565 | 57.9 | 521 | 54.4 | ||||
| 25–29.99 (overweight) | 455 | 23.5 | 218 | 22.4 | 237 | 24.7 | ||||
| ≥30 (obese) | 392 | 20.3 | 192 | 19.7 | 200 | 20.9 | ||||
| Mother’s Country of Birth | <0.001 | |||||||||
| Australia or New Zealand | 1453 | 69.3 | 755 | 72.9 | 698 | 65.7 | ||||
| Other | 644 | 30.7 | 280 | 27.1 | 364 | 34.3 | ||||
| Mother’s Education | <0.001 | |||||||||
| high school/vocational | 1136 | 54.0 | 451 | 43.5 | 685 | 64.2 | ||||
| some university and above | 968 | 46.0 | 586 | 56.5 | 382 | 35.8 | ||||
| IRSAD | <0.001 | |||||||||
| Deciles 1–2 (most disadvantaged) | 462 | 22.2 | 172 | 16.6 | 290 | 27.8 | ||||
| Deciles 3–4 | 446 | 21.4 | 214 | 20.7 | 232 | 22.2 | ||||
| Deciles 5–6 | 390 | 18.7 | 210 | 20.3 | 180 | 17.2 | ||||
| Deciles 7–8 | 385 | 18.5 | 199 | 19.2 | 186 | 17.8 | ||||
| Deciles 9–10 (most advantaged) | 398 | 19.1 | 241 | 23.3 | 157 | 15.0 | ||||
| Total number of children | 0.111 | |||||||||
| 1 | 863 | 46.2 | 480 | 47.4 | 383 | 44.8 | ||||
| 2 | 670 | 35.9 | 369 | 36.4 | 301 | 35.2 | ||||
| ≥3 | 334 | 17.9 | 164 | 16.2 | 170 | 19.9 | ||||
| Child’s sex | 0.579 | |||||||||
| Male | 1146 | 52.7 | 556 | 53.3 | 590 | 52.1 | ||||
| Female | 1029 | 47.3 | 487 | 46.7 | 542 | 47.9 | ||||
| Median | Percentile | Range | ||
|---|---|---|---|---|
| 25th | 75th | |||
| Free Sugars (g/day) | 22.5 | 12.8 | 37.7 | 0.3–140.7 |
| Tertile 1 (low) | 10.6 | 7.4 | 13.0 | 0.3–15.8 |
| Tertile 2 (mid) | 22.7 | 19.0 | 26.4 | 15.81–31.6 |
| Tertile 3 (high) | 47.2 | 38.0 | 66.7 | 31.61–140.7 |
| Total Sugars (g/day) | 77.5 | 56.0 | 105.3 | 9.4–294.8 |
| Estimated Energy Requirement (kJ/day) | 4730 | 4357 | 5214 | 2644–8193 |
| Percentage of Estimated Energy Requirement from Free Sugars (%) | 8.0 | 4.6 | 13.2 | 0.1–61.3 |
| All Participants (n = 1043) | Consumers | ||||||||
|---|---|---|---|---|---|---|---|---|---|
| Food group a | mean ± SD free sugars (g) | % contribution to free sugars | n (%) | mean ± SD free sugars (g) | |||||
| Non-alcoholic beverages | 4.7 | ± | 9.7 | 15.9 | 1037 | (99.4) | 4.7 | ± | 9.7 |
| Fruit and vegetable juices, and drinks | 3.1 | ± | 7.3 | 10.7 | 590 | (56.6) | 5.5 | ± | 9.0 |
| Cordials | 0.8 | ± | 3.8 | 2.6 | 179 | (17.2) | 4.5 | ± | 8.4 |
| Soft drinks, flavored mineral waters | 0.2 | ± | 1.3 | 0.8 | 147 | (14.1) | 1.7 | ± | 3.1 |
| Other beverage flavorings | 0.3 | ± | 1.7 | 0.9 | 246 | (23.6) | 1.2 | ± | 3.5 |
| Cereals and cereal products | 1.1 | ± | 2.1 | 3.7 | 953 | (91.4) | 1.2 | ± | 2.1 |
| Breakfast cereals, ready to eat | 1.1 | ± | 2.1 | 3.7 | 884 | (84.8) | 1.3 | ± | 2.2 |
| Cereal based products and dishes | 5.5 | ± | 6.9 | 18.8 | 1028 | (98.6) | 5.6 | ± | 6.9 |
| Sweet biscuits | 2.2 | ± | 3.5 | 7.4 | 908 | (87.1) | 2.5 | ± | 3.6 |
| Savory biscuits | 0.3 | ± | 0.5 | 0.9 | 947 | (90.8) | 0.3 | ± | 0.5 |
| Cakes, muffins, doughnuts, cake-type desserts b | 2.2 | ± | 4.2 | 7.5 | 674 | (64.6) | 3.4 | ± | 4.8 |
| Batter-based products, scones, sweet breads b | 0.8 | ± | 1.6 | 2.6 | 468 | (44.9) | 1.7 | ± | 2.0 |
| Fruit products and dishes c | 0.3 | ± | 1.2 | 1.2 | 1029 | (98.7) | 0.3 | ± | 1.2 |
| Milk products and dishes | 4.8 | ± | 7.1 | 16.4 | 1015 | (97.3) | 4.9 | ± | 7.2 |
| Yogurt | 2.6 | ± | 5.2 | 8.8 | 787 | (75.5) | 3.4 | ± | 5.8 |
| Frozen milk products | 0.9 | ± | 1.9 | 3.1 | 605 | (58.0) | 1.5 | ± | 2.2 |
| Custards | 0.9 | ± | 3.3 | 2.9 | 325 | (31.2) | 2.8 | ± | 5.5 |
| Flavored milks and milkshakes | 0.4 | ± | 1.5 | 1.2 | 211 | (20.2) | 1.8 | ± | 3.0 |
| Dairy and meat substitutes | 1.7 | ± | 4.9 | 5.8 | 438 | (42.0) | 4.0 | ± | 6.9 |
| Dairy milk substitutes, unflavored | 1.2 | ± | 3.8 | 4.2 | 245 | (23.5) | 5.2 | ± | 6.5 |
| Savory sauces and condiments | 0.5 | ± | 1.0 | 1.8 | 792 | (75.9) | 0.7 | ± | 1.2 |
| Gravies and savory sauces | 0.5 | ± | 0.9 | 1.6 | 758 | (72.7) | 0.6 | ± | 1.0 |
| Sugar products and dishes | 3.4 | ± | 5.7 | 11.7 | 846 | (81.1) | 4.2 | ± | 6.0 |
| Sugar, honey and syrups | 1.5 | ± | 3.5 | 5.1 | 609 | (58.4) | 2.6 | ± | 4.3 |
| Jam and lemon spreads, chocolate spreads, sauces | 1.0 | ± | 2.7 | 3.3 | 541 | (51.9) | 1.8 | ± | 3.5 |
| Dishes and products other than confectionery where sugar is the major component | 1.0 | ± | 2.8 | 3.3 | 450 | (43.1) | 2.2 | ± | 3.9 |
| Confectionery and cereal, nut, fruit, seed bars | 2.8 | ± | 3.9 | 9.4 | 871 | (83.5) | 3.3 | ± | 4.0 |
| Chocolate and chocolate-based confectionery | 1.3 | ± | 2.5 | 4.6 | 719 | (68.9) | 1.9 | ± | 2.8 |
| Muesli or cereal style bars | 0.7 | ± | 1.6 | 2.4 | 404 | (38.7) | 1.8 | ± | 2.2 |
| Other confectionery | 0.7 | ± | 1.7 | 2.5 | 439 | (42.1) | 1.7 | ± | 2.4 |
| Infant formula and foods | 4.3 | ± | 5.9 | 14.9 | 770 | (73.8) | 5.9 | ± | 6.2 |
| Infant and Toddler formula | 1.1 | ± | 3.3 | 3.8 | 150 | (14.4) | 7.7 | ± | 5.1 |
| Infant foods | 2.8 | ± | 4.4 | 9.7 | 658 | (63.1) | 4.5 | ± | 4.8 |
| Infant custards or yogurts | 2.8 | ± | 4.4 | 9.7 | 658 | (63.1) | 4.5 | ± | 4.8 |
| Infant drinks d | 0.4 | ± | 1.7 | 1.3 | 155 | (14.9) | 2.7 | ± | 3.8 |
| Infant fruit juices | 0.4 | ± | 1.7 | 1.3 | 155 | (14.9) | 2.7 | ± | 3.8 |
| Free Sugars at 2 Years | ||||
|---|---|---|---|---|
| Low | Mid | High | ||
| Free Sugars at 1 Year | Low | 118 (17.3%) | 72 (10.6%) | 37 (5.4%) |
| Mid | 82 (12.0%) | 76 (11.1%) | 70 (10.3%) | |
| High | 49 (7.2%) | 67 (9.8%) | 111 (16.3%) | |
| Free Sugars Highest Tertile | Free Sugars Intake ≥ 10%EER | |||
|---|---|---|---|---|
| PR | 95% CI | PR | 95% CI | |
| Mother’s age at birth (years) | ||||
| <25 | 1.50 | 1.07–2.12 | 1.42 | 1.05–1.91 |
| 25–34.99 | 1.06 | 0.84–1.34 | 1.05 | 0.85–1.29 |
| ≥35 | 1.00 | 1.00 | ||
| Mother’s pre-pregnancy BMI | ||||
| <25 Healthy weight or below | 1.00 | 1.00 | ||
| 25–29.99 Overweight | 1.06 | 0.85–1.32 | 1.03 | 0.85–1.24 |
| ≥30 Obese | 0.95 | 0.74–1.23 | 0.92 | 0.73–1.17 |
| Mother’s Country of Birth | ||||
| Other | 1.58 | 1.28–1.94 | 1.59 | 1.33–1.90 |
| Australia, New Zealand | 1.00 | 1.00 | ||
| Mother’s Education | ||||
| University | 0.83 | 0.68–1.01 | 0.82 | 0.69–0.98 |
| High school/vocational | 1.00 | 1.00 | ||
| IRSAD | ||||
| Deciles 1–2 (most disadvantaged) | 1.58 | 1.19–2.10 | 1.44 | 1.13–1.84 |
| Deciles 3–4 | 1.40 | 1.06–1.85 | 1.34 | 1.06–1.70 |
| Deciles 5–6 | 1.03 | 0.76–1.40 | 0.98 | 0.75–1.29 |
| Deciles 7–8 | 1.00 | 0.73–1.38 | 0.95 | 0.72–1.25 |
| Deciles 9–10 (most advantaged) | 1.00 | 1.00 | ||
| Total number of children | ||||
| 1 | 1.00 | 1.00 | ||
| 2 | 1.28 | 1.04–1.57 | 1.22 | 1.02–1.47 |
| ≥3 | 1.52 | 1.17–1.97 | 1.39 | 1.11–1.76 |
| Child’s sex | ||||
| Female | 0.93 | 0.77–1.11 | 0.98 | 0.83–1.15 |
| Male | 1.00 | 1.00 | ||
© 2019 by the authors. Licensee MDPI, Basel, Switzerland. This article is an open access article distributed under the terms and conditions of the Creative Commons Attribution (CC BY) license (http://creativecommons.org/licenses/by/4.0/).
Share and Cite
Devenish, G.; Golley, R.; Mukhtar, A.; Begley, A.; Ha, D.; Do, L.; Scott, J.A. Free Sugars Intake, Sources and Determinants of High Consumption among Australian 2-Year-Olds in the SMILE Cohort. Nutrients 2019, 11, 161. https://doi.org/10.3390/nu11010161
Devenish G, Golley R, Mukhtar A, Begley A, Ha D, Do L, Scott JA. Free Sugars Intake, Sources and Determinants of High Consumption among Australian 2-Year-Olds in the SMILE Cohort. Nutrients. 2019; 11(1):161. https://doi.org/10.3390/nu11010161
Chicago/Turabian StyleDevenish, Gemma, Rebecca Golley, Aqif Mukhtar, Andrea Begley, Diep Ha, Loc Do, and Jane A. Scott. 2019. "Free Sugars Intake, Sources and Determinants of High Consumption among Australian 2-Year-Olds in the SMILE Cohort" Nutrients 11, no. 1: 161. https://doi.org/10.3390/nu11010161
APA StyleDevenish, G., Golley, R., Mukhtar, A., Begley, A., Ha, D., Do, L., & Scott, J. A. (2019). Free Sugars Intake, Sources and Determinants of High Consumption among Australian 2-Year-Olds in the SMILE Cohort. Nutrients, 11(1), 161. https://doi.org/10.3390/nu11010161