Comparing Interviewer-Administered and Web-Based Food Frequency Questionnaires to Predict Energy Requirements in Adults

 , and
, and
Abstract
:1. Introduction
2. Materials and Methods
2.1. Study Design and Population
2.2. Anthropometric Assessment
2.3. Reported Energy Intake (rEI)
2.4. Measured Energy Requirement (mER)
2.5. Statistical Analyses
3. Results
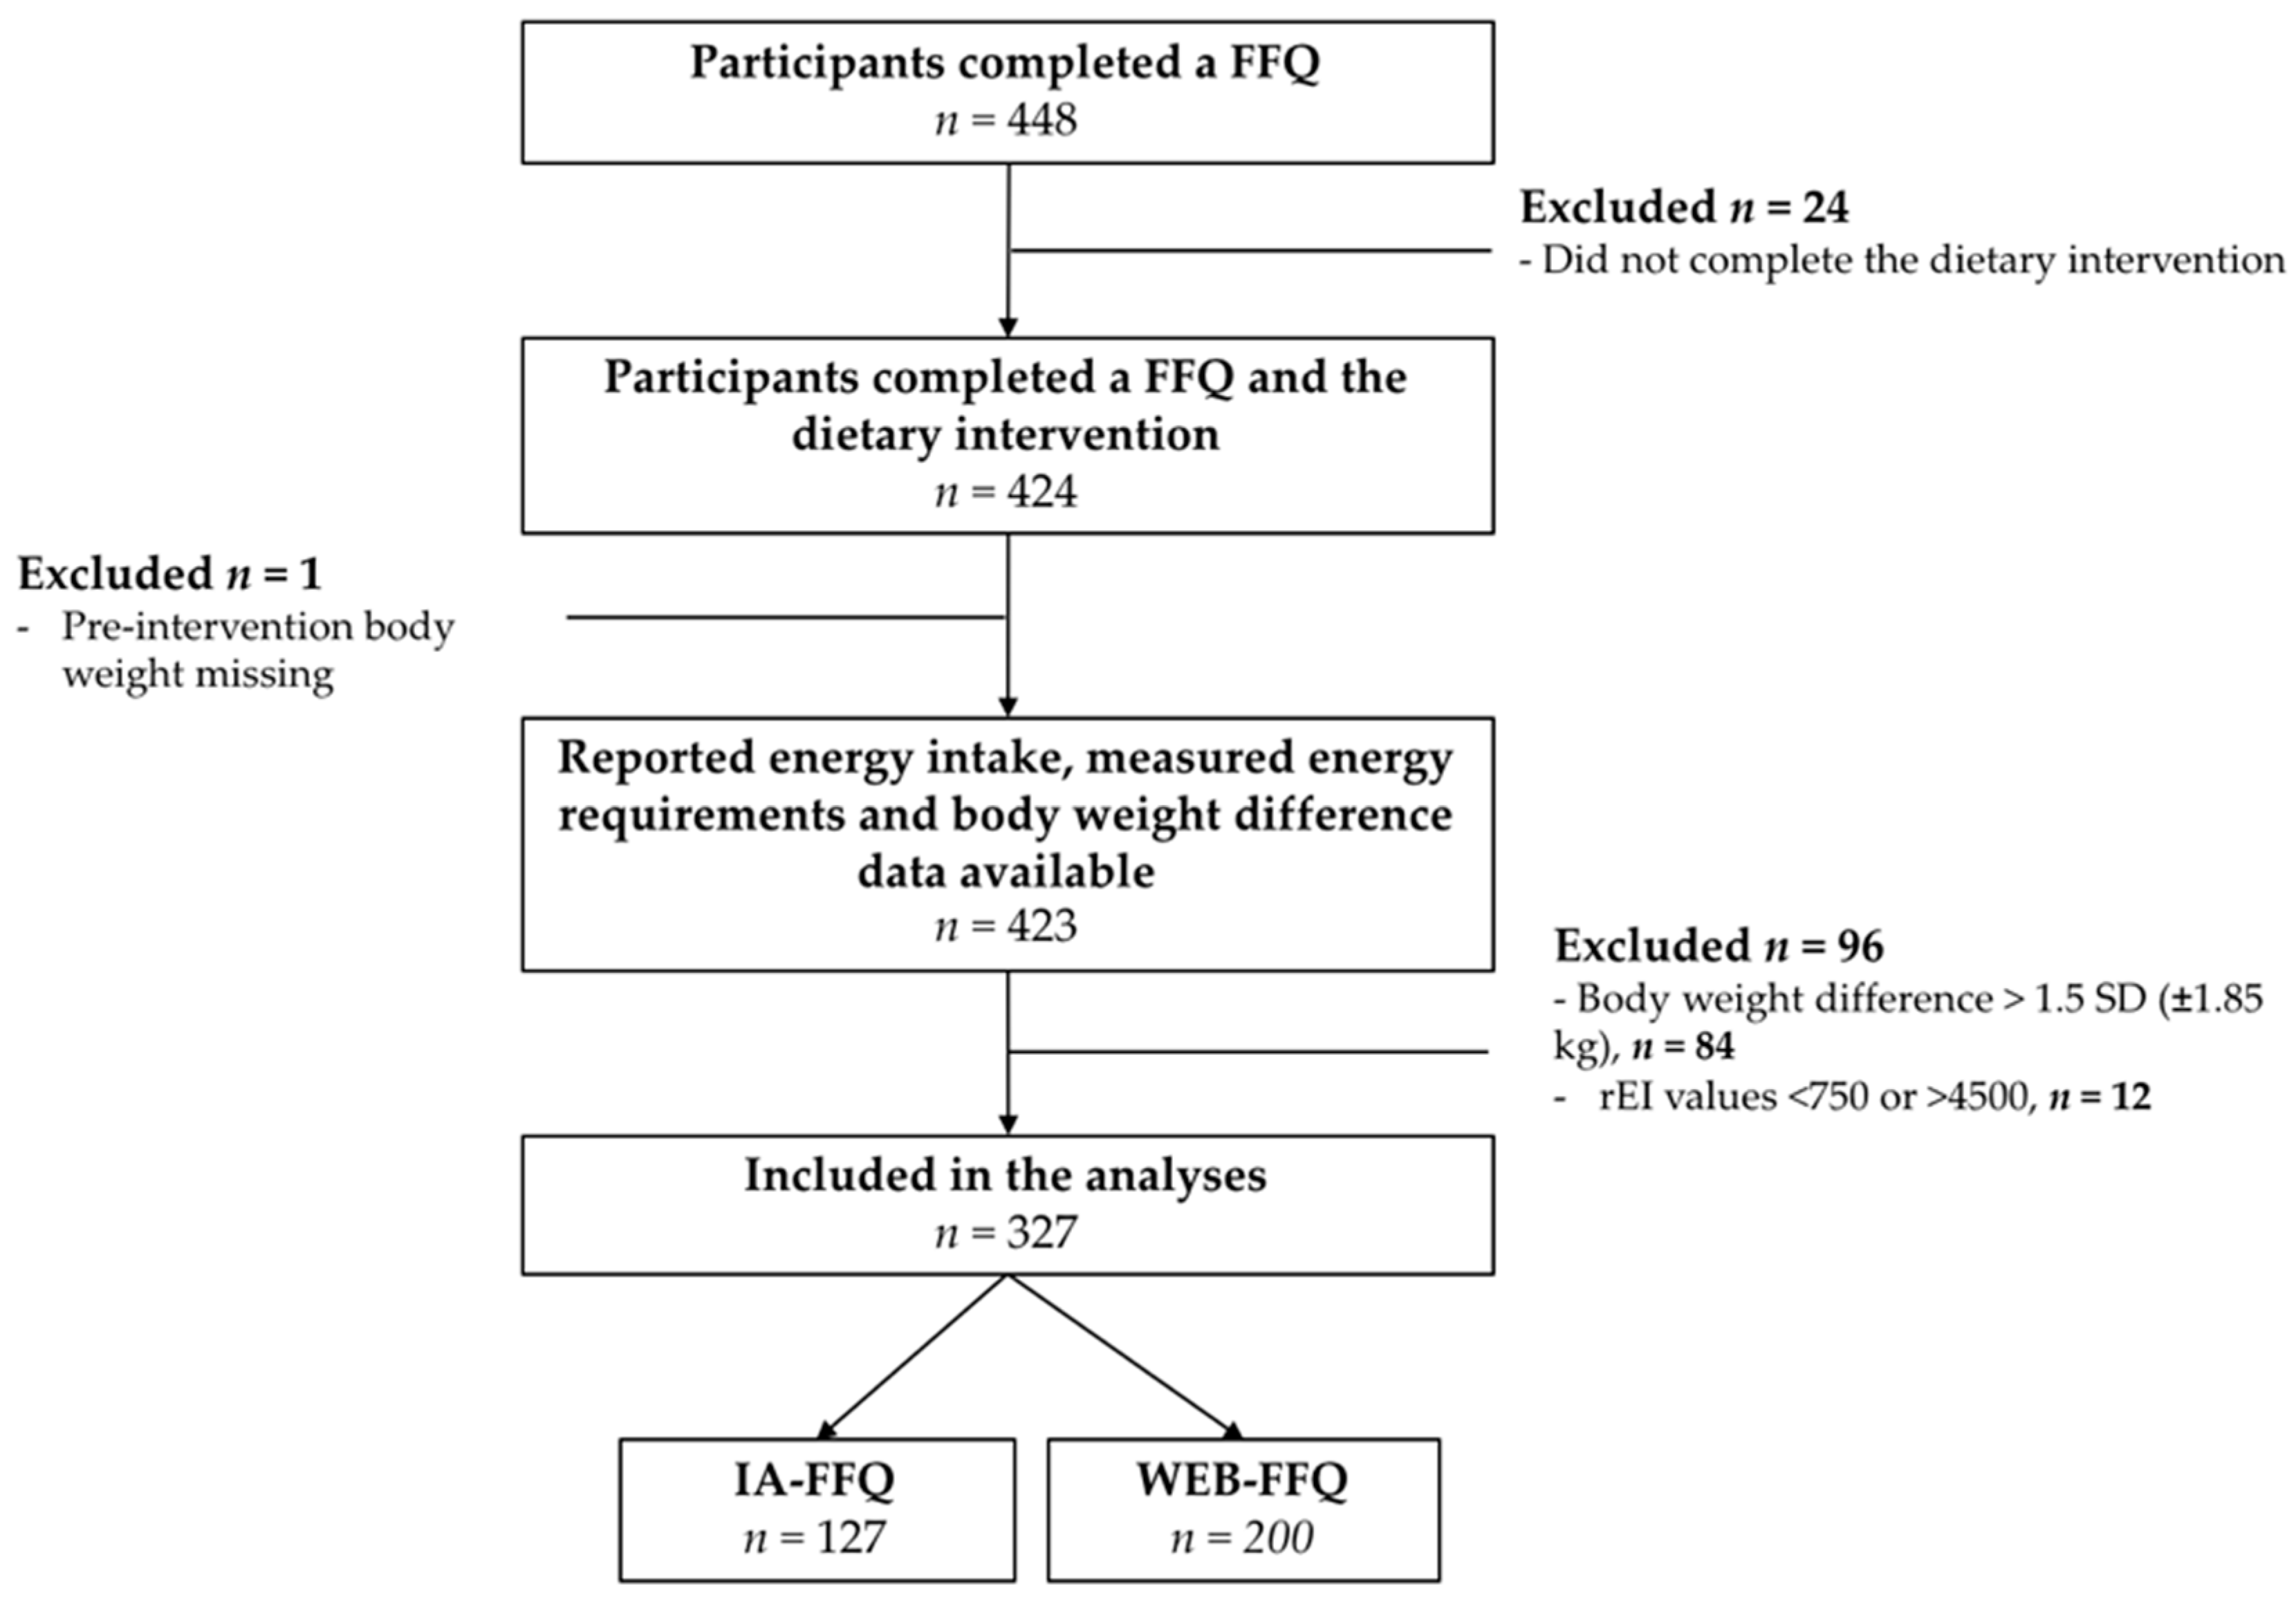
3.1. Participants
3.2. Reported Energy Intake Compared with Measured Energy Requirements
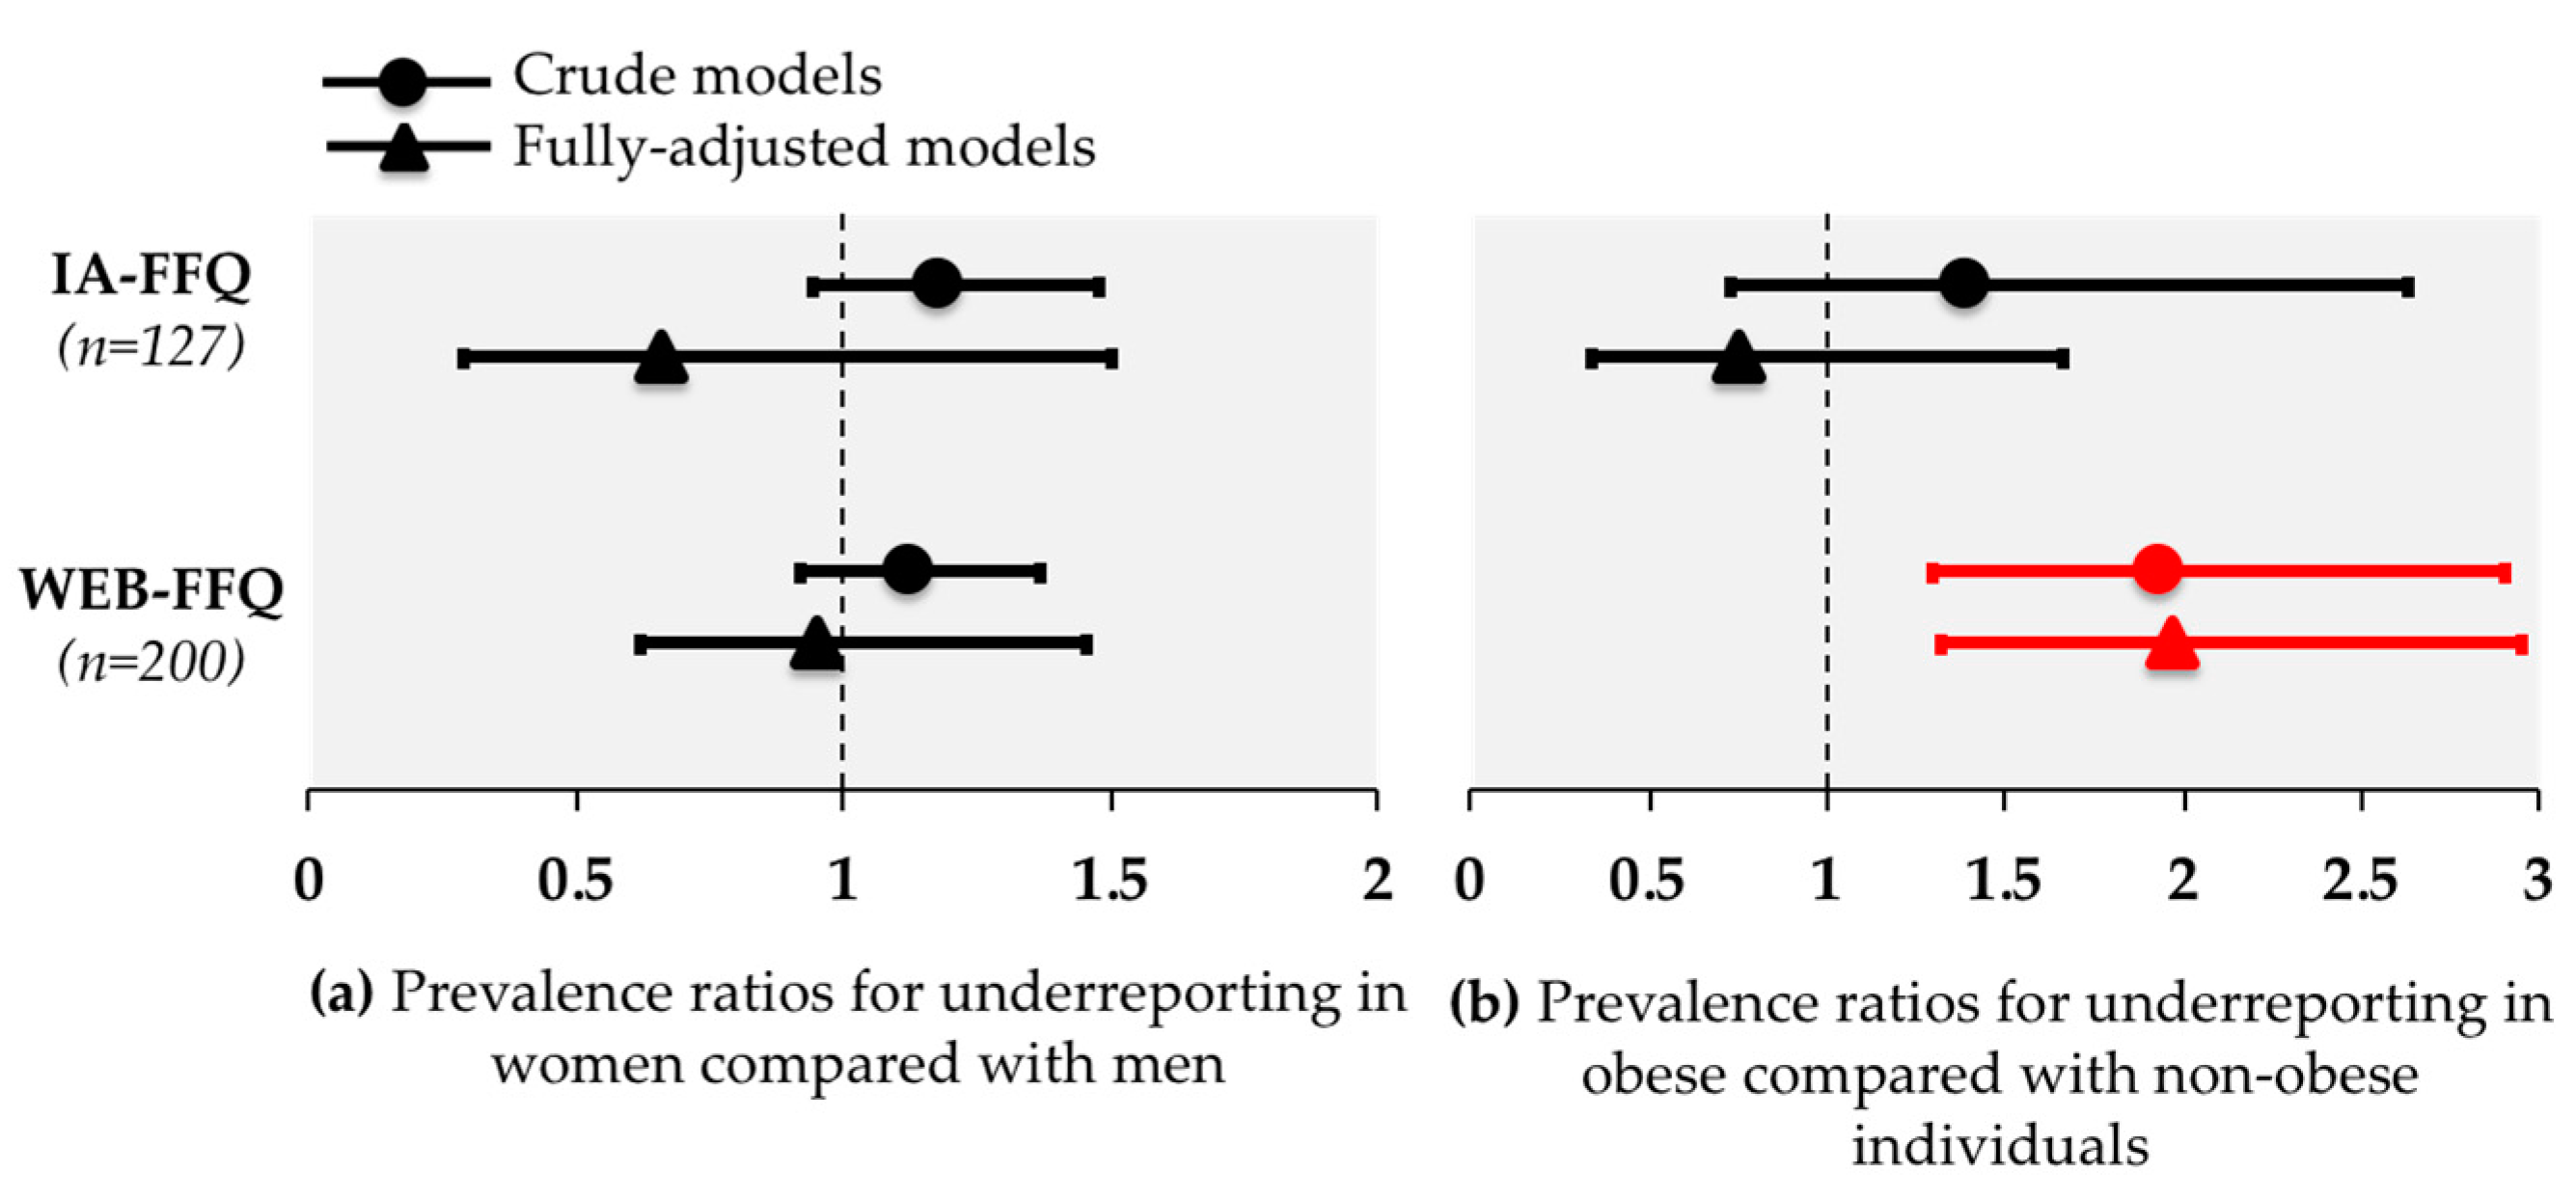
3.3. Under-Reporting and Over-Reporting
4. Discussion
5. Conclusions
Supplementary Materials
Author Contributions
Funding
Acknowledgments
Conflicts of Interest
References
- Hébert, J.R.; Hurley, T.G.; Steck, S.E.; Miller, D.R.; Tabung, F.K.; Peterson, K.E.; Kushi, L.H.; Frongillo, E.A. Considering the value of dietary assessment data in informing nutrition-related health policy. Adv. Nutr. 2014, 5, 447–455. [Google Scholar] [CrossRef] [PubMed]
- Labonté, M.; Kirkpatrick, S.I.; Bell, R.C.; Boucher, B.A.; Csizmadi, I.; Koushik, A.; L’Abbé, M.R.; Massarelli, I.; Robson, P.J.; Rondeau, I.; et al. Dietary assessment is a critical element of health research-Perspective from the Partnership for Advancing Nutritional and Dietary Assessment in Canada. Appl. Physiol. Nutr. Metab. 2016, 1–4. [Google Scholar] [CrossRef] [PubMed]
- Thompson, F.E.; Kirkpatrick, S.I.; Subar, A.F.; Reedy, J.; Schap, T.E.; Wilson, M.M.; Krebs-Smith, S.M. The National Cancer Institute’s Dietary Assessment Primer: A Resource for Diet Research. J. Acad. Nutr. Diet. 2015, 115, 1986–1995. [Google Scholar] [CrossRef] [PubMed] [Green Version]
- Archer, E.; Marlow, M.L.; Lavie, C.J. Controversy and debate: Memory based methods paper 1: The fatal flaws of food frequency questionnaires and other memory-based dietary assessment methods. J. Clin. Epidemiol. 2018. [Google Scholar] [CrossRef] [PubMed]
- Archer, E.; Marlow, M.L.; Lavie, C.J. Controversy and debate: Memory-based dietary assessment methods paper #3. J. Clin. Epidemiol. 2018. [Google Scholar] [CrossRef]
- Archer, E.; Hand, G.A.; Blair, S.N. Validity of U.S. nutritional surveillance: National health and nutrition examination survey caloric energy intake data, 1971–2010. PLoS One 2013, 8. [Google Scholar] [CrossRef] [PubMed]
- Subar, A.F.; Freedman, L.S.; Tooze, J.A.; Kirkpatrick, S.I.; Boushey, C.; Neuhouser, M.L.; Thompson, F.E.; Potischman, N.; Guenther, P.M.; Tarasuk, V.; et al. Addressing current criticism regarding the value of self-report dietary data. J. Nutr. 2015, 145, 2639–2645. [Google Scholar] [CrossRef] [PubMed]
- Willett, W.C.; Rimm, E.B.; Hu, F.B. Reply to E Archer. Am. J. Clin. Nutr. 2017, 106, 950–951. [Google Scholar] [PubMed]
- Martín-Calvo, N.; Martínez-González, M. Controversy and Debate: Memory based methods paper 2. J. Clin. Epidemiol. 2018. [Google Scholar] [CrossRef]
- Martín-Calvo, N.; Martínez-González, M. Controversy and Debate: Memory based methods paper 4: Please, no more idle talk on memory-based methods in science. J. Clin. Epidemiol. 2018. [Google Scholar] [CrossRef] [PubMed]
- Freedman, L.S.; Commins, J.M.; Moler, J.E.; Arab, L.; Baer, D.J.; Kipnis, V.; Midthune, D.; Moshfegh, A.J.; Neuhouser, M.L.; Prentice, R.L.; et al. Pooled results from 5 validation studies of dietary self-report instruments using recovery biomarkers for energy and protein intake. Am. J. Epidemiol. 2014, 180, 172–188. [Google Scholar] [CrossRef] [PubMed]
- Livingstone, M.B.; Black, A.E. Markers of the validity of reported energy intake. J. Nutr. 2003, 133 (Suppl. 3), 895S–920S. [Google Scholar] [CrossRef]
- Subar, A.F.; Kipnis, V.; Troiano, R.P.; Midthune, D.; Schoeller, D.A.; Bingham, S.; Sharbaugh, C.O.; Trabulsi, J.; Runswick, S.; Ballard-Barbash, R.; et al. Using intake biomarkers to evaluate the extent of dietary misreporting in a large sample of adults: the OPEN study. Am. J. Epidemiol. 2003, 158, 1–13. [Google Scholar] [CrossRef] [PubMed]
- Freedman, L.S.; Commins, J.M.; Moler, J.E.; Willett, W.; Tinker, L.F.; Subar, A.F.; Spiegelman, D.; Rhodes, D.; Potischman, N.; Neuhouser, M.L.; et al. Pooled results from 5 validation studies of dietary self-report instruments using recovery biomarkers for potassium and sodium intake. Am. J. Epidemiol. 2015, 181, 473–487. [Google Scholar] [CrossRef] [PubMed]
- Labonté, M.; Cyr, A.; Baril-Gravel, L.; Royer, M.M.; Lamarche, B. Validity and reproducibility of a web-based, self-administered food frequency questionnaire. Eur J. Clin. Nutr. 2012, 66, 166–173. [Google Scholar] [CrossRef] [PubMed]
- Illner, A.K.; Freisling, H.; Boeing, H.; Huybrechts, I.; Crispim, S.P.; Slimani, N. Review and evaluation of innovative technologies for measuring diet in nutritional epidemiology. Int. J. Epidemiol. 2012, 41, 1187–1203. [Google Scholar] [CrossRef] [PubMed]
- Stumbo, P.J. New technology in dietary assessment: A review of digital methods in improving food record accuracy. Proc. Nutr. Soc. 2013, 72, 70–76. [Google Scholar] [CrossRef] [PubMed]
- Touvier, M.; Kesse-Guyot, E.; Méjean, C.; Pollet, C.; Malon, A.; Castetbon, K.; Hercberg, S. Comparison between an interactive web-based self-administered 24 h dietary record and an interview by a dietitian for large-scale epidemiological studies. Br. J. Nutr. 2011, 105, 1055–1064. [Google Scholar] [CrossRef] [PubMed]
- Probst, Y.C.; Faraji, S.; Batterham, M.; Steel, D.G.; Tapsell, L.C. Computerized dietary assessments compare well with interviewer administered diet histories for patients with type 2 diabetes mellitus in the primary healthcare setting. Patient Educ. Couns. 2008, 72, 49–55. [Google Scholar] [CrossRef] [PubMed] [Green Version]
- Kesse-Guyot, E.; Assmann, K.; Andreeva, V.; Castetbon, K.; Méjean, C.; Touvier, M.; Salanave, B.; Deschamps, V.; Péneau, S.; Fezeu, L.; et al. Lessons Learned From Methodological Validation Research in E-Epidemiology. JMIR Public Health Surveill. 2016, 2. [Google Scholar] [CrossRef] [PubMed]
- Kirkpatrick, S.I.; Potischman, N.; Dodd, K.W.; Douglass, D.; Zimmerman, T.P.; Kahle, L.L.; Thompson, F.E.; George, S.M.; Subar, A.F. The use of digital images in 24-hour recalls may lead to less misestimation of portion size compared with traditional interviewer-administered recalls. J. Nutr. 2016, 146, 2567–2573. [Google Scholar] [CrossRef] [PubMed]
- Kirkpatrick, S.I.; Vanderlee, L.; Raffoul, A.; Stapleton, J.; Csizmadi, I.; Boucher, B.A.; Massarelli, I.; Rondeau, I.; Robson, P.J. Self-report dietary assessment tools used in canadian research: A scoping review. Adv. Nutr. 2017, 8, 276–289. [Google Scholar] [CrossRef] [PubMed]
- Motard-Bélanger, A.; Charest, A.; Grenier, G.; Paquin, P.; Chouinard, Y.; Lemieux, S.; Couture, P.; Lamarche, B. Study of the effect of trans fatty acids from ruminants on blood lipids and other risk factors for cardiovascular disease. Am. J. Clin. Nutr. 2008, 87, 593–599. [Google Scholar] [CrossRef] [PubMed]
- Richard, C.; Couture, P.; Desroches, S.; Charest, A.; Lamarche, B. Effect of the mediterranean diet with and without weight loss on cardiovascular risk factors in men with the metabolic syndrome. Nutr. Metab. Cardiovasc. Dis. 2011, 21, 628–635. [Google Scholar] [CrossRef] [PubMed]
- Lacroix, E.; Charest, A.; Cyr, A.; Baril-Gravel, L.; Lebeuf, Y.; Paquin, P.; Chouinard, P.Y.; Couture, P.; Lamarche, B. Randomized controlled study of the effect of a butter naturally enriched in trans fatty acids on blood lipids in healthy women. Am. J. Clin. Nutr. 2012, 95, 318–325. [Google Scholar] [CrossRef] [PubMed]
- Senanayake, V.K.; Pu, S.; Jenkins, D.A.; Lamarche, B.; Kris-Etherton, P.M.; West, S.G.; Fleming, J.A.; Liu, X.; McCrea, C.E.; Jones, P.J. Plasma fatty acid changes following consumption of dietary oils containing n-3, n-6, and n-9 fatty acids at different proportions: preliminary findings of the Canola Oil Multicenter Intervention Trial (COMIT). Trials 2014, 15. [Google Scholar] [CrossRef] [PubMed]
- Drouin-Chartier, J.P.; Gagnon, J.; Labonté, M.; Desroches, S.; Charest, A.; Grenier, G.; Dodin, S.; Lemieux, S.; Couture, P.; Lamarche, B. Impact of milk consumption on cardiometabolic risk in postmenopausal women with abdominal obesity. Nutr. J. 2015, 14. [Google Scholar] [CrossRef] [PubMed]
- Brassard, D.; Tessier-Grenier, M.; Allaire, J.; Rajendiran, E.; She, Y.; Ramprasath, V.; Gigleux, I.; Talbot, D.; Levy, E.; Tremblay, A.; et al. Comparison of the impact of SFAs from cheese and butter on cardiometabolic risk factors: A randomized controlled trial. Am. J. Clin. Nutr. 2017, 105, 800–809. [Google Scholar] [CrossRef] [PubMed]
- Lohman, T.; Roche, A.; Martorell, R. The Airlie (VA) Consensus Conference. Anthropometric Standardization Reference Manual; Human Kinetics: Champaign, IL, USA, 1988; pp. 39–80. [Google Scholar]
- Goulet, J.; Nadeau, G.; Lapointe, A.; Lamarche, B.; Lemieux, S. Validity and reproducibility of an interviewer-administered food frequency questionnaire for healthy French-Canadian men and women. Nutr. J. 2004, 3. [Google Scholar] [CrossRef] [PubMed] [Green Version]
- Le Moullec, N.; Deheeger, M.; Preziosi, P.; Monteiro, P.; Valeix, P.; Rolland-Cachera, M.-F.; Potier De Courcy, G.; Christides, J.-P.; Chevrouvrier, F.; Galan, P.; et al. Validation of photographic document used to estimate the amounts of foods eaten by subjects in the SU.VI.MAX study. Cah. Nutr. Diet. 1996, 31, 158–164. [Google Scholar]
- Roza, A.M.; Shizgal, H.M. The Harris Benedict equation reevaluated: Resting energy requirements and the body cell mass. Am. J. Clin. Nutr. 1984, 40, 168–182. [Google Scholar] [CrossRef] [PubMed]
- Lafrenière, J.; Lamarche, B.; Laramée, C.; Robitaille, J.; Lemieux, S. Validation of a newly automated web-based 24-hour dietary recall using fully controlled feeding studies. BMC Nutr. 2017, 3. [Google Scholar] [CrossRef]
- Mensink, R.P.; Zock, P.L.; Kester, A.D.; Katan, M.B. Effects of dietary fatty acids and carbohydrates on the ratio of serum total to HDL cholesterol and on serum lipids and apolipoproteins: A meta-analysis of 60 controlled trials. Am. J. Clin. Nutr. 2003, 77, 1146–1155. [Google Scholar] [CrossRef] [PubMed]
- Siri-Tarino, P.W.; Chiu, S.; Bergeron, N.; Krauss, R.M. Saturated fats versus polyunsaturated fats versus carbohydrates for cardiovascular disease prevention and treatment. Annu. Rev. Nutr. 2015, 35, 517–543. [Google Scholar] [CrossRef] [PubMed]
- Shen, J.; Wilmot, K.A.; Ghasemzadeh, N.; Molloy, D.L.; Burkman, G.; Mekonnen, G.; Gongora, M.C.; Quyyumi, A.A.; Sperling, L.S. Mediterranean Dietary Patterns and Cardiovascular Health. Annu. Rev. Nutr. 2015, 35, 425–449. [Google Scholar] [CrossRef] [PubMed]
- Bhutani, S.; Kahn, E.; Tasali, E.; Schoeller, D.A. Composition of two-week change in body weight under unrestricted free-living conditions. Physiol. Rep. 2017, 5. [Google Scholar] [CrossRef] [PubMed]
- Hoaglin, D.C.; Iglewicz, B. Fine-tuning some resistant rules for outlier labeling. J. Am. Stat. Assoc. 1987, 82, 1147–1149. [Google Scholar] [CrossRef]
- Black, A.E.; Cole, T.J. Within- and between-subject variation in energy expenditure measured by the doubly-labelled water technique: implications for validating reported dietary energy intake. Eur. J. Clin. Nutr. 2000, 54, 386–394. [Google Scholar] [CrossRef] [PubMed] [Green Version]
- Park, Y.; Dodd, K.W.; Kipnis, V.; Thompson, F.E.; Potischman, N.; Schoeller, D.A.; Baer, D.J.; Midthune, D.; Troiano, R.P.; Bowles, H.; et al. Comparison of self-reported dietary intakes from the Automated Self-Administered 24-h recall, 4-d food records, and food-frequency questionnaires against recovery biomarkers. Am. J. Clin. Nutr. 2018, 107, 80–93. [Google Scholar] [CrossRef] [PubMed] [Green Version]
- Kato, E.; Takachi, R.; Ishihara, J.; Ishii, Y.; Sasazuki, S.; Sawada, N.; Iwasaki, M.; Shinozawa, Y.; Umezawa, J.; Tanaka, J.; et al. Online version of the self-administered food frequency questionnaire for the Japan Public Health Center-based Prospective Study for the Next Generation (JPHC-NEXT) protocol: Relative validity, usability, and comparison with a printed questionnaire. J. Epidemiol. 2017. [Google Scholar] [CrossRef] [PubMed]
- Nybacka, S.; Bertéus Forslund, H.; Wirfält, E.; Larsson, I.; Ericson, U.; Warensjö Lemming, E.; Bergström, G.; Hedblad, B.; Winkvist, A.; Lindroos, A.K. Comparison of a web-based food record tool and a food-frequency questionnaire and objective validation using the doubly labelled water technique in a Swedish middle-aged population. J. Nutr. Sci. 2016, 5. [Google Scholar] [CrossRef] [PubMed] [Green Version]
- Guasch-Ferré, M.; Bhupathiraju, S.N.; Hu, F.B. Use of metabolomics in improving assessment of dietary intake. Clin. Chem. 2017. [Google Scholar] [CrossRef] [PubMed]


| IA-FFQ | WEB-FFQ | p2 | |
|---|---|---|---|
| N = 127 | N = 200 | ||
| Sex, n (%) | 0.01 | ||
| Men | 51 (40.2) | 108 (54.0) | |
| Women | 76 (59.8) | 92 (46.0) | |
| Ethnicity, n (%) | 0.01 | ||
| Caucasian | 121 (95.3) | 172 (86.0) | |
| Other | 6 (4.7) | 28 (14.0) | |
| Age 3, mean (SD) years | 40.9 (16.8) | 44.5 (15.4) | 0.04 |
| 19–34, n (%) | 58 (45.7) | 67 (33.5) | |
| 35–49, n (%) | 14 (11.0) | 44 (22.0) | |
| 50–70, n (%) | 55 (43.3) | 89 (44.5) | |
| Time to completion, minutes | - | 42.9 (34.0 to 59.3) | |
| Body weight, mean (SD) kg | 72.8 (16.6) | 84.6 (15.8) | <0.0001 |
| Body mass index, mean (SD) kg/m2 | 25.8 (5.4) | 29.7 (4.4) | <0.0001 |
| Normal, n (%) | 69 (54.3) | 27 (13.5) | |
| Overweight, n (%) | 31 (24.4) | 81 (40.5) | |
| Obese, n (%) | 27 (21.3) | 92 (46.0) | |
| Waist circumference, mean (SD) cm | 88.4 (14.8) | 100.6 (11.8) | <0.0001 |
| n | rEI, kcal | mER, kcal | ∆ rEI-mER, kcal | ∆ rEI-mER, % * | Spearman CC | |
|---|---|---|---|---|---|---|
| IA-FFQ | ||||||
| All | 127 | 2413 ± 602 | 2642 ± 558 | −229 (−324 to −133) † | −9.5 (−12.7 to −6.1) | 0.50 ‡ |
| Sex | ||||||
| Men | 51 | 2744 ± 605 | 3161 ± 467 | −417 (−600 to −234) † | −14.3 (−19.6 to −8.6) | 0.23 |
| Women | 76 | 2191 ± 491 | 2294 ± 265 | −102 (−197 to −8) † | −6.1 (−9.9 to −2.0) | 0.63 ‡ |
| BMI | ||||||
| Non-obese | 100 | 2415 ± 610 | 2594 ± 546 | −179 (−282 to −76) † | −7.8 (−11.5 to −4.0) | 0.51 ‡ |
| Obese | 27 | 2409 ± 582 | 2822 ± 573 | −413 (−649 to −176) † | −15.3 (−21.9 to −8.1) | 0.13 |
| WEB-FFQ | ||||||
| All | 200 | 2519 ± 962 | 2684 ± 536 | −166 (−292 to −39) † | −11.0 (−15.4 to −6.4) | 0.34 ‡ |
| Sex | ||||||
| Men | 108 | 2764 ± 991 | 3056 ± 414 | −292 (−469 to −116) † | −14.9 (−20.5 to −8.9) | 0.40 ‡ |
| Women | 92 | 2231 ± 845 | 2248 ± 265 | −17 (−198 to 163) | −6.3 (−13.1 to 1.1) | 0.20 |
| BMI | ||||||
| Non-obese | 108 | 2583 ± 1021 | 2543 ± 520 | 40 (−132 to 212) | −4.1 (−10.4 to 2.7) | 0.39 ‡ |
| Obese | 92 | 2443 ± 888 | 2850 ± 508 | −407 (−585 to −230) † | −18.5 (−24.3 to −12.3) | 0.27 ‡ |
| FFQ Method | n | Under-Reporters | Accurate Reporters | Over-Reporters | p * | |
|---|---|---|---|---|---|---|
| All | IA | 127 | 26.0 (18.6 to 34.5) | 67.7 (58.9 to 75.7) | 6.3 (2.8 to 12.0) | 0.0005 |
| WEB | 200 | 34.5 (27.9 to 41.5) | 48.0 (40.9 to 55.2) | 17.5 (12.5 to 23.5) | ||
| Sex | ||||||
| Men | IA | 51 | 33.3 (20.8 to 47.9) | 60.8 (46.1 to 74.2) | 5.9 (1.2 to 16.2) | 0.12 |
| WEB | 108 | 38.0 (28.8 to 47.8) | 46.3 (36.7 to 56.2) | 15.7 (9.5 to 24.0) | ||
| Women | IA | 76 | 21.1 (12.5 to 31.9) | 72.4 (60.9 to 82.0) | 6.6 (2.2 to 14.7) | 0.0063 |
| WEB | 92 | 30.4 (21.3 to 40.9) | 50.0 (39.4 to 60.6) | 19.6 (12.0 to 29.2) | ||
| BMI | ||||||
| Non-obese | IA | 100 | 24.0 (16.0 to 33.6) | 69.0 (59.0 to 77.9) | 7.0 (2.9 to 13.9) | 0.0019 |
| WEB | 108 | 24.1 (16.4 to 33.3) | 51.9 (42.0 to 61.6) | 24.1 (16.4 to 33.3) | ||
| Obese | IA | 27 | 33.3 (16.5 to 54.0) | 63.0 (42.4 to 80.6) | 3.7 (0.1 to 19.0) | 0.24 |
| WEB | 92 | 46.7 (36.3 to 57.4) | 43.5 (33.2 to 54.2) | 9.8 (4.6 to 17.8) | ||
© 2018 by the authors. Licensee MDPI, Basel, Switzerland. This article is an open access article distributed under the terms and conditions of the Creative Commons Attribution (CC BY) license (http://creativecommons.org/licenses/by/4.0/).
Share and Cite
Brassard, D.; Lemieux, S.; Charest, A.; Lapointe, A.; Couture, P.; Labonté, M.-È.; Lamarche, B. Comparing Interviewer-Administered and Web-Based Food Frequency Questionnaires to Predict Energy Requirements in Adults. Nutrients 2018, 10, 1292. https://doi.org/10.3390/nu10091292
Brassard D, Lemieux S, Charest A, Lapointe A, Couture P, Labonté M-È, Lamarche B. Comparing Interviewer-Administered and Web-Based Food Frequency Questionnaires to Predict Energy Requirements in Adults. Nutrients. 2018; 10(9):1292. https://doi.org/10.3390/nu10091292
Chicago/Turabian StyleBrassard, Didier, Simone Lemieux, Amélie Charest, Annie Lapointe, Patrick Couture, Marie-Ève Labonté, and Benoît Lamarche. 2018. "Comparing Interviewer-Administered and Web-Based Food Frequency Questionnaires to Predict Energy Requirements in Adults" Nutrients 10, no. 9: 1292. https://doi.org/10.3390/nu10091292
APA StyleBrassard, D., Lemieux, S., Charest, A., Lapointe, A., Couture, P., Labonté, M.-È., & Lamarche, B. (2018). Comparing Interviewer-Administered and Web-Based Food Frequency Questionnaires to Predict Energy Requirements in Adults. Nutrients, 10(9), 1292. https://doi.org/10.3390/nu10091292