Changes in Plasma Acylcarnitine and Lysophosphatidylcholine Levels Following a High-Fructose Diet: A Targeted Metabolomics Study in Healthy Women

Abstract
1. Introduction
2. Methods
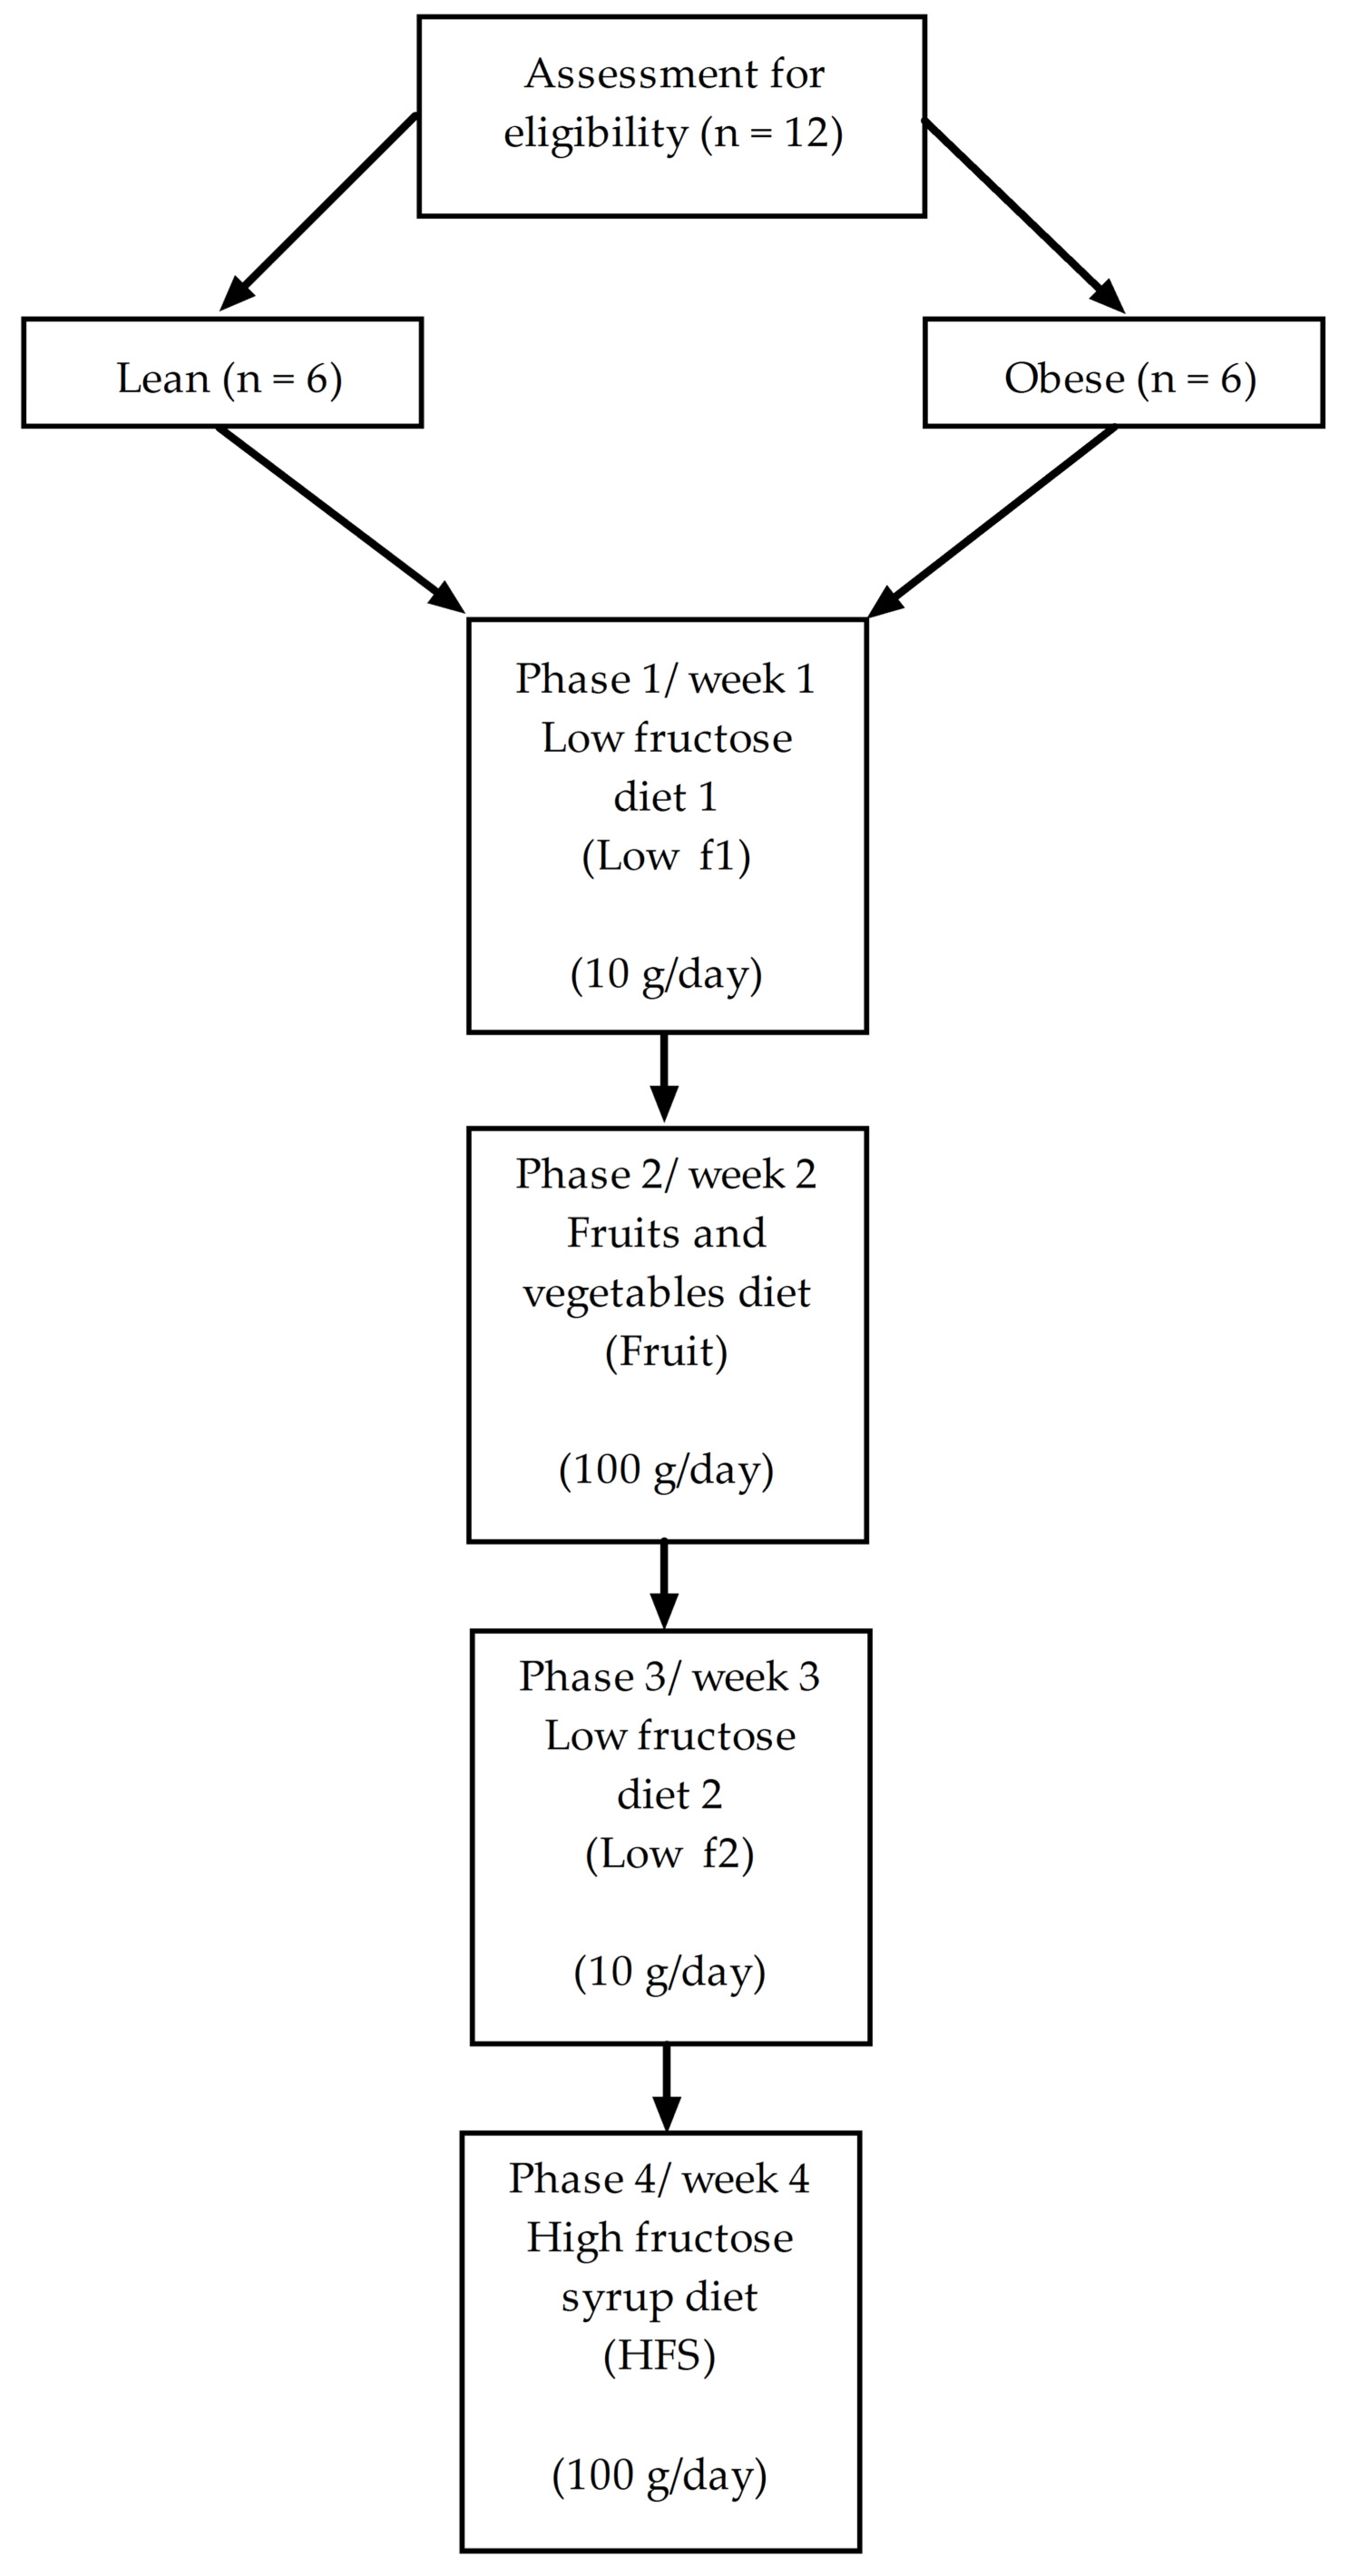
2.1. Study Design
2.2. Selection of Subjects
2.3. Dietetic Intervention
2.4. Outcomes
2.5. Statistical Analysis
3. Results
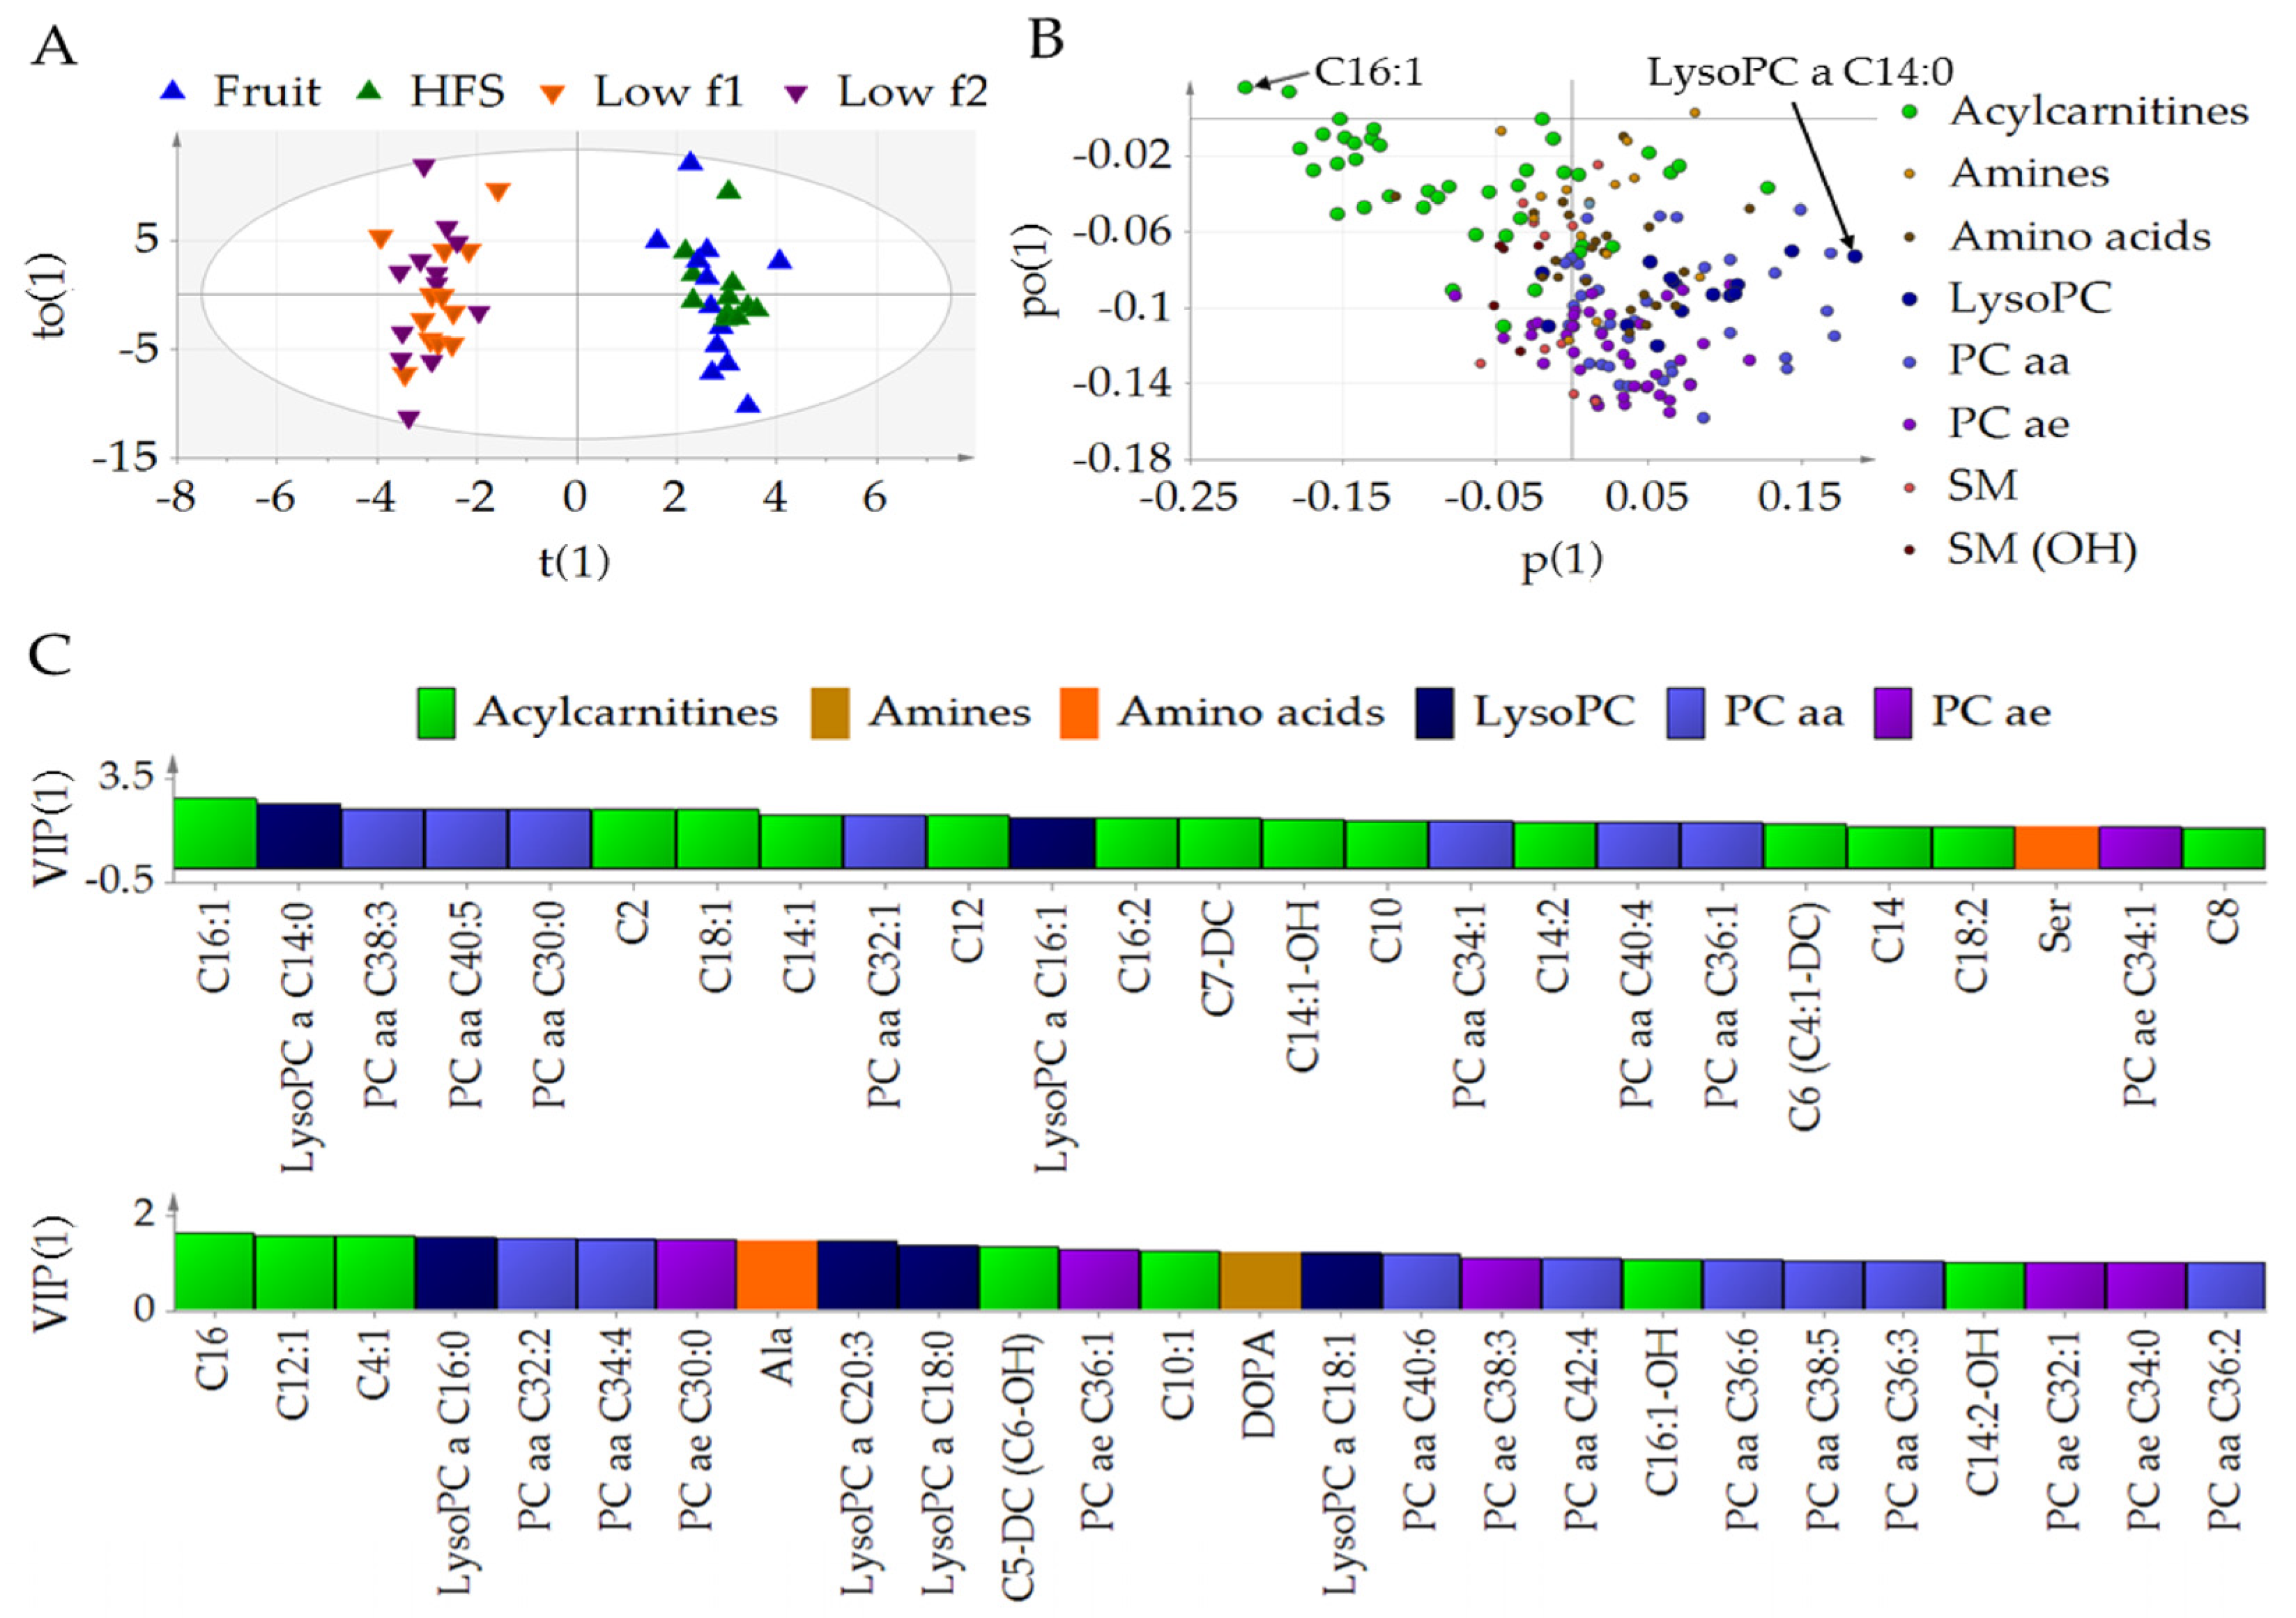
3.1. Fructose Affects the Metabolic Profile in Plasma
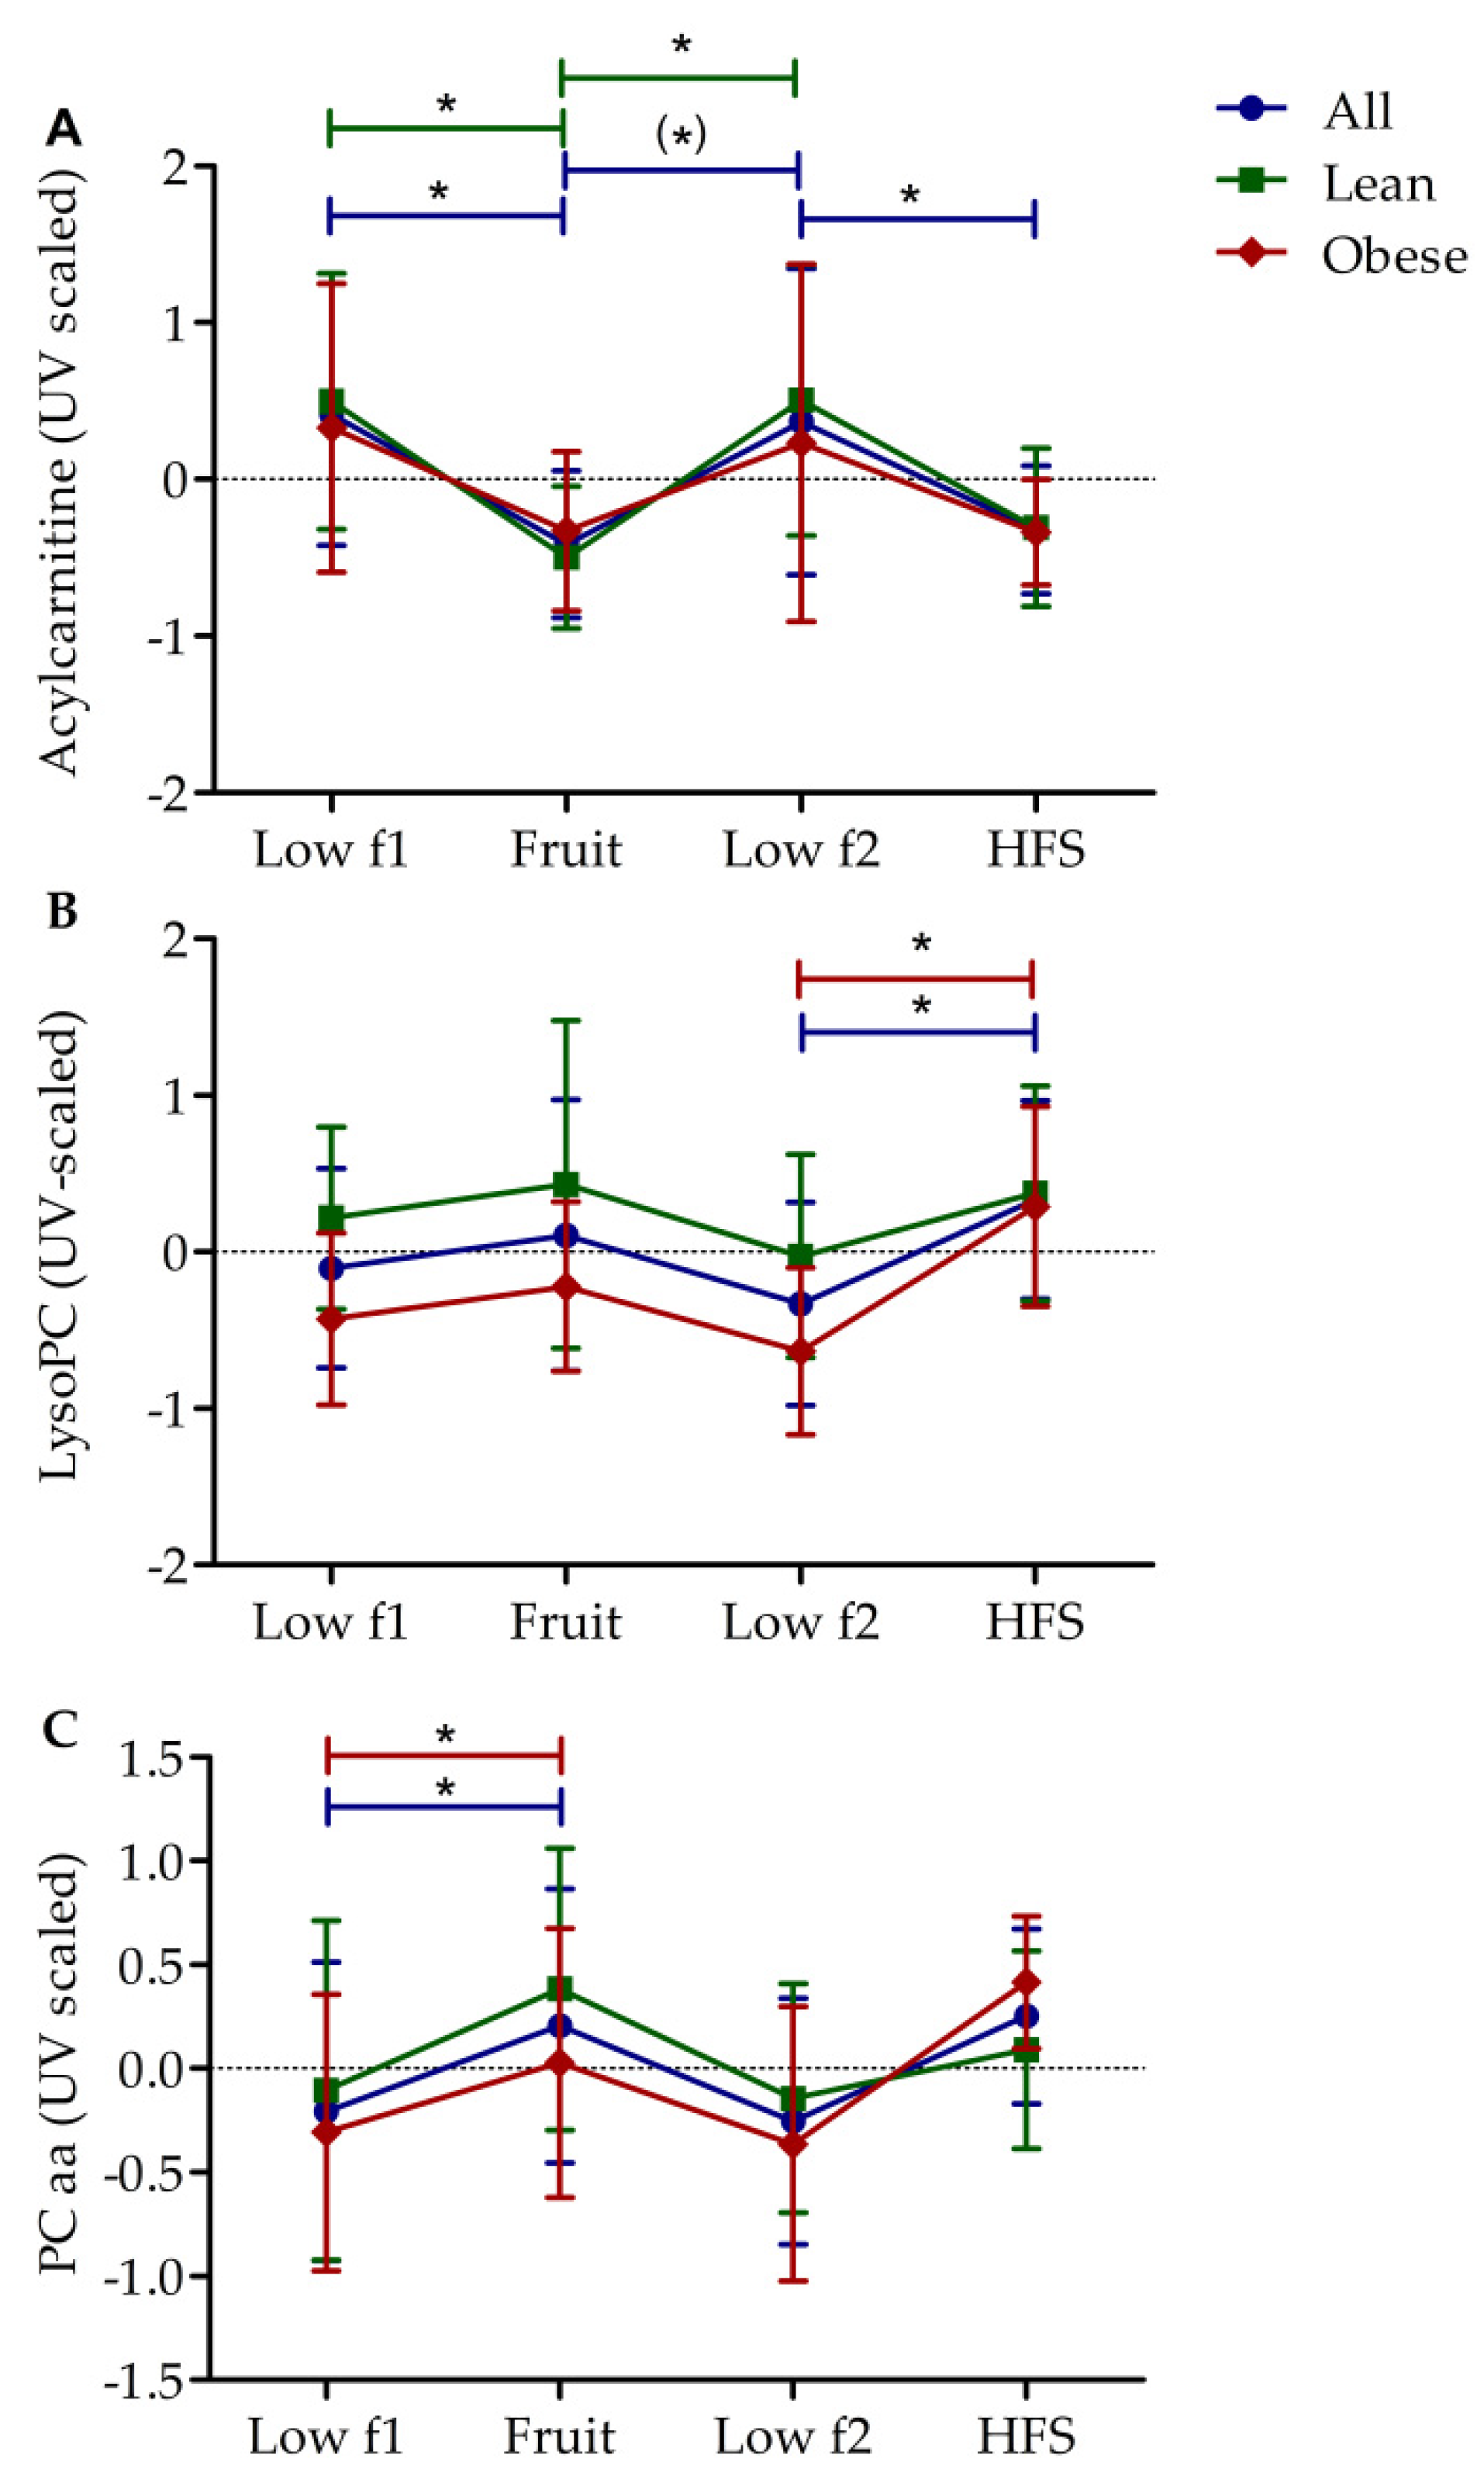
3.2. Diet-Dependent Changes of Acylcarnitine, Lysophophadidylcholines, and Diacyl-Phophadidylcholines
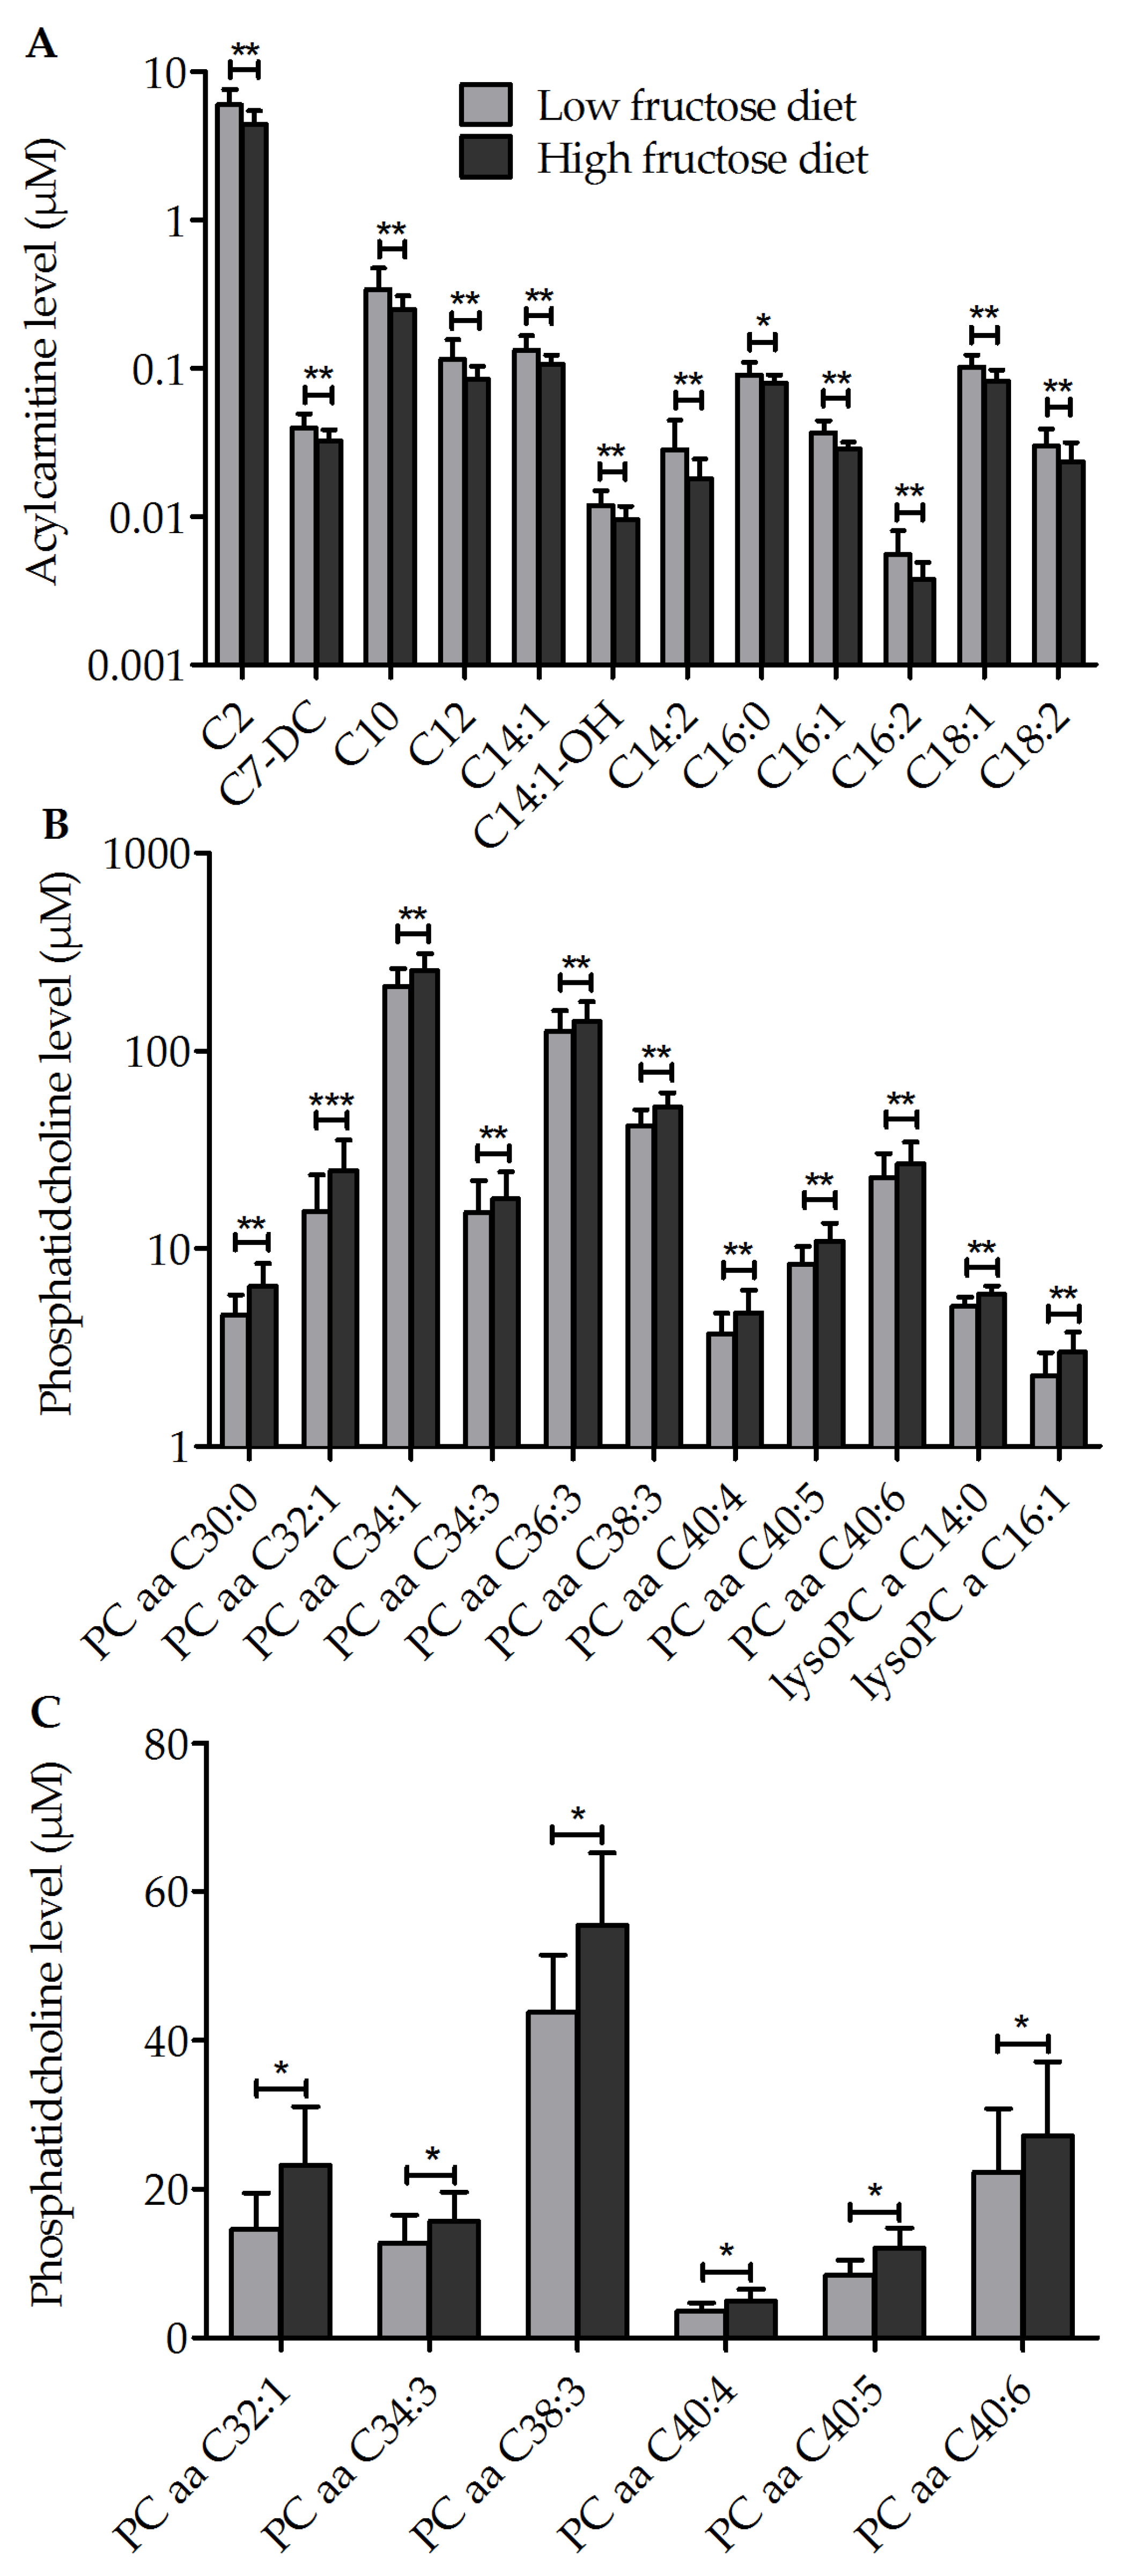
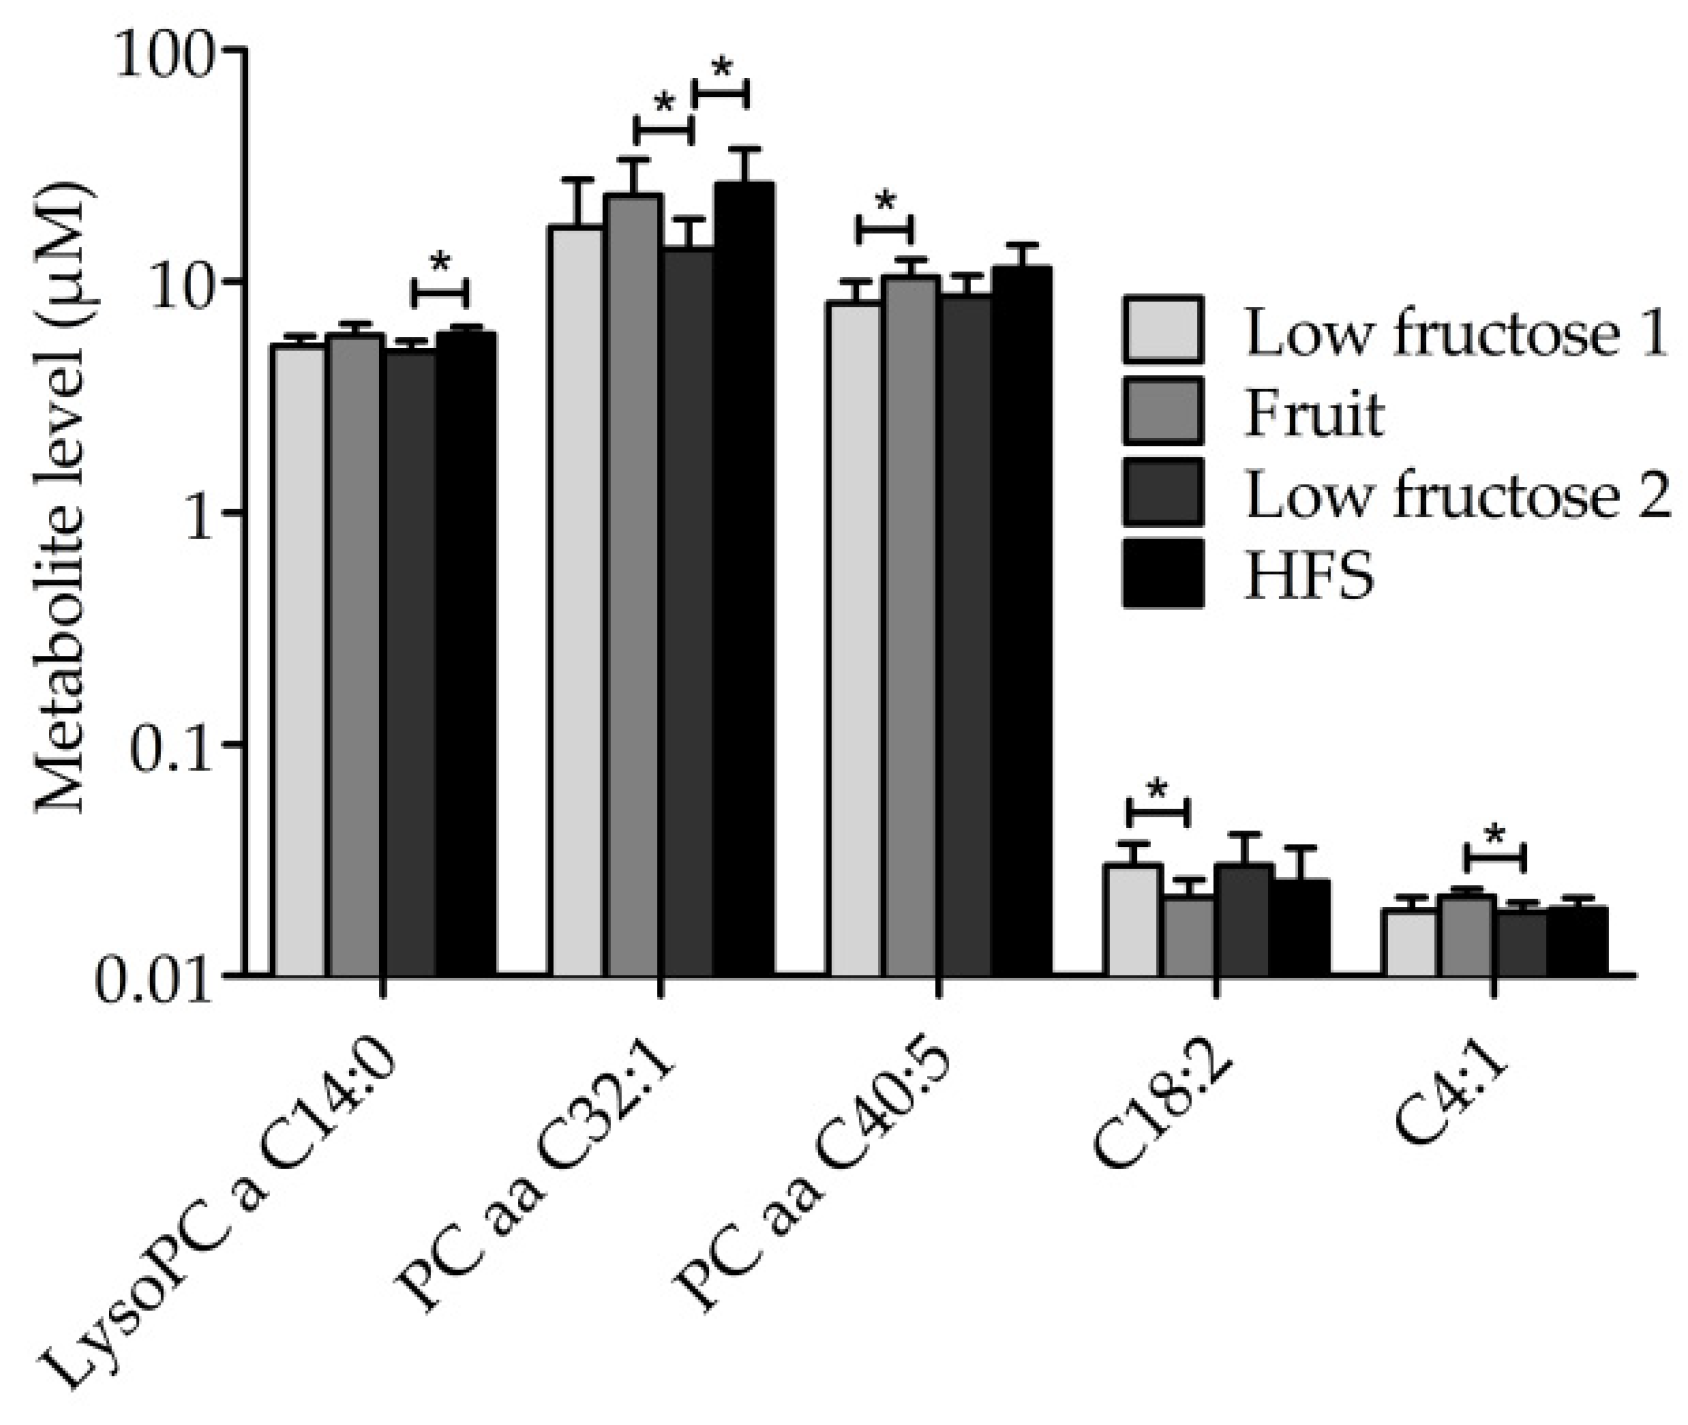
3.3. Metabolic Profile of Single Metabolites
3.4. Other Outcomes
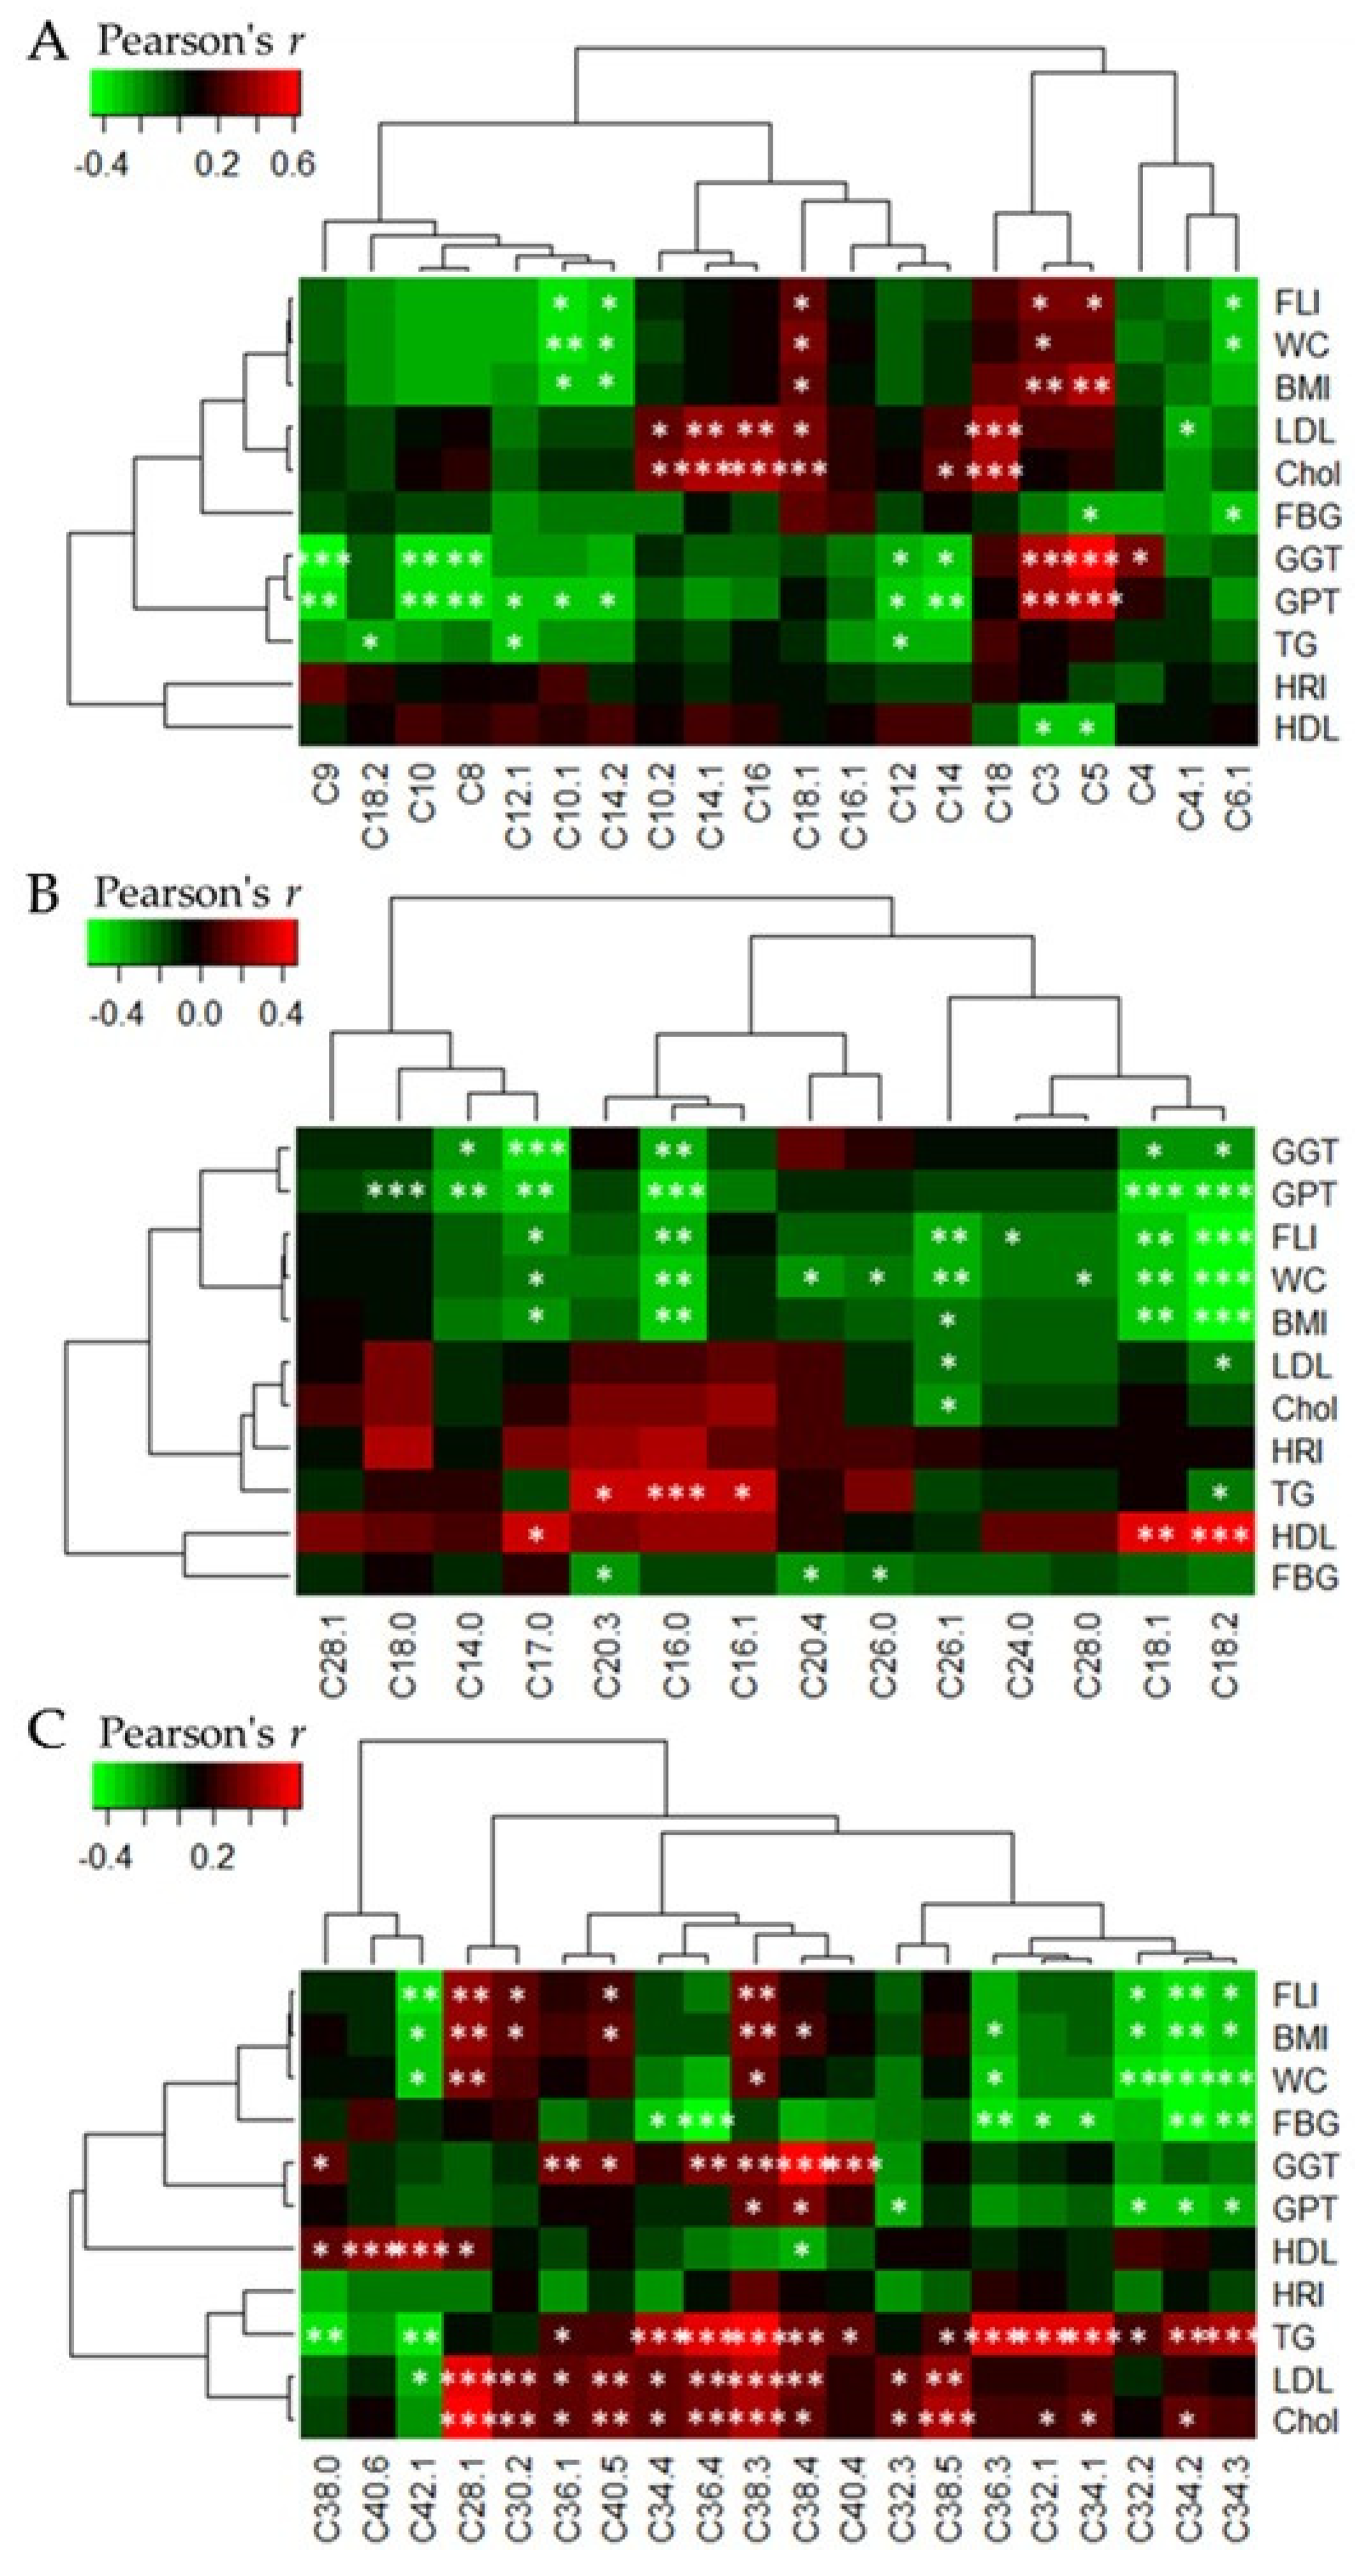
3.5. Heatmap Correlations between Acylcarnitine and Phophatidylcholine Levels, Respectively, and Clinical Parameters
4. Discussion
Supplementary Materials
Author Contributions
Funding
Acknowledgments
Conflicts of Interest
References
- OECD/FAO. OECD-FAO Agricultural Outlook 2017–2026. Available online: http://dx.doi.org/10.1787/agr_outlook-2017-en (accessed on 9 May 2018).
- Bray, G.A.; Nielsen, S.J.; Popkin, B.M. Consumption of high-fructose corn syrup in beverages may play a role in the epidemic of obesity. Am. J. Clin. Nutr. 2004, 79, 537–543. [Google Scholar] [CrossRef] [PubMed]
- Elliott, S.S.; Keim, N.L.; Stern, J.S.; Teff, K.; Havel, P.J. Fructose, weight gain, and the insulin resistance syndrome. Am. J. Clin. Nutr. 2002, 76, 911–922. [Google Scholar] [CrossRef] [PubMed]
- Havel, P.J. Dietary fructose: implications for dysregulation of energy homeostasis and lipid/carbohydrate metabolism. Nutr. Rev. 2005, 63, 133–157. [Google Scholar] [CrossRef] [PubMed]
- Ibitoye, O.B.; Ajiboye, T.O. Dietary phenolic acids reverse insulin resistance, hyperglycaemia, dyslipidaemia, inflammation and oxidative stress in high-fructose diet-induced metabolic syndrome rats. Arch. Physiol. Biochem. 2017, 20, 1–8. [Google Scholar] [CrossRef] [PubMed]
- Bergheim, I.; Weber, S.; Vos, M.; Krämer, S.; Volynets, V.; Kaserouni, S.; McClain, C.J.; Bischoff, S.C. Antibiotics protect against fructose-induced hepatic lipid accumulation in mice: role of endotoxin. J. Hepatol. 2008, 48, 983–992. [Google Scholar] [CrossRef] [PubMed]
- Volynets, V.; Louis, S.; Pretz, D.; Lang, L.; Ostaff, M.J.; Wehkamp, J.; Bischoff, S.C. Intestinal barrier function and the gut microbiome are differentially affected in mice fed a Western-Style diet or drinking water supplemented with fructose. J. Nutr. 2017, 147, 770–780. [Google Scholar] [CrossRef] [PubMed]
- Kelishadi, R.; Mansourian, M.; Heidari-Beni, M. Association of fructose consumption and components of metabolic syndrome in human studies: A systematic review and meta-analysis. Nutrition 2014, 30, 503–510. [Google Scholar] [CrossRef] [PubMed]
- Aeberli, I.; Gerber, P.A.; Hochuli, M.; Kohler, S.; Haile, S.R.; Gouni-Berthold, I.; Berthold, H.K.; Spinas, G.A.; Berneis, K. Low to moderate sugar-sweetened beverage consumption impairs glucose and lipid metabolism and promotes inflammation in healthy young men: A randomized controlled trial. Am. J. Clin. Nutr. 2011, 94, 479–485. [Google Scholar] [CrossRef] [PubMed]
- Ter Horst, K.W.; Schene, M.R.; Holman, R.; Romijn, J.A.; Serlie, M.J. Effect of fructose consumption on insulin sensitivity in nondiabetic subjects: A systematic review and meta-analysis of diet-intervention trials. Am. J. Clin. Nutr. 2016, 104, 1562–1576. [Google Scholar] [CrossRef] [PubMed]
- Stanhope, K.L.; Havel, P.J. Fructose consumption: Potential mechanisms for its effects to increase visceral adiposity and induce dyslipidemia and insulin resistance. Curr. Opin. Lipidol. 2008, 19, 16–24. [Google Scholar] [CrossRef] [PubMed]
- Schaefer, E.J.; Gleason, J.A.; Dansinger, M.L. Dietary fructose and glucose differentially affect lipid and glucose homeostasis. J. Nutr. 2009, 139, 1257S–1262S. [Google Scholar] [CrossRef] [PubMed]
- Stanhope, K.L.; Griffen, S.C.; Bair, B.R.; Swarbrick, M.M.; Keim, N.L.; Havel, P.J. Twenty-four-hour endocrine and metabolic profiles following consumption of high-fructose corn syrup-, sucrose-, fructose-, and glucose-sweetened beverages with meals. Am. J. Clin. Nutr. 2008, 87, 1194–1203. [Google Scholar] [CrossRef] [PubMed]
- Teff, K.L.; Grudziak, J.; Townsend, R.R.; Dunn, T.N.; Grant, R.W.; Adams, S.H.; Keim, N.L.; Cummings, B.P.; Stanhope, K.L.; Havel, P.J. Endocrine and metabolic effects of consuming fructose-and glucose-sweetened beverages with meals in obese men and women: Influence of insulin resistance on plasma triglyceride responses. J. Clin. Endocrinol. Metab. 2009, 94, 1562–1569. [Google Scholar] [CrossRef] [PubMed]
- Chiavaroli, L.; de Souza, R.J.; Ha, V.; Cozma, A.I.; Mirrahimi, A.; Wang, D.D.; Yu, M.; Carleton, A.J.; Di Buono, M.; Jenkins, A.L.; et al. Effect of fructose on established lipid targets: A systematic review and meta-analysis of controlled feeding trials. J. Am. Heart Assoc. 2015, 10, 4–e001700. [Google Scholar] [CrossRef] [PubMed]
- Vos, M.B.; Kimmons, J.E.; Gillespie, C.; Welsh, J.; Blanck, H.M. Dietary fructose consumption among US children and adults: The third national health and nutrition examination survey. Medscape J. Med. 2008, 10, 160. [Google Scholar] [PubMed]
- Eisenmann, A.; Amann, A.; Said, M.; Datta, B.; Ledochowski, M. Implementation and interpretation of hydrogen breath tests. J. Breath Res. 2008, 2, 46002. [Google Scholar] [CrossRef] [PubMed]
- Mishra, P.; Younossi, Z.M. Abdominal ultrasound for diagnosis of nonalcoholic fatty liver disease (NAFLD). Am. J. Gastroenterol. 2007, 102, 2716–2717. [Google Scholar] [CrossRef] [PubMed]
- Webb, M.; Yeshua, H.; Zelber-Sagi, S.; Santo, E.; Brazowski, E.; Halpern, Z.; Oren, R. Diagnostic value of a computerized hepatorenal index for sonographic quantification of liver steatosis. Am. J. Roentgenol. 2009, 192, 909–914. [Google Scholar] [CrossRef] [PubMed]
- Bedogni, G.; Bellentani, S.; Miglioli, L.; Masutti, F.; Passalacqua, M.; Castiglione, A.; Tiribelli, C. The fatty liver index: A simple and accurate predictor of hepatic steatosis in the general population. BMC Gastroenterol. 2006, 6, 33. [Google Scholar] [CrossRef] [PubMed]
- Bylesjö, M.; Rantalainen, M.; Cloarec, O.; Nicholson, J.K.; Holmes, E.; Trygg, J. OPLS discriminant analysis: Combining the strengths of PLS-DA and SIMCA classification. J. Chemom. 2006, 20, 341–351. [Google Scholar] [CrossRef]
- Longo, N.; Di San Filippo, C.A.; Pasquali, M. Disorders of carnitine transport and the carnitine cycle. Am. J. Med. Genet. Part C Semin. Med. Genet. 2006, 142, 77–85. [Google Scholar] [CrossRef] [PubMed]
- Shriver, L.P.; Manchester, M. Inhibition of fatty acid metabolism ameliorates disease activity in an animal model of multiple sclerosis. Sci. Rep. 2011, 1, 79. [Google Scholar] [CrossRef] [PubMed]
- Modre-Osprian, R.; Osprian, I.; Tilg, B.; Schreier, G.; Weinberger, K.M.; Graber, A. Dynamic simulations on the mitochondrial fatty acid beta-oxidation network. BMC Syst. Biol. 2009, 3, 2. [Google Scholar] [CrossRef] [PubMed]
- Moreira, V.; Brasili, E.; Fiamoncini, J.; Marini, F.; Miccheli, A.; Daniel, H.; Lee, J.J.H.; Hassimotto, N.M.A.; Lajolo, F.M. Orange juice affects acylcarnitine metabolism in healthy volunteers as revealed by a mass-spectrometry based metabolomics approach. Food Res. Int. 2018, 107, 346–352. [Google Scholar] [CrossRef] [PubMed]
- Adams, S.H.; Hoppel, C.L.; Lok, K.H.; Zhao, L.; Wong, S.W.; Minkler, P.E.; Hwang, D.H.; Newman, J.W.; Garvey, W.T. Plasma acylcarnitine profiles suggest incomplete long-chain fatty acid β-oxidation and altered tricarboxylic acid cycle activity in type 2 diabetic African-American women. J. Nutr. 2009, 139, 1073–1081. [Google Scholar] [CrossRef] [PubMed]
- Menni, C.; Migaud, M.; Kastenmüller, G.; Pallister, T.; Zierer, J.; Peters, A.; Mohney, R.P.; Spector, T.D.; Bagnardi, V.; Gieger, C. Metabolomic profiling of long-term weight change: Role of oxidative stress and urate levels in weight gain. Obesity 2017, 25, 1618–1624. [Google Scholar] [CrossRef] [PubMed]
- Mihalik, S.J.; Goodpaster, B.H.; Kelley, D.E.; Chace, D.H.; Vockley, J.; Toledo, F.G.S.; DeLany, J.P. Increased levels of plasma acylcarnitines in obesity and type 2 diabetes and identification of a marker of glucolipotoxicity. Obesity 2010, 18, 1695–1700. [Google Scholar] [CrossRef] [PubMed]
- Aguer, C.; McCoin, C.S.; Knotts, T.A.; Thrush, A.B.; Ono-Moore, K.; McPherson, R.; Dent, R.; Hwang, D.H.; Adams, S.H.; Harper, M.-E. Acylcarnitines: Potential implications for skeletal muscle insulin resistance. FASEB J. 2014, 29, 336–345. [Google Scholar] [CrossRef] [PubMed]
- Schooneman, M.G.; Vaz, F.M.; Houten, S.M.; Soeters, M.R. Acylcarnitines: Reflecting or inflicting insulin resistance? Diabetes 2013, 62, 1–8. [Google Scholar] [CrossRef] [PubMed]
- Assy, N.; Nasser, G.; Kamayse, I.; Nseir, W.; Beniashvili, Z.; Djibre, A.; Grosovski, M. Soft drink consumption linked with fatty liver in the absence of traditional risk factors. Can. J. Gastroenterol. 2008, 22, 811–816. [Google Scholar] [CrossRef] [PubMed]
- Abdel-Sayed, A.; Binnert, C.; Lê, K.A.; Bortolotti, M.; Schneiter, P.; Tappy, L. A high-fructose diet impairs basal and stress-mediated lipid metabolism in healthy male subjects. Br. J. Nutr. 2008, 100, 393–399. [Google Scholar] [CrossRef] [PubMed]
- Nomura, K.; Yamanouchi, T. The role of fructose-enriched diets in mechanisms of nonalcoholic fatty liver disease. J. Nutr. Biochem. 2012, 23, 203–208. [Google Scholar] [CrossRef] [PubMed]
- Cox, C.L.; Stanhope, K.L.; Schwarz, J.M.; Graham, J.L.; Hatcher, B.; Griffen, S.C.; Bremer, A.A.; Berglund, L.; McGahan, J.P.; Havel, P.J. Consumption of fructose-sweetened beverages for 10 weeks reduces net fat oxidation and energy expenditure in overweight/obese men and women. Eur. J. Clin. Nutr. 2012, 66, 201–208. [Google Scholar] [CrossRef] [PubMed]
- Faeh, D.; Minehira, K.; Schwarz, J.M.; Periasamy, R.; Park, S.; Tappy, L. Effect of fructose overfeeding and fish oil administration on hepatic de novo lipogenesis and insulin sensitivity in healthy men. Diabetes 2005, 54, 1907–1913. [Google Scholar] [CrossRef] [PubMed]
- Geidl-Flueck, B.; Gerber, P.A. Insights into the hexose liver metabolism—Glucose versus fructose. Nutrients 2017, 9, 1026. [Google Scholar] [CrossRef] [PubMed]
- Roglans, N.; Vilà, L.; Farré, M.; Alegret, M.; Sánchez, R.M.; Vázquez-Carrera, M.; Laguna, J.C. Impairment of hepatic stat-3 activation and reduction of PPARα activity in fructose-fed rats. Hepatology 2007, 45, 778–788. [Google Scholar] [CrossRef] [PubMed]
- Schmitz, G.; Ruebsaamen, K. Metabolism and atherogenic disease association of lysophosphatidylcholine. Atherosclerosis 2010, 208, 10–18. [Google Scholar] [CrossRef] [PubMed]
- Webb, N.R. Getting to the core of atherosclerosis. Nat. Med. 2008, 14, 1015–1016. [Google Scholar] [CrossRef] [PubMed]
- Thukkani, A.K.; McHowat, J.; Hsu, F.F.; Brennan, M.L.; Hazen, S.L.; Ford, D.A. Identification of α-chloro fatty aldehydes and unsaturated lysophosphatidylcholine molecular species in human atherosclerotic lesions. Circulation 2003, 108, 3128–3133. [Google Scholar] [CrossRef] [PubMed]
- Liu-Wu, Y.; Hurt-Camejo, E.; Wiklund, O. Lysophosphatidylcholine induces the production of IL-1β by human monocytes. Atherosclerosis 1998, 137, 351–357. [Google Scholar] [CrossRef]
- Mannheim, D.; Herrmann, J.; Versari, D.; Gössl, M.; Meyer, F.B.; McConnell, J.P.; Lerman, L.O.; Lerman, A. Enhanced expression of Lp-PLA2 and lysophosphatidylcholine in symptomatic carotid atherosclerotic plaques. Stroke 2008, 39, 1448–1455. [Google Scholar] [CrossRef] [PubMed]
- Hansson, G.K. Inflammation, atherosclerosis, and coronary artery disease. N. Engl. J. Med. 2005, 352, 1685–1695. [Google Scholar] [CrossRef] [PubMed]
- Schwemmer, M.; Aho, H.; Michel, J.B. Interleukin-1β-induced type IIA secreted phospholipase A2gene expression and extracellular activityin rat vascular endothelial cells. Tissue Cell 2001, 33, 233–240. [Google Scholar] [CrossRef] [PubMed]
- Davis, B.; Koster, G.; Douet, L.J.; Scigelova, M.; Woffendin, G.; Ward, J.M.; Smith, A.; Humphries, J.; Burnand, K.G.; Macphee, C.H. Electrospray ionization mass spectrometry identifies substrates and products of lipoprotein-associated phospholipase A2 in oxidized human low density lipoprotein. J. Biol. Chem. 2008, 283, 6428–6437. [Google Scholar] [CrossRef] [PubMed]
- Weir, J.M.; Wong, G.; Barlow, C.K.; Greeve, M.A.; Kowalczyk, A.; Almasy, L.; Comuzzie, A.G.; Mahaney, M.C.; Jowett, J.B.M.; Shaw, J.; et al. Plasma lipid profiling in a large population-based cohort. J. Lipid Res. 2013, 54, 2898–2908. [Google Scholar] [CrossRef] [PubMed]
- Barber, M.N.; Risis, S.; Yang, C.; Meikle, P.J.; Staples, M.; Febbraio, M.A.; Bruce, C.R. Plasma lysophosphatidylcholine levels are reduced in obesity and type 2 diabetes. PLoS ONE 2012, 7, e41456. [Google Scholar] [CrossRef] [PubMed]
- Hotamisligil, G.S. Inflammation and metabolic disorders. Nature 2006, 444, 860–867. [Google Scholar] [CrossRef] [PubMed]
- Bondia-Pons, I.; Ryan, L.; Martinez, J.A. Oxidative stress and inflammation interactions in human obesity. J. Physiol. Biochem. 2012, 68, 701–711. [Google Scholar] [CrossRef] [PubMed]
- Pietiläinen, K.H.; Sysi-Aho, M.; Rissanen, A.; Seppänen-Laakso, T.; Yki-Järvinen, H.; Kaprio, J.; Orešič, M. Acquired obesity is associated with changes in the serum lipidomic profile independent of genetic effects—A monozygotic twin study. PLoS ONE 2007, 2, e218. [Google Scholar] [CrossRef] [PubMed]
- Moreno, J.A.; Hong, E. A single oral dose of fructose induces some features of metabolic syndrome in rats: Role of oxidative stress. Nutr. Metab. Cardiovasc. Dis. 2013, 23, 536–542. [Google Scholar] [CrossRef] [PubMed]
- Castro, M.C.; Francini, F.; Schinella, G.; Caldiz, C.I.; Zubiría, M.G.; Gagliardino, J.J.; Massa, M.L. Apocynin administration prevents the changes induced by a fructose-rich diet on rat liver metabolism and the antioxidant system. Clin. Sci. 2012, 123, 681–692. [Google Scholar] [CrossRef] [PubMed]
- Akar, F.; Uludağ, O.; Aydın, A.; Aytekin, Y.A.; Elbeg, S.; Tuzcu, M.; Sahin, K. High-fructose corn syrup causes vascular dysfunction associated with metabolic disturbance in rats: Protective effect of resveratrol. Food Chem. Toxicol. 2012, 50, 2135–2141. [Google Scholar] [CrossRef] [PubMed]
- Palafox-Carlos, H.; Ayala-Zavala, J.F.; González-Aguilar, G.A. The role of dietary fiber in the bioaccessibility and bioavailability of fruit and vegetable antioxidants. J. Food Sci. 2011, 76. [Google Scholar] [CrossRef] [PubMed]
- Hoad, C.L.; Rayment, P.; Spiller, R.C.; Marciani, L.; de Celis Alonso, B.; Traynor, C.; Mela, D.J.; Peters, H.P.F.; Gowland, P.A. In vivo imaging of intragastric gelation and its effect on satiety in humans. J. Nutr. 2004, 134, 2293–2300. [Google Scholar] [CrossRef] [PubMed]
- Marciani, L.; Gowland, P.A.; Spiller, R.C.; Manoj, P.; Moore, R.J.; Young, P.; Fillery-Travis, A.J. Effect of meal viscosity and nutrients on satiety, intragastric dilution, and emptying assessed by MRI. Am. J. Physiol. Gastrointest. Liver Physiol. 2001, 280, G1227–G1233. [Google Scholar] [CrossRef] [PubMed]
- Benini, L.; Castellani, G.; Brighenti, F.; Heaton, K.W.; Brentegani, M.T.; Casiraghi, M.C.; Sembenini, C.; Pellegrini, N.; Fioretta, A.; Minniti, G. Gastric emptying of a solid meal is accelerated by the removal of dietary fibre naturally present in food. Gut 1995, 36, 825–830. [Google Scholar] [CrossRef] [PubMed]
- Padayachee, A.; Day, L.; Howell, K.; Gidley, M.J. Complexity and health functionality of plant cell wall fibers from fruits and vegetables. Crit. Rev. Food Sci. Nutr. 2017, 57, 59–81. [Google Scholar] [CrossRef] [PubMed]
- Brouns, F.; Theuwissen, E.; Adam, A.; Bell, M.; Berger, A.; Mensink, R.P. Cholesterol-lowering properties of different pectin types in mildly hyper-cholesterolemic men and women. Eur. J. Clin. Nutr. 2012, 66, 591–599. [Google Scholar] [CrossRef] [PubMed]
- Gruendel, S.; Garcia, A.L.; Otto, B.; Wagner, K.; Bidlingmaier, M.; Burget, L.; Weickert, M.O.; Dongowski, G.; Speth, M.; Katz, N. Increased acylated plasma ghrelin, but improved lipid profiles 24-h after consumption of carob pulp preparation rich in dietary fibre and polyphenols. Br. J. Nutr. 2007, 98, 1170–1177. [Google Scholar] [CrossRef] [PubMed]
- Aller, R.; de Luis, D.A.; Izaola, O.; La Calle, F.; del Olmo, L.; Fernandez, L.; Arranz, T.; Hernandez, J.M. Effect of soluble fiber intake in lipid and glucose leves in healthy subjects: A randomized clinical trial. Diabetes Res. Clin. Pract. 2004, 65, 7–11. [Google Scholar] [CrossRef] [PubMed]
- Reinehr, T.; Wolters, B.; Knop, C.; Lass, N.; Hellmuth, C.; Harder, U.; Peissner, W.; Wahl, S.; Grallert, H.; Adamski, J.; et al. Changes in the serum metabolite profile in obese children with weight loss. Eur. J. Nutr. 2015, 54, 173–181. [Google Scholar] [CrossRef] [PubMed]
- Trabado, S.; Al-Salameh, A.; Croixmarie, V.; Masson, P.; Corruble, E.; Fève, B.; Colle, R.; Ripoll, L.; Walther, B.; Boursier-Neyret, C.; et al. The human plasma-metabolome: Reference values in 800 French healthy volunteers; impact of cholesterol, gender and age. PLoS ONE 2017, 12, e0173615. [Google Scholar] [CrossRef] [PubMed]
- Ouyang, Y.; Tong, H.; Luo, P.; Kong, H.; Xu, Z.; Yin, P.; Xu, G. A high throughput metabolomics method and its application in female serum samples in a normal menstrual cycle based on liquid chromatography-mass spectrometry. Talanta 2018, 185, 483–490. [Google Scholar] [CrossRef] [PubMed]


| Characteristics | Lean (n = 6) | Obese (n = 6) | p-Value |
|---|---|---|---|
| Age (years) | 26 ± 2 | 30 ± 3 | 0.013 |
| BMI (kg/m2) | 22.5 ± 1.5 | 41.5 ± 4.0 | 0.004 |
| WC (cm) | 72.4 ± 2.5 | 118.3 ± 9.4 | 0.004 |
| BP Sys (mmHg) | 104.2 ± 7.4 | 122.5 ± 9.9 | 0.004 |
| BP Dias (mmHg) | 69.2 ± 6.7 | 83.3 ± 6.8 | 0.005 |
| FBG (mg/dL) | 87.7 ± 4.6 | 93.3 ± 8.4 | ns |
| HDL (mg/dL) | 62.0 ± 11.4 | 53.8 ± 14.2 | ns |
| LDL (mg/dL) | 100.0 ± 22.1 | 137.2 ± 35.4 | 0.025 |
| TG (mg/dL) | 82.0 ± 20.5 | 108.7 ± 63.7 | ns |
| FLI | 7.0 ± 2.5 | 89.8 ± 12.5 | 0.001 |
| HRI | 0.9 ± 0.2 | 1.0 ± 0.1 | ns |
| GGT (U/L) | 15.5 ± 2.2 | 25.5 ± 17.7 | ns |
| GPT (U/L) | 16.2 ± 3.1 | 23.7 ± 6.2 | 0.024 |
| Nutrients | Low Fructose Diet | Fruits | HFS | |||
|---|---|---|---|---|---|---|
| Goal | Actual Intake | Goal | Actual Intake | Goal | Actual Intake | |
| Energy (kcal/day) | ||||||
| Lean | 2002 ± 56 | 1828 ± 260 | 2005 ± 54 | 2188 ± 357 | 2006 ± 59 | 2404 ± 404 * |
| Obese | 2207 ± 51 | 1949 ± 442 | 2209 ± 51 | 2404 ± 410 | 2210 ± 51 | 2961 ± 273 * |
| Protein (g/day) | ||||||
| Lean | 73 ± 2 | 83 ± 10 | 73 ± 2 | 69 ± 15 | 73 ± 2 | 65 ± 10 |
| Obese | 81 ± 2 | 102 ± 41 * | 81 ± 2 | 91 ± 29 | 81 ± 2 | 92 ± 28 |
| Fat (g/day) | ||||||
| Lean | 65 ± 2 | 80 ± 10 * | 65 ± 2 | 67 ± 20 | 65 ± 2 | 70 ± 20 |
| Obese | 71 ± 2 | 89 ± 25 * | 71 ± 2 | 79 ± 24 | 71 ± 2 | 93 ± 18 |
| CHO (g/day) | ||||||
| Lean | 268 ± 8 | 176 ± 52 * | 271 ± 5 | 308 ± 45 | 271 ± 5 | 357 ± 58 |
| Obese | 296 ± 7 | 174 ± 24 * | 288 ± 4 | 314 ± 24 | 288 ± 4 | 416 ± 47 |
| Fiber (g/day) | ||||||
| Lean | medium | 17 ± 6 | medium | 36 ± 8 | low | 12 ± 5 |
| Obese | medium | 19 ± 8 | medium | 39 ± 7 | low | 19 ± 7 |
| Complex CHO (g/day) | ||||||
| Lean | 258 ± 8 | 160 ± 48 * | 171 ± 5 | 128 ± 5 * | 171 ± 5 | 121 ± 30 * |
| Obese | 286 ± 7 | 166 ± 19 * | 188 ± 4 | 131 ± 3 * | 188 ± 4 | 174 ± 32 |
| Sac (g/day) | ||||||
| Lean | low | 8 ± 2 | medium | 55 ± 13 | low | 10 ± 7 |
| Obese | low | 4 ± 3 | medium | 59 ± 14 | low | 10 ± 7 |
| Fru (g/day) | ||||||
| Lean | 10 | 7 ± 2 | 100 | 100 ± 12 | 100 | 106 ± 11 |
| Obese | 10 | 4 ± 3 | 100 | 102 ± 4 | 100 | 108 ± 6 |
| Glu (g/day) | ||||||
| Lean | low | 7 ± 2 | medium | 80 ± 8 | high | 130 ± 12 |
| Obese | low | 5 ± 3 | medium | 80 ± 9 | high | 134 ± 6 |
© 2018 by the authors. Licensee MDPI, Basel, Switzerland. This article is an open access article distributed under the terms and conditions of the Creative Commons Attribution (CC BY) license (http://creativecommons.org/licenses/by/4.0/).
Share and Cite
Gonzalez-Granda, A.; Damms-Machado, A.; Basrai, M.; Bischoff, S.C. Changes in Plasma Acylcarnitine and Lysophosphatidylcholine Levels Following a High-Fructose Diet: A Targeted Metabolomics Study in Healthy Women. Nutrients 2018, 10, 1254. https://doi.org/10.3390/nu10091254
Gonzalez-Granda A, Damms-Machado A, Basrai M, Bischoff SC. Changes in Plasma Acylcarnitine and Lysophosphatidylcholine Levels Following a High-Fructose Diet: A Targeted Metabolomics Study in Healthy Women. Nutrients. 2018; 10(9):1254. https://doi.org/10.3390/nu10091254
Chicago/Turabian StyleGonzalez-Granda, Anita, Antje Damms-Machado, Maryam Basrai, and Stephan C. Bischoff. 2018. "Changes in Plasma Acylcarnitine and Lysophosphatidylcholine Levels Following a High-Fructose Diet: A Targeted Metabolomics Study in Healthy Women" Nutrients 10, no. 9: 1254. https://doi.org/10.3390/nu10091254
APA StyleGonzalez-Granda, A., Damms-Machado, A., Basrai, M., & Bischoff, S. C. (2018). Changes in Plasma Acylcarnitine and Lysophosphatidylcholine Levels Following a High-Fructose Diet: A Targeted Metabolomics Study in Healthy Women. Nutrients, 10(9), 1254. https://doi.org/10.3390/nu10091254