Biotic Supplements for Renal Patients: A Systematic Review and Meta-Analysis


Abstract
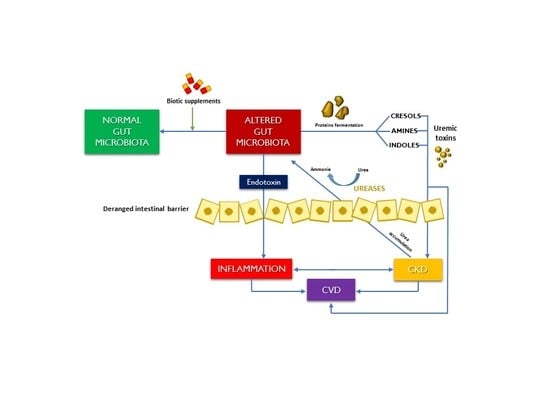
1. Introduction
2. Methods
2.1. Data Source and Search Strategy
2.2. Study Selection and Data Extraction
2.3. Data Analysis
2.4. Risk of Bias Assessment
3. Results
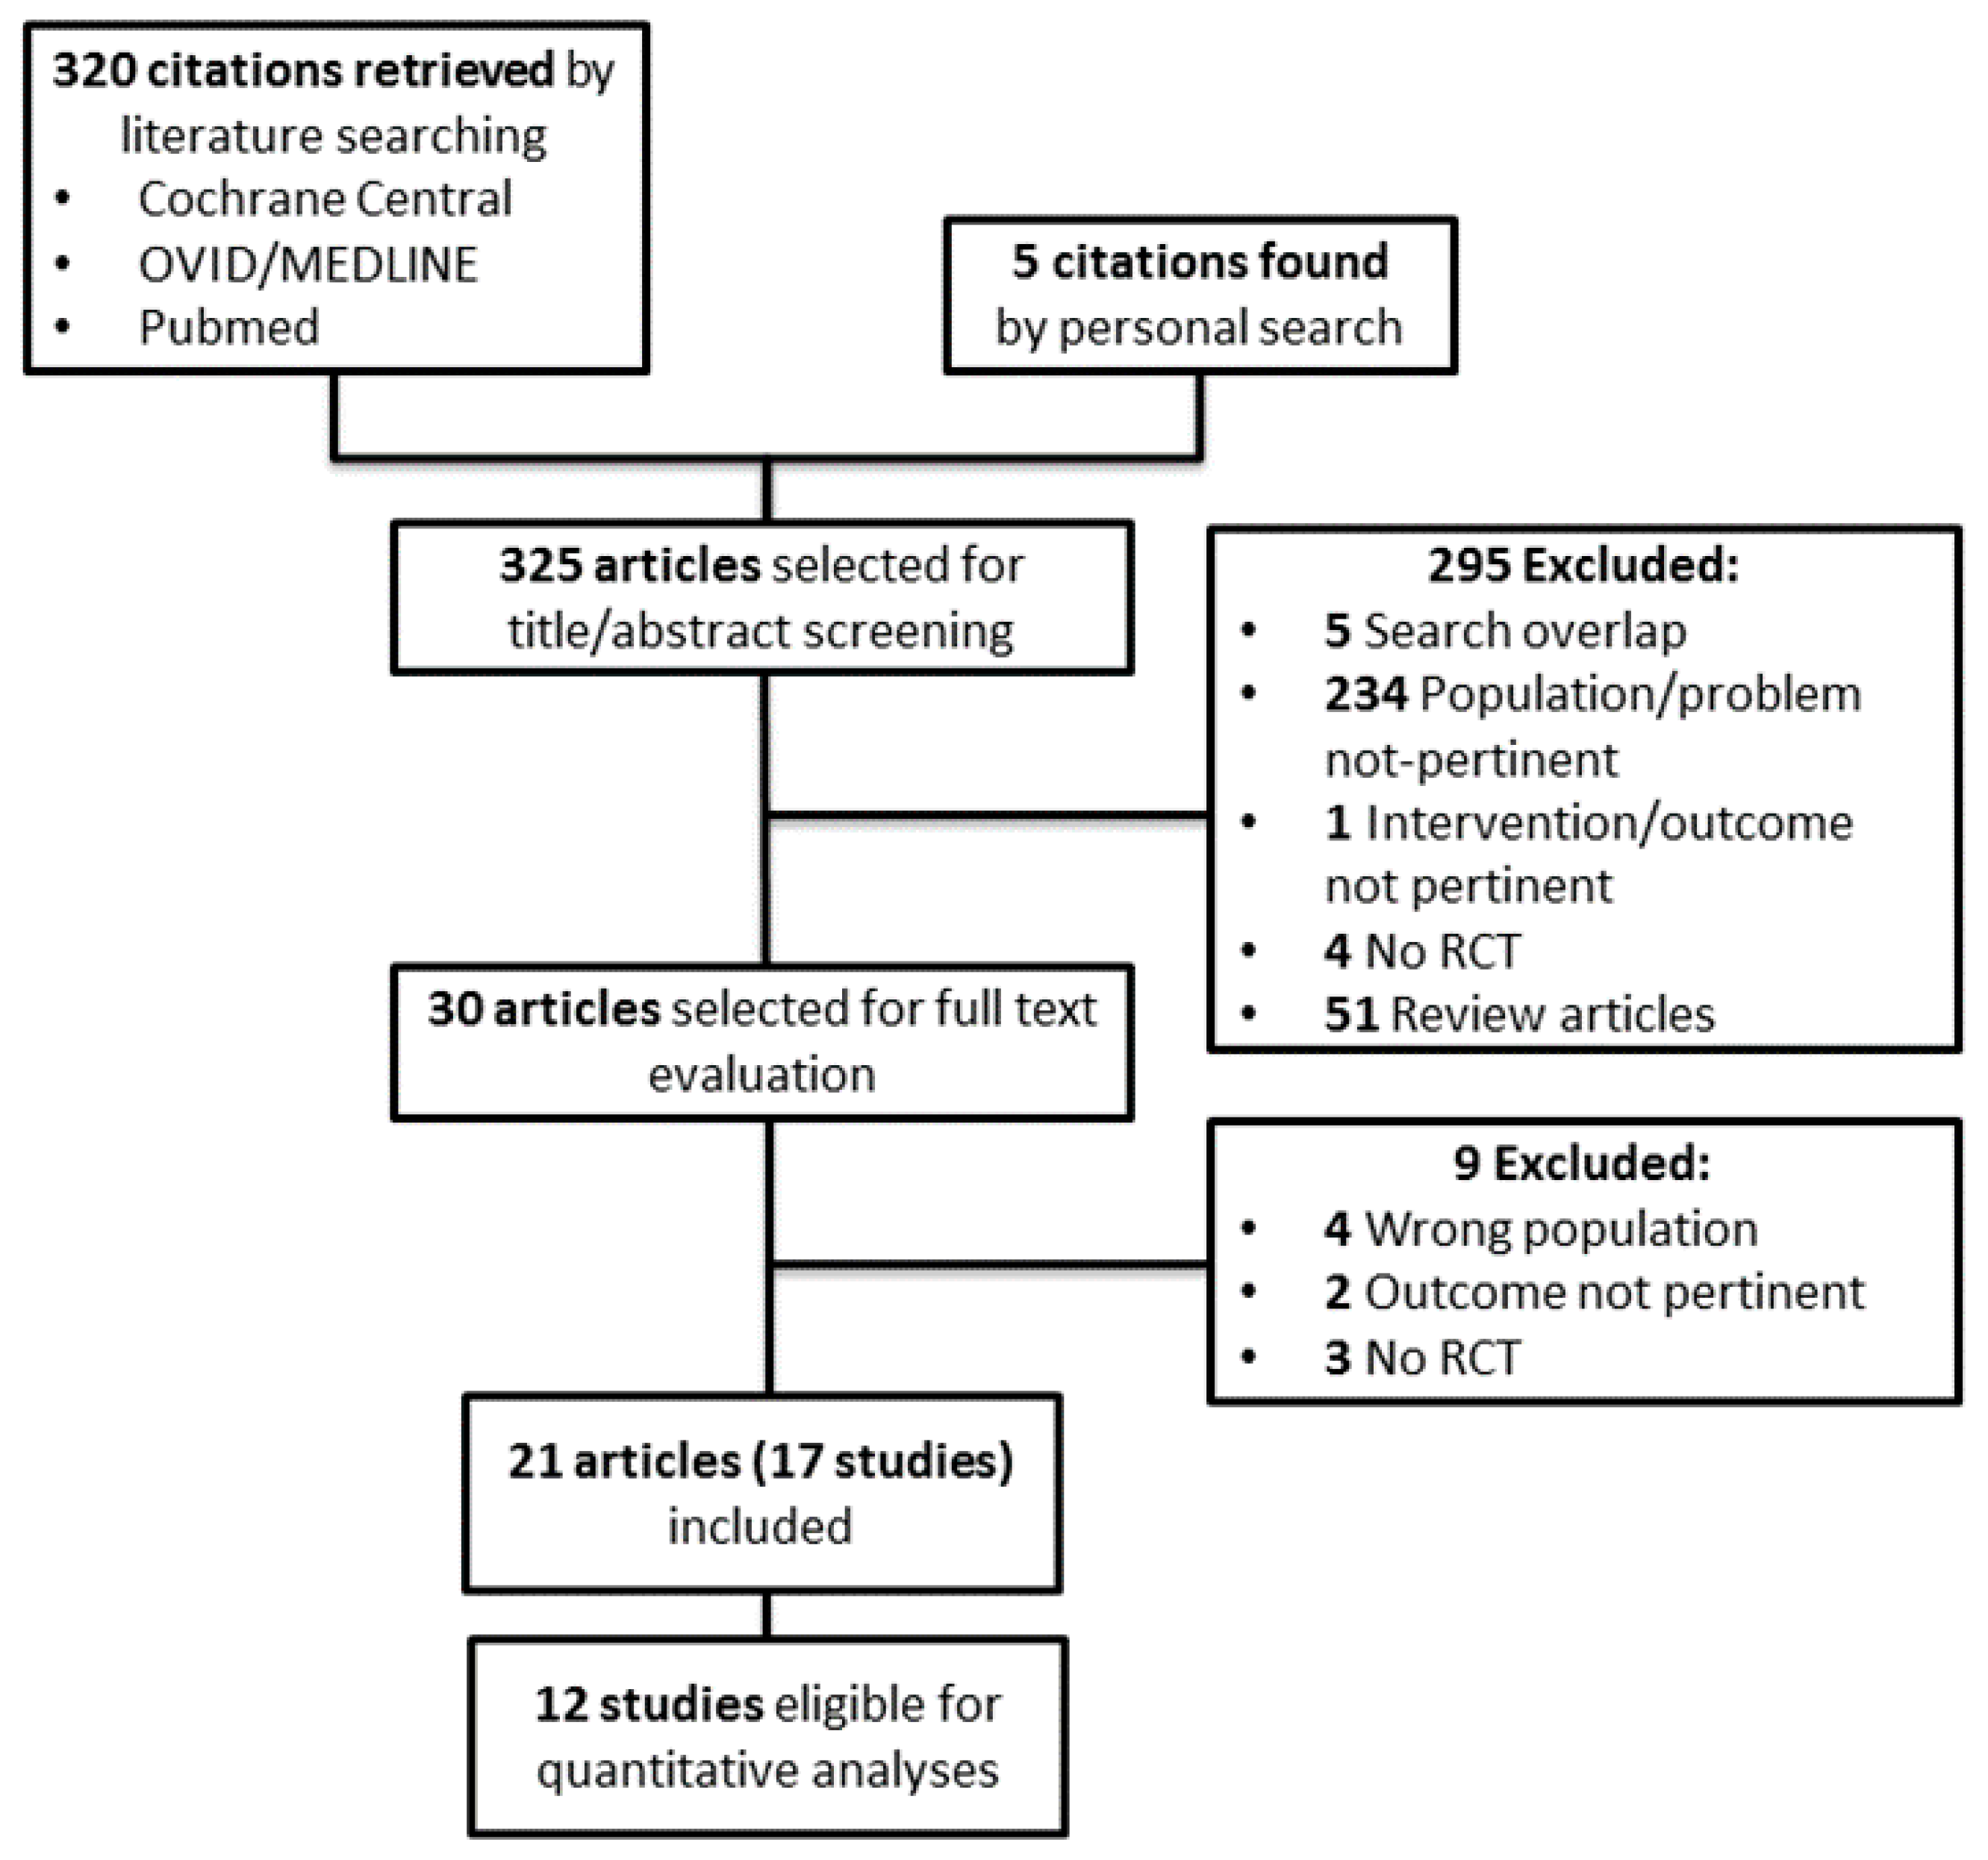
3.1. Search Results
3.2. Study Characteristics
3.3. Risk of Bias
3.4. Outcome Data
3.5. Effects of Biotic Supplements on Primary Outcomes
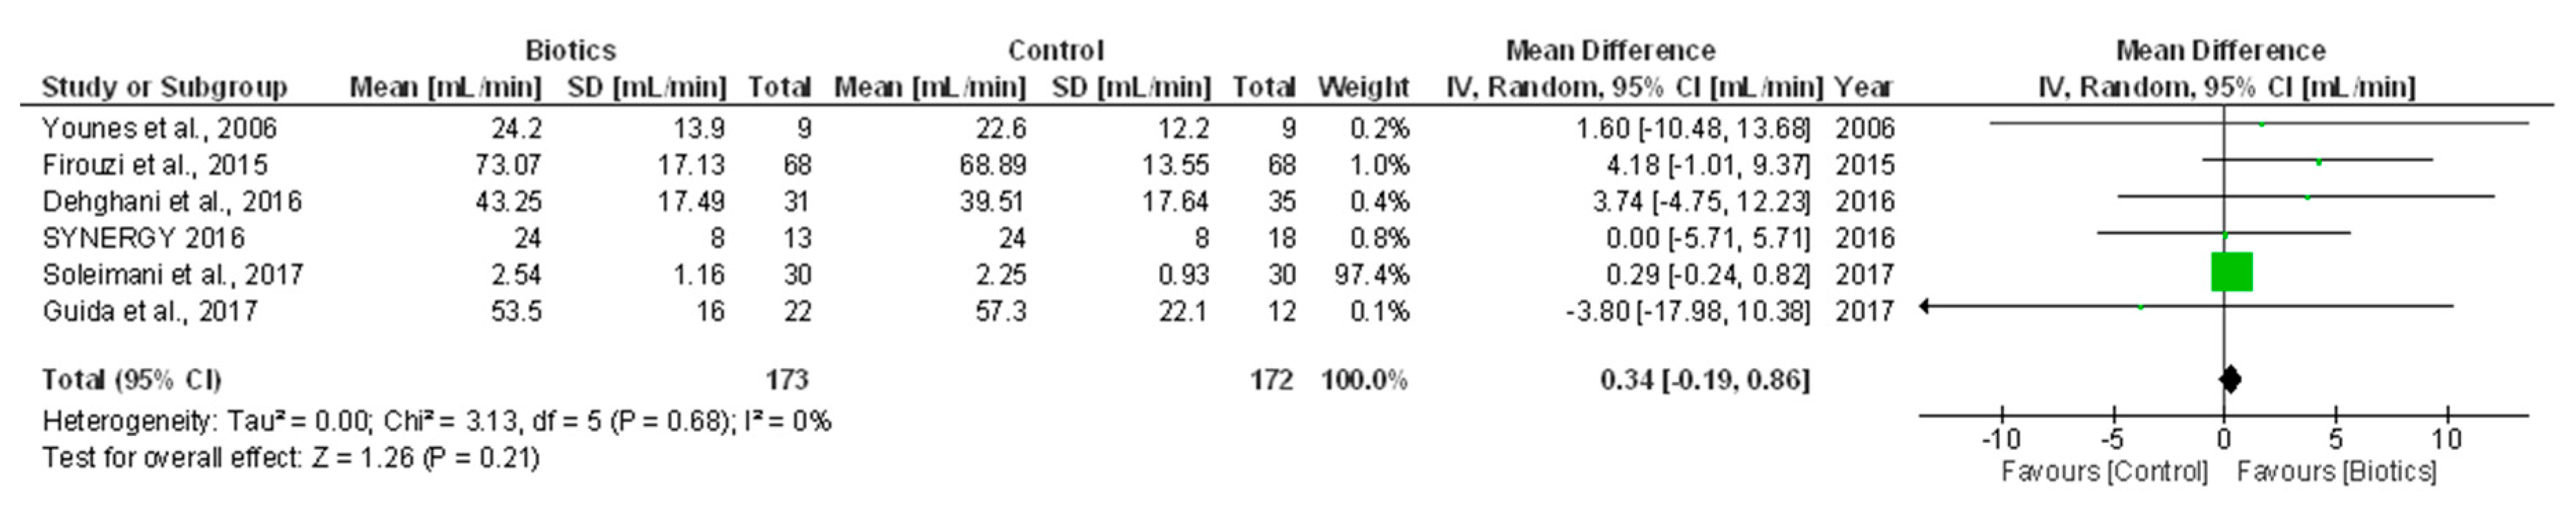
3.5.1. Renal Function (GFR/Creatinine Clearance)
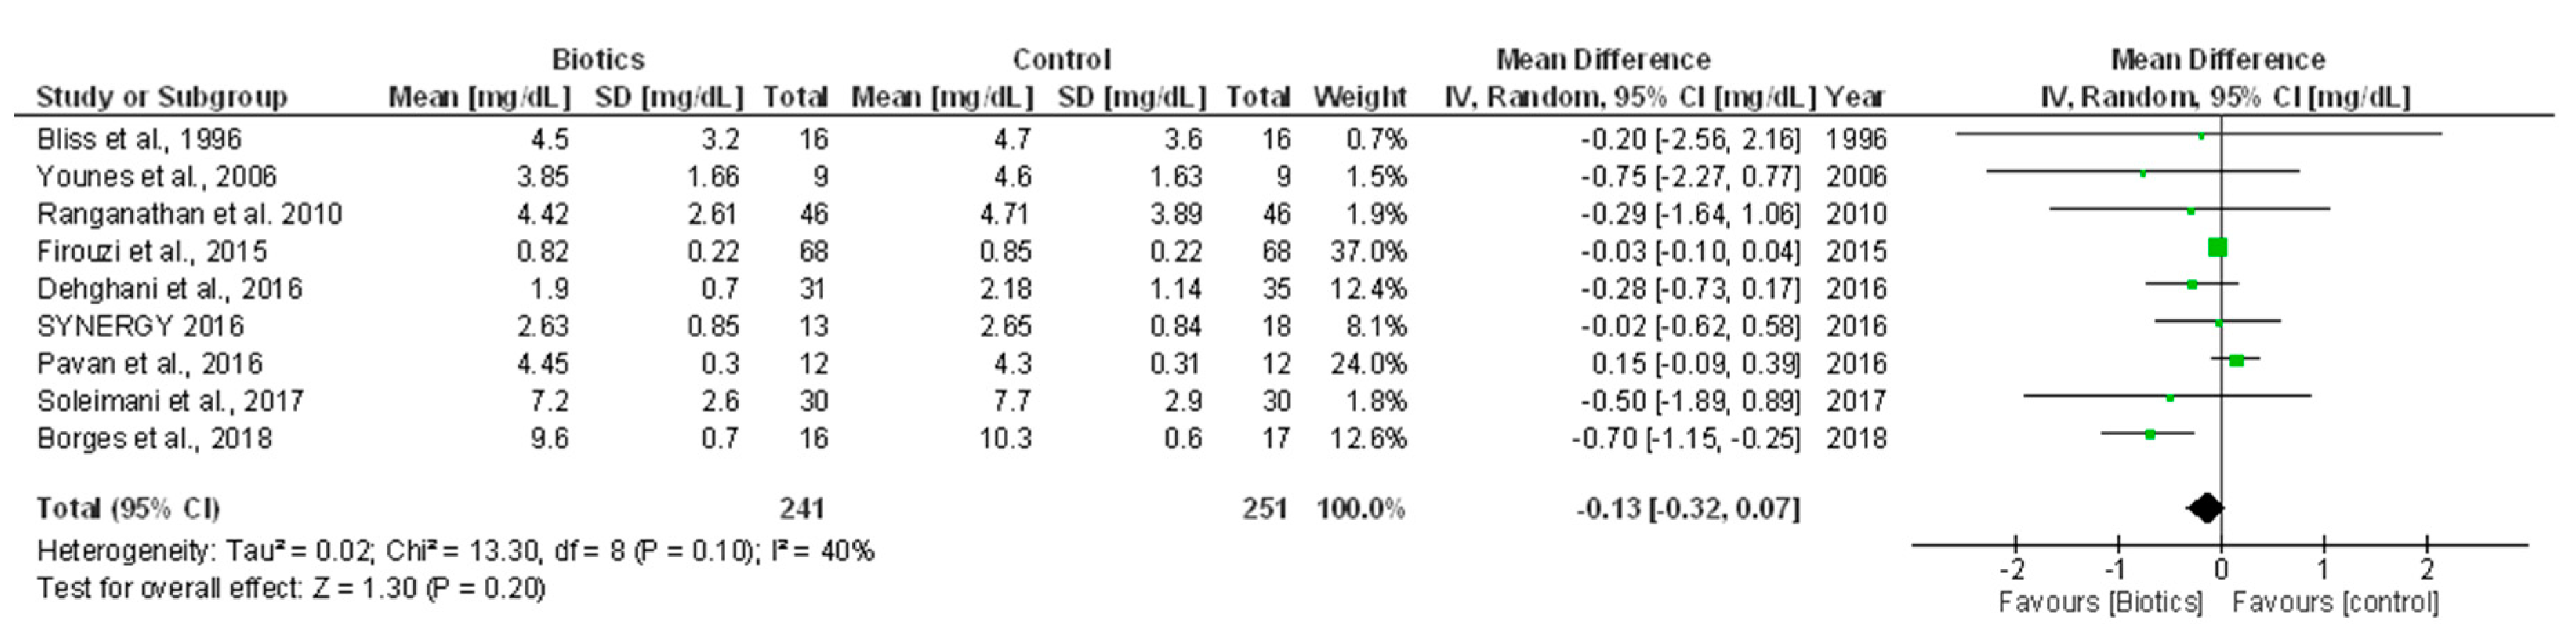
3.5.2. Serum Creatinine
3.5.3. Cardiovascular Morbidity
3.6. Effects of Biotic Supplements on Secondary Outcomes
3.6.1. Proteinuria/Albuminuria
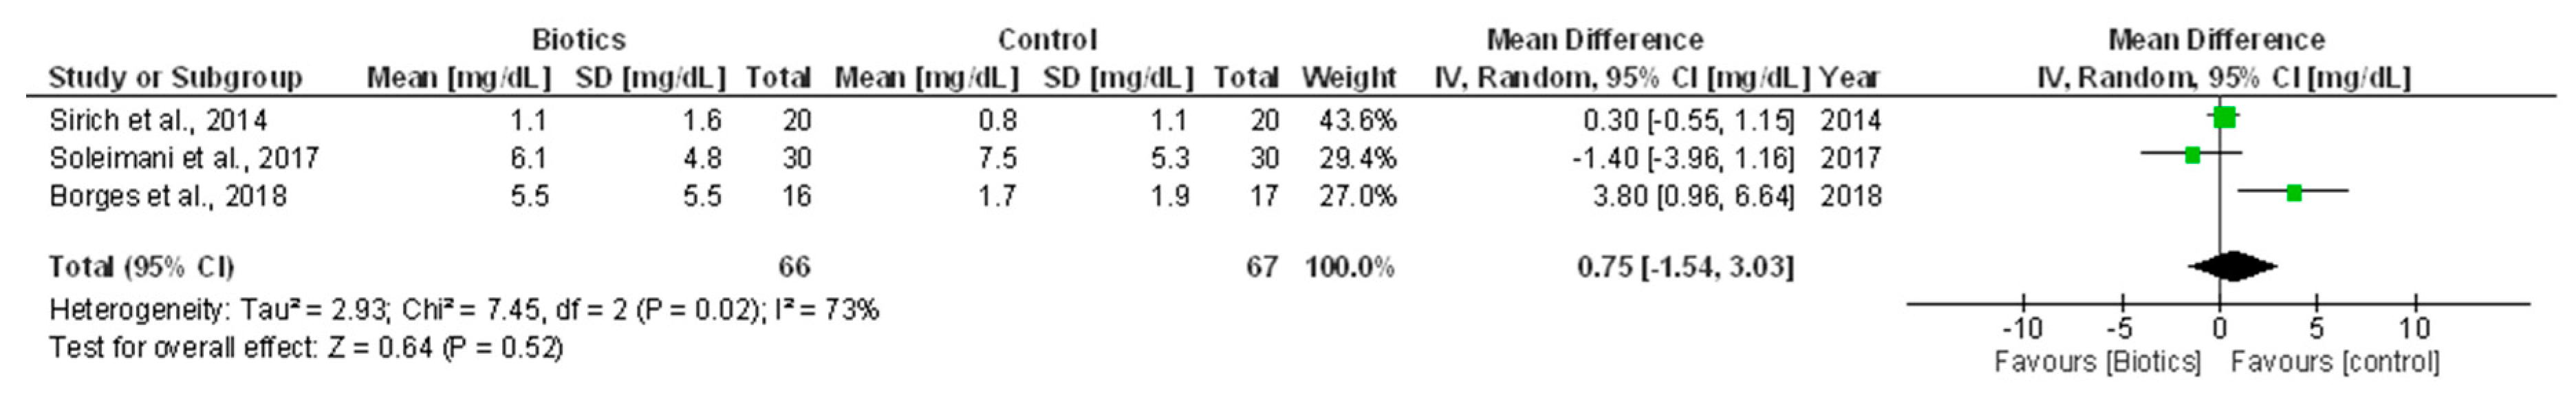
3.6.2. Inflammation Indexes
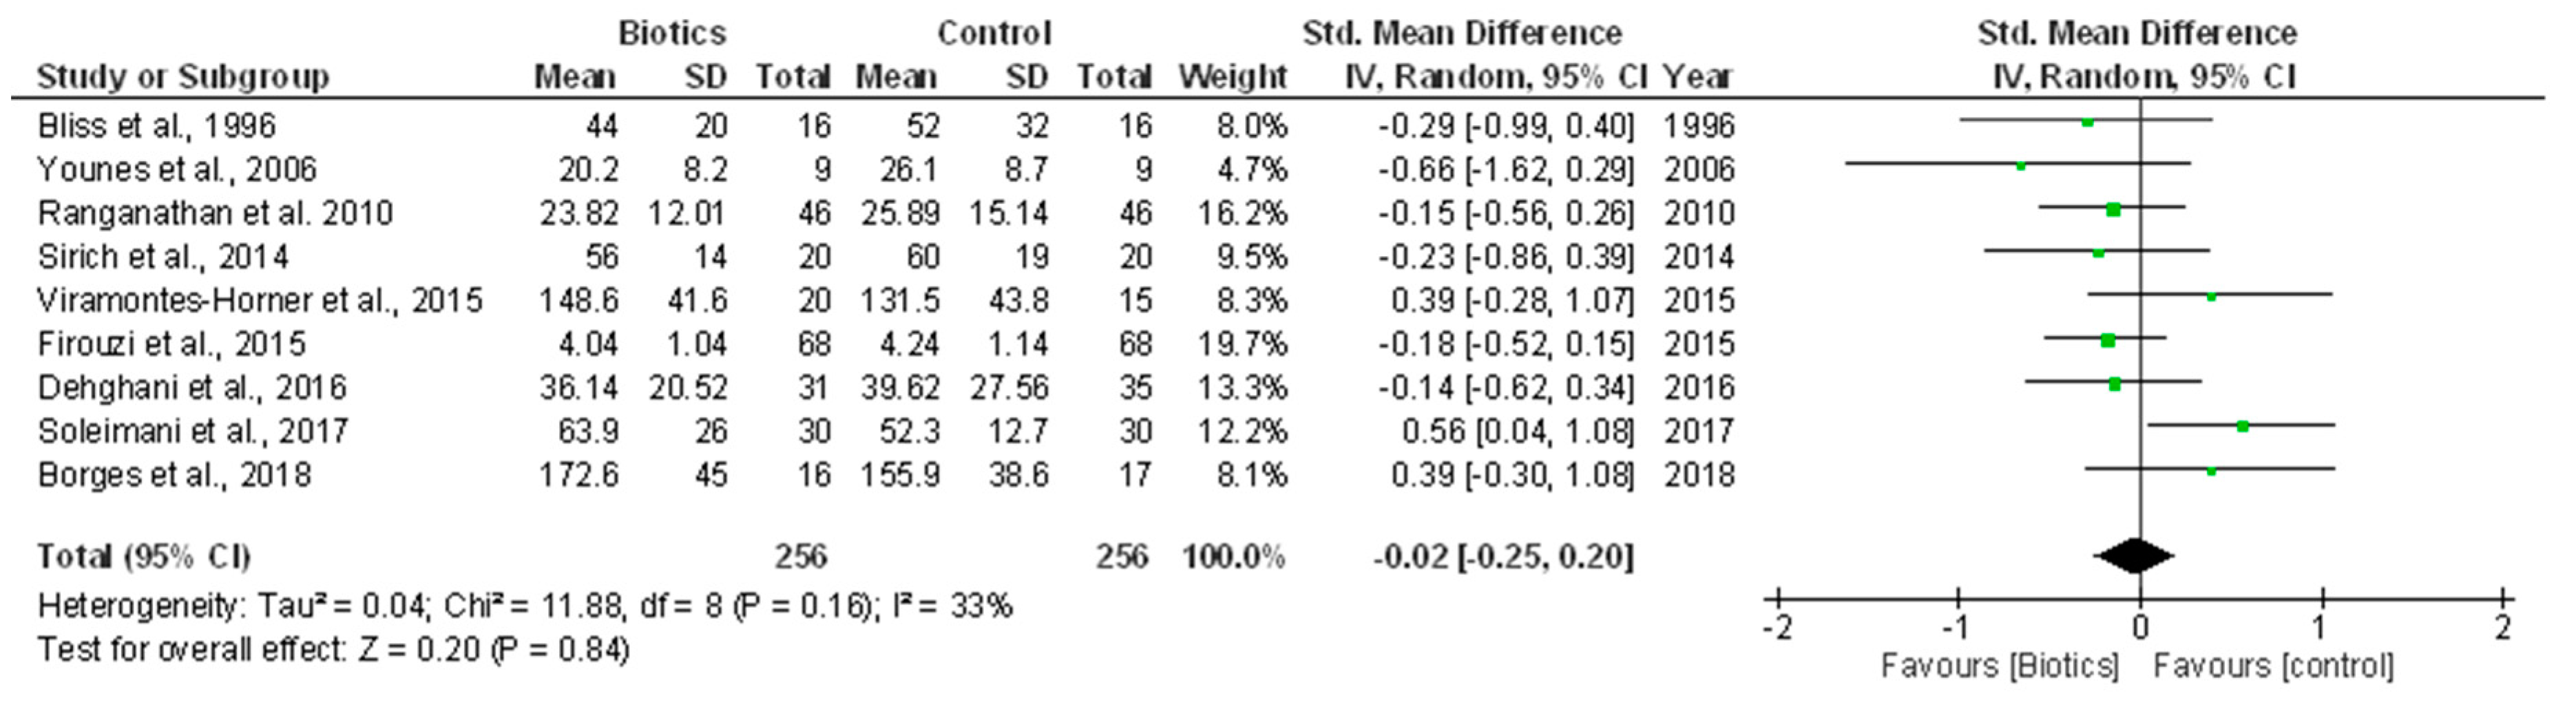
3.6.3. Urea and Other Uremic Toxins
3.6.4. Quality of Life (QoL)
3.6.5. Nutritional Status
4. Discussion
Supplementary Materials
Author Contributions
Funding
Conflicts of Interest
References
- Daliri, E.B.; Tango, C.N.; Lee, B.H.; Oh, D.H. Human microbiome restoration and safety. Int. J. Med. Microbiol. 2018, 308, 487–497. [Google Scholar] [CrossRef] [PubMed]
- Yang, T.; Richards, E.M.; Pepine, C.J.; Raizada, M.K. The gut microbiota and the brain-gut-kidney axis in hypertension and chronic kidney disease. Nat. Rev. Nephrol. 2018, 14, 442–456. [Google Scholar] [CrossRef] [PubMed]
- Kanbay, M.; Onal, E.M.; Afsar, B.; Dagel, T.; Yerlikaya, A.; Covic, A.; Vaziri, N.D. The crosstalk of gut microbiota and chronic kidney disease: Role of inflammation, proteinuria, hypertension, and diabetes mellitus. Int. Urol. Nephrol. 2018, 50, 1453–1466. [Google Scholar] [CrossRef] [PubMed]
- Briskey, D.; Tucker, P.; Johnson, D.W.; Coombes, J.S. The role of the gastrointestinal tract and microbiota on uremic toxins and chronic kidney disease development. Clin. Exp. Nephrol. 2017, 21, 7–15. [Google Scholar] [CrossRef] [PubMed]
- Dehghani, H.; Heidari, F.; Mozaffari-Khosravi, H.; Nouri-Majelan, N.; Dehghani, A. Synbiotic supplementations for azotemia in patients with chronic kidney disease: A randomized controlled trial. Iran. J. Kidney Dis. 2016, 10, 351–357. [Google Scholar] [PubMed]
- Soleimani, A.; Zarrati Mojarrad, M.; Bahmani, F.; Taghizadeh, M.; Ramezani, M.; Tajabadi-Ebrahimi, M.; Jafari, P.; Esmaillzadeh, A.; Asemi, Z. Probiotic supplementation in diabetic hemodialysis patients has beneficial metabolic effects. Kidney Int. 2017, 91, 435–442. [Google Scholar] [CrossRef] [PubMed]
- Firouzi, S.; Mohd-Yusof, B.N.; Majid, H.A.; Ismail, A.; Kamaruddin, N.A. Effect of microbial cell preparation on renal profile and liver function among type 2 diabetics: A randomized controlled trial. BMC Complement. Altern. Med. 2015, 15, 433. [Google Scholar] [CrossRef] [PubMed]
- Moher, D.; Liberati, A.; Tetzlaff, J.; Altman, D.G. Preferred reporting items for systematic reviews and meta-analyses: The prisma statement. PLoS Med. 2009, 6, e1000097. [Google Scholar] [CrossRef] [PubMed]
- National Kidney Foundation. K/doqi clinical practice guidelines for chronic kidney disease: Evaluation, classification, and stratification. Am. J. Kidney Dis. 2002, 39, S1–S266. [Google Scholar]
- Bliss, D.Z.; Stein, T.P.; Schleifer, C.R.; Settle, R.G. Supplementation with gum arabic fiber increases fecal nitrogen excretion and lowers serum urea nitrogen concentration in chronic renal failure patients consuming a low-protein diet. Am. J. Clin. Nutr. 1996, 63, 392–398. [Google Scholar] [CrossRef] [PubMed]
- Younes, H.; Egret, N.; Hadj-Abdelkader, M.; Remesy, C.; Demigne, C.; Gueret, C.; Deteix, P.; Alphonse, J.C. Fermentable carbohydrate supplementation alters nitrogen excretion in chronic renal failure. J. Ren. Nutr. 2006, 16, 67–74. [Google Scholar] [CrossRef] [PubMed]
- Ranganathan, N.; Ranganathan, P.; Friedman, E.; Joseph, A.; Delano, B.; Goldfarb, D.; Tam, P.; Rao, A.; Anteyi, E.; Musso, C. Pilot study of probiotic dietary supplementation for promoting healthy kidney function in patients with chronic kidney disease. Adv. Ther. 2010, 27, 634–647. [Google Scholar] [CrossRef] [PubMed]
- Guida, B.; Germano, R.; Trio, R.; Russo, D.; Memoli, B.; Grumetto, L.; Barbato, F.; Cataldi, M. Effect of short-term synbiotic treatment on plasma p-cresol levels in patients with chronic renal failure: A randomized clinical trial. Nutr. Metab. Cardiovasc. Dis. 2014, 24, 1043–1049. [Google Scholar] [CrossRef] [PubMed]
- Natarajan, R.; Pechenyak, B.; Vyas, U.; Ranganathan, P.; Weinberg, A.; Liang, P.; Mallappallil, M.C.; Norin, A.J.; Friedman, E.A.; Saggi, S.J. Randomized controlled trial of strain-specific probiotic formulation (renadyl) in dialysis patients. Biomed. Res. Int. 2014, 2014, 568571. [Google Scholar] [CrossRef] [PubMed]
- Sirich, T.L.; Plummer, N.S.; Gardner, C.D.; Hostetter, T.H.; Meyer, T.W. Effect of increasing dietary fiber on plasma levels of colon-derived solutes in hemodialysis patients. Clin. J. Am. Soc. Nephrol. 2014, 9, 1603–1610. [Google Scholar] [CrossRef] [PubMed]
- Viramontes-Horner, D.; Marquez-Sandoval, F.; Martin-del-Campo, F.; Vizmanos-Lamotte, B.; Sandoval-Rodriguez, A.; Armendariz-Borunda, J.; Garcia-Bejarano, H.; Renoirte-Lopez, K.; Garcia-Garcia, G. Effect of a symbiotic gel (lactobacillus acidophilus + bifidobacterium lactis + inulin) on presence and severity of gastrointestinal symptoms in hemodialysis patients. J. Ren. Nutr. 2015, 25, 284–291. [Google Scholar] [CrossRef] [PubMed]
- Wang, I.; Wu, Y.; Yang, Y.; Ting, I.; Lin, C.; Yen, T.; Chen, J.; Wang, C.; Huang, C.; Lin, H. The effect of probiotics on serum levels of cytokine and endotoxin in peritoneal dialysis patients: A randomised, double-blind, placebo-controlled trial. Benef. Microbes 2015, 6, 423–430. [Google Scholar] [CrossRef] [PubMed]
- Pavan, M. Influence of prebiotic and probiotic supplementation on the progression of chronic kidney disease. Minerva Urol. Nefrol. 2016, 68, 222–226. [Google Scholar] [PubMed]
- Poesen, R.; Evenepoel, P.; de Loor, H.; Delcour, J.A.; Courtin, C.M.; Kuypers, D.; Augustijns, P.; Verbeke, K.; Meijers, B. The influence of prebiotic arabinoxylan oligosaccharides on microbiota derived uremic retention solutes in patients with chronic kidney disease: A randomized controlled trial. PLoS One 2016, 11, e0153893. [Google Scholar] [CrossRef] [PubMed]
- Rossi, M.; Johnson, D.W.; Morrison, M.; Pascoe, E.M.; Coombes, J.S.; Forbes, J.M.; Szeto, C.C.; McWhinney, B.C.; Ungerer, J.P.; Campbell, K.L. Synbiotics easing renal failure by improving gut microbiology (synergy): A randomized trial. Clin. J. Am. Soc. Nephrol. 2016, 11, 223–231. [Google Scholar] [CrossRef] [PubMed]
- Rossi, M.; Johnson, D.; Morrison, M.; Pascoe, E.; Coombes, J.; Forbes, J.; Szeto, C.-C.; McWhinney, B.; Ungerer, J.; Campbell, K. Pre & probiotic therapy in chronic kidney disease: A randomised controlled trial. Rev. Esp. Nutr. Hum. Diet. 2016, 20, 449. [Google Scholar]
- Rossi, M.; Johnson, D.W.; Morrison, M.; Pascoe, E.; Coombes, J.S.; Forbes, J.M.; McWhinney, B.C.; Ungerer, J.P.; Dimeski, G.; Campbell, K.L. Synbiotics easing renal failure by improving gut microbiology (synergy): A protocol of placebo-controlled randomised cross-over trial. BMC Nephrol. 2014, 15, 106. [Google Scholar] [CrossRef] [PubMed]
- B, G. Effect of a short-course treatment with synbiotics on plasma p-cresol concentration in kidney transplant recipients. J. Am. Coll. Nutr. 2017, 36, 586–591. [Google Scholar]
- Miraghajani, M.; Zaghian, N.; Dehkohneh, A.; Mirlohi, M.; Ghiasvand, R. Probiotic soy milk consumption and renal function among type 2 diabetic patients with nephropathy: A randomized controlled clinical trial. Probiotics Antimicrob. Proteins 2017, 1–9. [Google Scholar] [CrossRef] [PubMed]
- Borges, N.A.; Carmo, F.L.; Stockler-Pinto, M.B.; de Brito, J.S.; Dolenga, C.J.; Ferreira, D.C.; Nakao, L.S.; Rosado, A.; Fouque, D.; Mafra, D. Probiotic supplementation in chronic kidney disease: A double-blind, randomized, placebo-controlled trial. J. Ren. Nutr. 2018, 28, 28–36. [Google Scholar] [CrossRef] [PubMed]
- Jakobsson, H.E.; Jernberg, C.; Andersson, A.F.; Sjolund-Karlsson, M.; Jansson, J.K.; Engstrand, L. Short-term antibiotic treatment has differing long-term impacts on the human throat and gut microbiome. PLoS ONE 2010, 5, e9836. [Google Scholar] [CrossRef] [PubMed]
- Kalantar-Zadeh, K.; Kopple, J.D.; Deepak, S.; Block, D.; Block, G. Food intake characteristics of hemodialysis patients as obtained by food frequency questionnaire. J. Ren. Nutr. 2002, 12, 17–31. [Google Scholar] [CrossRef] [PubMed]
- Goraya, N.; Wesson, D.E. Dietary management of chronic kidney disease: Protein restriction and beyond. Curr. Opin. Nephrol. Hypertens. 2012, 21, 635–640. [Google Scholar] [CrossRef] [PubMed]
- Kang, J.Y. The gastrointestinal tract in uremia. Dig. Dis. Sci. 1993, 38, 257–268. [Google Scholar] [CrossRef] [PubMed]
- Noel, S.; Martina-Lingua, M.N.; Bandapalle, S.; Pluznick, J.; Hamad, A.R.; Peterson, D.A.; Rabb, H. Intestinal microbiota-kidney cross talk in acute kidney injury and chronic kidney disease. Nephron. Clin. Pract. 2014, 127, 139–143. [Google Scholar] [CrossRef] [PubMed]
- Lin, C.J.; Chen, H.H.; Pan, C.F.; Chuang, C.K.; Wang, T.J.; Sun, F.J.; Wu, C.J. P-cresylsulfate and indoxyl sulfate level at different stages of chronic kidney disease. J. Clin. Lab. Anal. 2011, 25, 191–197. [Google Scholar] [CrossRef] [PubMed]
- Aronov, P.A.; Luo, F.J.; Plummer, N.S.; Quan, Z.; Holmes, S.; Hostetter, T.H.; Meyer, T.W. Colonic contribution to uremic solutes. J. Am. Soc. Nephrol. 2011, 22, 1769–1776. [Google Scholar] [CrossRef] [PubMed]
- Mafra, D.; Lobo, J.C.; Barros, A.F.; Koppe, L.; Vaziri, N.D.; Fouque, D. Role of altered intestinal microbiota in systemic inflammation and cardiovascular disease in chronic kidney disease. Future Microbiol. 2014, 9, 399–410. [Google Scholar] [CrossRef] [PubMed]
- Meijers, B.K.; De Preter, V.; Verbeke, K.; Vanrenterghem, Y.; Evenepoel, P. P-cresyl sulfate serum concentrations in haemodialysis patients are reduced by the prebiotic oligofructose-enriched inulin. Nephrol. Dial. Transplant. 2010, 25, 219–224. [Google Scholar] [CrossRef] [PubMed]
- Miranda Alatriste, P.V.; Urbina Arronte, R.; Gomez Espinosa, C.O.; Espinosa Cuevas Mde, L. Effect of probiotics on human blood urea levels in patients with chronic renal failure. Nutr. Hosp. 2014, 29, 582–590. [Google Scholar] [PubMed]
- Nakabayashi, I.; Nakamura, M.; Kawakami, K.; Ohta, T.; Kato, I.; Uchida, K.; Yoshida, M. Effects of synbiotic treatment on serum level of p-cresol in haemodialysis patients: A preliminary study. Nephrol. Dial. Transplant 2011, 26, 1094–1098. [Google Scholar] [CrossRef] [PubMed]
- Miyazaki, T.; Ise, M.; Hirata, M.; Endo, K.; Ito, Y.; Seo, H.; Niwa, T. Indoxyl sulfate stimulates renal synthesis of transforming growth factor-beta 1 and progression of renal failure. Kidney Int. Suppl. 1997, 63, S211–S214. [Google Scholar] [PubMed]
- Wu, I.W.; Hsu, K.H.; Lee, C.C.; Sun, C.Y.; Hsu, H.J.; Tsai, C.J.; Tzen, C.Y.; Wang, Y.C.; Lin, C.Y.; Wu, M.S. P-cresyl sulphate and indoxyl sulphate predict progression of chronic kidney disease. Nephrol. Dial. Transplant. 2011, 26, 938–947. [Google Scholar] [CrossRef] [PubMed]
- Liabeuf, S.; Barreto, D.V.; Barreto, F.C.; Meert, N.; Glorieux, G.; Schepers, E.; Temmar, M.; Choukroun, G.; Vanholder, R.; Massy, Z.A.; et al. Free p-cresylsulphate is a predictor of mortality in patients at different stages of chronic kidney disease. Nephrol. Dial. Transplant. 2010, 25, 1183–1191. [Google Scholar] [CrossRef] [PubMed]
- Lin, C.J.; Liu, H.L.; Pan, C.F.; Chuang, C.K.; Jayakumar, T.; Wang, T.J.; Chen, H.H.; Wu, C.J. Indoxyl sulfate predicts cardiovascular disease and renal function deterioration in advanced chronic kidney disease. Arch. Med. Res. 2012, 43, 451–456. [Google Scholar] [CrossRef] [PubMed]
- Wu, I.W.; Hsu, K.H.; Hsu, H.J.; Lee, C.C.; Sun, C.Y.; Tsai, C.J.; Wu, M.S. Serum free p-cresyl sulfate levels predict cardiovascular and all-cause mortality in elderly hemodialysis patients-a prospective cohort study. Nephrol. Dial. Transplant. 2012, 27, 1169–1175. [Google Scholar] [CrossRef] [PubMed]
- Barreto, F.C.; Barreto, D.V.; Liabeuf, S.; Meert, N.; Glorieux, G.; Temmar, M.; Choukroun, G.; Vanholder, R.; Massy, Z.A.; European Uremic Toxin Work, G. Serum indoxyl sulfate is associated with vascular disease and mortality in chronic kidney disease patients. Clin. J. Am. Soc. Nephrol. 2009, 4, 1551–1558. [Google Scholar] [CrossRef] [PubMed]
- Bammens, B.; Evenepoel, P.; Keuleers, H.; Verbeke, K.; Vanrenterghem, Y. Free serum concentrations of the protein-bound retention solute p-cresol predict mortality in hemodialysis patients. Kidney Int. 2006, 69, 1081–1087. [Google Scholar] [CrossRef] [PubMed]
- Krishnamurthy, V.M.; Wei, G.; Baird, B.C.; Murtaugh, M.; Chonchol, M.B.; Raphael, K.L.; Greene, T.; Beddhu, S. High dietary fiber intake is associated with decreased inflammation and all-cause mortality in patients with chronic kidney disease. Kidney Int. 2012, 81, 300–306. [Google Scholar] [CrossRef] [PubMed]
- Vanholder, R.; Glorieux, G. The intestine and the kidneys: A bad marriage can be hazardous. Clin. Kidney J. 2015, 8, 168–179. [Google Scholar] [CrossRef] [PubMed]
- Terawaki, H.; Yokoyama, K.; Yamada, Y.; Maruyama, Y.; Iida, R.; Hanaoka, K.; Yamamoto, H.; Obata, T.; Hosoya, T. Low-grade endotoxemia contributes to chronic inflammation in hemodialysis patients: Examination with a novel lipopolysaccharide detection method. Ther. Apher. Dial. 2010, 14, 477–482. [Google Scholar] [CrossRef] [PubMed]
- Hauser, A.B.; Stinghen, A.E.; Goncalves, S.M.; Bucharles, S.; Pecoits-Filho, R. A gut feeling on endotoxemia: Causes and consequences in chronic kidney disease. Nephron. Clin. Pract. 2011, 118, c165–c172; discussion c172. [Google Scholar] [CrossRef] [PubMed]
- McIntyre, C.W.; Harrison, L.E.; Eldehni, M.T.; Jefferies, H.J.; Szeto, C.C.; John, S.G.; Sigrist, M.K.; Burton, J.O.; Hothi, D.; Korsheed, S.; et al. Circulating endotoxemia: A novel factor in systemic inflammation and cardiovascular disease in chronic kidney disease. Clin. J. Am. Soc. Nephrol. 2011, 6, 133–141. [Google Scholar] [CrossRef] [PubMed]
- Feroze, U.; Kalantar-Zadeh, K.; Sterling, K.A.; Molnar, M.Z.; Noori, N.; Benner, D.; Shah, V.; Dwivedi, R.; Becker, K.; Kovesdy, C.P.; et al. Examining associations of circulating endotoxin with nutritional status, inflammation, and mortality in hemodialysis patients. J. Ren. Nutr. 2012, 22, 317–326. [Google Scholar] [CrossRef] [PubMed]
- Alvarenga Borges, N.; Elias Farage, N.; Faria Barros, A.; Carvalho Ferreira, D.; Fouque, D.; Mafra, D. Synbiotic supplementation promotes improvement of chronic diarrhea of unknown etiology in patient with chronic kidney disease and provides better outcomes in dialysis. Nutr. Hosp. 2016, 33, 182–184. [Google Scholar] [CrossRef] [PubMed]


| Study, Year (ref.) | Inclusion Criteria Exclusion Criteria | Population Characteristics | Intervention | Control | Duration | Outcome(s) | Results | Notes |
|---|---|---|---|---|---|---|---|---|
| Bliss et al., 1996 [10] | CKD patients underwent low-protein diet for ≥4 months Liver diseases, HD, renal transplantation, active gastrointestinal bleeding, pregnancy or lactating | n = 16 Men (%) = 63 Urea (mg/dL) = 50 ± 6 SCr (mg/dL) = 4.4 ± 0.8 | Prebiotics (Gum arabic fiber, 25g twice/daily) (n = 16) | Placebo (n = 16) | Eight weeks | SCr (mg/dL) | End of treatment, 4.5 ± 3.2 vs. 4.7 ± 3.6 in prebiotic vs. placebo group (p = 0.12) | Single blind, cross-over Four drop-outs; per-protocol analysis performed |
| Urea (mg/dL) | End of treatment, 44 ± 20 vs. 52 ± 32 in prebiotic vs. placebo group (p < 0.05) | |||||||
| Younes et al., 2006 [11] | CKD patients underwent a restrictive protein diet (0.8g/kg/day) | n = 9 Age (year) = 67.7 ± 11.5 Men (%) = 33 Urea (mmol/L) = 25 ± 5 CrCl (mL/min) = 25 ± 5 | Prebiotics (Fermentable carbohydrate 40 g/day) (n = 9) | Standard treatment (n = 9) | 10 weeks | CrCl (mL/min) | End of treatment, 24.2 ± 13.9 vs. 22.6 ± 12.2 in prebiotic vs. control group (p > 0.05) | Open label, cross-over Prebiotic supplementation consisted of 25 g of whole-meal bread, 4.5 g inulin and 10.5 g crude potato starch |
| SCr (µmol/L) | End of treatment, 339 ± 146 vs. 357 ± 143 in prebiotic vs. control group (p > 0.05) | |||||||
| Urea (mmol/L) | End of treatment, 20.2 ± 8.2 vs. 26.1 ± 8.7 in prebiotic vs. control group (p < 0.05) | |||||||
| Ranganathan et al., 2010* [12] Ranganathan et al., 2009 | Stage 3–4 CKD patients Antibiotic treatment within 14 days before screening, drugs or alcohol dependence, HIV, liver disease, any medical, psychiatric, debilitating disease, anticoagulant therapy, pregnancy | n = 46 Age (year) = ~56 Men (%) = 67 DM (%) = 41 | Probiotics (two capsules thrice/daily) (n = 46) | Placebo (n = 46) | Six months | SCr (μmol/L) | End of treatment, 388.52±229.85 vs. 414.04±342.34 in probiotic vs. placebo group (p = 0.23) | Double blind, cross-over Each capsule (15 billion CFU) of probiotic supplementation contained L. acidophilus, B. longum and S. thermophilus Sixteen drop-outs; per-protocol analysis performed |
| BUN (µmol/L) | End of treatment, 23.82 ± 12.01 vs. 25.89 ± 15.14 in probiotic vs. placebo group (p = 0.039) | |||||||
| C-reactive protein (mg/L) (n = 13 pts) | End of treatment, mean change −5.32 ± 19.7 vs. 8.55 ± 20.1 in probiotic vs. placebo group (p = 0.24) | |||||||
| QoL | Improvement of QoL (1.54 ± 1.25) during probiotic group (p < 0.001) | |||||||
| Guida et al., 2014 [13] | Stage 3–4 CKD patients Renal transplant, severe infections and malnutrition, DM, malignancy, food intolerance, autoimmune disorders | n = 30 Age (year) = 59.5 ± 13.1 Men (%) = 87 BMI (Kg/m2) = ~27.5 eGFR (mL/min) = ~29.2 | Synbiotics (5g powder packets thrice/daily) (n = 18) | Placebo (n = 12) | Four weeks | eGFR (mL/min) | No difference between groups | Double blind Synbiotic formulation consisted of probiotic supplement (L. plantarum, 5 billion CFU, L. casei subsp. Rhamnosus, 2 billion CFU, L. gasseri, 2 billion CFU, Bifidobacterium infantis, 1 billion CFU, Bifidobacterium longum, 1 billion CFU, L. acidophilus, 1 billion CFU, L. salivarius, 1 billion CFU, L. sporogenes, 1 billion CFU and Streptococcus thermophilus, 5 billion CFU) and prebiotic inulin (2.2 g) and tapioca-resistant starch (1.3 g) |
| Total p-cresol (µg/mL) | End of treatment, 0.8 (IQR 0.3–3.7) vs. 3.9 (IQR 3.2–5.8) in synbiotic vs. placebo group (p < 0.05) | |||||||
| Ranganathan et al., 2014 [14] | HD patients HIV, liver disease, drugs or alcohol dependence, anticoagulant therapy, medical debilitating disorder, pregnancy | n = 22 Age (year) = 54 (29–79) Men (%) = 27 SBP (mmHg) = 148 DBP (mmHg) = 76 | Probiotics (two capsules /thrice daily) (n = 22) | Placebo (n = 22) | Six months | C-reactive protein (mg/L) | No difference between groups | Double blind, crossover Each capsule of probiotic formulation contained 30 billion CFU of S. thermophilus, L. acidophilus and B. longum Six drop-outs; per-protocol analysis performed |
| Total indoxyl glucuronide (mg%) | No difference between groups | |||||||
| QoL-36 score | No difference between groups | |||||||
| Sirich et al., 2014 [15] | HD patients Urea clearance >2 mL/min, active gastrointestinal disease, use of antibiotics within four weeks before study entry | n = 40 Age (year) = ~56 Men (%) = ~60 HD vintage (year) = ~4 BMI (Kg/m2) = ~29 DM (%) = ~45 | Prebiotics (resistant starch, up to two sachets/day) (n = 20) | Placebo (n = 20) | Six weeks | Urea (mg/dL) | End of treatment, 56 ± 14 vs. 60 ± 19 in prebiotic vs. placebo group (p > 0.05) | Single blind Fiber sachets contained 15 g of high-amylose corn starch (40% digestible and 60% resistant starch); placebo sachets contained 15 g of waxy corn starch Two patients in control group dropped out because of side effects; no side effects in treatment group Sixteen drop-outs (eight in each group; per-protocol analysis performed) |
| C-reactive protein (mg/dL) | End of treatment, 1.1 ± 1.6 vs. 0.8 ± 1.1 in prebiotic vs. placebo group (p > 0.05) | |||||||
| Free indoxyl sulfate (mg/dL) | End of treatment, 0.25 ± 0.17 vs. 0.28 ± 0.15 in prebiotic vs. placebo group (p > 0.05) | |||||||
| Total indoxyl sulfate (mg/dL) | End of treatment, 2.9 ± 1.4 vs. 3.1 ± 1.2 in prebiotic vs. placebo group (p > 0.05) | |||||||
| Free p-cresol (mg/dL) | End of treatment, 0.21 ± 0.14 vs. 0.23 ± 0.14 in prebiotic vs. placebo group (p > 0.05) | |||||||
| Total p-cresol (mg/dL) | End of treatment, 2.9 ± 1.6 vs. 3.1 ± 1.4 in prebiotic vs. placebo group (p > 0.05) | |||||||
| QoL-36 score | No difference between groups | |||||||
| Firouzi et al., 2015 [7] | Type 2 diabetic, mild CKD patients Use of insulin, antibiotics and/or other medication, acute or chronic disease other than DM, hyperlipidemia and hypertension | n = 136 Age (year) = 53.5 ± 8.5 Men (%) = 52 BMI (kg/m2) = ~29 eGFR (mL/min) = ~74 Urea (mmol/L) = ~4.1 SCr (µmol/L) = ~71 | Probiotics (60 billion CFU/day) (n = 68) | Placebo (n = 68) | 12 weeks | eGFR (mL/min) | End of treatment, 73.07 ± 17.13 vs. 68.89 ± 13.55 in probiotic vs. placebo group (p = 0.15) | Double-blind Probiotic supplementation consisted of L. acidophilus, L. casei, L. lactis, Bifidobacterium bifidum, longum and infantis Higher incidence of side effects in probiotic (8.7%) than control group (3.7%) Thirty-five drop outs; (15 in placebo and 20 in probiotic group); ITT and per-protocol analyses performed |
| SCr (µmol/L) | End of treatment, 72.26 ± 19.73 vs. 75.17 ± 18.93 in probiotic vs. placebo group (p = 0.3) | |||||||
| Urea (mmol/L) | End of treatment, 4.04 ± 1.04 vs. 4.24 ± 1.14 in probiotic vs. placebo group (p < 0.05) | |||||||
| Viramontes-Horner et al., 2015 [16] | HD patients, three times/week, for at least three months Current use of probiotics for other reasons, omega-3 fatty acids, pentoxifylline, immunosuppressive and nonsteroidal anti-inflammatory drugs, cancer, HF, chronic liver diseases, intestinal malabsorption and active infection, previous renal transplant | n = 35 Age (year) = ~40 Men (%) = ~76.5 HD vintage (year) = ~5 BMI (Kg/m2) = ~23.5 DM (%) = ~70 HTN (%) = ~50 SCr (mg/dL) = ~10.5 | Synbiotics (11 million CFU/day + 2.31g inulin) (n = 20) | Placebo (n = 15) | Eight weeks | SCr (mg/dL) | End of treatment, 11.4 (IQR 9.9–13.0) vs. 10.4 (IQR 9.0–13.2) in synbiotic vs. placebo group (p > 0.05) | Double blind Synbiotic formulation consisted of probiotic supplement (L. acidophilus and Bifidobacterium lactis) and prebiotic inulin (2.31 g), omega-3 fatty acids and complex B-vitamins (1.5 g) Patients underwent nutritional counselling consisting of energy (30–35 kcal/kg/day) and protein (1.1–1.2 g/kg/day) intakes and potassium, phosphorus, sodium restriction Seven drop-outs; per-protocol analysis performed |
| Urea (mg/dL) | End of treatment, 148.6 ± 41.6 vs. 131.5 ± 43.8 in synbiotic vs. placebo group (p > 0.05) | |||||||
| C-reactive protein (mg/dL) | End of treatment, 6.3 (IQR 1.8–11.3) vs. 5.0 (IQR 0.6–9.9) in synbiotic vs. placebo group (p > 0.05) | |||||||
| TNF-α (pg/mL) | End of treatment, 2.9 (IQR 0.9–6.7) vs. 3.1 (IQR 0.0–3.7) in synbiotic vs. placebo group (p > 0.05) | |||||||
| IL-6 (pg/mL) | End of treatment, 2.0 (IQR 1.2–3.9) vs. 0.6 (IQR 0.2–3.6) in synbiotic vs. placebo group (p > 0.05) | |||||||
| Nutritional status (SGA) | End of treatment, 1/20 vs. 4/15 had mild to moderate malnutrition in synbiotic vs. placebo group (p > 0.05) End of treatment, 19/20 vs. 11/15 were well nourished in synbiotic vs. placebo group (p > 0.05) | |||||||
| Wang et al., 2015 [17] | PD patients with eGFR <15 mL/min/1.73 m2 Infectious diseases in the previous month, autoimmune diseases, use of immunosuppressive agents or antibiotics within one month prior to enrollment, pregnancy | n = 39 Age (year) = ~52 Men (%) = ~46 PD vintage (mo) = ~42 BMI (Kg/m2) = ~23 DM (%) = ~21 HTN (%) = ~81.3 CAD (%) = ~21 SCr (mg/dL) = ~12.5 Urea (mg/dL) = ~58 | Probiotics (4 billion CFU/day) (n = 21) | Placebo (n = 18) | Six months | CrCl (mL/min/1.73 m2) | End of treatment, 1.59 (IQR 0.85–2.93) vs. 1.24 (IQR 0.50–2.74) in probiotic vs. placebo group (p > 0.05) | Double blind One capsule of probiotics consisted of 1 billion CFU per bacterium strain (Bifidobacterium bifidum, catenulatum, longum and L. plantarum) Eight drop-outs; per protocol analysis performed |
| SCr (mg/dL) | End of treatment, 11.76 (IQR 9.55–13.86) vs. 12.84 (IQR 11.84–14.23) in probiotic vs. placebo group (p > 0.05) | |||||||
| Urea (mg/dL) | End of treatment, 57.0 (IQR 50.0–63.0) vs. 55.5 (IQR 48.0–71.0) in probiotic vs. placebo group (p > 0.05) | |||||||
| TNF-α (pg/mL) | End of treatment, 0.74 (IQR 0.41–1.29) vs. 0.74 (IQR 0.18–2.22) in probiotic vs. placebo group (p > 0.05) | |||||||
| IFN-γ (pg/mL) | End of treatment, 7 (IQR 4–12) vs. 8.67 (IQR 2–18.66) in probiotic vs. placebo group (p > 0.05) | |||||||
| IL-5 (pg/mL) | End of treatment, 9.19 (IQR 7.68–12.61) vs. 9.6 (IQR 7.99–12.6) in probiotic vs. placebo group (p > 0.05) | |||||||
| IL-6 (pg/mL) | End of treatment, 1.12 (IQR 0.75–3.93) vs. 0.95 (IQR 0.11–1.7) in probiotic vs. placebo group (p > 0.05) | |||||||
| IL-10 (pg/mL) | End of treatment, 15.97 (IQR 13.47–23.17) vs. 12.69 (IQR 10.25–20.02) in probiotic vs. placebo group (p > 0.05) | |||||||
| IL-17 (pg/mL) | End of treatment, 1.61 (IQR 0.98–2.2) vs. 2.13 (IQR 1.61–3.8) in probiotic vs. placebo group (p > 0.05) | |||||||
| Dehghani et al., 2016 [5] | Stage 3–4 CKD patients HD, use of antibiotics and lactulose two weeks before study entry, alcohol dependence, hepatitis or HIV infection, pregnancy | n = 66 Age (yr)= 61.0 ± 7.65 Men (%) = 75.8 BMI (Kg/m2) = 28.5 ± 4.1 DM (%) = 98.5 HTN (%) = 84.6 SCr (mg/dL) = ~2.1 eGFR (mL/min/1.73 m2) = ~41.4 Urea (mg/dL) = ~39 | Synbiotics (two capsules/twice daily) (n = 31) | Placebo (n = 35) | Six weeks | Non-fatal CV events | 1/31 vs. 0/35 in synbiotic vs. placebo group (p > 0.05) | Double blind Two capsules (500 mg) of synbiotic supplement consisted of seven strains of probiotics (L. casei, L. acidophilus, L. bulgarigus, L. rhamnosus, Bifidobacterium breve, longum, Streptococcus thermophilus) and prebiotic fructo-oligosaccharides Nine drop-outs; per protocol analysis performed |
| eGFR (mL/min/1.73 m2) | End of treatment, 43.25 ± 17.49 vs. 39.51 ± 17.64 in synbiotic vs. placebo group (p = 0.90) | |||||||
| SCr (mg/dL) | End of treatment, 1.90 ± 0.70 vs. 2.18 ±1 .14 in synbiotic vs. placebo group (p = 0.15) | |||||||
| Urea (mg/dL) | End of treatment, 36.14 ± 20.52 vs. 39.62 ± 27.56 in synbiotic vs. placebo group; p = 0.006 | |||||||
| Pavan et al., 2016 [18] | Stage 3–5 CKD patients not on dialysis | n = 24 Age (year) = 57.8 ± 7.11 Men (%) = 66.6 Weight (Kg) = 59.2 ± 8.1 BMI (Kg/m2) = 22±3.2 DM (%) = 62.5 HTN (%) = 16.7 SCr (mg/dL) = 4.4±0.7 | Synbiotics (three tablets/day) (n = 12) | Standard therapy (n = 12) | Six months | eGFR (mL/min/1.73 m2) | GFR declined more rapidly in control than in synbiotic group (−11.6 ± 8.6 vs. −3.4±4.6 per year) (p < 0.001) | Open label One tablet of synbiotic supplementation consisted of 15 billion CFU of each bacterium strain (Streptococcus thermophilus, L. acidophilus and Bifidobacteria longum) and 100 mg of prebiotic fructo-oligosaccharides Patients underwent low protein diet (<0.6 g/kg/day) |
| SCr (mg/dL) | End of treatment, 4.45 ± 0.30 vs. 4.3 ± 0.31 in synbiotic vs. placebo group (p > 0.05) | |||||||
| Poesen et al., 2016 [19] | CKD patients (eGFR 15–45 mL/min/1.73 m2) not on dialysis Gastro-intestinal disease, inflammatory bowel disease, malignancy, previous colorectal surgery and insulin dependent DM, use of antibiotics, prebiotics or probiotics in the previous four weeks before study entry | n = 40 Age (year) = 70 ± 6 Men (%) = 70 BMI (Kg/m2) = 28.7 ± 5 SCr (mg/dL) = 1.98 (1.60–2.18) eGFR (mL/min/1.73 m2) = 33 (27–38) Proteinuria (g/d) = 0.161 (0.078–0.498) Urea (mg/dL) = 65.5 (51.0–75.5) | Prebiotics (Arabinoxylan oligo-saccharides 10g/twice daily) (n = 23) | Placebo (n = 17) | Four weeks | Urea (mg/dL) | No difference between groups | Double blind, crossover One drop-out (nausea during prebiotic treatment); ITT analysis performed |
| p-cresol (μmol/L) | No difference between groups | |||||||
| p-cresyl glucuronide (μmol/L) | No difference between groups | |||||||
| indoxyl sulfate (μmol/L) | No difference between groups | |||||||
| trimethylamine N-oxide (μmol/L) | Treatment effect (prebiotic vs. placebo) −0.237; 95% CI −0.464, −0.010; p = 0.04) | |||||||
| phenyl-acetyl-glutamine (μmol/L) | No difference between groups | |||||||
| SYNERGY 2016* [20,21,22] | Moderate to severe (pre-HD), hypertensive CKD patients Previous renal transplant, bowel resection or bowel radiation recipient, bowel syndrome, Crohn disease or ulcerative colitis, likely to receive a transplant or progress to dialysis within six months, pre, probiotics or antibiotic use within one month, or change in immunosuppressant dose within six months before study entry | n = 31 Age (year) = 69 ± 9 Men (%) = 61 BMI (Kg/m2) = 28 ± 6 eGFR (mL/min/1.73 m2) = 25 ± 8 Proteinuria (mg/day) = 296 (168–1100) Albuminuria (mg/day) = 97 (21–677) | Synbiotic supplements (15 g powder + two capsules/day) (n = 13) | Placebo (n = 18) | 16 weeks | eGFR (mL/min/1.73 m2) | End of treatment, 24 ± 8 vs. 24 ± 8 in synbiotic vs. placebo group (p = 0.67) | Double blind, crossover Participants underwent a two week run-in period (dietary education with stable protein and fiber intakes) before randomization Synbiotic formulation consisted of 15 g prebiotic (a combination of high–molecular weight inulin, fructo-oligosaccharides and galacto-oligosaccharides) and 90 billion CFU probiotic component (capsule) including nine different strains across the Lactobacillus, Bifidobacteria and Streptococcus genera Six drop-outs; per protocol analysis performed |
| SCr (µmol/L) | End of treatment, 231 ± 75 vs. 233 ± 74 in synbiotic vs. placebo group (p = 0.94) | |||||||
| Proteinuria (mg/day) | End of treatment, 369 (IQR 162–1550) vs. 323 (IQR 169–1150) in synbiotic vs. placebo group (p = 0.20) | |||||||
| Albuminuria (mg/day) | End of treatment, 112 (IQR 16–758) vs. 111 (IQR 12–594) in synbiotic vs. placebo group (p > 0.05) | |||||||
| IL-1β (pg/mL) | End of treatment, 0.8 ± 0.7 vs. 0.8 ± 0.6 in synbiotic vs. placebo group (p = 0.98) | |||||||
| IL-6 (pg/mL) | End of treatment, 2.2 ± 0.9 vs. 2.0 ± 0.8 in synbiotic vs. placebo group (p = 0.40) | |||||||
| IL-10 (pg/mL) | End of treatment, 3.6 ± 2.0 vs. 3.6 ± 2.1 in synbiotic vs. placebo group (p = 0.84) | |||||||
| TNF-α (pg/mL) | End of treatment, 2.2 ± 0.8 vs. 2.0 ± 0.7 in synbiotic vs. placebo group (p = 0.09) | |||||||
| Free indoxyl sulfate (µmol/L) | End of treatment, 0.6 (IQR 0.4–0.8) vs. 0.5 (IQR 0.4–1.0) in synbiotic vs. placebo group (p = 0.20) | |||||||
| Total indoxyl sulfate (µmol/L) | End of treatment, 15 (IQR 10–26) vs. 16 (IQR 12–27) in synbiotic vs. placebo group (p = 0.12) | |||||||
| Free p-cresol (µmol/L) | End of treatment, 2.2 (IQR 0.7–2.8) vs. 2.4 (IQR 1.1–3.4) in synbiotic vs. placebo group (p = 0.34) | |||||||
| Total p-cresol (µmol/L) | End of treatment, 75 (IQR 36–101) vs. 93 (IQR 54–136) in synbiotic vs. placebo group (p = 0.03) | |||||||
| Physical patient-reported health score | End of treatment, 35 ± 11 vs. 37 ± 10 in synbiotic vs. placebo group (p = 0.23) | |||||||
| Mental patient-reported health score | End of treatment, 51 ± 10 vs. 52 ± 9 in synbiotic vs. placebo group (p = 0.75) | |||||||
| Guida et al., 2017 [23] | Kidney transplanted patients with stable graft function Acute rejection or infection in the previous three months, DM, malignancy, pregnancy, food intolerance, autoimmune disorders, severe malnutrition or clinical conditions requiring artificial feeding | n = 34 Age (year) = ~50.6 Men (%) = ~82.3 Weight (Kg) = ~75.6 WC (cm) = ~94.7 BMI (Kg/m2) = ~25.4 eGFR (mL/min/1.73 m2) = ~54.5 | Synbiotic supplements (three times/day) (n = 22) | Placebo (n = 12) | Four weeks | eGFR (mL/min/1.73 m2) | End of treatment, 53.5 ± 16.0 vs. 57.3 ± 22.1 in synbiotic vs. placebo group (p > 0.05) | Double blind Synbiotic (Probinul Neutro) consisted of probiotic supplement (L. plantarum, 5 billion CFU, L. casei subsp. Rhamnosus, 2 billion CFU, L. gasseri, 2 billion CFU, Bifidobacterium infantis, 1 billion CFU, B. longum, 1 Streptococcus thermophilus, 5 billion CFU) and prebiotic inulin (2.2 g) and tapioca-resistant starch (1.3 g) Two drop-outs; per protocol analysis performed |
| Total p-cresol (µg/mL) | End of treatment, 2.3 (IQR 0.9–2.72) vs. 4.4 (IQR 3.0–6.4) in synbiotic vs. placebo group; p < 0.01 | |||||||
| Miraghajani et al., 2017 [24] | Type 2 diabetic patients with early CKD (proteinuria >300 mg/day and eGFR >90 mL/min) Intolerance to soy milk, smoking, alcoholism, recent antibiotic therapy and use of supplements containing vitamins and minerals, inflammatory bowel disease, infection, liver disease and rheumatoid arthritis | n = 40 Age (year) = ~55.2 Men (%) = ~47.5 Weight (Kg) = ~71 BMI (Kg/m2) = ~26.5 | Probiotics (2 billion CFU/day) (n = 20) | Placebo (n = 20) | Eight weeks | Progranulin (ng/mL) | End of treatment, 180.90 ± 69.25 vs. 399.56 ± 105.20 in probiotic vs. control group; p = 0.01 | Double blind Participants received individualized dietary counselling (restricted dietary protein, sodium, and potassium intake) before randomization to a diet containing 200 mL/day probiotic soy milk (fortified with 20 million CFU/mL of L. plantarum) or conventional soy milk |
| Soleimani et al., 2017 [6] | Diabetic HD patients, three times/week, for at least one year Intestinal diseases, use of probiotic supplements, prebiotic, antioxidant and anti-inflammatory supplements (vitamin E, C and omega-3 fatty acids), antibiotics and immunosuppressive medications within three months before enrolment, pregnancy | n = 60 Age (year) = ~56.7 Men (%) = 66.7 Weight (Kg) = ~68.3 BMI (Kg/m2) = ~26.3 HD vintage (year)= ~3.5 HTN (%) = 96.7 SCr (mg/dL) = ~7.6 eGFR (mL/min/1.73 m2) = ~2.35 hs-CRP (ng/mL) = ~7672 Urea (mg/dL) = ~59.2 CVD (%) = ~21.6 CAD (%) = ~78.3 | Probiotics (6 billion CFU/day) (n = 30) | Placebo (n = 30) | 12 weeks | eGFR (mL/min/1.73 m2) | End of treatment, 2.54 ± 1.16 vs. 2.25 ± 0.93 in probiotic vs. placebo group (p = 0.77) | Double blind Probiotic supplementation consisted of L. acidophilus, L. casei and Bifidobacterium bifidum, 2 billion CFU/day per strain Five drop-outs; ITT analysis performed |
| SCr (mg/dL) | End of treatment, 7.2 ± 2.6 vs. 7.7 ± 2.9 in probiotic vs. placebo group (p = 0.73) | |||||||
| Urea (mg/dL) | End of treatment, 63.9 ± 26.0 vs. 52.3 ± 12.7 in probiotic vs. placebo group (p = 0.96) | |||||||
| hs-C-reactive protein (ng/mL) | End of treatment, 6110 ± 4812.5 vs. 7555.7 ± 5316.2 in probiotic vs. placebo group; p = 0.03 | |||||||
| Subjective global assessment (SGA) score | End of treatment, 8.8 ± 2.0 vs. 10.2 ± 3.7 in probiotic vs. placebo group; p = 0.01 | |||||||
| Borges et al., 2018 [25] | HD patients, three times/week, for at least six months Inflammatory and autoimmune diseases, AIDS, cancer, smokers, HD with central catheter access, pregnancy, use of catabolic drugs, antioxidant vitamin supplements, pre-, pro-, synbiotic and antibiotics in the previous three months before study entry | n = 33 Age (year) = ~52 Men (%) = ~63.6 WC (cm) = ~92 BMI (Kg/m2) = ~25.2 HD vintage (month) = ~48.3 | Probiotics (90 billion CFU/day) (n = 16) | Placebo (n = 17) | 12 weeks | SCr (mg/dL) | End of treatment, 9.6 ± 7.7 vs. 10.3 ± 0.6 in probiotic vs. placebo group (p = 0.66) | Double blind Probiotic supplementation consisted of Streptococcus thermophilus, L. acidophilus and Bifidobacteria longum Tirtheen drop-outs; per-protocol analysis performed |
| Urea pre-HD (mg/dL) | End of treatment, 172.6 ± 45.0 vs. 155.9 ± 38.6 in probiotic vs. placebo group (p = 0.37) | |||||||
| Urea post-HD (mg/dL) | End of treatment, 51.3 ± 19.7 vs. 49.5 ± 12.7 in probiotic vs. placebo group (p = 0.54) | |||||||
| C-reactive protein (mg/dL) | End of treatment, 5.5 (95% CI 2.8, 11.7) vs. 1.7 (95% CI 0.8, 6.4) in probiotic vs. placebo group (p = 0.47) | |||||||
| IL-6 (pg/mL) | End of treatment, 38.4 ± 20.1 vs. 30.3 ± 18.5 in probiotic vs. placebo group (p = 0.91) | |||||||
| Total indoxyl sulfate (mg/L) | End of treatment, 36.5 ± 15 vs. 42.5 ± 11.0 in probiotic vs. placebo group (p = 0.60) | |||||||
| Total p-cresol (mg/L) | End of treatment, 46.3 ± 32.7 vs. 57.5 ± 29.8 in probiotic vs. placebo group (p = 0.83) | |||||||
| Total indole-3 acetic-acid (µg/L) | End of treatment, 456.8 ± 199 vs. 744.9 ± 309 in probiotic vs. placebo group (p = 0.45) |
| Study, Year (ref.) | Random Sequence Generation | Allocation Concealment | Blinding of Participants and Personnel | Blinding of Outcome Assessors | Incomplete Outcome Data | Selective Reporting | Other Sources of Bias |
|---|---|---|---|---|---|---|---|
| Bliss et al., 1996 [10] | Unclear (not stated) | Low risk (“placebo and prebiotic were similar in appearance, taste and viscosity”) | High risk (single blind) | Unclear (not stated) | Low risk (four drop-outs, 20%; per-protocol analysis performed) | Low risk | None known |
| Younes et al., 2006 [11] | Unclear (not stated) | Unclear (not stated) | High risk (open label) | Unclear (not stated) | Low risk (no drop-out) | Low risk | None known |
| Ranganathan et al., 2010 [12] | Unclear (not stated) | Low risk (“placebo and probiotic were similar in color, size and visual look”) | Low risk (double blind) | Unclear (not stated) | High risk (16 drop-outs, 26%; per-protocol analysis performed) | Low risk | High risk of funding bias (“Kibow Biotech has funded publication of the article”) |
| Guida et al., 2014 [13] | Low risk (computer-generated random binary list) | Low risk (“placebo and synbiotic were comparable in color, texture and taste”) | Low risk (double blind) | Unclear (not stated) | Low risk (no drop-out) | Low risk | Low risk of funding bias (“No external funding for the study”) |
| Ranganathan et al., 2014 [14] | Unclear (not stated) | Unclear (not stated) | Low risk (double blind) | Unclear (not stated) | High risk (six drop-outs, 21%; per-protocol analysis performed) | High risk (insufficient information on uremic toxins and QoL) | High risk of funding bias (“Kibow Biotech financed the clinical investigation; part of the data was also obtained in Kibow’s own equipped research laboratories”) |
| Sirich et al., 2014 [15] | Low risk (permuted-block randomization) | Low risk (“fiber supplements and control were provided as white powder in identical sachets”) | High risk (single blind) | Unclear (not stated) | High risk (16 drop-outs, 28.5%; per-protocol analysis performed) | Low risk | High risk of funding bias (“T.L.S. was supported by a Mitsubishi Tanabe Pharma Corporation, National Kidney Foundation Fellowship for the Study of Uremia”) |
| Firouzi et al., 2015 [7] | Low risk (“computer-generated random-blocks of four and eight in order to allow having exact number of 68 in each group”) | Low risk (“probiotic and placebo sachets were identical in weight, appearance, texture, nutritional value and smell”) | Low risk (double blind) | Unclear (not stated) | High risk (35 drop-outs, 29% vs. 22%; ITT and per-protocol analyses performed) | Low risk | Low risk of funding bias (“Hexbio® B-Crobes Laboratory Sdn. Bhd. did not interfere with the decision to exploit research results”) |
| Viramontes-Horner et al., 2015 [16] | Unclear (not stated) | Low risk (“placebo and symbiotic supplement had identical color, size and flavor”) | Low risk (double blind) | Unclear (not stated) | Low risk (seven drop-outs, 16%; per-protocol analysis performed) | Low risk | High risk of funding bias (“FMC worked for Nutrimentos Inteligentes, S.A. de C.V., the funders of the study, providing methodological and statistical support”) |
| Wang et al., 2015 [17] | Low risk (computer-generated random-number table sequence) | Low risk (“allocations contained in opaque, sequentially numbered, sealed envelopes”) | Low risk (double blind) | Unclear (not stated) | Low risk (eight drop-outs, 17%; per-protocol analysis performed) | Low risk | None known |
| Dehghani et al., 2016 [5] | Unclear (not stated) | Low risk (“placebo and synbiotic produced in similar color and appearance; patients and researcher were not informed of the boxes’ codes) | Low risk (double blind) | Unclear (not stated) | Low risk (nine drop-outs, 12%; per-protocol analysis performed) | Low risk | None known |
| Pavan et al., 2016 [18] | Unclear (not stated) | Unclear (not stated) | High risk (open label) | Unclear (not stated) | Unclear (not stated) | Low risk | None known |
| Poesen et al., 2016 [19] | High risk (“randomization performed by the sealed envelope system; the study nurse randomly opened a preformed envelope containing the allocated treatment regimen”) | Low risk (“prebiotic or placebo provided in identical vials and boxes, labeled with a numerical code, unique to treatment allocation”) | Low risk (double blind) | Unclear (not stated) | Low risk (one drop-out; ITT analysis performed) | Low risk | Low risk of funding bias (“Funders had no role in study design, data collection and analysis, decision to publish or preparation of the manuscript”) |
| SYNERGY 2016 [20] | Low risk (“A computer–generated randomization list with blocks of size 2 produced by an external statistical consultant”) | Low risk (“allocation concealed to researchers and participants; supplements were packed off-site with a generic label, supplement A or B”) | Low risk (double blind) | Unclear (not stated) | Low risk (six drop-outs, 16%; per-protocol analysis performed) | Low risk | High risk of funding bias (“Study funded through a project grant from the Princess Alexandra Private Practice Trust Fund (PPTF). M.R. received the Princess Alexandra PPTF Postgraduate Scholarship”) |
| Guida et al., 2017 [23] | Low risk (“randomization, 2:1, conducted using a computer-generated random binary list,”) | Low risk (“synbiotic and placebo powders were comparable in color, texture, and taste”) | Low risk (double blind) | Unclear (not stated) | Low risk (two drop-outs, 5.5%; per-protocol analysis performed) | Low risk | None known |
| Miraghajani et al., 2017 [24] | Low risk (allocation by randomly permuted blocks) | Low risk (“concealed envelopes with consecutive numbers were locked in a drawer and withdrawn in numerical order”) | Low risk (double blind) | Low risk (“outcome’s assessors and analyses’ performers were masked to group assignment”) | Low risk (eight drop-outs, 16.6%; per-protocol analysis performed) | Low risk | High risk of funding bias (“Financial support provided by the Security Research Center, Isfahan University of Medical Sciences, Isfahan, Iran”) |
| Soleimani et al., 2017 [6] | Low risk (“randomization conducted using computer-generated random numbers”) | Unclear (not stated) | Low risk (double blind) | Unclear (not stated) | Low risk (five drop-outs, 8%; ITT analysis performed) | Low risk | None known |
| Borges et al., 2018 [25] | High risk (manually generated simple randomization) | Low risk (“participant and researcher were blinded to the contents of bottles containing placebo and probiotic capsules”) | Low risk (double blind) | Low risk (“outcome measurements performed in a blinded manner”) | High risk (13 drop-outs, 28%; per-protocol analysis performed) | Low risk | None known |
© 2018 by the authors. Licensee MDPI, Basel, Switzerland. This article is an open access article distributed under the terms and conditions of the Creative Commons Attribution (CC BY) license (http://creativecommons.org/licenses/by/4.0/).
Share and Cite
Pisano, A.; D’Arrigo, G.; Coppolino, G.; Bolignano, D. Biotic Supplements for Renal Patients: A Systematic Review and Meta-Analysis. Nutrients 2018, 10, 1224. https://doi.org/10.3390/nu10091224
Pisano A, D’Arrigo G, Coppolino G, Bolignano D. Biotic Supplements for Renal Patients: A Systematic Review and Meta-Analysis. Nutrients. 2018; 10(9):1224. https://doi.org/10.3390/nu10091224
Chicago/Turabian StylePisano, Anna, Graziella D’Arrigo, Giuseppe Coppolino, and Davide Bolignano. 2018. "Biotic Supplements for Renal Patients: A Systematic Review and Meta-Analysis" Nutrients 10, no. 9: 1224. https://doi.org/10.3390/nu10091224
APA StylePisano, A., D’Arrigo, G., Coppolino, G., & Bolignano, D. (2018). Biotic Supplements for Renal Patients: A Systematic Review and Meta-Analysis. Nutrients, 10(9), 1224. https://doi.org/10.3390/nu10091224