A Disaggregation Methodology to Estimate Intake of Added Sugars and Free Sugars: An Illustration from the UK National Diet and Nutrition Survey

Abstract
1. Introduction
- ‘Total sugars’ are defined as the total amount of sugars (mono- and disaccharides) from all food sources, without distinguishing between free and non-free sugars. The sugar declared on nutritional panels of food labels always refers to ‘total sugars’ [15].
- ‘Added sugars’ refer to sucrose, fructose, glucose, starch hydrolysates (glucose syrup, high-fructose syrup) and other isolated sugar preparations used as such, or added during food preparation and manufacturing, according to the European Food Safety Authority (EFSA) [16], and does not capture the sugars present in unsweetened fruit juice or honey [2].
- ‘Free sugars’, a term introduced by WHO, refer to all sugars that are added during food manufacturing and preparation as well as sugars that are naturally present in honey, syrups, fruit juices, and fruit concentrates [3]. In a variant to this, the UK has adapted the ‘free sugars’ definition to exclude the ‘lactose’ in milk and the sugars within the cellular structure of foods (particularly fruits and vegetables) [2], whereas this distinction is not specified by WHO [3].
- ‘Non-milk extrinsic sugars’ (NMES) is a term that has been used for some decades in the UK and includes sugars not contained within the cellular walls of plants, all sugars added to foods, and 50% of the sugars in canned, stewed, dried, or preserved fruits [17].
2. Materials and Methods
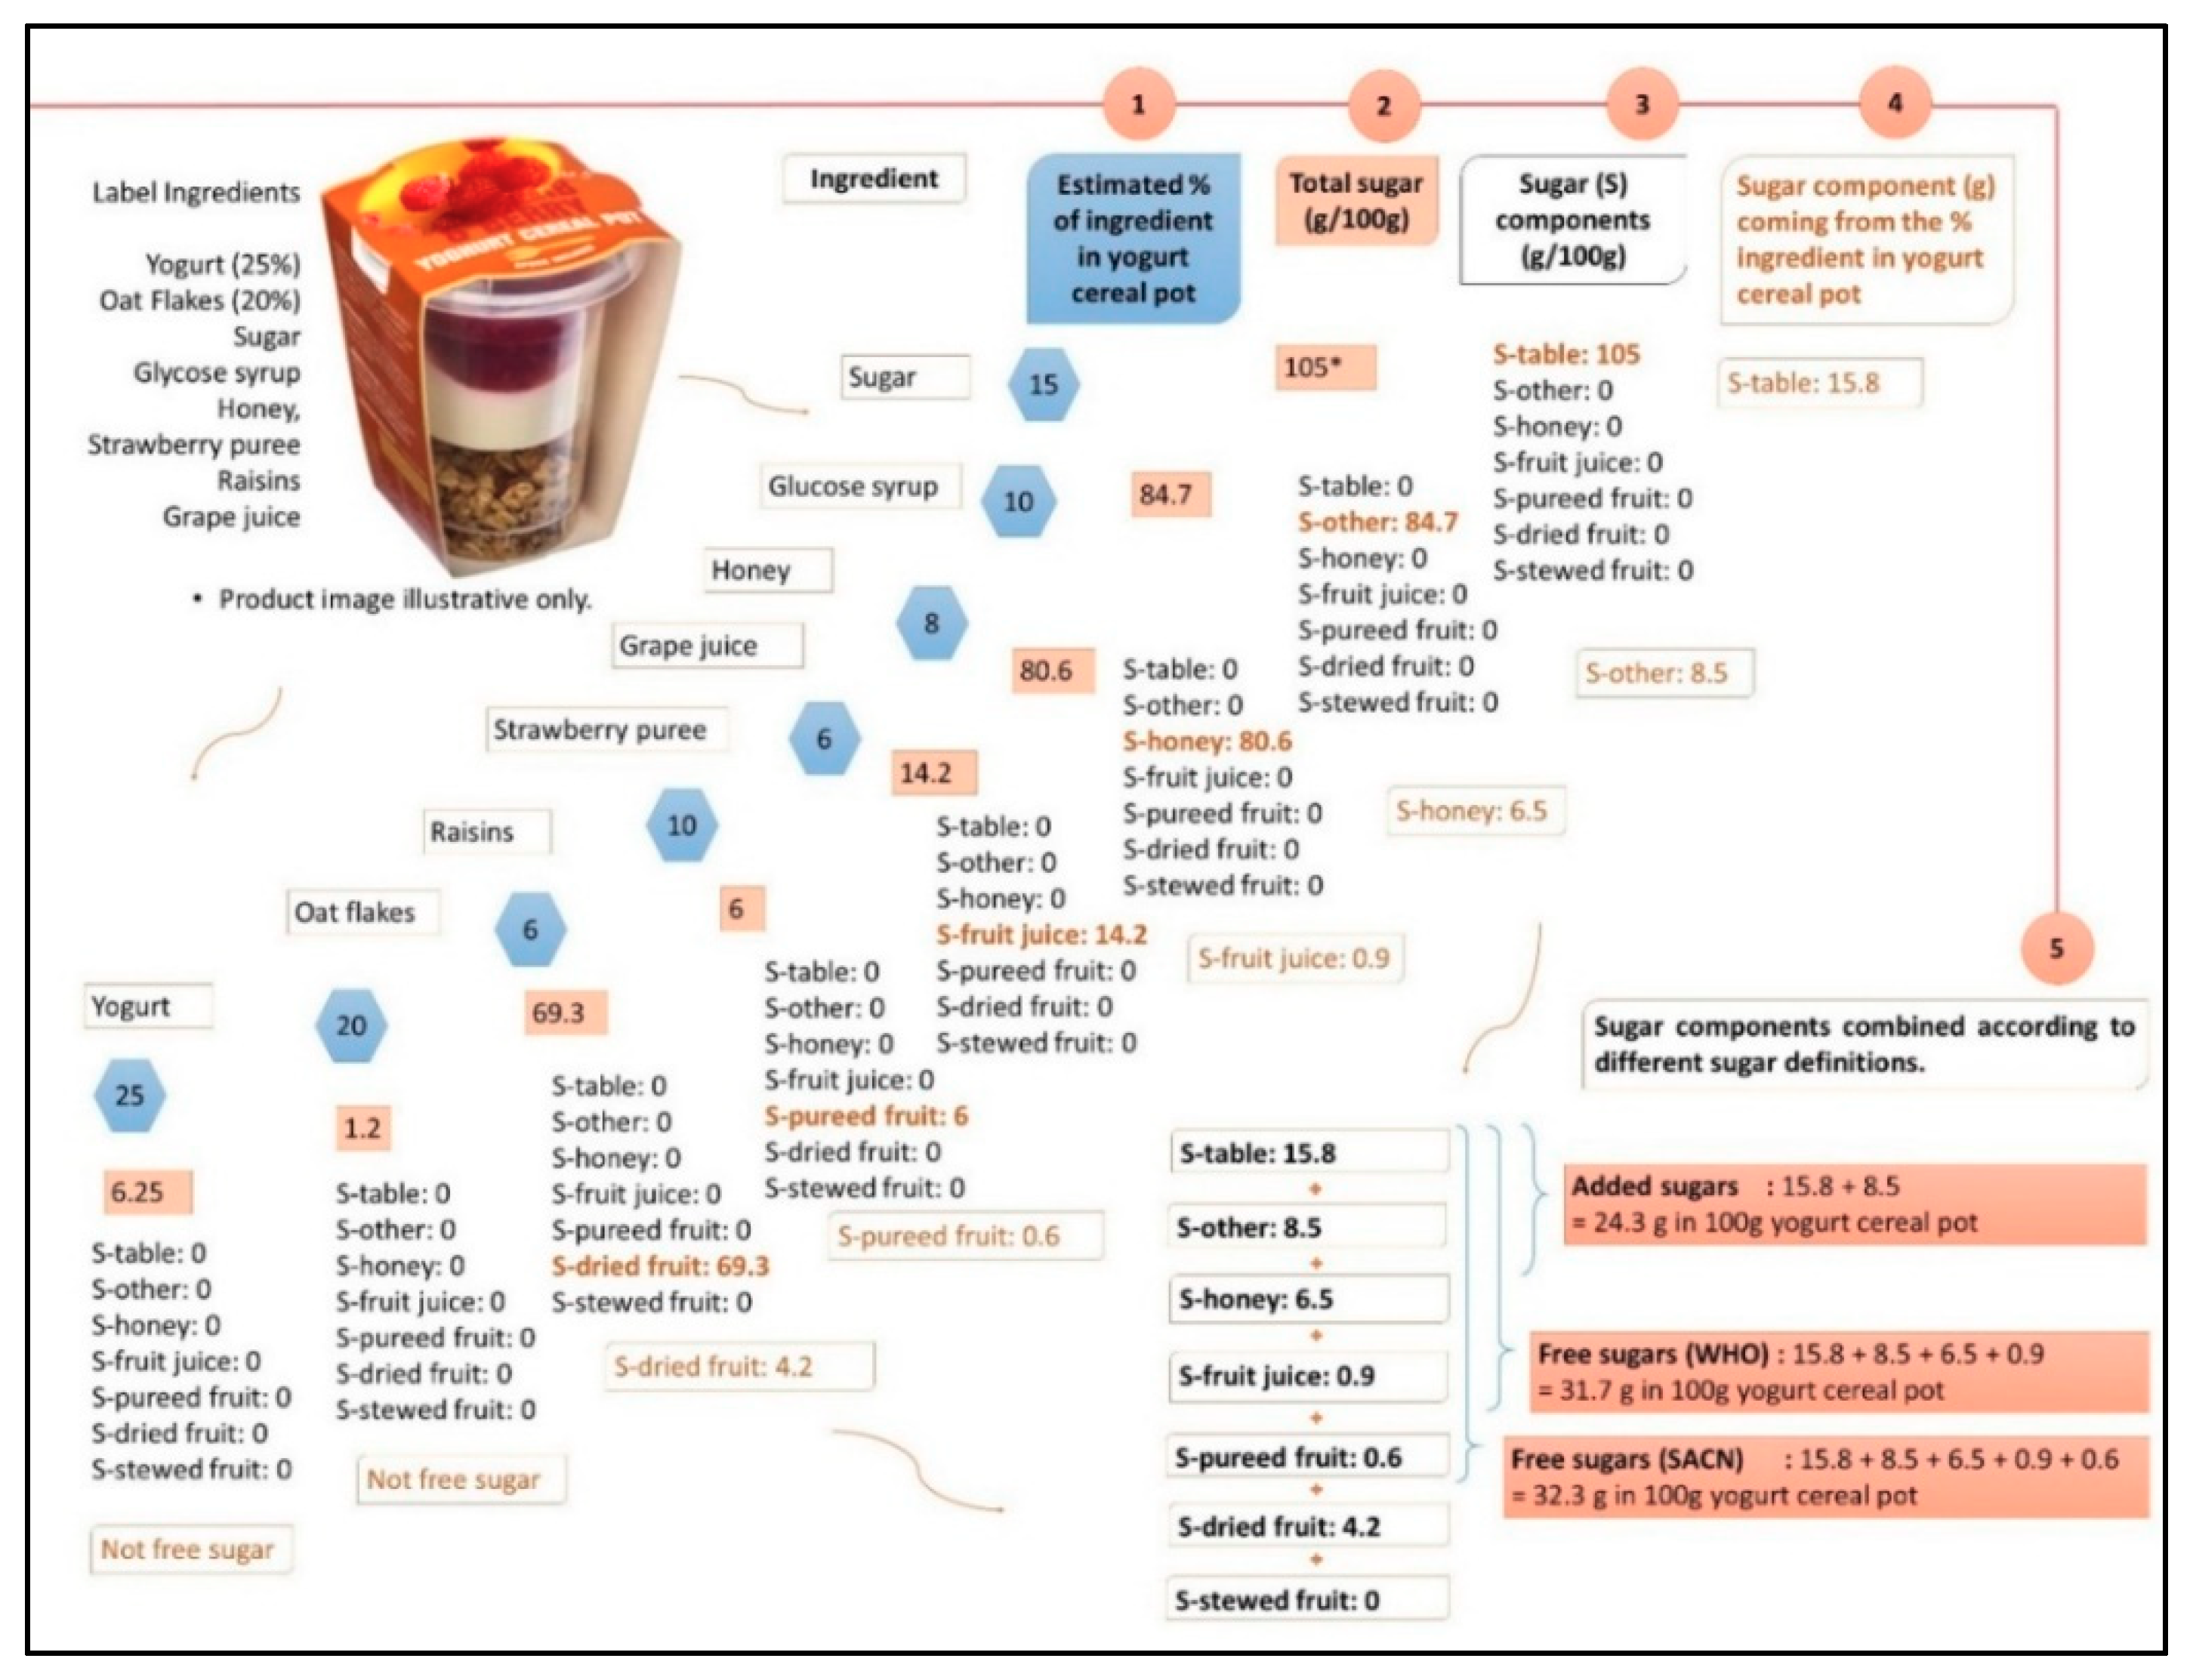
2.1. Principles of Approach
- Added sugars (EFSA): ‘Sugar-table’ + ‘Sugar-other’
- Free sugars (WHO): ‘Sugar-table’ + ‘Sugar-other’ + ‘Sugar-honey’ + ‘Sugar-fruit juice’
- Free sugars (SACN): ‘Sugar-table’ + ‘Sugar-other’ + ‘Sugar-honey’ + ‘Sugar-fruit juice’ + ‘Sugar-pureed fruit’
- NMES: ‘Sugar-table’ + ‘Sugar-other’ + ‘Sugar-honey’ + ‘Sugar-fruit juice’ + 50% of ‘Sugar-stewed fruit’ + 50% of ‘Sugar-dried fruit’
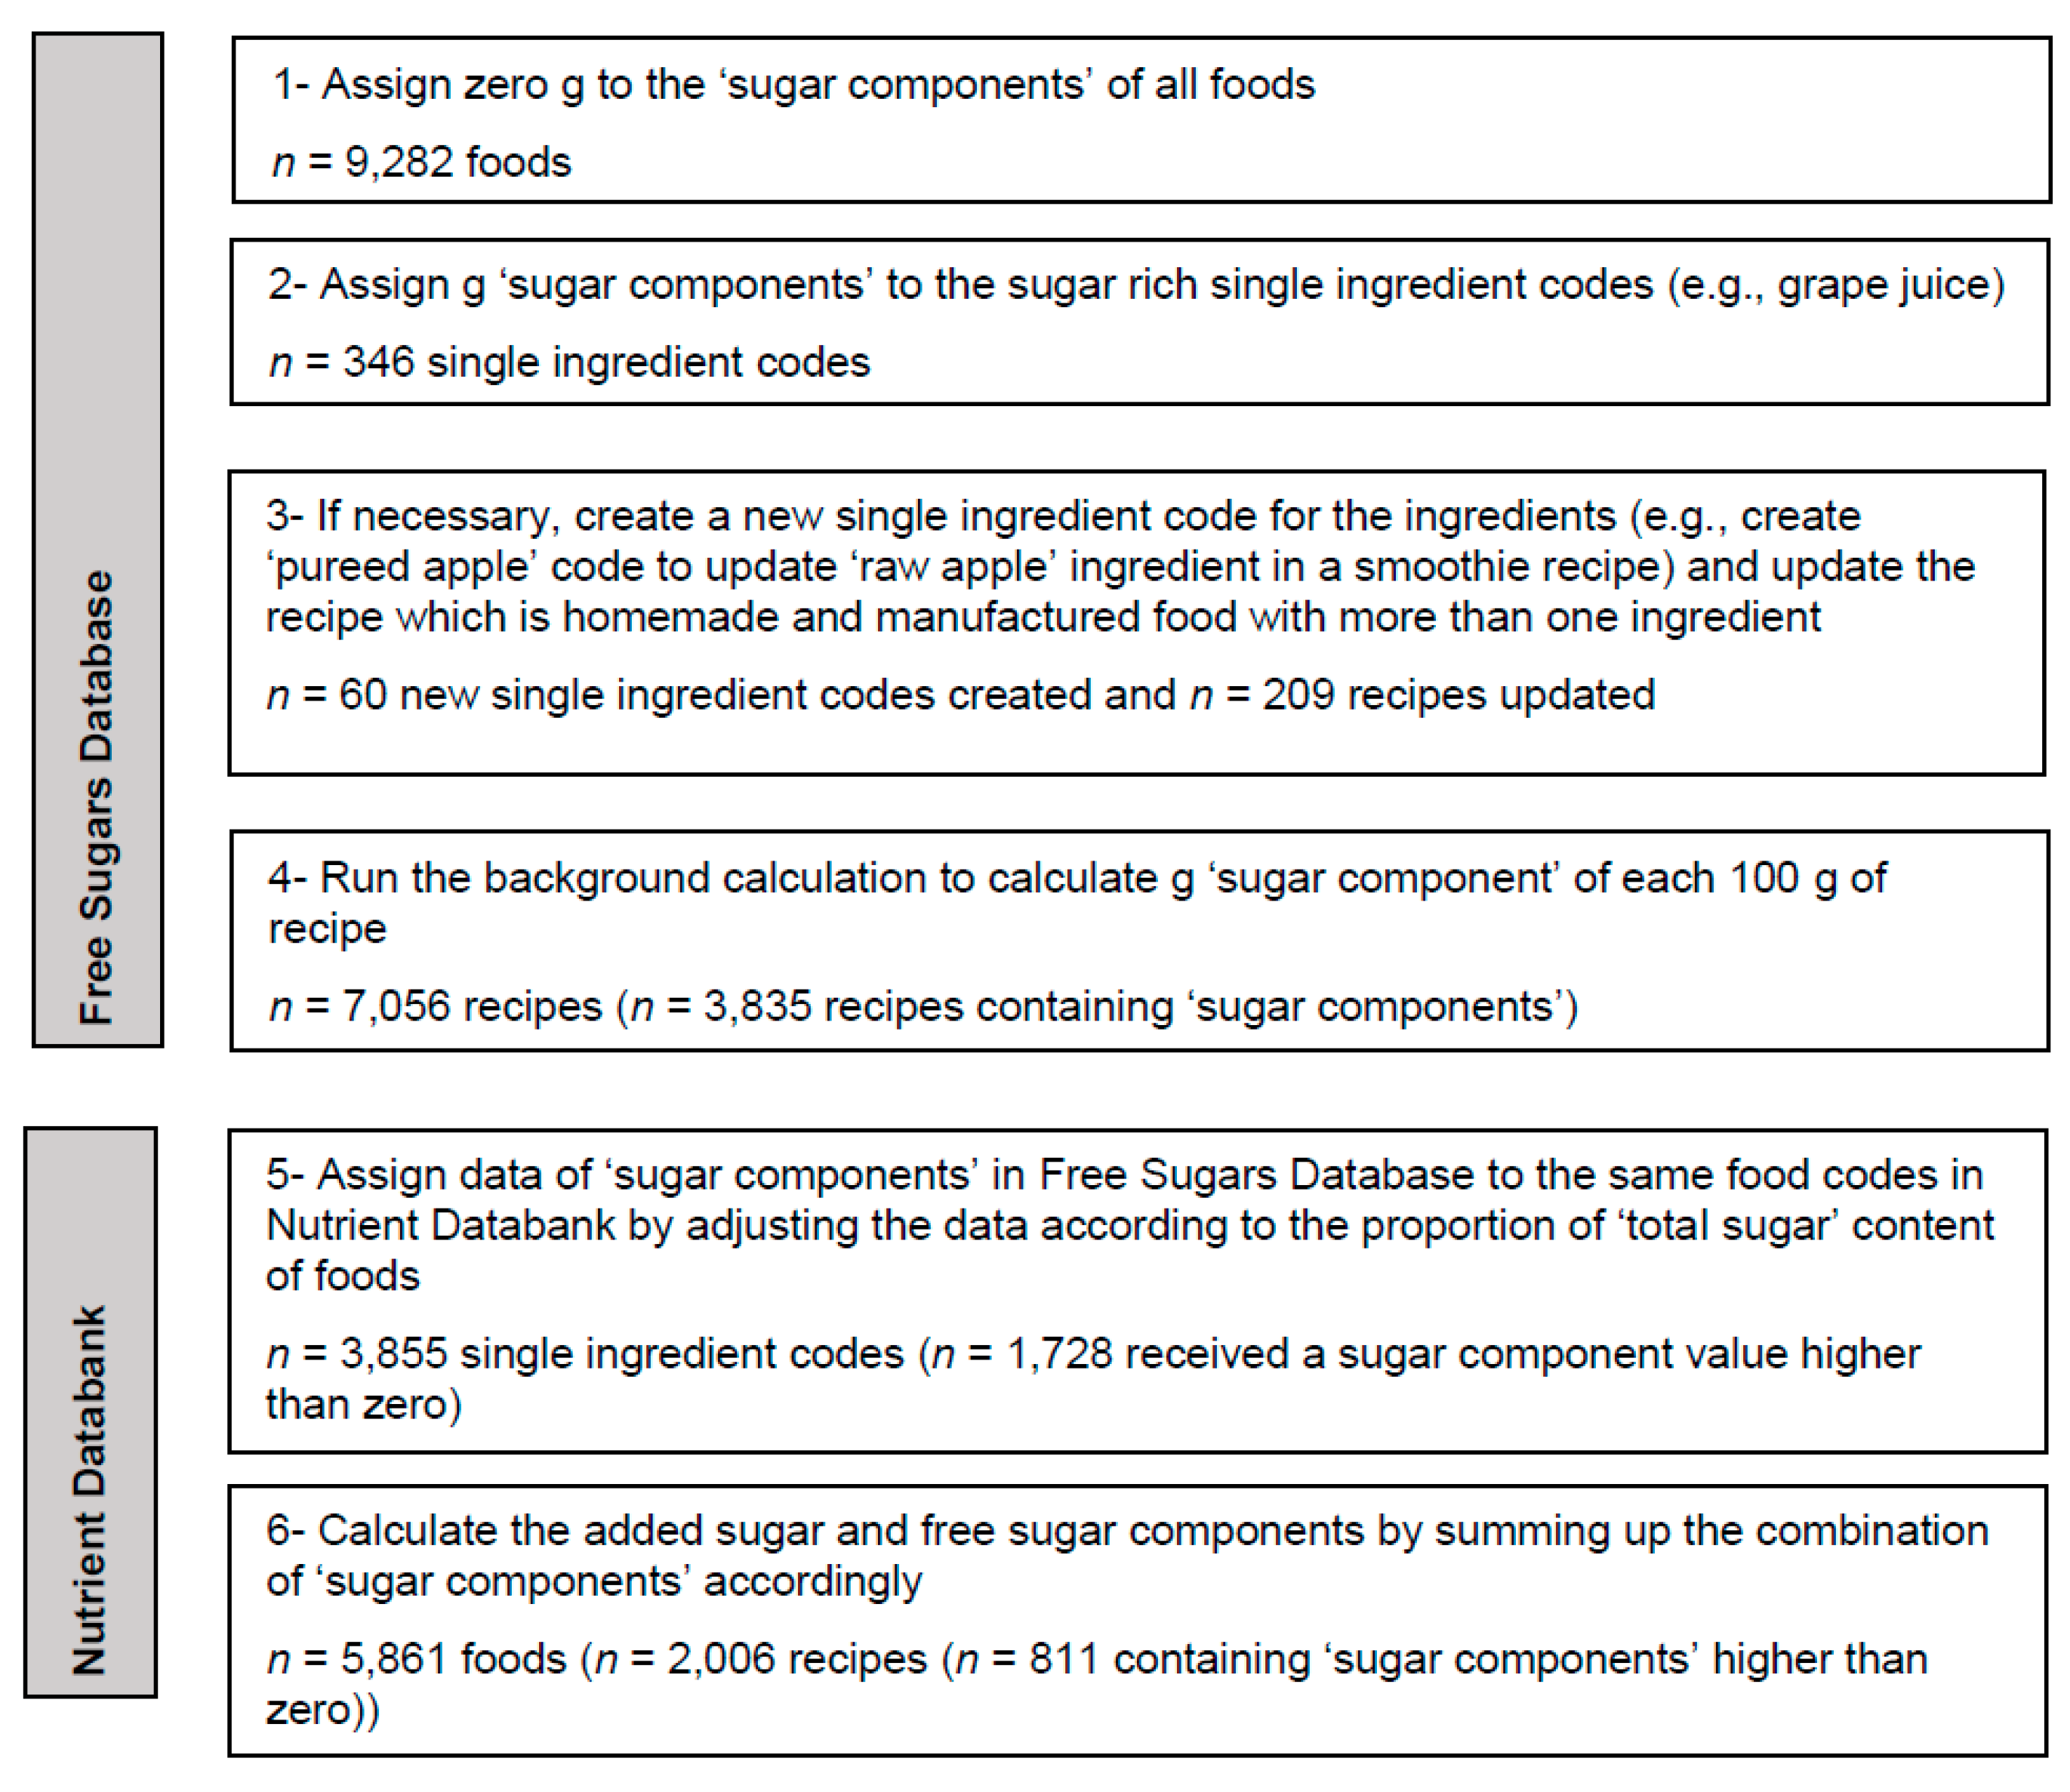
2.2. Methodology for Estimating Sugar Components of Foods: Approach for the UK NDNS RP
2.3. Additional Information on the UK NDNS Nutrient Databank and FSA Recipes Database
2.3.1. UK NDNS Nutrient Databank
2.3.2. Recipes Database
2.4. Inter-Rater Repeatability
2.5. Validity
3. Results
3.1. Estimation of Added Sugar and Free Sugar Content of Foods Based on Disaggregation Methodology
3.1.1. Inter-Rater Repeatability
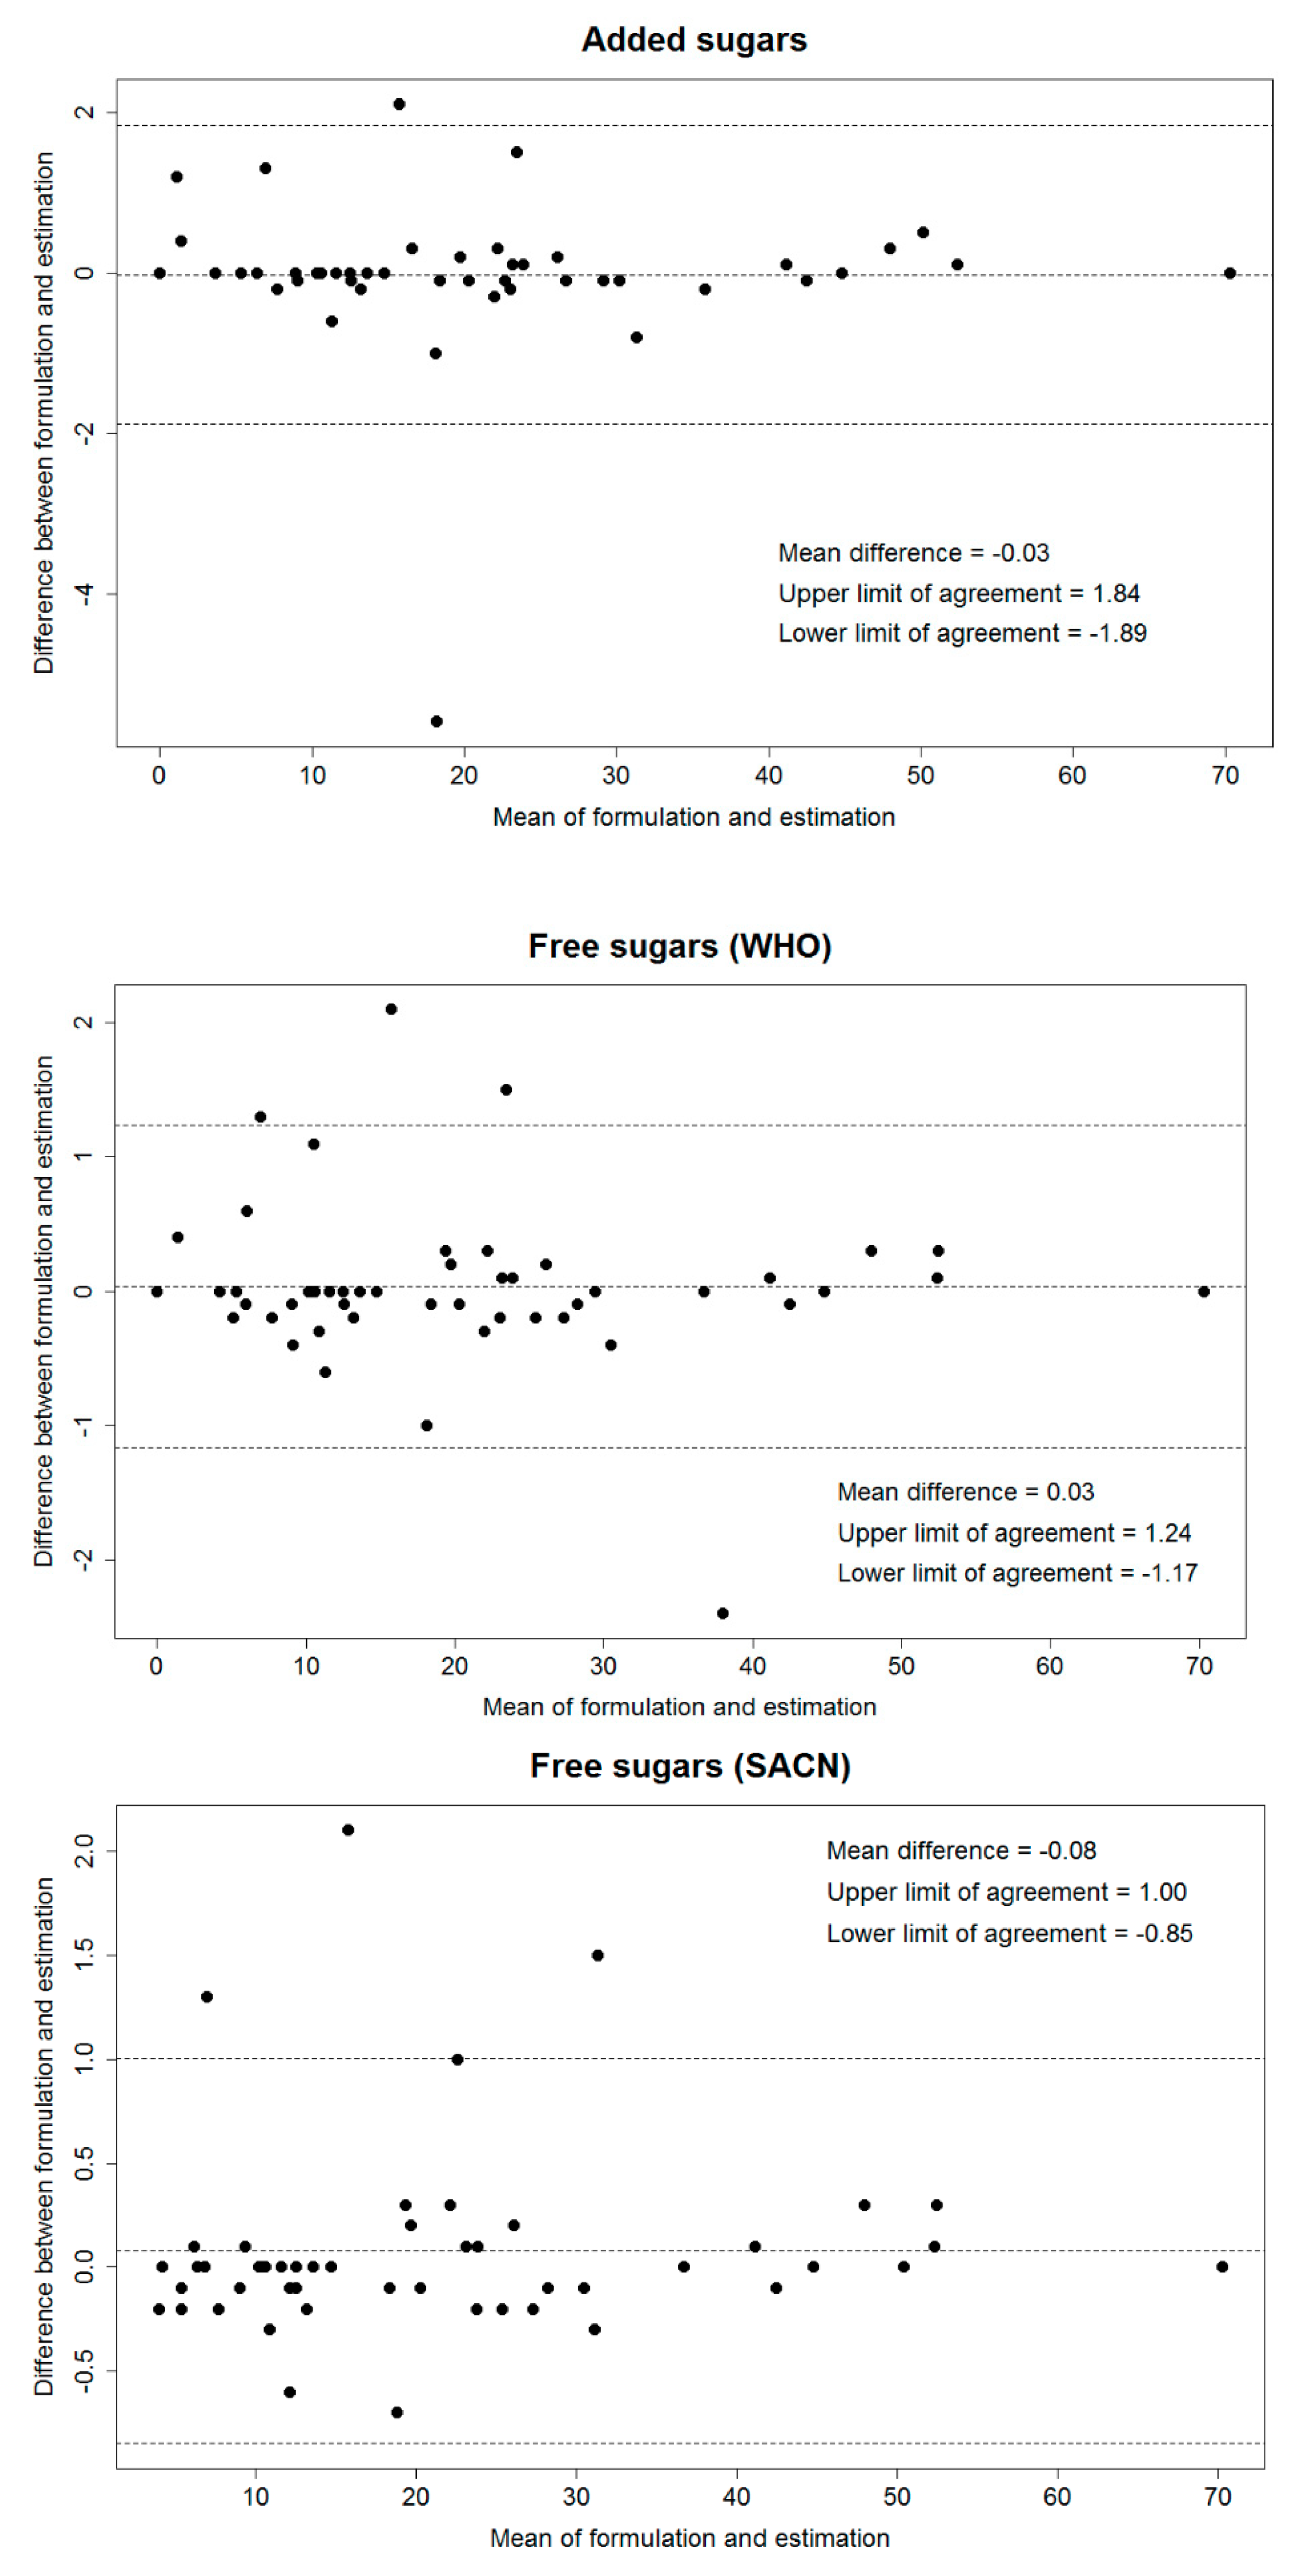
3.1.2. Validity
4. Discussion
4.1. Estimating the Added Sugar and Free Sugar Content of Foods
4.2. Repeatability and Validity
4.3. Sources of Free Sugars
4.4. Strength of the Method
4.5. Limitation of the Method
5. Conclusions
Author Contributions
Acknowledgments
Conflicts of Interest
References
- Fidler Mis, N.; Braegger, C.; Bronsky, J.; Campoy, C.; Domellof, M.; Embleton, N.D.; Hojsak, I.; Hulst, J.; Indrio, F.; Lapillonne, A.; et al. Espghan Committee on Nutrition. Sugar in infants, children and adolescents: A position paper of the European Society for Paediatric Gastroenterology, Hepatology and Nutrition Committee on Nutrition. J. Pediatr. Gastroenterol. Nutr. 2017, 65, 681–696. [Google Scholar] [CrossRef] [PubMed]
- Scientific Advisory Committee on Nutrition (SACN). Carbohydrates and Health; Public Health England: London, UK, 2015. [Google Scholar]
- World Health Organisation (WHO). Guideline: Sugars Intake for Adults and Children; WHO: Geneva, Switzerland, 2015. [Google Scholar]
- Imamura, F.; O’Connor, L.; Ye, Z.; Mursu, J.; Hayashino, Y.; Bhupathiraju, S.N.; Forouhi, N.G. Consumption of sugar sweetened beverages, artificially sweetened beverages, and fruit juice and incidence of type 2 diabetes: Systematic review, meta-analysis, and estimation of population attributable fraction. BMJ 2015, 351, h3576. [Google Scholar] [CrossRef] [PubMed]
- Malik, V.S.; Popkin, B.M.; Bray, G.A.; Despres, J.P.; Willett, W.C.; Hu, F.B. Sugar-sweetened beverages and risk of metabolic syndrome and type 2 diabetes: A meta-analysis. Diabetes Care 2010, 33, 2477–2483. [Google Scholar] [CrossRef] [PubMed]
- Burley, V.J.; Lai, H.T.; Evans, C.E.L. Adherence to sugars guidelines and micronutrient intakes in UK adult participants of the National Diet & Nutrition Survey (2008/09–2011/12). Proc. Nutr. Soc. 2017, 76, E3. [Google Scholar]
- Louie, J.C.; Tapsell, L.C. Association between intake of total vs added sugar on diet quality: A systematic review. Nutr. Rev. 2015, 73, 837–857. [Google Scholar] [CrossRef] [PubMed]
- Erickson, J.; Sadeghirad, B.; Lytvyn, L.; Slavin, J.; Johnston, B.C. The scientific basis of guideline recommendations on sugar intake: A. systematic review. Ann. Intern. Med. 2017, 166, 257–267. [Google Scholar] [CrossRef] [PubMed]
- Childhood Obesity: A. Plan for Action. Available online: https://www.gov.uk/government/publications/childhood-obesity-a-plan-for-action (accessed on 26 June 2018).
- Colchero, M.A.; Salgado, J.C.; Unar-Munguia, M.; Molina, M.; Ng, S.; Rivera-Dommarco, J.A. Changes in prices after an excise tax to sweetened sugar beverages was implemented in Mexico: Evidence from urban areas. PLoS ONE 2015, 10, e0144408. [Google Scholar] [CrossRef] [PubMed]
- Public Health England (PHE). Sugar Reduction and Wider Reformulation. Available online: https://www.gov.uk/government/collections/sugar-reduction (accessed on 29 June 2018).
- The Ministry of Health and Care Services. Norwegian National Action Plan for a Healthier Diet-an outline. Available online: https://www.regjeringen.no/contentassets/fab53cd681b247bfa8c03a3767c75e66/norwegian_national_action_plan_for_a_healthier_diet_an_outline.pdf (accessed on 29 June 2018).
- Why 5%? An Explanation of the Scientific Advisory Committee on Nutrition’s Recommendations About Sugars and Health, in the Context of Current Intakes of Free Sugars, Other Dietary Recommendations and the Changes in Dietary Habits Needed to Reduce Consumption of Free Sugars to 5% of Dietary Energy. Available online: https://assets.publishing.service.gov.uk/government/uploads/system/uploads/attachment_data/file/489906/Why_5__-_The_Science_Behind_SACN.pdf (accessed on 23 August 2018).
- Hess, J.; Latulippe, M.E.; Ayoob, K.; Slavin, J. The confusing world of dietary sugars: Definitions, intakes, food sources and international dietary recommendations. Food Funct. 2012, 3, 477–486. [Google Scholar] [CrossRef] [PubMed]
- Joint WHO/FAO Expert Consultation. Carbohydrates in Human Nutrition; FAO Food and Nutrition Paper No. 66: Rome, Italy, 1998. [Google Scholar]
- EFSA Panel on Dietetic Products, Nutrition, and Allergies (NDA). Scientific opinion on dietary reference values for carbohydrates and dietary fibre. EFSA J. 2010, 8, 1462. [Google Scholar]
- Committee on the Medical Aspects of Food Policy, Department of Health. Dietary Reference Values for Food Energy and Nutrients for the United Kingdom; The Stationery Office Ltd.: London, UK, 1991. [Google Scholar]
- Hedrick, V.E.; Dietrich, A.M.; Estabrooks, P.A.; Savla, J.; Serrano, E.; Davy, B.M. Dietary biomarkers: Advances, limitations and future directions. Nutr. J. 2012, 11, 109. [Google Scholar] [CrossRef] [PubMed]
- Louie, J.C.; Moshtaghian, H.; Boylan, S.; Flood, V.M.; Rangan, A.M.; Barclay, A.W.; Brand-Miller, J.C.; Gill, T.P. A systematic methodology to estimate added sugar content of foods. Eur. J. Clin. Nutr. 2015, 69, 154–161. [Google Scholar] [CrossRef] [PubMed]
- Sluik, D.; van Lee, L.; Engelen, A.I.; Feskens, E.J. Total, free, and added sugar consumption and adherence to guidelines: The Dutch National Food Consumption Survey 2007–2010. Nutrients 2016, 8, 70. [Google Scholar] [CrossRef] [PubMed]
- Kelly, S.A.; Summerbell, C.; Rugg-Gunn, A.J.; Adamson, A.; Fletcher, E.; Moynihan, P.J. Comparison of methods to estimate non-milk extrinsic sugars and their application to sugars in the diet of young adolescents. Br. J. Nutr. 2005, 94, 114–124. [Google Scholar] [CrossRef] [PubMed]
- Kibblewhite, R.; Nettleton, A.; McLean, R.; Haszard, J.; Fleming, E.; Kruimer, D.; Te Morenga, L. Estimating free and added sugar intakes in New Zealand. Nutrients 2017, 9, 1292. [Google Scholar] [CrossRef] [PubMed]
- Ng, S.W.; Bricker, G.; Li, K.P.; Yoon, E.F.; Kang, J.; Westrich, B. Estimating added sugars in US consumer packaged goods: An application to beverages in 2007–2008. J. Food Compost. Anal. 2015, 43, 7–17. [Google Scholar] [CrossRef] [PubMed]
- Ruiz, E.; Rodriguez, P.; Valero, T.; Avila, J.M.; Aranceta-Bartrina, J.; Gil, A.; Gonzalez-Gross, M.; Ortega, R.M.; Serra-Majem, L.; Varela-Moreiras, G. Dietary intake of individual (free and intrinsic) sugars and food sources in the Spanish population: Findings from the ANIBES Study. Nutrients 2017, 9, 275. [Google Scholar] [CrossRef] [PubMed]
- Food Standard Agency (FSA); Public Health England (PHE). Mccance and Widdowson’S the composition of foods: seventh summary edition. In The Composition of Foods, 7th ed.; Royal Society of Chemistry: Cambridge, UK, 2014. [Google Scholar]
- Public Health England (PHE). National Diet and Nutrition Survey Years 1–6, 2008/09–2013/14. Available online: https://discover.ukdataservice.ac.uk/catalogue?sn=6533 (accessed on 3 July 2018).
- Food Standards Agency Standard Recipes Database, 1992–2012. Available online: http://doi.org/10.5255/UKDA-SN-8159-1 (accessed on 3 July 2018).
- Roodenburg, A.J.; Popkin, B.M.; Seidell, J.C. Development of international criteria for a front of package food labelling system: The International Choices Programme. Eur. J. Clin. Nutr. 2011, 65, 1190–1200. [Google Scholar] [CrossRef] [PubMed]
- Giabbanelli, P.J.; Adams, J. Identifying small groups of foods that can predict achievement of key dietary recommendations: Data mining of the UK National Diet and Nutrition Survey, 2008–2012. Public Health Nutr. 2016, 19, 1543–1551. [Google Scholar] [CrossRef] [PubMed]
- Swan, G.E.; Powell, N.A.; Knowles, B.L.; Bush, M.T.; Levy, L.B. A definition of free sugars for the UK. Public Health Nutr. 2018, 21, 1636–1638. [Google Scholar] [CrossRef] [PubMed]
- Scientific Advisory Committee on Nutrition (SACN). Minutes of the 48th Meeting. June 2016. Available online: https://app.box.com/s/ivrivaemf7fgeo9a17xdmv167c4uvteu/file/106585193169 (accessed on 3 July 2018).
- Gibson, S.; Francis, L.; Newens, K.; Livingstone, B. Associations between free sugars and nutrient intakes among children and adolescents in the UK. Br. J. Nutr. 2016, 116, 1265–1274. [Google Scholar] [CrossRef] [PubMed]
- Her Majesty (HM) Treasury. Soft Drinks Industry Levy. Available online: https://www.gov.uk/government/consultations/soft-drinks-industry-levy (accessed on 2 July 2018).
- Marí, J.A.T. Hidden sugar in food: A. risk for health. J. Clin. Nutr. Diet. 2017, 3, 1–3. [Google Scholar]
- Tierney, M.; Gallagher, A.M.; Giotis, E.S.; Pentieva, K. An online survey on consumer knowledge and understanding of added sugars. Nutrients 2017, 37. [Google Scholar] [CrossRef] [PubMed]
- United States Department of Agriculture (USDA). Food Intakes Converted to Retail Commodities. Available online: https://www.ars.usda.gov/northeast-area/beltsville-md-bhnrc/beltsville-human-nutrition-research-center/food-surveys-research-group/docs/ficrcd-overview/ (accessed on 29 June 2018).
- Australian Food and Nutrient Database (AUSNUT). AUSNUT 2011-13 Food Recipe File. Available online: http://www.foodstandards.gov.au/science/monitoringnutrients/ausnut/ausnutdatafiles/Pages/foodrecipe.aspx (accessed on 26 June 2018).
- National Institute for Public Health and the Environment (RIVM). List of Recipes NEVO Online 2016. Available online: https://www.rivm.nl/dsresource?objectid=00b10527-12c2-40bf-9de0-ac98644fc22f&type=org&disposition=inline (accessed on 3 July 2018).
- Marconi, S.; Durazzo, A.; Camilli, E.; Lisciani, S.; Gabrielli, P.; Aguzzi, A.; Gambelli, L.; Lucarini, M.; Marletta, L. Food composition databases: Considerations about complex food matrices. Foods 2018, 7, 2. [Google Scholar] [CrossRef] [PubMed]


| Data Analyst 1 (g/100 g) | Data Analyst 2 (g/100 g) | Difference of Means (g) | 95% Confidence Interval | p | ||
|---|---|---|---|---|---|---|
| Sugar-table | 15.98 | 15.88 | 0.10 | −0.69, | 0.89 | 0.80 |
| Sugar-other | 3.74 | 3.95 | −0.21 | −0.68, | 0.25 | 0.36 |
| Sugar-honey | 0.43 | 0.47 | −0.04 | −0.24, | 0.16 | 0.69 |
| Sugar-fruit juice | 0.76 | 0.74 | 0.02 | −0.10, | 0.15 | 0.69 |
| Sugar-pureed fruit | 0.77 | 0.73 | 0.04 | −0.17, | 0.24 | 0.73 |
| Sugar-stewed fruit | 0.98 | 1.10 | −0.12 | −0.27, | 0.03 | 0.12 |
| Sugar-dried fruit | 0.72 | 0.70 | 0.02 | −0.01, | 0.04 | 0.21 |
| Added sugar and free sugar combinations | ||||||
| Added sugars 1 | 19.72 | 19.83 | −0.11 | −0.69, | 0.47 | 0.70 |
| Free sugars (WHO) 2 | 20.91 | 21.04 | −0.13 | −0.65, | 0.40 | 0.63 |
| Free sugars (SACN) 3 | 21.68 | 21.77 | −0.09 | −0.66, | 0.48 | 0.75 |
| Known Formulation * (g/100 g) | Estimation (g/100 g) | Difference of Means (g) | 95% Confidence Interval | p | ||
|---|---|---|---|---|---|---|
| Sugar-table | 15.98 | 15.84 | 0.14 | −0.23, | 0.50 | 0.45 |
| Sugar-other | 3.74 | 3.90 | −0.16 | −0.46, | 0.13 | 0.27 |
| Sugar-honey | 0.43 | 0.33 | 0.10 | −0.12, | 0.32 | 0.37 |
| Sugar-fruit juice | 0.76 | 0.80 | −0.04 | −0.12, | 0.05 | 0.37 |
| Sugar-pureed fruit | 0.77 | 0.72 | 0.04 | −0.08, | 0.17 | 0.49 |
| Sugar-stewed fruit | 0.98 | 1.12 | −0.14 | −0.29, | 0.01 | 0.07 |
| Sugar-dried fruit | 0.72 | 0.69 | 0.02 | −0.02, | 0.07 | 0.32 |
| Added sugars and free sugars combinations | ||||||
| Added sugars 1 | 19.72 | 19.75 | −0.03 | −0.30, | 0.24 | 0.85 |
| Free sugars (WHO) 2 | 20.91 | 20.88 | 0.03 | −0.14, | 0.21 | 0.70 |
| Free sugars (SACN) 3 | 21.68 | 21.60 | 0.08 | −0.06, | 0.21 | 0.25 |
© 2018 by the authors. Licensee MDPI, Basel, Switzerland. This article is an open access article distributed under the terms and conditions of the Creative Commons Attribution (CC BY) license (http://creativecommons.org/licenses/by/4.0/).
Share and Cite
Amoutzopoulos, B.; Steer, T.; Roberts, C.; Cole, D.; Collins, D.; Yu, D.; Hawes, T.; Abraham, S.; Nicholson, S.; Baker, R.; et al. A Disaggregation Methodology to Estimate Intake of Added Sugars and Free Sugars: An Illustration from the UK National Diet and Nutrition Survey. Nutrients 2018, 10, 1177. https://doi.org/10.3390/nu10091177
Amoutzopoulos B, Steer T, Roberts C, Cole D, Collins D, Yu D, Hawes T, Abraham S, Nicholson S, Baker R, et al. A Disaggregation Methodology to Estimate Intake of Added Sugars and Free Sugars: An Illustration from the UK National Diet and Nutrition Survey. Nutrients. 2018; 10(9):1177. https://doi.org/10.3390/nu10091177
Chicago/Turabian StyleAmoutzopoulos, Birdem, Toni Steer, Caireen Roberts, Darren Cole, David Collins, Dove Yu, Tabitha Hawes, Suzanna Abraham, Sonja Nicholson, Ruby Baker, and et al. 2018. "A Disaggregation Methodology to Estimate Intake of Added Sugars and Free Sugars: An Illustration from the UK National Diet and Nutrition Survey" Nutrients 10, no. 9: 1177. https://doi.org/10.3390/nu10091177
APA StyleAmoutzopoulos, B., Steer, T., Roberts, C., Cole, D., Collins, D., Yu, D., Hawes, T., Abraham, S., Nicholson, S., Baker, R., & Page, P. (2018). A Disaggregation Methodology to Estimate Intake of Added Sugars and Free Sugars: An Illustration from the UK National Diet and Nutrition Survey. Nutrients, 10(9), 1177. https://doi.org/10.3390/nu10091177