Red Blood Cell Aggregation-Associated Dietary Pattern Predicts Hyperlipidemia and Metabolic Syndrome

 , ,
, ,
Abstract
:1. Introduction
2. Materials and Methods
2.1. Participants
2.2. Definitions
2.3. Questionnaires
2.4. Anthropometric Measurements
2.5. Laboratory Measurements
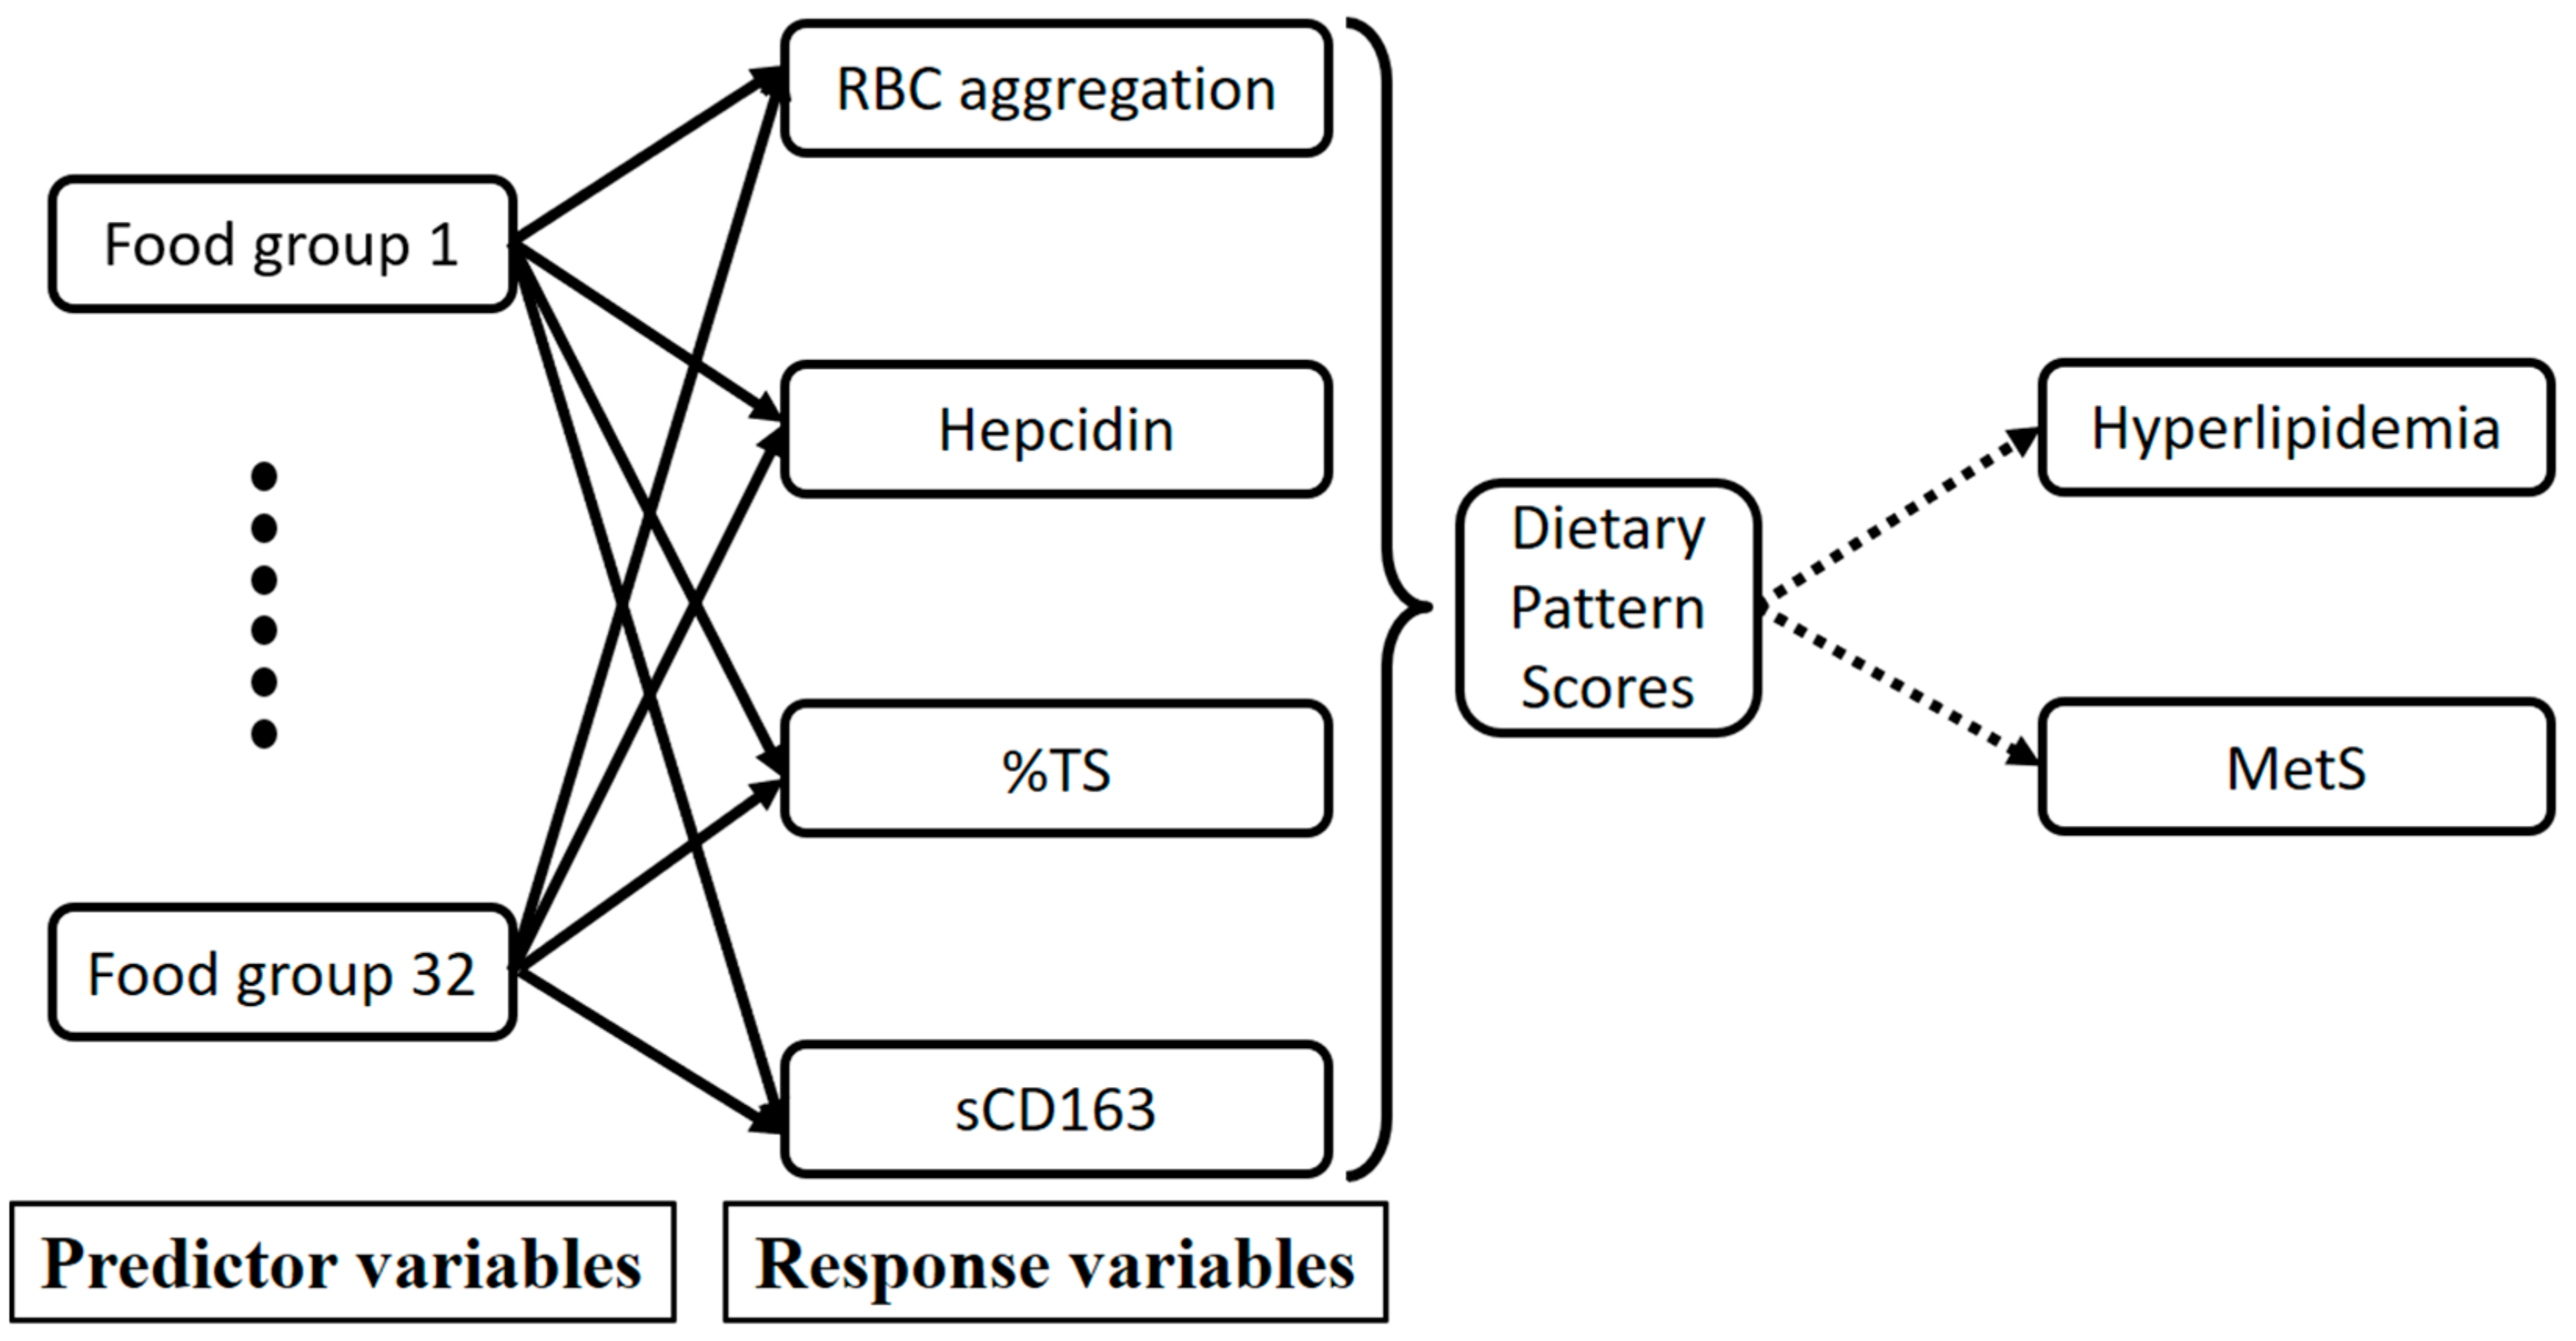
2.6. Statistical Analysis
3. Results
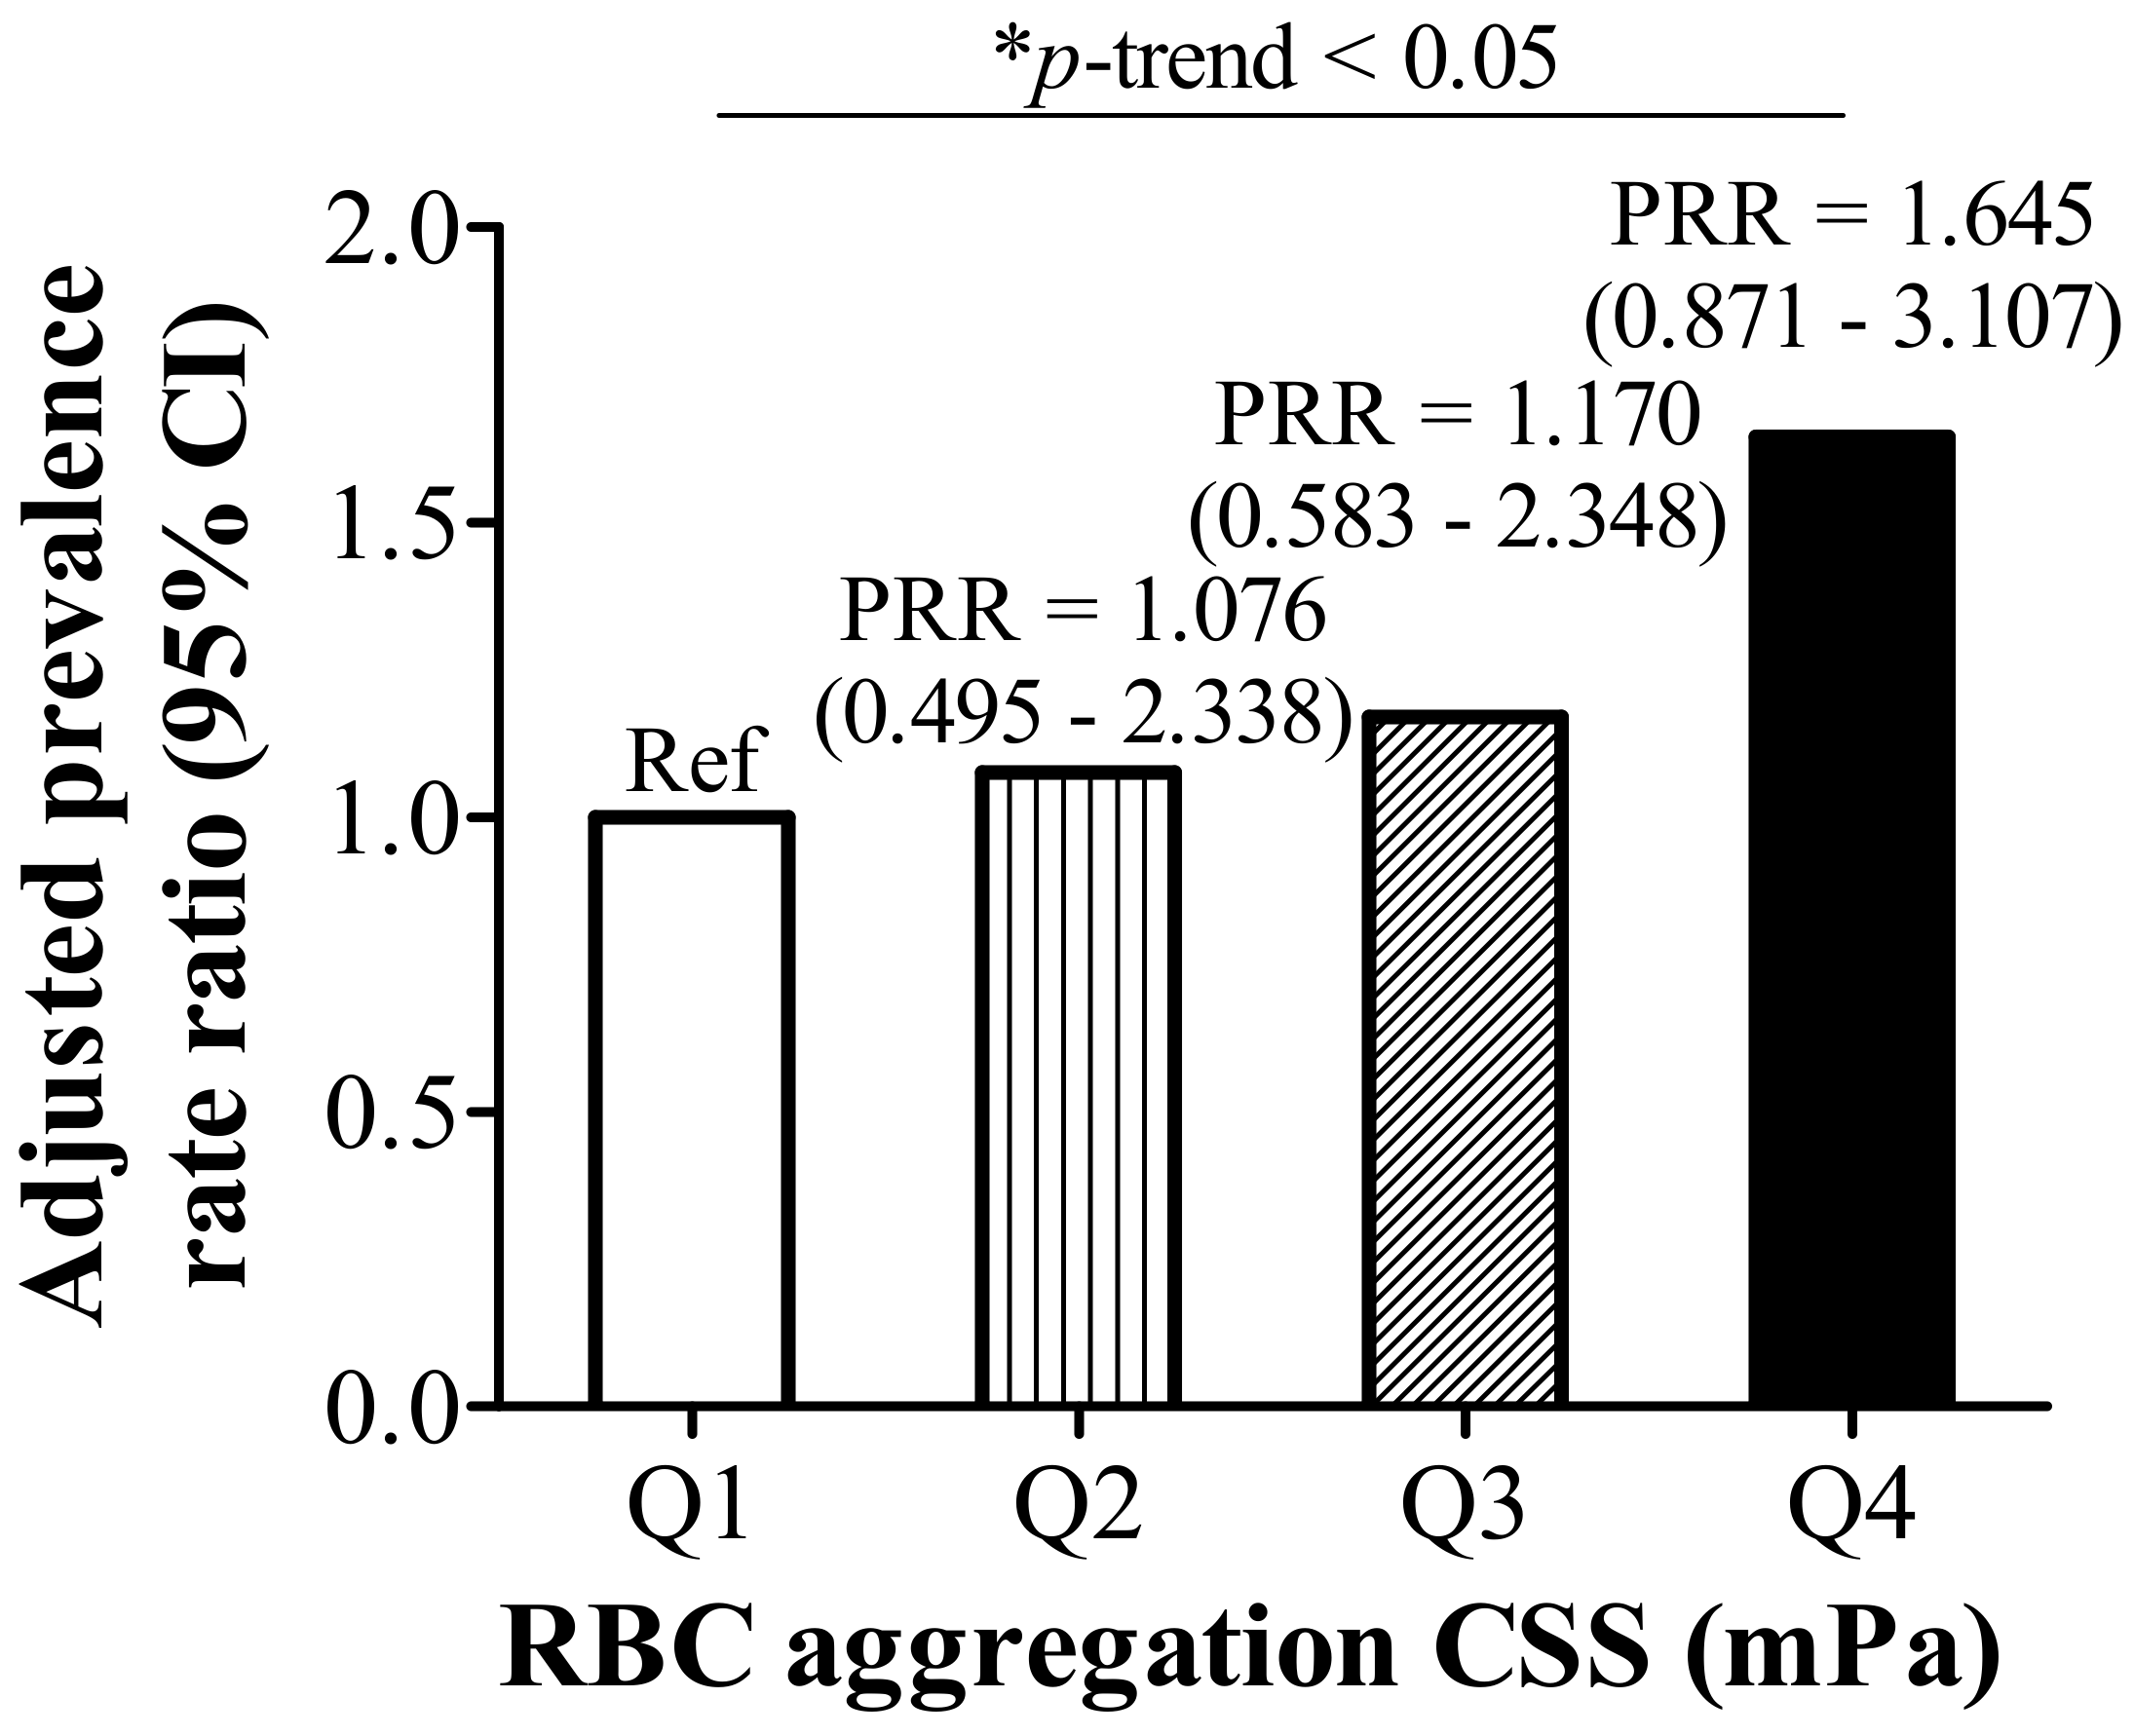
3.1. RBC Aggregation Shows a Positive Correlation with Dysregulated Iron and Is Positively Associated with Hyperlipidemia
3.2. RBC Aggregation Is Positively Correlated with Hepcidin and sCD163, but Negatively Correlated with %TS
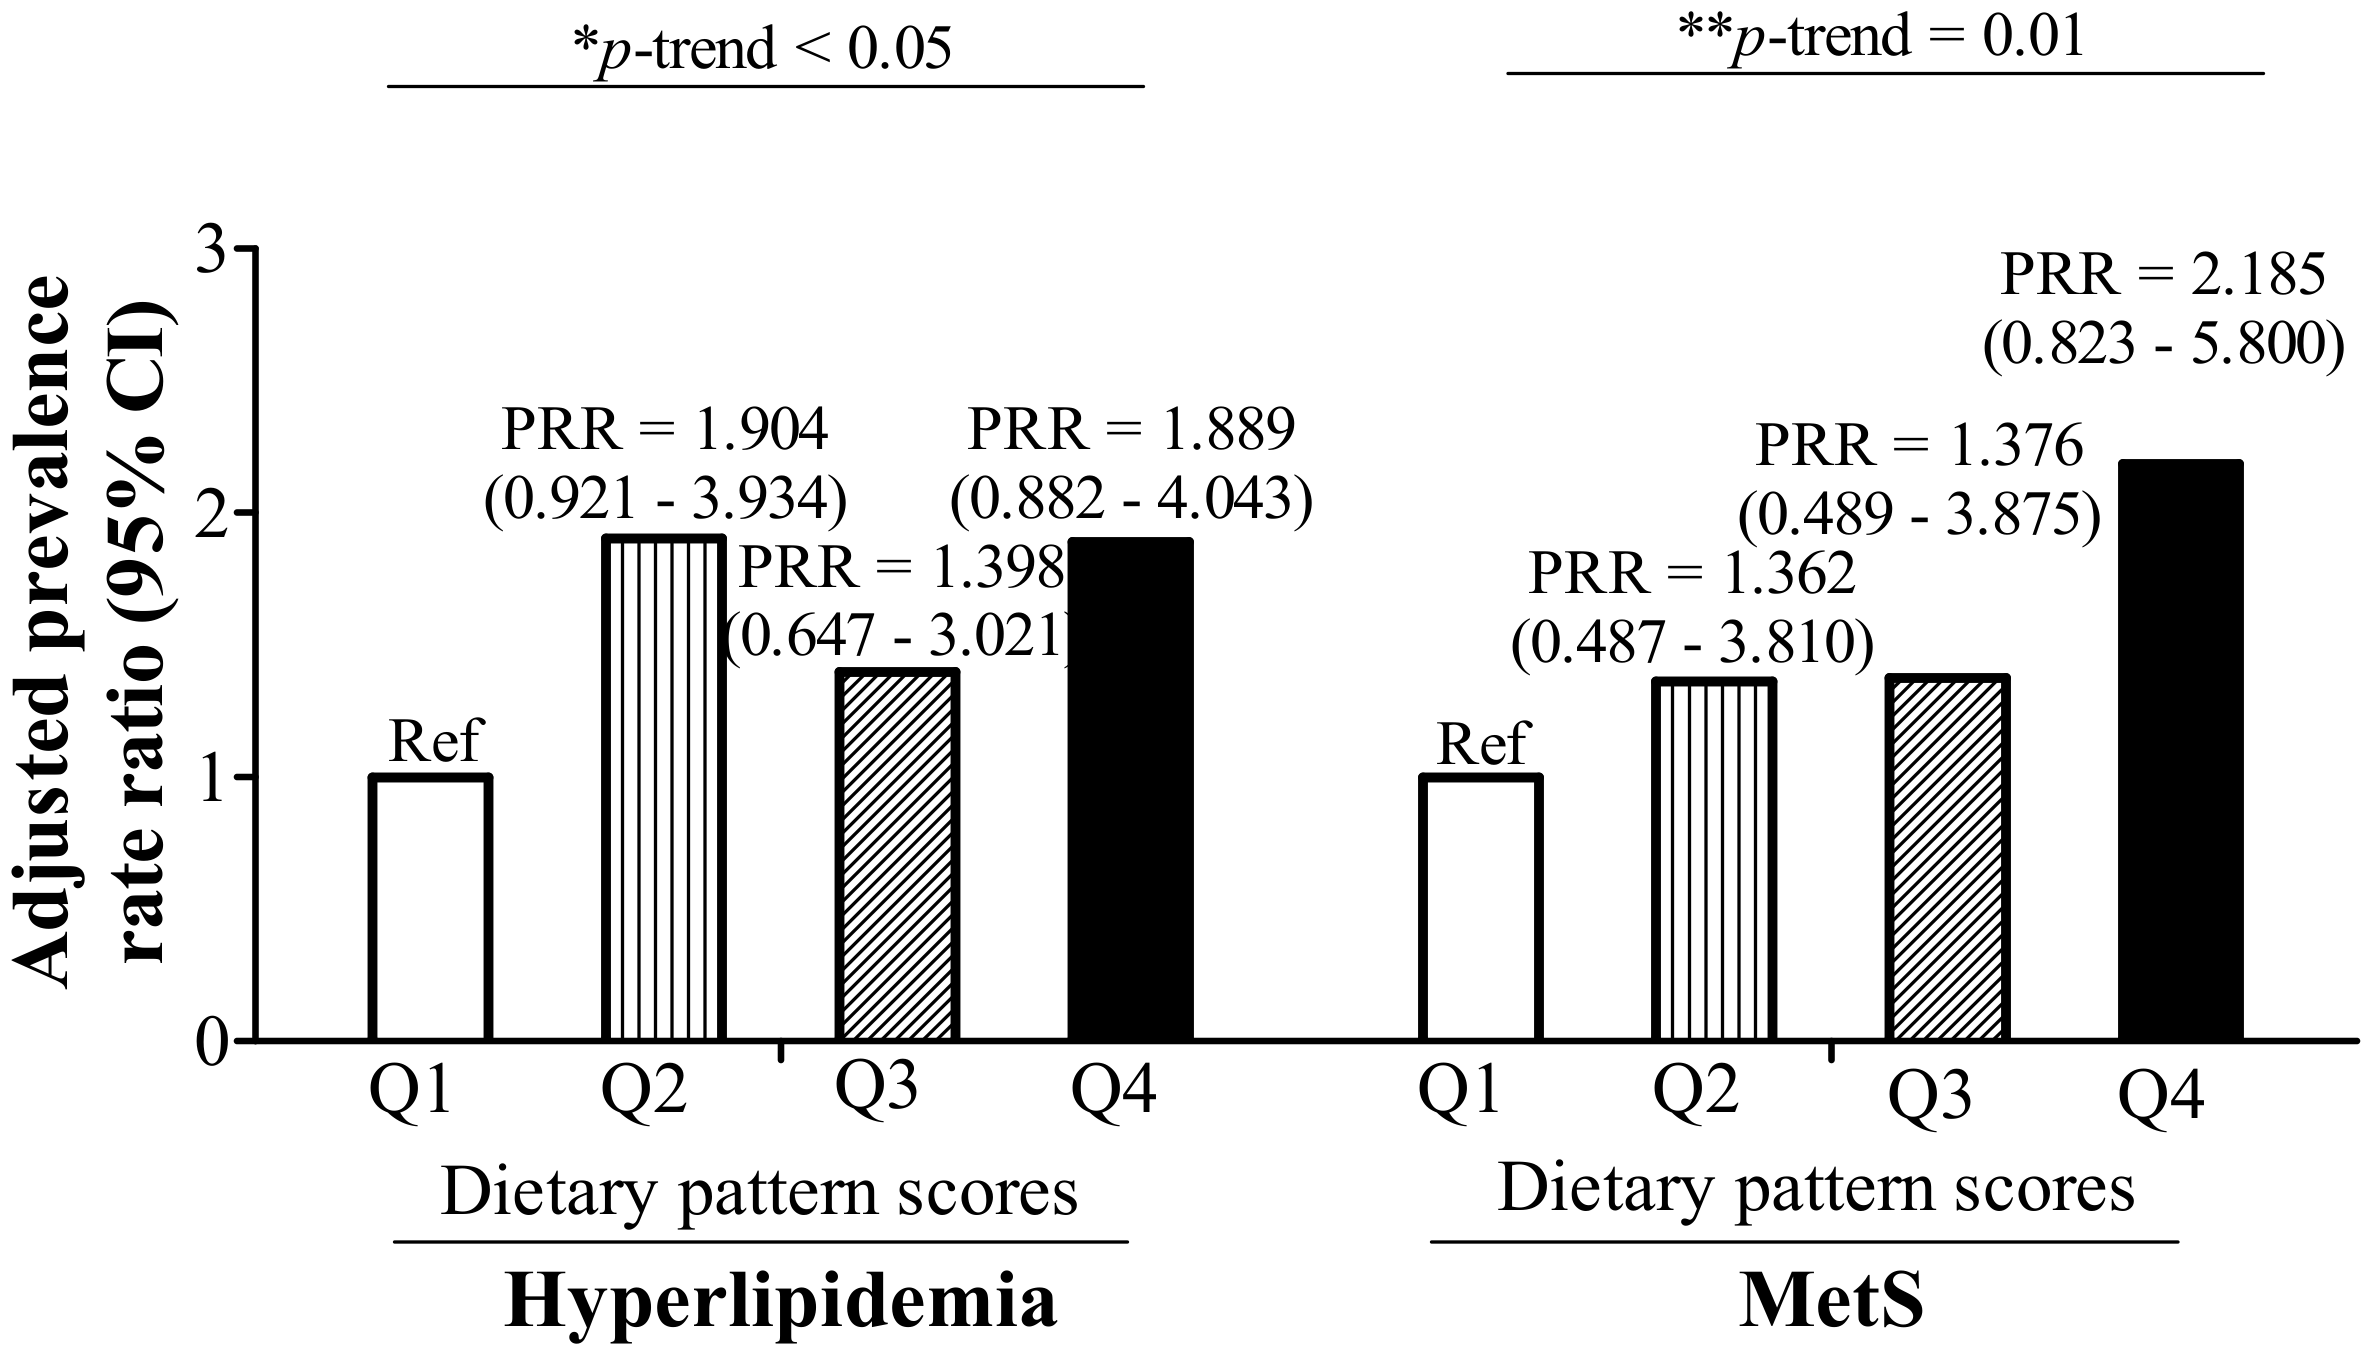
3.3. RBC Aggregation-Associated Dietary Patterns Independently Predict Hyperlipidemia and MetS
4. Discussion
5. Conclusions
Author Contributions
Funding
Acknowledgments
Conflicts of Interest
References
- Misra, A.; Shrivastava, U. Obesity and dyslipidemia in south Asians. Nutrients 2013, 5, 2708–2733. [Google Scholar] [CrossRef] [PubMed]
- Smith, G. Epidemiology of dyslipidemia and economic burden on the healthcare system. Am. J. Manag. Care 2007, 13 (Suppl. 3), S68–S71. [Google Scholar]
- Chang, H.-Y.; Yeh, W.-T.; Chang, Y.-H.; Tsai, K.-S.; Pan, W.-H. Prevalence of dyslipidemia and mean blood lipid values in taiwan: Results from the nutrition and health survey in Taiwan (NAHSIT, 1993–1996). Chin. J. Physiol. 2002, 45, 187–198. [Google Scholar] [PubMed]
- Nelson, R.H. Hyperlipidemia as a risk factor for cardiovascular disease. Prim. Care 2013, 40, 195–211. [Google Scholar] [CrossRef] [PubMed]
- Hwang, L.-C.; Bai, C.-H.; Chen, C.-J. Prevalence of obesity and metabolic syndrome in Taiwan. J. Formos. Med. Assoc. 2006, 105, 626–635. [Google Scholar] [CrossRef]
- Popp-Snijders, C.; Schouten, J.; Van Blitterswijk, W.; Van der Veen, E. Changes in membrane lipid composition of human erythrocytes after dietary supplementation of (n-3) polyunsaturated fatty acids. Maintenance of membrane fluidity. Biochim. Biophys Acta-Biomembr. 1986, 854, 31–37. [Google Scholar] [CrossRef]
- Novgorodtseva, T.P.; Karaman, Y.K.; Zhukova, N.V. The effect of high fat food on erythrocyte phospholipids, fatty acids composition and glutathione redox-system of rats with alimentary dyslipidemia. Health 2010, 2, 45–50. [Google Scholar]
- Cicha, I.; Suzuki, Y.; Tateishi, N.; Maeda, N. Enhancement of red blood cell aggregation by plasma triglycerides. Clin. Hemorheol. Microcirc. 2001, 24, 247–255. [Google Scholar] [PubMed]
- Cicha, I.; Suzuki, Y.; Tateishi, N.; Maeda, N. Effects of dietary triglycerides on rheological properties of human red blood cells. Clin. Hemorheol. Microcirc. 2004, 30, 301–305. [Google Scholar] [PubMed]
- Baskurt, O.K.; Meiselman, H.J. Seminars in thrombosis and hemostasis. In Blood Rheology and Hemodynamics; Thieme Medical Publishers, Inc.: New York, NY, USA, 2003; pp. 435–450. [Google Scholar]
- Unruh, D.; Srinivasan, R.; Benson, T.; Haigh, S.; Coyle, D.; Batra, N.; Keil, R.; Sturm, R.; Blanco, V.; Palascak, M.; et al. Red blood cell dysfunction induced by high-fat diet: Potential implications for obesity-related atherosclerosis. Circulation 2015, 132, 1898–1908. [Google Scholar] [CrossRef] [PubMed]
- Wiewiora, M.; Piecuch, J.; Glûck, M.; Slowinska-Lozynska, L.; Sosada, K. The impacts of super obesity versus morbid obesity on red blood cell aggregation and deformability among patients qualified for bariatric surgery. Clin. Hemorheol. Microcirc. 2014, 58, 543–550. [Google Scholar] [PubMed]
- Adamson, J.W. The relationship of erythropoietin and iron metabolism to red blood cell production in humans. Semin. Oncol. 1994, 21, 9–15. [Google Scholar] [PubMed]
- Smith, K.A.; Mengel, C.E. Association of iron-dextran-induced hemolysis and lipid peroxidation in mice. J. Lab. Clin. Med. 1968, 72, 505–510. [Google Scholar] [PubMed]
- Cellerino, R.; Guidi, G.; Perona, G. Plasma iron and erythrocytic glutathione peroxidase activity. Eur. J. Haematol. 1976, 17, 111–116. [Google Scholar] [CrossRef]
- Macdougall, L.G. Red cell metabolism in iron deficiency anemia: III. The relationship between glutathione peroxidase, catalase, serum vitamin e, and susceptibility of iron-deficient red cells to oxidative hemolysis. J. Pediatr. 1972, 80, 774. [Google Scholar] [CrossRef]
- Yip, R.; Mohandas, N.; Clark, M.R.; Jain, S.; Shohet, S.B.; Dallman, P.R. Red cell membrane stiffness in iron deficiency. Blood 1983, 62, 99–106. [Google Scholar] [PubMed]
- Tussing-Humphreys, L.; Pustacioglu, C.; Nemeth, E.; Braunschweig, C. Rethinking iron regulation and assessment in iron deficiency, anemia of chronic disease, and obesity: Introducing hepcidin. J. Acad. Nutr. Diet. 2012, 112, 391–400. [Google Scholar] [CrossRef] [PubMed]
- Huang, L.L.; Dou, D.-M.; Liu, N.; Wang, X.X.; Fu, L.-Y.; Wu, X.; Wang, P. Association of erythrocyte parameters with metabolic syndrome in the pearl river delta region of china: A cross sectional study. BMJ Open 2018, 8, e019792. [Google Scholar] [CrossRef] [PubMed]
- Kuhn, V.; Diederich, L.; Keller, T.C.S.; Kramer, C.M.; Lückstädt, W.; Panknin, C.; Suvorava, T.; Isakson, B.E.; Kelm, M.; Cortese-Krott, M.M. Red blood cell function and dysfunction: Redox regulation, nitric oxide metabolism, anemia. Antioxid. Redox Signal. 2017, 26, 718–742. [Google Scholar] [CrossRef] [PubMed]
- Datz, C.; Felder, T.K.; Niederseer, D.; Aigner, E. Iron homeostasis in the metabolic syndrome. Eur. J. Clin. Investig. 2013, 43, 215–224. [Google Scholar] [CrossRef] [PubMed]
- Møller, H.J.; Frikke-Schmidt, R.; Moestrup, S.K.; Nordestgaard, B.G.; Tybjærg-Hansen, A. Serum soluble CD163 predicts risk of type 2 diabetes in the general population. Clin. Chem. 2011, 57, 291–297. [Google Scholar] [CrossRef] [PubMed]
- Ganz, T.; Nemeth, E. Hepcidin and iron homeostasis. Biochim. Biophys Acta-Mol. Cell Res. 2012, 1823, 1434–1443. [Google Scholar] [CrossRef] [PubMed]
- Nielsen, M.J.; Moestrup, S.K. Receptor targeting of hemoglobin mediated by the haptoglobins: Roles beyond heme scavenging. Blood 2009, 114, 764–771. [Google Scholar] [CrossRef] [PubMed]
- Schaer, D.J.; Schaer, C.A.; Buehler, P.W.; Boykins, R.A.; Schoedon, G.; Alayash, A.I.; Schaffner, A. CD163 is the macrophage scavenger receptor for native and chemically modified hemoglobins in the absence of haptoglobin. Blood 2006, 107, 373–380. [Google Scholar] [CrossRef] [PubMed] [Green Version]
- Parkner, T.; Sørensen, L.P.; Nielsen, A.R.; Fischer, C.P.; Bibby, B.M.; Nielsen, S.; Pedersen, B.K.; Møller, H.J. Soluble CD163: A biomarker linking macrophages and insulin resistance. Diabetologia 2012, 55, 1856–1862. [Google Scholar] [CrossRef] [PubMed]
- Lin, C.-F.; Chang, Y.-H.; Chien, S.-C.; Lin, Y.-H.; Yeh, H.-Y. Epidemiology of dyslipidemia in the Asia pacific region. Int. J. Gerontol. 2018, 12, 2–6. [Google Scholar] [CrossRef]
- Tan, C.-E.; Ma, S.; Wai, D.; Chew, S.-K.; Tai, E.-S. Can we apply the national cholesterol education program adult treatment panel definition of the metabolic syndrome to Asians? Diabetes Care 2004, 27, 1182–1186. [Google Scholar] [CrossRef] [PubMed]
- Lee, M.S.; Pen, W.H.; Liu, K.L.; Yu, M.S. Reproducibility and validity of a Chinese food frequency questionnaire used in Taiwan. Asia Pac. J. Clin. Nutr. 2006, 15, 161–169. [Google Scholar] [PubMed]
- Lee, K.; Priezzhev, A.; Shin, S.; Yaya, F.; Meglinski, I. Characterization of shear stress preventing red blood cells aggregation at the individual cell level: The temperature dependence. Clin. Hemorheol. Microcirc. 2016, 64, 853–857. [Google Scholar] [CrossRef] [PubMed]
- Barros, A.J.; Hirakata, V.N. Alternatives for logistic regression in cross-sectional studies: An empirical comparison of models that directly estimate the prevalence ratio. BMC Med. Res. Methodol. 2003, 3, 21. [Google Scholar] [CrossRef] [PubMed] [Green Version]
- Hoffmann, K.; Schulze, M.B.; Schienkiewitz, A.; Nöthlings, U.; Boeing, H. Application of a new statistical method to derive dietary patterns in nutritional epidemiology. Am. J. Epidemiol. 2004, 159, 935–944. [Google Scholar] [CrossRef] [PubMed]
- Atkinson, F.S.; Foster-Powell, K.; Brand-Miller, J.C. International tables of glycemic index and glycemic load values: 2008. Diabetes Care 2008, 31, 2281–2283. [Google Scholar] [CrossRef] [PubMed]
- Batis, C.; Mendez, M.A.; Gordon-Larsen, P.; Sotres-Alvarez, D.; Adair, L.; Popkin, B. Using both principal component analysis and reduced rank regression to study dietary patterns and diabetes in Chinese adults. Public Health Nutr. 2016, 19, 195–203. [Google Scholar] [CrossRef] [PubMed]
- Song, S.J.; Lee, J.E.; Paik, H.-Y.; Park, M.S.; Song, Y.J. Dietary patterns based on carbohydrate nutrition are associated with the risk for diabetes and dyslipidemia. Nutr. Res. Pract. 2012, 6, 349–356. [Google Scholar] [CrossRef] [PubMed]
- Baxter, A.; Coyne, T.; McClintock, C. Dietary patterns and metabolic syndrome-a review of epidemiologic evidence. Asia Pac. J. Clin. Nutr. 2006, 15, 134–142. [Google Scholar] [PubMed]
- Bédard, A.; Hudon, A.-M.; Drapeau, V.; Corneau, L.; Dodin, S.; Lemieux, S. Gender differences in the appetite response to a satiating diet. J. Obes. 2015, 2015, 140139. [Google Scholar] [CrossRef] [PubMed]
- Rolls, B.; Fedoroff, I.; Guthrie, J. Gender differences in eating behavior and body weight regulation. Health Psychol. 1991, 10, 133–142. [Google Scholar] [CrossRef] [PubMed]
- Wardle, J.; Haase, A.M.; Steptoe, A.; Nillapun, M.; Jonwutiwes, K.; Bellisie, F. Gender differences in food choice: The contribution of health beliefs and dieting. Ann. Behav. Med. 2004, 27, 107–116. [Google Scholar] [CrossRef] [PubMed]
- Wang, C.-Y.; Babitt, J.L. Hepcidin regulation in the anemia of inflammation. Curr. Opin. Hematol. 2016, 23, 189–197. [Google Scholar] [CrossRef] [PubMed] [Green Version]
- Zwadlo, G.; Voegeíi, R.; Osthoff, K.S.; Sorg, C. A monoclonal antibody to a novel differentiation antigen on human macrophages associated with the down-regulatory phase of the inflammatory process. Pathobiology 1987, 55, 295–304. [Google Scholar] [CrossRef]
- Etzerodt, A.; Maniecki, M.B.; Møller, K.; Møller, H.J.; Moestrup, S.K. Tumor necrosis factor α-converting enzyme (tace/adam17) mediates ectodomain shedding of the scavenger receptor CD163. J. Leukoc. Biol. 2010, 88, 1201–1205. [Google Scholar] [CrossRef] [PubMed]
- Le Gall, S.M.; Maretzky, T.; Issuree, P.D.; Niu, X.-D.; Reiss, K.; Saftig, P.; Khokha, R.; Lundell, D.; Blobel, C.P. Adam17 is regulated by a rapid and reversible mechanism that controls access to its catalytic site. J. Cell Sci. 2010, 123, 3913–3922. [Google Scholar] [CrossRef] [PubMed]
- Hintz, K.A.; Rassias, A.J.; Wardwell, K.; Moss, M.L.; Morganelli, P.M.; Pioli, P.A.; Givan, A.L.; Wallace, P.K.; Yeager, M.P.; Guyre, P.M. Endotoxin induces rapid metalloproteinase-mediated shedding followed by up-regulation of the monocyte hemoglobin scavenger receptor CD163. J. Leukoc. Biol. 2002, 72, 711–717. [Google Scholar] [PubMed]
- Timmermann, M.; Högger, P. Oxidative stress and 8-iso-prostaglandin f2α induce ectodomain shedding of CD163 and release of tumor necrosis factor-α from human monocytes. Free Radic. Biol. Med. 2005, 39, 98–107. [Google Scholar] [CrossRef] [PubMed]
- Chung, S.; Kim, J.-E.; Park, S.; Han, K.-S.; Kim, H.K. Neutrophil and monocyte activation markers have prognostic impact in disseminated intravascular coagulation: In vitro effect of thrombin on monocyte CD163 shedding. Thromb. Res. 2011, 127, 450–456. [Google Scholar] [CrossRef] [PubMed]
- Ijäs, P.; Nuotio, K.; Saksi, J.; Soinne, L.; Saimanen, E.; Karjalainen-Lindsberg, M.-L.; Salonen, O.; Sarna, S.; Tuimala, J.; Kovanen, P.T. Microarray analysis reveals overexpression of CD163 and ho-1 in symptomatic carotid plaques. Arterioscler. Thromb. Vasc. Biol. 2007, 27, 154–160. [Google Scholar] [CrossRef] [PubMed]


| RBC Aggregation CSS (mPa), Quartiles $ | p-Trend | ||||
|---|---|---|---|---|---|
| Q1 (n = 48) | Q2 (n = 49) | Q3 (n = 50) | Q4 (n = 49) | ||
| Age (years) | 42.13 ± 13.99 | 40.08 ± 13.00 | 41.51 ± 11.53 | 46.63 ± 10.68 | 0.055 |
| BMI (kg/m2) | 23.72 ± 4.97 | 23.12 ± 4.02 | 24.86 ± 5.61 | 27.16 ± 5.64 | 0.001 |
| Male (n, %) | 23 (47.9) | 24 (49.0) | 24 (49.8) | 24 (49.0) | 0.999 |
| Hyperlipidemia (n, %) | 15 (31.3) | 12 (24.5) | 18 (36.0) | 31 (63.3) | <0.001 |
| MetS (n, %) | 11 (22.9) | 5 (10.2) | 15 (30.0) | 22 (44.9) | 0.001 |
| Lipids | |||||
| Total C (mg/dL) | 188.44 ± 38.73 | 193.00 ± 27.01 | 200.60 ± 36.92 | 213.49 ± 41.69 | 0.005 |
| TG (mg/dL) | 99.54 ± 67.29 | 100.29 ± 63.02 | 116.18 ± 67.40 | 165.88 ± 88.67 | <0.001 |
| HDL-C (mg/dL) | 60.21 ± 15.60 | 56.33 ± 12.59 | 55.10 ± 16.48 | 53.73 ± 15.78 | 0.184 |
| LDL-C (mg/dL) | 105.83 ± 30.81 | 115.31 ± 25.52 | 120.94 ± 31.23 | 129.24 ± 35.53 | 0.003 |
| Iron | |||||
| HCT (%) | 42.28 ± 5.58 | 43.72 ± 7.13 | 42.33 ± 7.97 | 43.90 ± 8.90 | 0.577 |
| Hb (g/dL) | 14.55 ± 1.99 | 15.00 ± 2.63 | 14.44 ± 3.05 | 15.04 ± 3.18 | 0.614 |
| Free Hb (μg/mL) | 157.27 ± 49.48 | 143.84 ± 52.73 | 162.09 ± 45.42 | 154.99 ± 59.97 | 0.472 |
| SF (ng/mL) | 141.74 ± 169.22 | 131.27 ± 103.73 | 139.56 ± 167.79 | 189.90 ± 137.88 | 0.191 |
| TS (%) | 31.51 ± 12.05 | 35.01 ± 12.21 | 27.97 ± 13.75 | 25.71 ± 8.67 | 0.001 |
| Hepcidin (ng/mL) | 116.87 ± 101.17 | 151.07 ± 86.61 | 136.78 ± 102.47 | 207.19 ± 123.12 | <0.001 |
| sCD163 (ng/mL) | 761.47 ± 470.38 | 744.03 ± 411.93 | 810.59 ± 299.62 | 978.99 ± 514.13 | 0.069 |
| Univariate | Model 1 # | Model 2 $ | ||||
|---|---|---|---|---|---|---|
| ß (95% CI) | p-Value | ß (95% CI) | p-Value | ß (95% CI) | p-Value | |
| Age (years) | 0.004 (0.001–0.007) | 0.020 | 0.003 (0.000–0.006) | 0.035 | 0.001 (−0.003–0.004) | 0.713 |
| Log BMI (kg/m2) | 0.316 (0.120–0.512) | 0.002 | 0.378 (0.182–0.574) | <0.001 | 0.010 (−0.195–0.215) | 0.923 |
| Hyperlipidemia | ||||||
| Control | Ref | Ref | Ref | |||
| Hyperlipidemia | 0.169 (0.092–0.246) | <0.001 | 0.124 (0.042–0.205) | 0.003 | 0.025 (−0.061–0.110) | 0.572 |
| MetS | ||||||
| Control | Ref | Ref | ||||
| MetS | 0.151 (0.065–0.237) | 0.001 | 0.072 (−0.027–0.171) | 0.155 | ||
| Lipids | ||||||
| Log total C (mg/dL) | 0.450 (0.247–0.653) | <0.001 | 0.390 (0.192–0.587) | <0.001 | ||
| Log TG (mg/dL) | 0.144 (0.084–0.203) | <0.001 | 0.131 (0.061–0.201) | <0.001 | ||
| Log HDL-C (mg/dL) | −0.102 (−0.254–0.050) | 0.188 | ||||
| LDL-C (mg/dL) | 0.002 (0.001–0.004) | <0.001 | 0.002 (0.001–0.003) | <0.001 | 0.001 (0.000–0.002) | 0.073 |
| Iron | ||||||
| Log HCT (%) | −0.087 (−0.324–0.151) | 0.472 | ||||
| Log Hb (g/dL) | −0.104 (−0.322–0.114) | 0.350 | ||||
| Free Hb (μg/mL) | 0.000 (−0.001–0.001) | 0.896 | ||||
| Log SF (ng/mL) | 0.021 (−0.012–0.053) | 0.208 | ||||
| TS (%) | −0.006 (−0.009–0.003) | <0.001 | −0.004 (−0.007–0.001) | 0.017 | −0.006 (−0.010–0.003) | <0.001 |
| Hepcidin (ng/mL) | 0.0007 (0.0003–0.0010) | <0.001 | 0.0008 (0.0004–0.0011) | <0.001 | 0.0009 (0.0005–0.0013) | <0.001 |
| Log sCD163 (ng/mL) | 0.152 (0.071–0.233) | <0.001 | 0.119 (0.037–0.201) | 0.005 | 0.116 (0.040–0.193) | 0.003 |
| Food Group | Explained Variation (%) | Factor Loading * |
|---|---|---|
| Noodles | 12.66 | 0.38 |
| Deep-fried foods | 6.78 | 0.28 |
| Steamed/boiled/raw foods | 10.43 | −0.34 |
| Dairy products | 7.73 | −0.30 |
| Orange/red/purple vegetables | 7.49 | −0.29 |
| White/light-green vegetables | 5.39 | −0.25 |
| Seafood | 4.13 | −0.22 |
| Rice | 3.74 | −0.21 |
| Total explained variation (%): | 58.37 |
| Dietary Pattern Scores | p-Trend | |||||||
|---|---|---|---|---|---|---|---|---|
| Quartile 1 | Quartile 2 | p-Value | Quartile 3 | p-Value | Quartile 4 | p-Value | ||
| Univariate | Ref | 0.086 (−0.009–0.181) | 0.076 | 0.086 (−0.016–0.189) | 0.097 | 0.193 (0.084–0.302) | 0.001 | 0.001 |
| Model 1 * | Ref | 0.083 (−0.011–0.177) | 0.081 | 0.085 (−0.017–0.188) | 0.101 | 0.180 (0.071–0.288) | 0.001 | 0.002 |
| Model 2 # | Ref | 0.087 (−0.007–0.180) | 0.068 | 0.087 (−0.015–0.188) | 0.093 | 0.208 (0.102–0.314) | <0.001 | <0.001 |
| Model 3 $ | Ref | 0.085 (−0.004–0.174) | 0.062 | 0.062 (−0.036–0.161) | 0.214 | 0.190 (0.074–0.306) | 0.002 | 0.010 |
| Model 4 ^ | Ref | 0.065 (−0.028–0.158) | 0.167 | 0.068 (−0.032–0.168) | 0.178 | 0.155 (0.049–0.261) | 0.005 | 0.004 |
| Model 5 & | Ref | 0.069 (−0.021–0.159) | 0.131 | 0.049 (−0.049–0.146) | 0.322 | 0.158 (0.045–0.270) | 0.007 | 0.024 |
© 2018 by the authors. Licensee MDPI, Basel, Switzerland. This article is an open access article distributed under the terms and conditions of the Creative Commons Attribution (CC BY) license (http://creativecommons.org/licenses/by/4.0/).
Share and Cite
Lin, P.; Chang, C.-C.; Yuan, K.-C.; Yeh, H.-J.; Fang, S.-U.; Cheng, T.; Teng, K.-T.; Chao, K.-C.; Tang, J.-H.; Kao, W.-Y.; et al. Red Blood Cell Aggregation-Associated Dietary Pattern Predicts Hyperlipidemia and Metabolic Syndrome. Nutrients 2018, 10, 1127. https://doi.org/10.3390/nu10081127
Lin P, Chang C-C, Yuan K-C, Yeh H-J, Fang S-U, Cheng T, Teng K-T, Chao K-C, Tang J-H, Kao W-Y, et al. Red Blood Cell Aggregation-Associated Dietary Pattern Predicts Hyperlipidemia and Metabolic Syndrome. Nutrients. 2018; 10(8):1127. https://doi.org/10.3390/nu10081127
Chicago/Turabian StyleLin, Pei, Chun-Chao Chang, Kuo-Ching Yuan, Hsing-Jung Yeh, Sheng-Uei Fang, Tiong Cheng, Kai-Tse Teng, Kuo-Ching Chao, Jui-Hsiang Tang, Wei-Yu Kao, and et al. 2018. "Red Blood Cell Aggregation-Associated Dietary Pattern Predicts Hyperlipidemia and Metabolic Syndrome" Nutrients 10, no. 8: 1127. https://doi.org/10.3390/nu10081127
APA StyleLin, P., Chang, C.-C., Yuan, K.-C., Yeh, H.-J., Fang, S.-U., Cheng, T., Teng, K.-T., Chao, K.-C., Tang, J.-H., Kao, W.-Y., Lin, P.-Y., Liu, J.-S., & Chang, J.-S. (2018). Red Blood Cell Aggregation-Associated Dietary Pattern Predicts Hyperlipidemia and Metabolic Syndrome. Nutrients, 10(8), 1127. https://doi.org/10.3390/nu10081127