Red Blood Cell Aggregation-Associated Dietary Pattern Predicts Hyperlipidemia and Metabolic Syndrome
Abstract
1. Introduction
2. Materials and Methods
2.1. Participants
2.2. Definitions
2.3. Questionnaires
2.4. Anthropometric Measurements
2.5. Laboratory Measurements
2.6. Statistical Analysis
3. Results
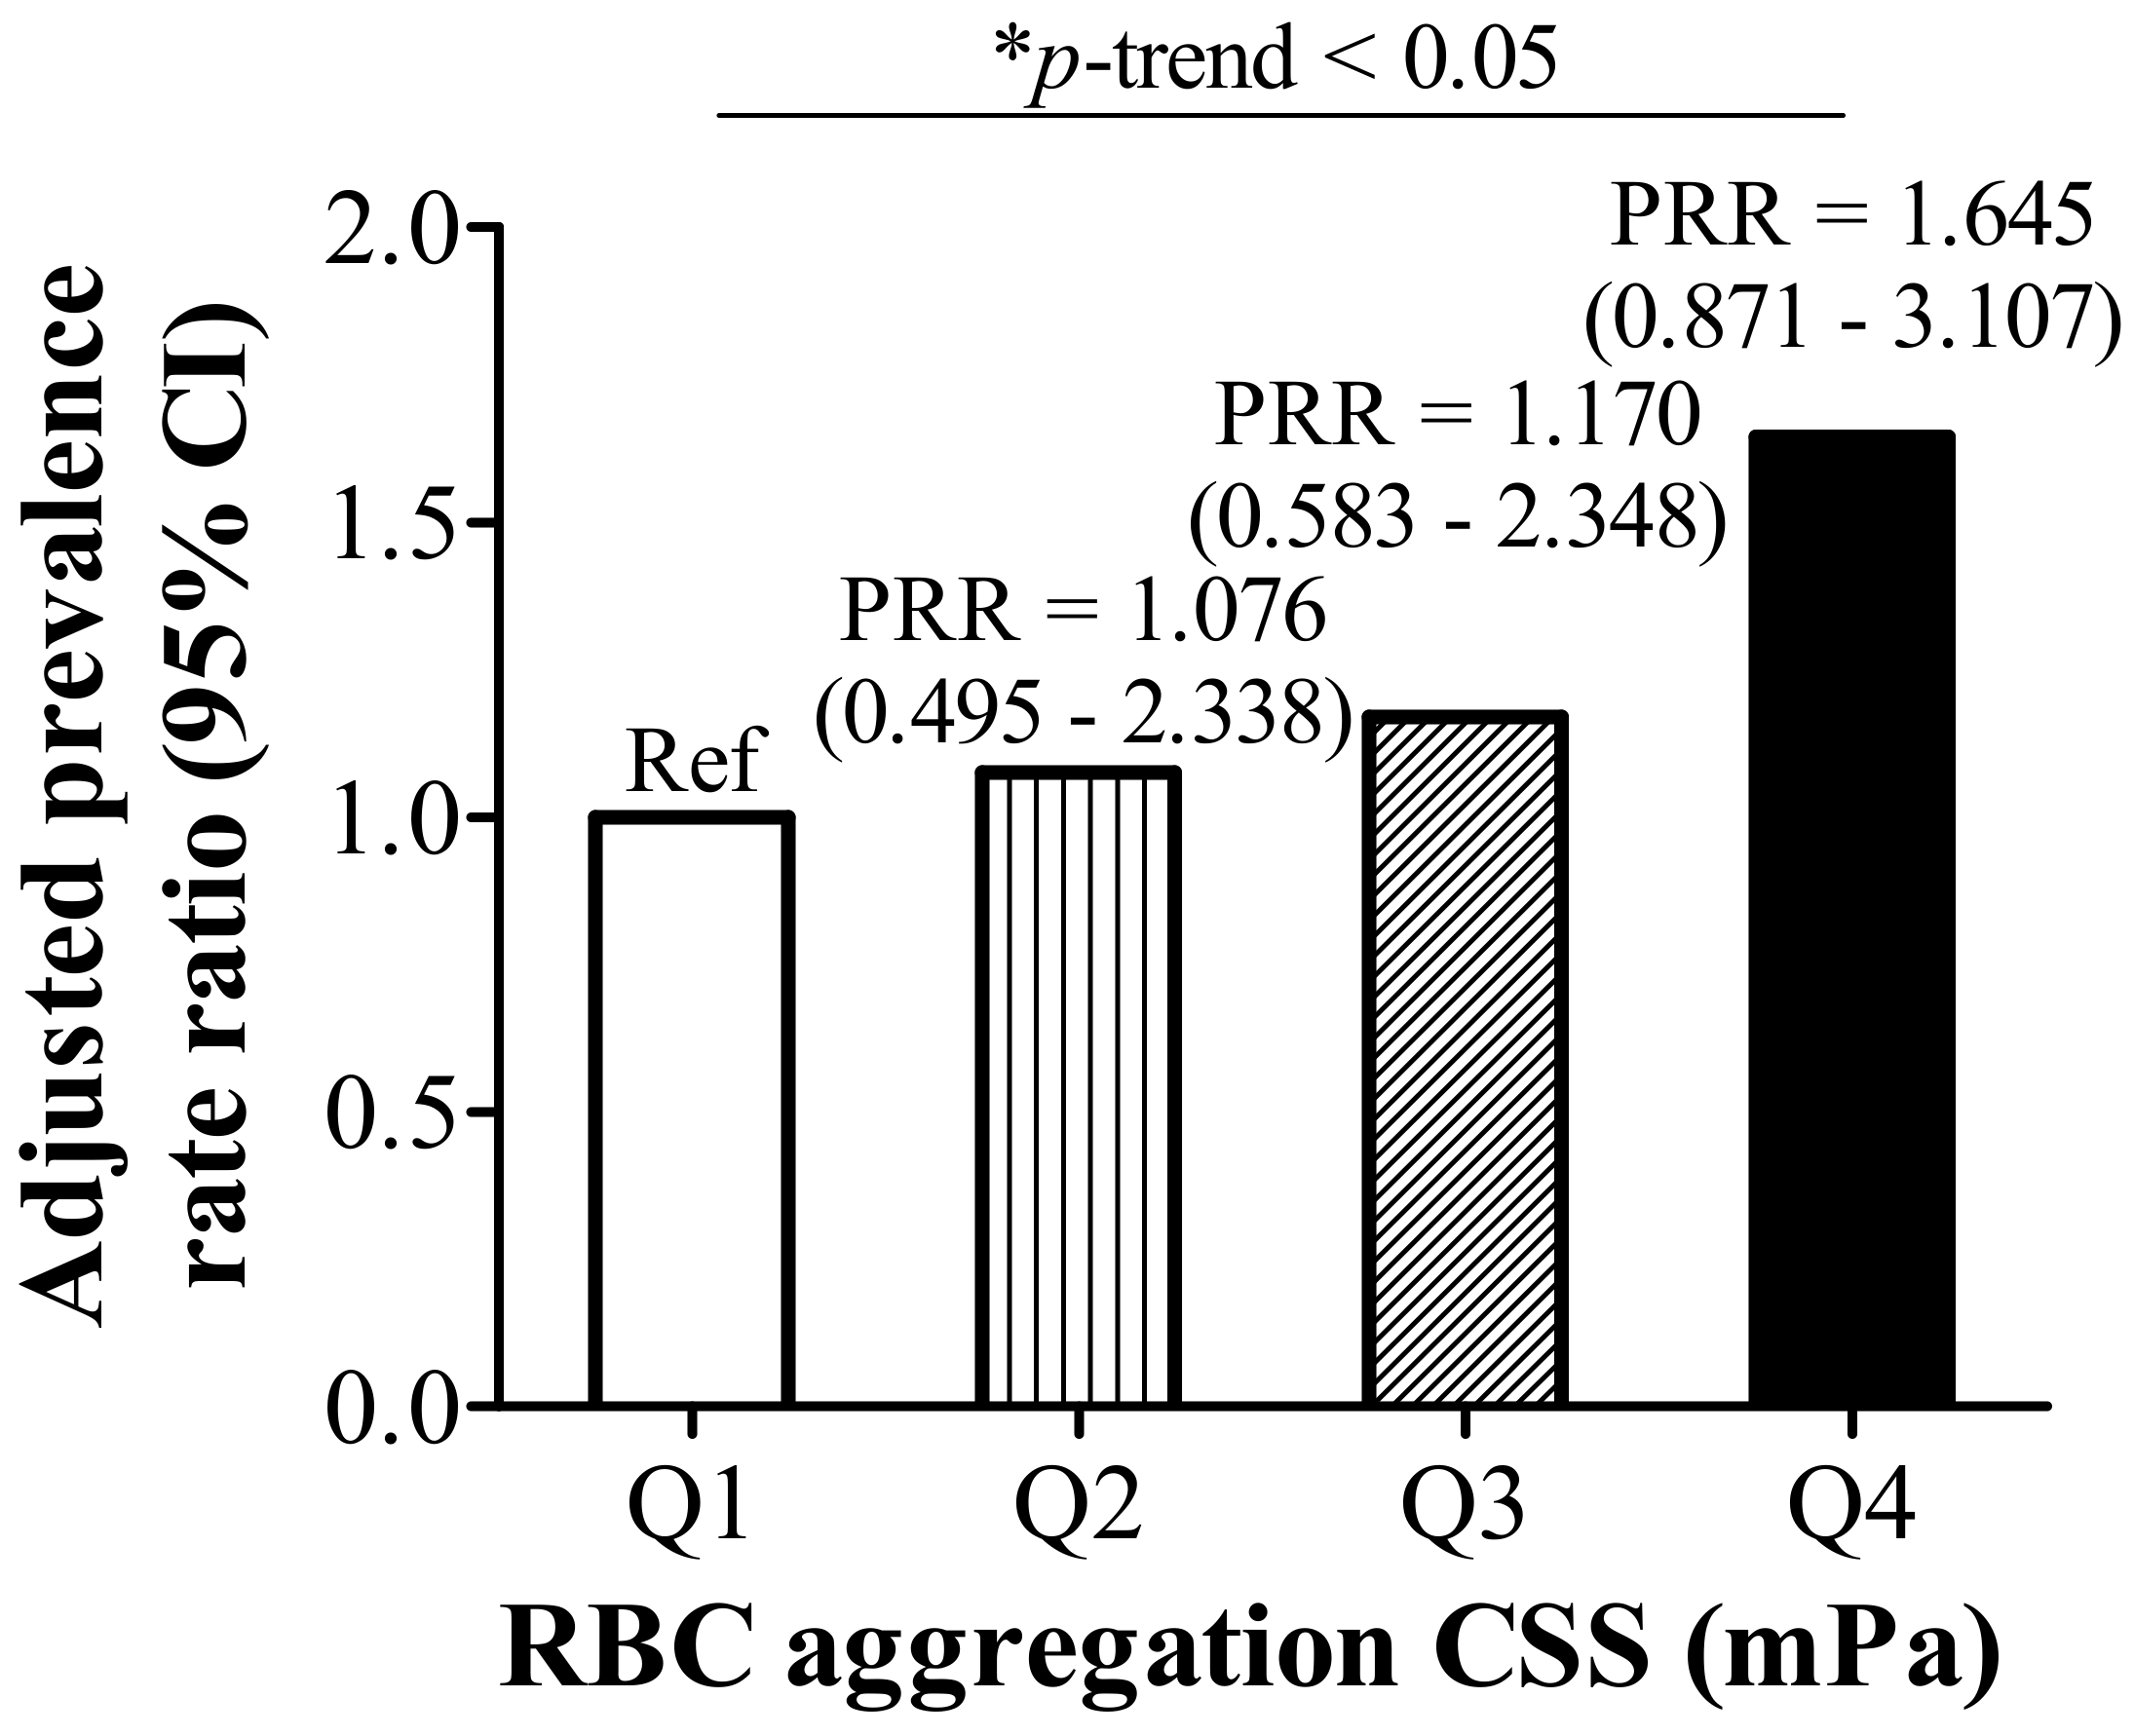
3.1. RBC Aggregation Shows a Positive Correlation with Dysregulated Iron and Is Positively Associated with Hyperlipidemia
3.2. RBC Aggregation Is Positively Correlated with Hepcidin and sCD163, but Negatively Correlated with %TS
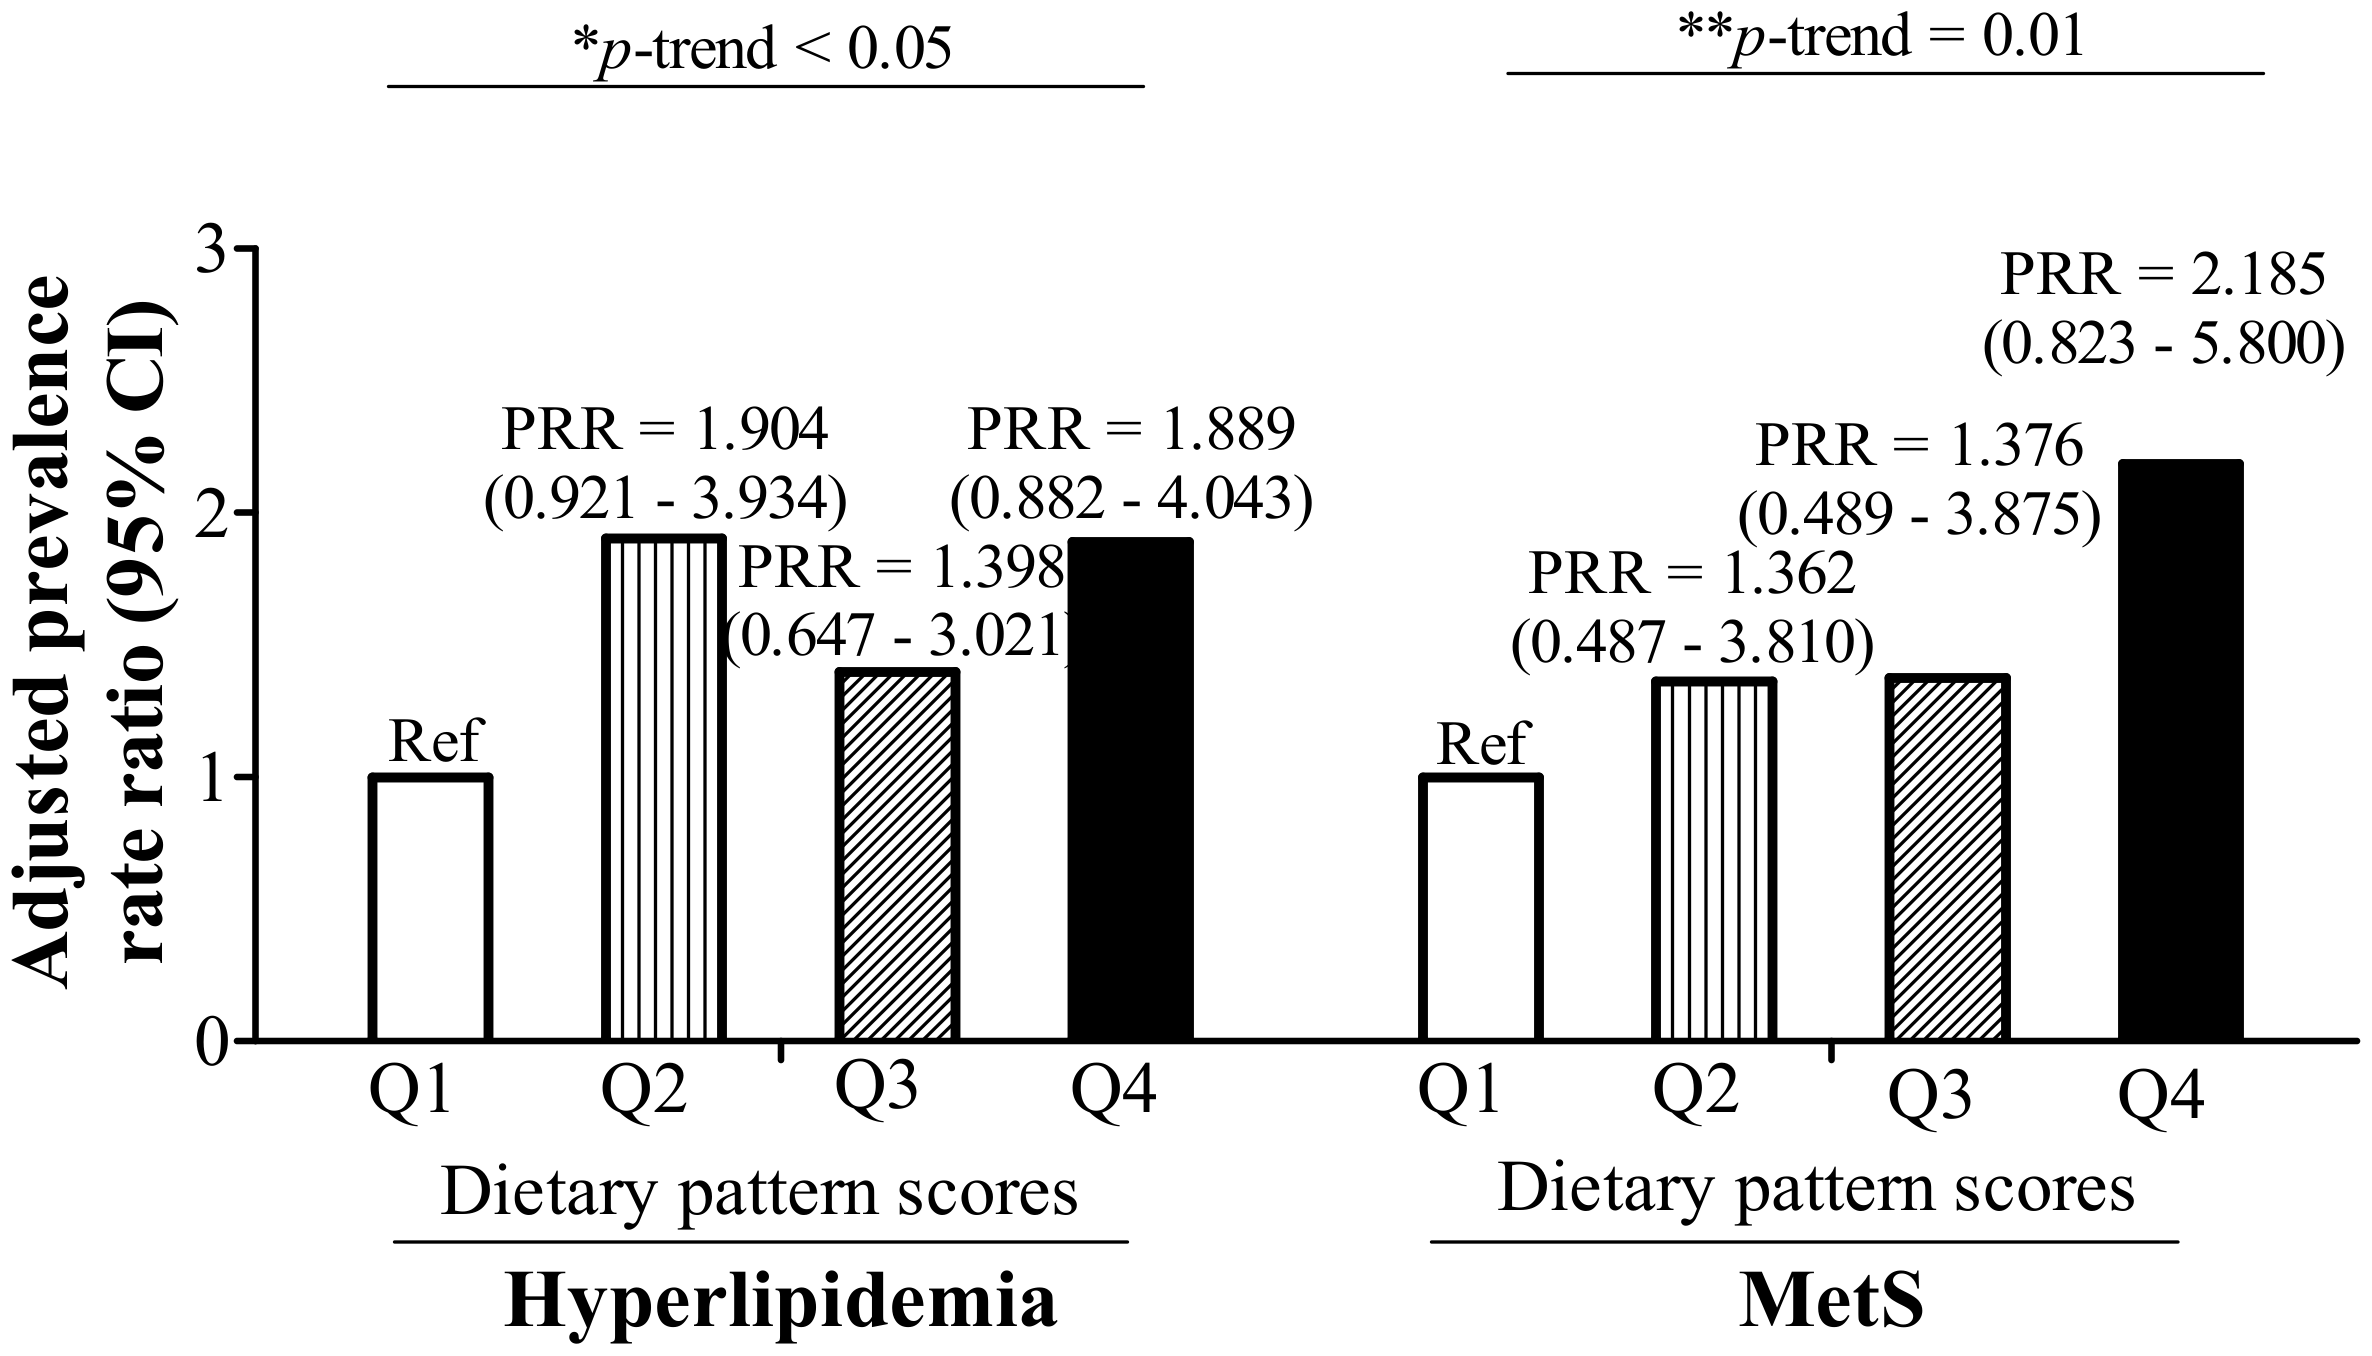
3.3. RBC Aggregation-Associated Dietary Patterns Independently Predict Hyperlipidemia and MetS
4. Discussion
5. Conclusions
Author Contributions
Funding
Acknowledgments
Conflicts of Interest
References
- Misra, A.; Shrivastava, U. Obesity and dyslipidemia in south Asians. Nutrients 2013, 5, 2708–2733. [Google Scholar] [CrossRef] [PubMed]
- Smith, G. Epidemiology of dyslipidemia and economic burden on the healthcare system. Am. J. Manag. Care 2007, 13 (Suppl. 3), S68–S71. [Google Scholar]
- Chang, H.-Y.; Yeh, W.-T.; Chang, Y.-H.; Tsai, K.-S.; Pan, W.-H. Prevalence of dyslipidemia and mean blood lipid values in taiwan: Results from the nutrition and health survey in Taiwan (NAHSIT, 1993–1996). Chin. J. Physiol. 2002, 45, 187–198. [Google Scholar] [PubMed]
- Nelson, R.H. Hyperlipidemia as a risk factor for cardiovascular disease. Prim. Care 2013, 40, 195–211. [Google Scholar] [CrossRef] [PubMed]
- Hwang, L.-C.; Bai, C.-H.; Chen, C.-J. Prevalence of obesity and metabolic syndrome in Taiwan. J. Formos. Med. Assoc. 2006, 105, 626–635. [Google Scholar] [CrossRef]
- Popp-Snijders, C.; Schouten, J.; Van Blitterswijk, W.; Van der Veen, E. Changes in membrane lipid composition of human erythrocytes after dietary supplementation of (n-3) polyunsaturated fatty acids. Maintenance of membrane fluidity. Biochim. Biophys Acta-Biomembr. 1986, 854, 31–37. [Google Scholar] [CrossRef]
- Novgorodtseva, T.P.; Karaman, Y.K.; Zhukova, N.V. The effect of high fat food on erythrocyte phospholipids, fatty acids composition and glutathione redox-system of rats with alimentary dyslipidemia. Health 2010, 2, 45–50. [Google Scholar]
- Cicha, I.; Suzuki, Y.; Tateishi, N.; Maeda, N. Enhancement of red blood cell aggregation by plasma triglycerides. Clin. Hemorheol. Microcirc. 2001, 24, 247–255. [Google Scholar] [PubMed]
- Cicha, I.; Suzuki, Y.; Tateishi, N.; Maeda, N. Effects of dietary triglycerides on rheological properties of human red blood cells. Clin. Hemorheol. Microcirc. 2004, 30, 301–305. [Google Scholar] [PubMed]
- Baskurt, O.K.; Meiselman, H.J. Seminars in thrombosis and hemostasis. In Blood Rheology and Hemodynamics; Thieme Medical Publishers, Inc.: New York, NY, USA, 2003; pp. 435–450. [Google Scholar]
- Unruh, D.; Srinivasan, R.; Benson, T.; Haigh, S.; Coyle, D.; Batra, N.; Keil, R.; Sturm, R.; Blanco, V.; Palascak, M.; et al. Red blood cell dysfunction induced by high-fat diet: Potential implications for obesity-related atherosclerosis. Circulation 2015, 132, 1898–1908. [Google Scholar] [CrossRef] [PubMed]
- Wiewiora, M.; Piecuch, J.; Glûck, M.; Slowinska-Lozynska, L.; Sosada, K. The impacts of super obesity versus morbid obesity on red blood cell aggregation and deformability among patients qualified for bariatric surgery. Clin. Hemorheol. Microcirc. 2014, 58, 543–550. [Google Scholar] [PubMed]
- Adamson, J.W. The relationship of erythropoietin and iron metabolism to red blood cell production in humans. Semin. Oncol. 1994, 21, 9–15. [Google Scholar] [PubMed]
- Smith, K.A.; Mengel, C.E. Association of iron-dextran-induced hemolysis and lipid peroxidation in mice. J. Lab. Clin. Med. 1968, 72, 505–510. [Google Scholar] [PubMed]
- Cellerino, R.; Guidi, G.; Perona, G. Plasma iron and erythrocytic glutathione peroxidase activity. Eur. J. Haematol. 1976, 17, 111–116. [Google Scholar] [CrossRef]
- Macdougall, L.G. Red cell metabolism in iron deficiency anemia: III. The relationship between glutathione peroxidase, catalase, serum vitamin e, and susceptibility of iron-deficient red cells to oxidative hemolysis. J. Pediatr. 1972, 80, 774. [Google Scholar] [CrossRef]
- Yip, R.; Mohandas, N.; Clark, M.R.; Jain, S.; Shohet, S.B.; Dallman, P.R. Red cell membrane stiffness in iron deficiency. Blood 1983, 62, 99–106. [Google Scholar] [PubMed]
- Tussing-Humphreys, L.; Pustacioglu, C.; Nemeth, E.; Braunschweig, C. Rethinking iron regulation and assessment in iron deficiency, anemia of chronic disease, and obesity: Introducing hepcidin. J. Acad. Nutr. Diet. 2012, 112, 391–400. [Google Scholar] [CrossRef] [PubMed]
- Huang, L.L.; Dou, D.-M.; Liu, N.; Wang, X.X.; Fu, L.-Y.; Wu, X.; Wang, P. Association of erythrocyte parameters with metabolic syndrome in the pearl river delta region of china: A cross sectional study. BMJ Open 2018, 8, e019792. [Google Scholar] [CrossRef] [PubMed]
- Kuhn, V.; Diederich, L.; Keller, T.C.S.; Kramer, C.M.; Lückstädt, W.; Panknin, C.; Suvorava, T.; Isakson, B.E.; Kelm, M.; Cortese-Krott, M.M. Red blood cell function and dysfunction: Redox regulation, nitric oxide metabolism, anemia. Antioxid. Redox Signal. 2017, 26, 718–742. [Google Scholar] [CrossRef] [PubMed]
- Datz, C.; Felder, T.K.; Niederseer, D.; Aigner, E. Iron homeostasis in the metabolic syndrome. Eur. J. Clin. Investig. 2013, 43, 215–224. [Google Scholar] [CrossRef] [PubMed]
- Møller, H.J.; Frikke-Schmidt, R.; Moestrup, S.K.; Nordestgaard, B.G.; Tybjærg-Hansen, A. Serum soluble CD163 predicts risk of type 2 diabetes in the general population. Clin. Chem. 2011, 57, 291–297. [Google Scholar] [CrossRef] [PubMed]
- Ganz, T.; Nemeth, E. Hepcidin and iron homeostasis. Biochim. Biophys Acta-Mol. Cell Res. 2012, 1823, 1434–1443. [Google Scholar] [CrossRef] [PubMed]
- Nielsen, M.J.; Moestrup, S.K. Receptor targeting of hemoglobin mediated by the haptoglobins: Roles beyond heme scavenging. Blood 2009, 114, 764–771. [Google Scholar] [CrossRef] [PubMed]
- Schaer, D.J.; Schaer, C.A.; Buehler, P.W.; Boykins, R.A.; Schoedon, G.; Alayash, A.I.; Schaffner, A. CD163 is the macrophage scavenger receptor for native and chemically modified hemoglobins in the absence of haptoglobin. Blood 2006, 107, 373–380. [Google Scholar] [CrossRef] [PubMed]
- Parkner, T.; Sørensen, L.P.; Nielsen, A.R.; Fischer, C.P.; Bibby, B.M.; Nielsen, S.; Pedersen, B.K.; Møller, H.J. Soluble CD163: A biomarker linking macrophages and insulin resistance. Diabetologia 2012, 55, 1856–1862. [Google Scholar] [CrossRef] [PubMed]
- Lin, C.-F.; Chang, Y.-H.; Chien, S.-C.; Lin, Y.-H.; Yeh, H.-Y. Epidemiology of dyslipidemia in the Asia pacific region. Int. J. Gerontol. 2018, 12, 2–6. [Google Scholar] [CrossRef]
- Tan, C.-E.; Ma, S.; Wai, D.; Chew, S.-K.; Tai, E.-S. Can we apply the national cholesterol education program adult treatment panel definition of the metabolic syndrome to Asians? Diabetes Care 2004, 27, 1182–1186. [Google Scholar] [CrossRef] [PubMed]
- Lee, M.S.; Pen, W.H.; Liu, K.L.; Yu, M.S. Reproducibility and validity of a Chinese food frequency questionnaire used in Taiwan. Asia Pac. J. Clin. Nutr. 2006, 15, 161–169. [Google Scholar] [PubMed]
- Lee, K.; Priezzhev, A.; Shin, S.; Yaya, F.; Meglinski, I. Characterization of shear stress preventing red blood cells aggregation at the individual cell level: The temperature dependence. Clin. Hemorheol. Microcirc. 2016, 64, 853–857. [Google Scholar] [CrossRef] [PubMed]
- Barros, A.J.; Hirakata, V.N. Alternatives for logistic regression in cross-sectional studies: An empirical comparison of models that directly estimate the prevalence ratio. BMC Med. Res. Methodol. 2003, 3, 21. [Google Scholar] [CrossRef] [PubMed]
- Hoffmann, K.; Schulze, M.B.; Schienkiewitz, A.; Nöthlings, U.; Boeing, H. Application of a new statistical method to derive dietary patterns in nutritional epidemiology. Am. J. Epidemiol. 2004, 159, 935–944. [Google Scholar] [CrossRef] [PubMed]
- Atkinson, F.S.; Foster-Powell, K.; Brand-Miller, J.C. International tables of glycemic index and glycemic load values: 2008. Diabetes Care 2008, 31, 2281–2283. [Google Scholar] [CrossRef] [PubMed]
- Batis, C.; Mendez, M.A.; Gordon-Larsen, P.; Sotres-Alvarez, D.; Adair, L.; Popkin, B. Using both principal component analysis and reduced rank regression to study dietary patterns and diabetes in Chinese adults. Public Health Nutr. 2016, 19, 195–203. [Google Scholar] [CrossRef] [PubMed]
- Song, S.J.; Lee, J.E.; Paik, H.-Y.; Park, M.S.; Song, Y.J. Dietary patterns based on carbohydrate nutrition are associated with the risk for diabetes and dyslipidemia. Nutr. Res. Pract. 2012, 6, 349–356. [Google Scholar] [CrossRef] [PubMed]
- Baxter, A.; Coyne, T.; McClintock, C. Dietary patterns and metabolic syndrome-a review of epidemiologic evidence. Asia Pac. J. Clin. Nutr. 2006, 15, 134–142. [Google Scholar] [PubMed]
- Bédard, A.; Hudon, A.-M.; Drapeau, V.; Corneau, L.; Dodin, S.; Lemieux, S. Gender differences in the appetite response to a satiating diet. J. Obes. 2015, 2015, 140139. [Google Scholar] [CrossRef] [PubMed]
- Rolls, B.; Fedoroff, I.; Guthrie, J. Gender differences in eating behavior and body weight regulation. Health Psychol. 1991, 10, 133–142. [Google Scholar] [CrossRef] [PubMed]
- Wardle, J.; Haase, A.M.; Steptoe, A.; Nillapun, M.; Jonwutiwes, K.; Bellisie, F. Gender differences in food choice: The contribution of health beliefs and dieting. Ann. Behav. Med. 2004, 27, 107–116. [Google Scholar] [CrossRef] [PubMed]
- Wang, C.-Y.; Babitt, J.L. Hepcidin regulation in the anemia of inflammation. Curr. Opin. Hematol. 2016, 23, 189–197. [Google Scholar] [CrossRef] [PubMed]
- Zwadlo, G.; Voegeíi, R.; Osthoff, K.S.; Sorg, C. A monoclonal antibody to a novel differentiation antigen on human macrophages associated with the down-regulatory phase of the inflammatory process. Pathobiology 1987, 55, 295–304. [Google Scholar] [CrossRef]
- Etzerodt, A.; Maniecki, M.B.; Møller, K.; Møller, H.J.; Moestrup, S.K. Tumor necrosis factor α-converting enzyme (tace/adam17) mediates ectodomain shedding of the scavenger receptor CD163. J. Leukoc. Biol. 2010, 88, 1201–1205. [Google Scholar] [CrossRef] [PubMed]
- Le Gall, S.M.; Maretzky, T.; Issuree, P.D.; Niu, X.-D.; Reiss, K.; Saftig, P.; Khokha, R.; Lundell, D.; Blobel, C.P. Adam17 is regulated by a rapid and reversible mechanism that controls access to its catalytic site. J. Cell Sci. 2010, 123, 3913–3922. [Google Scholar] [CrossRef] [PubMed]
- Hintz, K.A.; Rassias, A.J.; Wardwell, K.; Moss, M.L.; Morganelli, P.M.; Pioli, P.A.; Givan, A.L.; Wallace, P.K.; Yeager, M.P.; Guyre, P.M. Endotoxin induces rapid metalloproteinase-mediated shedding followed by up-regulation of the monocyte hemoglobin scavenger receptor CD163. J. Leukoc. Biol. 2002, 72, 711–717. [Google Scholar] [PubMed]
- Timmermann, M.; Högger, P. Oxidative stress and 8-iso-prostaglandin f2α induce ectodomain shedding of CD163 and release of tumor necrosis factor-α from human monocytes. Free Radic. Biol. Med. 2005, 39, 98–107. [Google Scholar] [CrossRef] [PubMed]
- Chung, S.; Kim, J.-E.; Park, S.; Han, K.-S.; Kim, H.K. Neutrophil and monocyte activation markers have prognostic impact in disseminated intravascular coagulation: In vitro effect of thrombin on monocyte CD163 shedding. Thromb. Res. 2011, 127, 450–456. [Google Scholar] [CrossRef] [PubMed]
- Ijäs, P.; Nuotio, K.; Saksi, J.; Soinne, L.; Saimanen, E.; Karjalainen-Lindsberg, M.-L.; Salonen, O.; Sarna, S.; Tuimala, J.; Kovanen, P.T. Microarray analysis reveals overexpression of CD163 and ho-1 in symptomatic carotid plaques. Arterioscler. Thromb. Vasc. Biol. 2007, 27, 154–160. [Google Scholar] [CrossRef] [PubMed]


| RBC Aggregation CSS (mPa), Quartiles $ | p-Trend | ||||
|---|---|---|---|---|---|
| Q1 (n = 48) | Q2 (n = 49) | Q3 (n = 50) | Q4 (n = 49) | ||
| Age (years) | 42.13 ± 13.99 | 40.08 ± 13.00 | 41.51 ± 11.53 | 46.63 ± 10.68 | 0.055 |
| BMI (kg/m2) | 23.72 ± 4.97 | 23.12 ± 4.02 | 24.86 ± 5.61 | 27.16 ± 5.64 | 0.001 |
| Male (n, %) | 23 (47.9) | 24 (49.0) | 24 (49.8) | 24 (49.0) | 0.999 |
| Hyperlipidemia (n, %) | 15 (31.3) | 12 (24.5) | 18 (36.0) | 31 (63.3) | <0.001 |
| MetS (n, %) | 11 (22.9) | 5 (10.2) | 15 (30.0) | 22 (44.9) | 0.001 |
| Lipids | |||||
| Total C (mg/dL) | 188.44 ± 38.73 | 193.00 ± 27.01 | 200.60 ± 36.92 | 213.49 ± 41.69 | 0.005 |
| TG (mg/dL) | 99.54 ± 67.29 | 100.29 ± 63.02 | 116.18 ± 67.40 | 165.88 ± 88.67 | <0.001 |
| HDL-C (mg/dL) | 60.21 ± 15.60 | 56.33 ± 12.59 | 55.10 ± 16.48 | 53.73 ± 15.78 | 0.184 |
| LDL-C (mg/dL) | 105.83 ± 30.81 | 115.31 ± 25.52 | 120.94 ± 31.23 | 129.24 ± 35.53 | 0.003 |
| Iron | |||||
| HCT (%) | 42.28 ± 5.58 | 43.72 ± 7.13 | 42.33 ± 7.97 | 43.90 ± 8.90 | 0.577 |
| Hb (g/dL) | 14.55 ± 1.99 | 15.00 ± 2.63 | 14.44 ± 3.05 | 15.04 ± 3.18 | 0.614 |
| Free Hb (μg/mL) | 157.27 ± 49.48 | 143.84 ± 52.73 | 162.09 ± 45.42 | 154.99 ± 59.97 | 0.472 |
| SF (ng/mL) | 141.74 ± 169.22 | 131.27 ± 103.73 | 139.56 ± 167.79 | 189.90 ± 137.88 | 0.191 |
| TS (%) | 31.51 ± 12.05 | 35.01 ± 12.21 | 27.97 ± 13.75 | 25.71 ± 8.67 | 0.001 |
| Hepcidin (ng/mL) | 116.87 ± 101.17 | 151.07 ± 86.61 | 136.78 ± 102.47 | 207.19 ± 123.12 | <0.001 |
| sCD163 (ng/mL) | 761.47 ± 470.38 | 744.03 ± 411.93 | 810.59 ± 299.62 | 978.99 ± 514.13 | 0.069 |
| Univariate | Model 1 # | Model 2 $ | ||||
|---|---|---|---|---|---|---|
| ß (95% CI) | p-Value | ß (95% CI) | p-Value | ß (95% CI) | p-Value | |
| Age (years) | 0.004 (0.001–0.007) | 0.020 | 0.003 (0.000–0.006) | 0.035 | 0.001 (−0.003–0.004) | 0.713 |
| Log BMI (kg/m2) | 0.316 (0.120–0.512) | 0.002 | 0.378 (0.182–0.574) | <0.001 | 0.010 (−0.195–0.215) | 0.923 |
| Hyperlipidemia | ||||||
| Control | Ref | Ref | Ref | |||
| Hyperlipidemia | 0.169 (0.092–0.246) | <0.001 | 0.124 (0.042–0.205) | 0.003 | 0.025 (−0.061–0.110) | 0.572 |
| MetS | ||||||
| Control | Ref | Ref | ||||
| MetS | 0.151 (0.065–0.237) | 0.001 | 0.072 (−0.027–0.171) | 0.155 | ||
| Lipids | ||||||
| Log total C (mg/dL) | 0.450 (0.247–0.653) | <0.001 | 0.390 (0.192–0.587) | <0.001 | ||
| Log TG (mg/dL) | 0.144 (0.084–0.203) | <0.001 | 0.131 (0.061–0.201) | <0.001 | ||
| Log HDL-C (mg/dL) | −0.102 (−0.254–0.050) | 0.188 | ||||
| LDL-C (mg/dL) | 0.002 (0.001–0.004) | <0.001 | 0.002 (0.001–0.003) | <0.001 | 0.001 (0.000–0.002) | 0.073 |
| Iron | ||||||
| Log HCT (%) | −0.087 (−0.324–0.151) | 0.472 | ||||
| Log Hb (g/dL) | −0.104 (−0.322–0.114) | 0.350 | ||||
| Free Hb (μg/mL) | 0.000 (−0.001–0.001) | 0.896 | ||||
| Log SF (ng/mL) | 0.021 (−0.012–0.053) | 0.208 | ||||
| TS (%) | −0.006 (−0.009–0.003) | <0.001 | −0.004 (−0.007–0.001) | 0.017 | −0.006 (−0.010–0.003) | <0.001 |
| Hepcidin (ng/mL) | 0.0007 (0.0003–0.0010) | <0.001 | 0.0008 (0.0004–0.0011) | <0.001 | 0.0009 (0.0005–0.0013) | <0.001 |
| Log sCD163 (ng/mL) | 0.152 (0.071–0.233) | <0.001 | 0.119 (0.037–0.201) | 0.005 | 0.116 (0.040–0.193) | 0.003 |
| Food Group | Explained Variation (%) | Factor Loading * |
|---|---|---|
| Noodles | 12.66 | 0.38 |
| Deep-fried foods | 6.78 | 0.28 |
| Steamed/boiled/raw foods | 10.43 | −0.34 |
| Dairy products | 7.73 | −0.30 |
| Orange/red/purple vegetables | 7.49 | −0.29 |
| White/light-green vegetables | 5.39 | −0.25 |
| Seafood | 4.13 | −0.22 |
| Rice | 3.74 | −0.21 |
| Total explained variation (%): | 58.37 |
| Dietary Pattern Scores | p-Trend | |||||||
|---|---|---|---|---|---|---|---|---|
| Quartile 1 | Quartile 2 | p-Value | Quartile 3 | p-Value | Quartile 4 | p-Value | ||
| Univariate | Ref | 0.086 (−0.009–0.181) | 0.076 | 0.086 (−0.016–0.189) | 0.097 | 0.193 (0.084–0.302) | 0.001 | 0.001 |
| Model 1 * | Ref | 0.083 (−0.011–0.177) | 0.081 | 0.085 (−0.017–0.188) | 0.101 | 0.180 (0.071–0.288) | 0.001 | 0.002 |
| Model 2 # | Ref | 0.087 (−0.007–0.180) | 0.068 | 0.087 (−0.015–0.188) | 0.093 | 0.208 (0.102–0.314) | <0.001 | <0.001 |
| Model 3 $ | Ref | 0.085 (−0.004–0.174) | 0.062 | 0.062 (−0.036–0.161) | 0.214 | 0.190 (0.074–0.306) | 0.002 | 0.010 |
| Model 4 ^ | Ref | 0.065 (−0.028–0.158) | 0.167 | 0.068 (−0.032–0.168) | 0.178 | 0.155 (0.049–0.261) | 0.005 | 0.004 |
| Model 5 & | Ref | 0.069 (−0.021–0.159) | 0.131 | 0.049 (−0.049–0.146) | 0.322 | 0.158 (0.045–0.270) | 0.007 | 0.024 |
© 2018 by the authors. Licensee MDPI, Basel, Switzerland. This article is an open access article distributed under the terms and conditions of the Creative Commons Attribution (CC BY) license (http://creativecommons.org/licenses/by/4.0/).
Share and Cite
Lin, P.; Chang, C.-C.; Yuan, K.-C.; Yeh, H.-J.; Fang, S.-U.; Cheng, T.; Teng, K.-T.; Chao, K.-C.; Tang, J.-H.; Kao, W.-Y.; et al. Red Blood Cell Aggregation-Associated Dietary Pattern Predicts Hyperlipidemia and Metabolic Syndrome. Nutrients 2018, 10, 1127. https://doi.org/10.3390/nu10081127
Lin P, Chang C-C, Yuan K-C, Yeh H-J, Fang S-U, Cheng T, Teng K-T, Chao K-C, Tang J-H, Kao W-Y, et al. Red Blood Cell Aggregation-Associated Dietary Pattern Predicts Hyperlipidemia and Metabolic Syndrome. Nutrients. 2018; 10(8):1127. https://doi.org/10.3390/nu10081127
Chicago/Turabian StyleLin, Pei, Chun-Chao Chang, Kuo-Ching Yuan, Hsing-Jung Yeh, Sheng-Uei Fang, Tiong Cheng, Kai-Tse Teng, Kuo-Ching Chao, Jui-Hsiang Tang, Wei-Yu Kao, and et al. 2018. "Red Blood Cell Aggregation-Associated Dietary Pattern Predicts Hyperlipidemia and Metabolic Syndrome" Nutrients 10, no. 8: 1127. https://doi.org/10.3390/nu10081127
APA StyleLin, P., Chang, C.-C., Yuan, K.-C., Yeh, H.-J., Fang, S.-U., Cheng, T., Teng, K.-T., Chao, K.-C., Tang, J.-H., Kao, W.-Y., Lin, P.-Y., Liu, J.-S., & Chang, J.-S. (2018). Red Blood Cell Aggregation-Associated Dietary Pattern Predicts Hyperlipidemia and Metabolic Syndrome. Nutrients, 10(8), 1127. https://doi.org/10.3390/nu10081127


