A Serological Diagnosis of Coeliac Disease Is Associated with Osteoporosis in Older Australian Adults


Abstract
1. Introduction
2. Methods
2.1. Ethics
2.2. Participants
2.3. Baseline Measures
2.4. Follow-Up Measures
2.5. Coeliac Serology and Genotype
2.6. Autoimmune Serology
2.7. Statistical Analysis
3. Results
3.1. Sample Characteristics
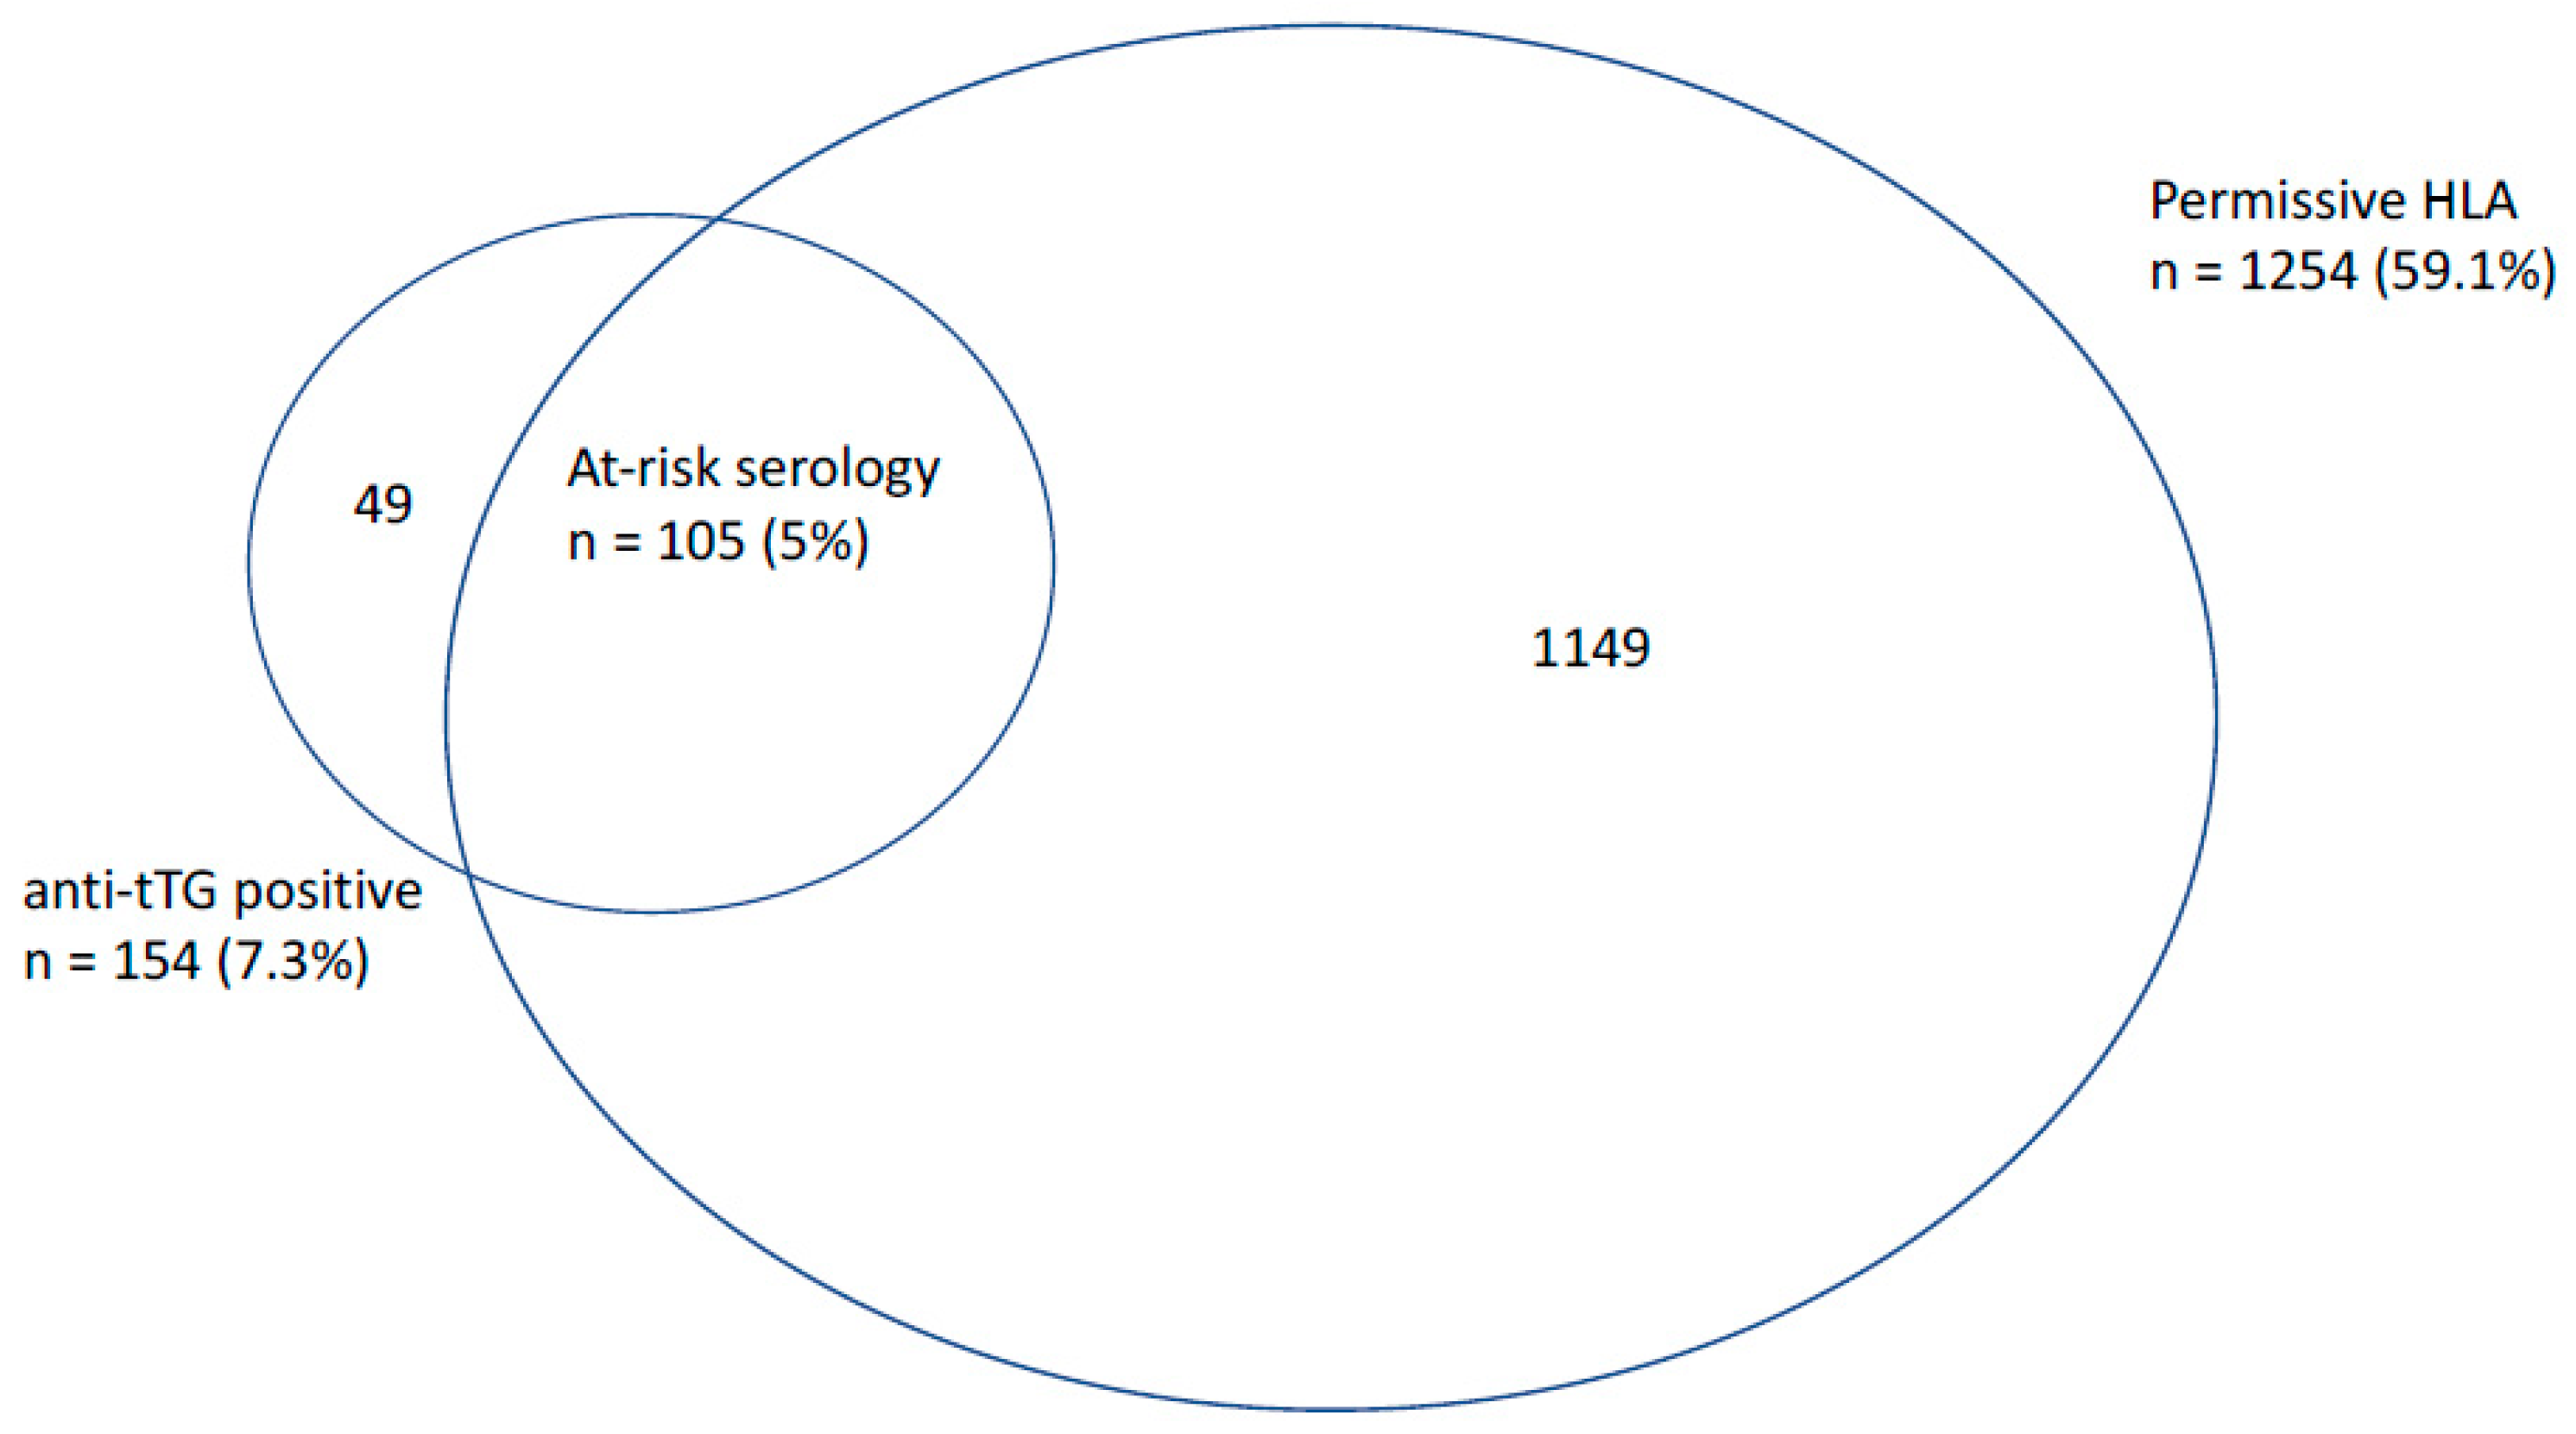
3.2. Prevalence of ‘At-Risk’ Serology, Osteoporosis, and Fracture during Follow-Up
3.3. Association between Coeliac Serology and Other Autoimmune Markers
3.4. Osteoporosis
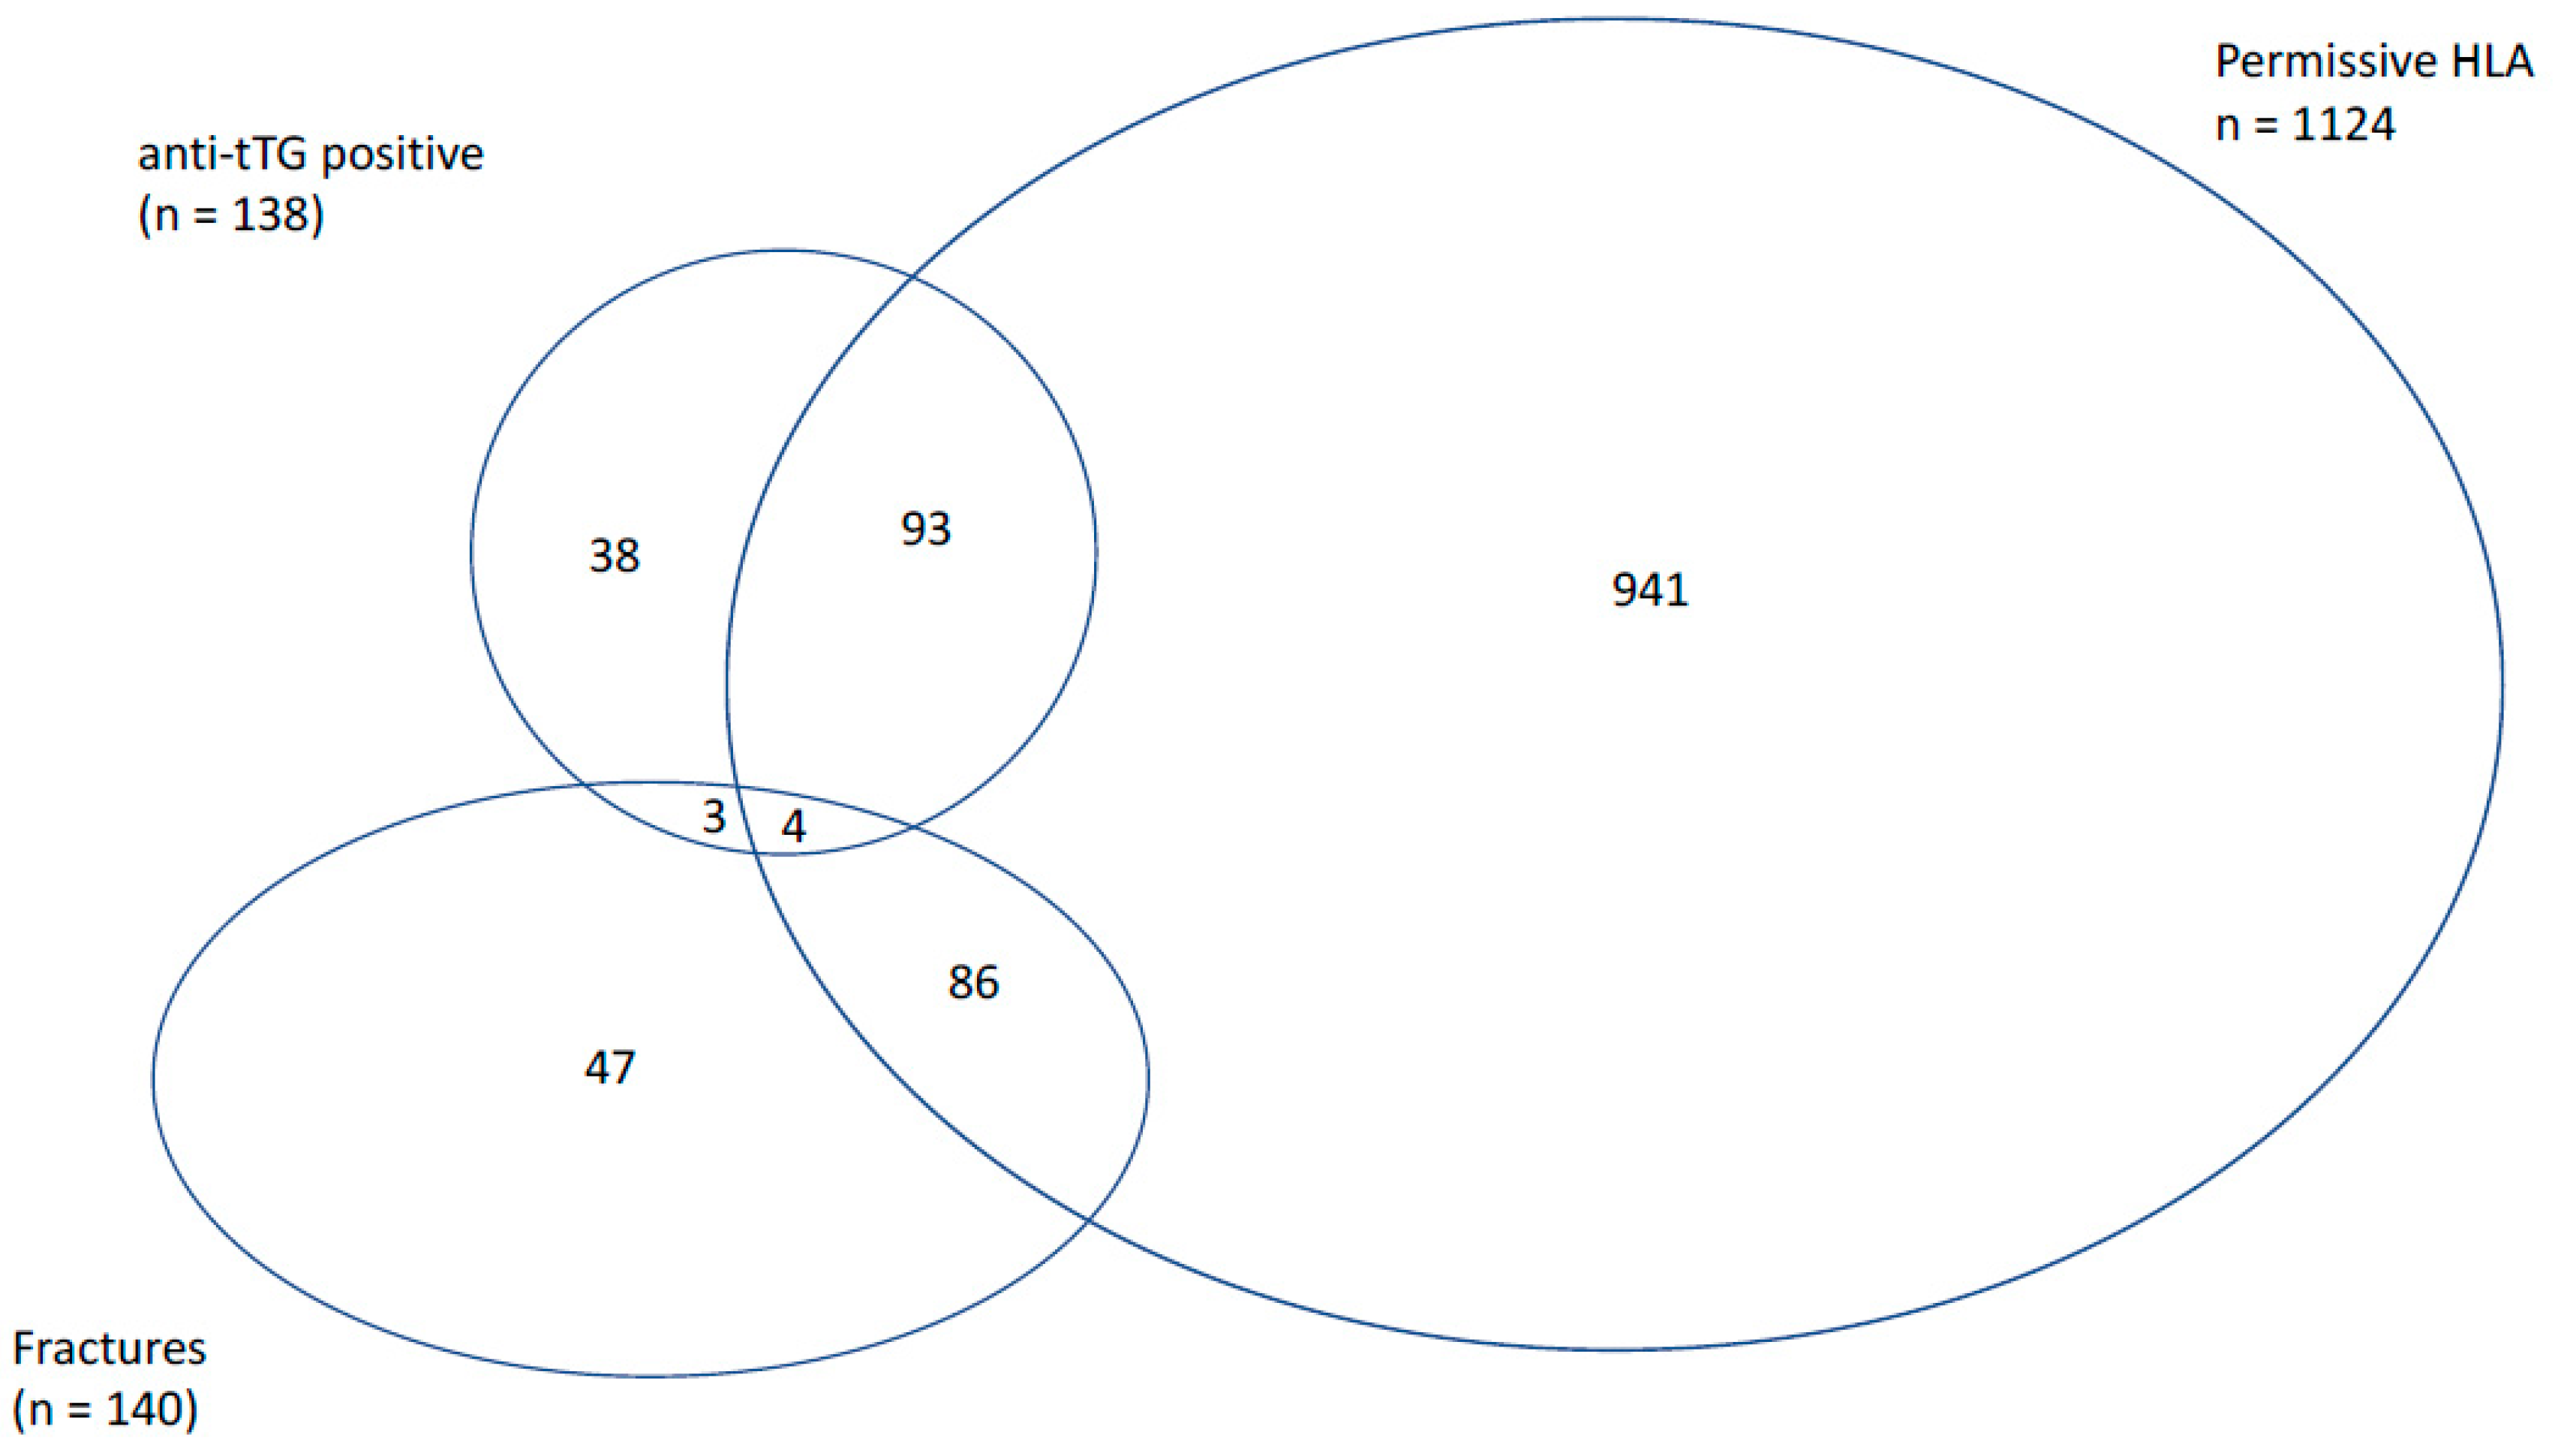
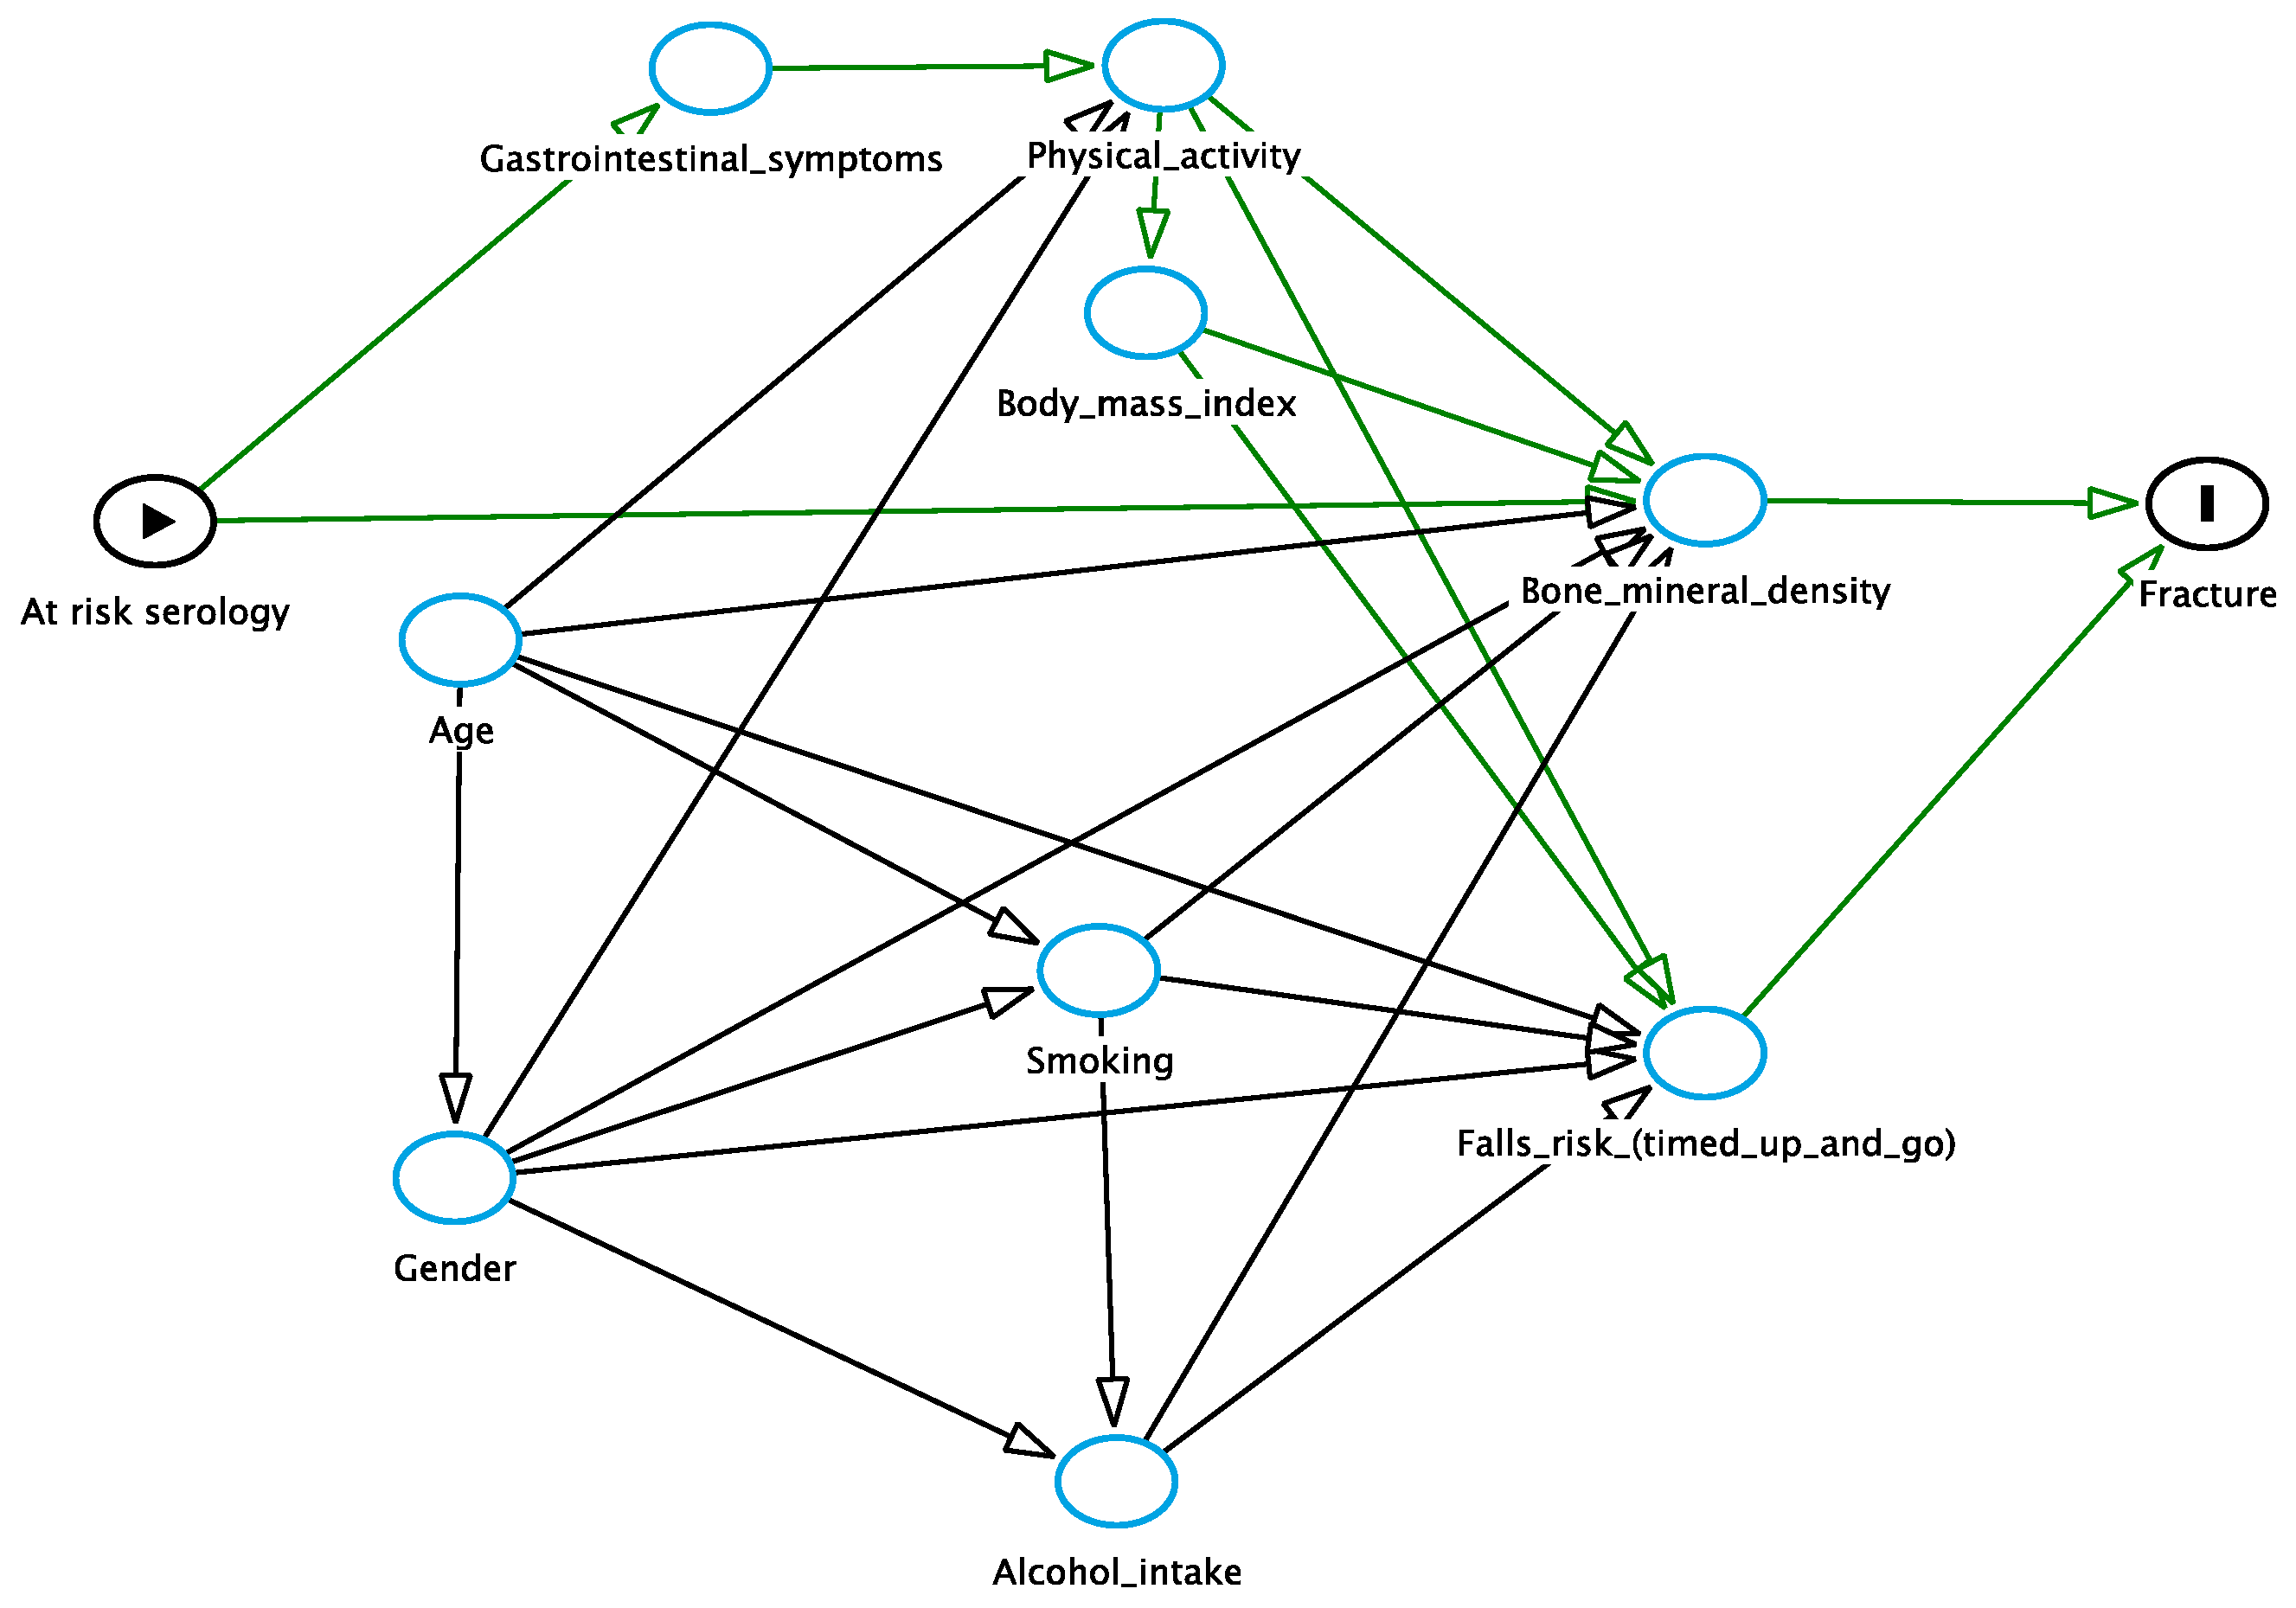
3.5. Fracture Risk
4. Discussion
5. Conclusions
Author Contributions
Funding
Conflicts of Interest
Disclosures
Appendix A

Appendix B

References
- Fasano, A.; Catassi, C. Clinical practice. Celiac disease. N. Engl. J. Med. 2012, 367, 2419–2426. [Google Scholar] [CrossRef] [PubMed]
- Walker, M.M.; Ludvigsson, J.F.; Sanders, D.S. Coeliac disease—Review of practice issues, diagnosis and management—Guidance to the guidelines. Med. J. Aust. 2017, in press. [Google Scholar] [CrossRef] [PubMed]
- Robson, K.; Alizart, M.; Martin, J.; Nagel, R. Coeliac patients are undiagnosed at routine upper endoscopy. PLoS ONE 2014, 9, e90552. [Google Scholar] [CrossRef] [PubMed]
- Hankey, G.L.; Holmes, G.K. Coeliac disease in the elderly. Gut 1994, 35, 65–67. [Google Scholar] [CrossRef] [PubMed]
- Collin, P.; Vilppula, A.; Luostarinen, L.; Holmes, G.K.T.; Kaukinen, K. Review article: Coeliac disease in later life must not be missed. Aliment. Pharmacol. Ther. 2018, 47, 563–572. [Google Scholar] [CrossRef] [PubMed]
- Vilppula, A.; Kaukinen, K.; Luostarinen, L.; Krekela, I.; Patrikainen, H.; Valve, R.; Maki, M.; Collin, P. Increasing prevalence and high incidence of celiac disease in elderly people: A population-based study. BMC Gastroenterol. 2009, 9, 49. [Google Scholar] [CrossRef] [PubMed]
- Hujoel, I.A.; Van Dyke, C.T.; Brantner, T.; Larson, J.; King, K.S.; Sharma, A.; Murray, J.A.; Rubio-Tapia, A. Natural history and clinical detection of undiagnosed coeliac disease in a north american community. Aliment. Pharmacol. Ther. 2018, 47, 1358–1366. [Google Scholar] [CrossRef] [PubMed]
- Di Stefano, M.; Mengoli, C.; Bergonzi, M.; Corazza, G.R. Bone mass and mineral metabolism alterations in adult celiac disease: Pathophysiology and clinical approach. Nutrients 2013, 5, 4786–4799. [Google Scholar] [CrossRef] [PubMed]
- Lane, N.E. Epidemiology, etiology, and diagnosis of osteoporosis. Am. J. Obstet. Gynecol. 2006, 194, S3–S11. [Google Scholar] [CrossRef] [PubMed]
- Watts, J.J.; Abimanyi-Ochom, J.; Sanders, K.M. Osteoporosis Costing All Australians a New Burden of Disease Analysis—2012 to 2022. Osteoporosis Australia. 2013. Available online: https://www.osteoporosis.org.au/sites/default/files/files/Burden%20of%20Disease%20Analysis%202012-2022.pdf (accessed on 29 June 2018).
- Lucendo, A.J.; Garcia-Manzanares, A. Bone mineral density in adult coeliac disease: An updated review. Rev. Esp. Enferm. Dig. 2013, 105, 154–162. [Google Scholar] [CrossRef] [PubMed]
- Olmos, M.; Antelo, M.; Vazquez, H.; Smecuol, E.; Maurino, E.; Bai, J.C. Systematic review and meta-analysis of observational studies on the prevalence of fractures in coeliac disease. Dig. Liver Dis. 2008, 40, 46–53. [Google Scholar] [CrossRef] [PubMed]
- Jafri, M.R.; Nordstrom, C.W.; Murray, J.A.; Van Dyke, C.T.; Dierkhising, R.A.; Zinsmeister, A.R.; Melton, L.J., 3rd. Long-term fracture risk in patients with celiac disease: A population-based study in olmsted county, minnesota. Dig. Dis. Sci. 2008, 53, 964–971. [Google Scholar] [CrossRef] [PubMed]
- McFarlane, X.A.; Bhalla, A.K.; Reeves, D.E.; Morgan, L.M.; Robertson, D.A. Osteoporosis in treated adult coeliac disease. Gut 1995, 36, 710–714. [Google Scholar] [CrossRef] [PubMed]
- Ludvigsson, J.F.; Michaelsson, K.; Ekbom, A.; Montgomery, S.M. Coeliac disease and the risk of fractures—A general population-based cohort study. Aliment. Pharmacol. Ther. 2007, 25, 273–285. [Google Scholar] [CrossRef] [PubMed]
- West, J.; Logan, R.F.; Card, T.R.; Smith, C.; Hubbard, R. Fracture risk in people with celiac disease: A population-based cohort study. Gastroenterology 2003, 125, 429–436. [Google Scholar] [CrossRef]
- Sategna-Guidetti, C.; Grosso, S.B.; Grosso, S.; Mengozzi, G.; Aimo, G.; Zaccaria, T.; Di Stefano, M.; Isaia, G.C. The effects of 1-year gluten withdrawal on bone mass, bone metabolism and nutritional status in newly-diagnosed adult coeliac disease patients. Aliment. Pharmacol. Ther. 2000, 14, 35–43. [Google Scholar] [CrossRef] [PubMed]
- Bai, J.C.; Gonzalez, D.; Mautalen, C.; Mazure, R.; Pedreira, S.; Vazquez, H.; Smecuol, E.; Siccardi, A.; Cataldi, M.; Niveloni, S.; et al. Long-term effect of gluten restriction on bone mineral density of patients with coeliac disease. Aliment. Pharmacol. Ther. 1997, 11, 157–164. [Google Scholar] [CrossRef] [PubMed]
- Passananti, V.; Santonicola, A.; Bucci, C.; Andreozzi, P.; Ranaudo, A.; Di Giacomo, D.V.; Ciacci, C. Bone mass in women with celiac disease: Role of exercise and gluten-free diet. Dig. Liver Dis. 2012, 44, 379–383. [Google Scholar] [CrossRef] [PubMed]
- Grace-Farfaglia, P. Bones of contention: Bone mineral density recovery in celiac disease—A systematic review. Nutrients 2015, 7, 3347–3369. [Google Scholar] [CrossRef] [PubMed]
- Ludvigsson, J.F.; Bai, J.C.; Biagi, F.; Card, T.R.; Ciacci, C.; Ciclitira, P.J.; Green, P.H.; Hadjivassiliou, M.; Holdoway, A.; van Heel, D.A.; et al. Diagnosis and management of adult coeliac disease: Guidelines from the british society of gastroenterology. Gut 2014, 63, 1210–1228. [Google Scholar] [CrossRef] [PubMed]
- Lebwohl, B.; Michaelsson, K.; Green, P.H.; Ludvigsson, J.F. Persistent mucosal damage and risk of fracture in celiac disease. J. Clin. Endocrinol. Metab. 2014, 99, 609–616. [Google Scholar] [CrossRef] [PubMed]
- McEvoy, M.; Smith, W.; D’Este, C.; Duke, J.; Peel, R.; Schofield, P.; Scott, R.; Byles, J.; Henry, D.; Ewald, B.; et al. Cohort profile: The hunter community study. Int. J. Epidemiol. 2010, 39, 1452–1463. [Google Scholar] [CrossRef] [PubMed]
- Holologic. Sahara Clinical Bone Sonometer. 2000. Available online: http://www.alpha-imaging.com/files/document%20library/hologic/hologic%20brochures/hologic%20sahara%20brochure.pdf (accessed on 29 June 2018).
- WHO. Who Scientific Group on the Assessment of Osteoporosis at Primary Health Care Level; WHO: Geneva, Switzerland, 2007. [Google Scholar]
- Podsiadlo, D.; Richardson, S. The timed “up & go”: A test of basic functional mobility for frail elderly persons. J. Am. Geriatr. Soc. 1991, 39, 142–148. [Google Scholar] [PubMed]
- National Health and Medical Research Council. Australian Alcohol Guidelines, Health Risks and Benefits; National Health and Medical Research Council: Canberra, Australia, 2001.
- Delaneau, O.; Zagury, J.F.; Marchini, J. Improved whole-chromosome phasing for disease and population genetic studies. Nat. Methods 2013, 10, 5–6. [Google Scholar] [CrossRef] [PubMed]
- Attia, J.R.; Oldmeadow, C.; Holliday, E.G.; Jones, M.P. Deconfounding confounding part 2: Using directed acyclic graphs (dags). Med. J. Aust. 2017, 206, 480–483. [Google Scholar] [CrossRef] [PubMed]
- Anderson, R.P.; Henry, M.J.; Taylor, R.; Duncan, E.L.; Danoy, P.; Costa, M.J.; Addison, K.; Tye-Din, J.A.; Kotowicz, M.A.; Knight, R.E.; et al. A novel serogenetic approach determines the community prevalence of celiac disease and informs improved diagnostic pathways. BMC Med. 2013, 11, 188. [Google Scholar] [CrossRef] [PubMed]
- Hill, I.D. What are the sensitivity and specificity of serologic tests for celiac disease? Do sensitivity and specificity vary in different populations? Gastroenterology 2005, 128, S25–S32. [Google Scholar] [CrossRef] [PubMed]
- Hill, P.G.; Holmes, G.K. Coeliac disease: A biopsy is not always necessary for diagnosis. Aliment. Pharmacol. Ther. 2008, 27, 572–577. [Google Scholar] [CrossRef] [PubMed]
- Rostom, A.; Dube, C.; Cranney, A.; Saloojee, N.; Sy, R.; Garritty, C.; Sampson, M.; Zhang, L.; Yazdi, F.; Mamaladze, V.; et al. The diagnostic accuracy of serologic tests for celiac disease: A systematic review. Gastroenterology 2005, 128, S38–S46. [Google Scholar] [CrossRef] [PubMed]
- Sardy, M.; Csikos, M.; Geisen, C.; Preisz, K.; Kornsee, Z.; Tomsits, E.; Tox, U.; Hunzelmann, N.; Wieslander, J.; Karpati, S.; et al. Tissue transglutaminase elisa positivity in autoimmune disease independent of gluten-sensitive disease. Clin. Chim. Acta 2007, 376, 126–135. [Google Scholar] [CrossRef] [PubMed]
- Alper, A.; Rojas-Velasquez, D.; Pashankar, D.S. Prevalence of anti-tissue transglutaminase (tTG) antibodies and celiac disease in children with IBD. J. Pediatr. Gastroenterol. Nutr. 2017, 66, 934–936. [Google Scholar] [CrossRef] [PubMed]
- Watanabe, C.; Komoto, S.; Hokari, R.; Kurihara, C.; Okada, Y.; Hozumi, H.; Higashiyama, M.; Sakuraba, A.; Tomita, K.; Tsuzuki, Y.; et al. Prevalence of serum celiac antibody in patients with IBD in japan. J. Gastroenterol. 2014, 49, 825–834. [Google Scholar] [CrossRef] [PubMed]
- Castillo, N.E.; Theethira, T.G.; Leffler, D.A. The present and the future in the diagnosis and management of celiac disease. Gastroenterol. Rep. 2015, 3, 3–11. [Google Scholar] [CrossRef] [PubMed]
- Sood, A.; Khurana, M.S.; Mahajan, R.; Midha, V.; Puri, S.; Kaur, A.; Gupta, N.; Sharma, S. Prevalence and clinical significance of IgA anti-tissue transglutaminase antibodies in patients with chronic liver disease. J. Gastroenterol. Hepatol. 2017, 32, 446–450. [Google Scholar] [CrossRef] [PubMed]
- Bizzaro, N.; Villalta, D.; Tonutti, E.; Doria, A.; Tampoia, M.; Bassetti, D.; Tozzoli, R. Iga and igg tissue transglutaminase antibody prevalence and clinical significance in connective tissue diseases, inflammatory bowel disease, and primary biliary cirrhosis. Dig. Dis. Sci. 2003, 48, 2360–2365. [Google Scholar] [CrossRef] [PubMed]
- Kanis, J.A. Diagnosis of osteoporosis and assessment of fracture risk. Lancet 2002, 359, 1929–1936. [Google Scholar] [CrossRef]
- Napthali, K.; Boyle, M.; Tran, H.; Schofield, P.W.; Peel, R.; McEvoy, M.; Oldmeadow, C.; Attia, J. Thyroid antibodies, autoimmunity and cognitive decline: Is there a population-based link? Dement. Geriatr. Cogn. Dis. Extra 2014, 4, 140–146. [Google Scholar] [CrossRef] [PubMed]
- Walker, M.M.; Ludvigsson, J.F.; Sanders, D.S. Coeliac disease: Review of diagnosis and management. Med. J. Aust. 2017, 207, 173–178. [Google Scholar] [CrossRef] [PubMed]
- Holmes, G.K.T.; Hill, P.G. Coeliac disease: Further evidence that biopsy is not always necessary for diagnosis. Eur. J. Gastroenterol. Hepatol. 2017, 29, 1189–1190. [Google Scholar] [CrossRef] [PubMed]
- Duerksen, D.R.; Leslie, W.D. Positive celiac disease serology and reduced bone mineral density in adult women. Can. J. Gastroenterol. 2010, 24, 103–107. [Google Scholar] [CrossRef] [PubMed]
- Mora, S.; Barera, G.; Ricotti, A.; Weber, G.; Bianchi, C.; Chiumello, G. Reversal of low bone density with a gluten-free diet in children and adolescents with celiac disease. Am. J. Clin. Nutr. 1998, 67, 477–481. [Google Scholar] [CrossRef] [PubMed]
- Kumar, M.; Rastogi, A.; Bhadada, S.K.; Bhansali, A.; Vaiphei, K.; Kochhar, R. Effect of zoledronic acid on bone mineral density in patients of celiac disease: A prospective, randomized, pilot study. Indian J. Med. Res. 2013, 138, 882–887. [Google Scholar] [PubMed]
- Nuti, R.; Martini, G.; Valenti, R.; Giovani, S.; Salvadori, S.; Avanzati, A. Prevalence of undiagnosed coeliac syndrome in osteoporotic women. J. Intern. Med. 2001, 250, 361–366. [Google Scholar] [CrossRef] [PubMed]
- Heikkila, K.; Pearce, J.; Maki, M.; Kaukinen, K. Celiac disease and bone fractures: A systematic review and meta-analysis. J. Clin. Endocrinol. Metab. 2015, 100, 25–34. [Google Scholar] [CrossRef] [PubMed]
- Agardh, D.; Bjorck, S.; Agardh, C.D.; Lidfeldt, J. Coeliac disease-specific tissue transglutaminase autoantibodies are associated with osteoporosis and related fractures in middle-aged women. Scand. J. Gastroenterol. 2009, 44, 571–578. [Google Scholar] [CrossRef] [PubMed]
- Cosman, F.; de Beur, S.J.; LeBoff, M.S.; Lewiecki, E.M.; Tanner, B.; Randall, S.; Lindsay, R.; National Osteoporosis, F. Clinician’s guide to prevention and treatment of osteoporosis. Osteoporos. Int. 2014, 25, 2359–2381. [Google Scholar] [CrossRef] [PubMed]
- Moayyeri, A.; Adams, J.E.; Adler, R.A.; Krieg, M.A.; Hans, D.; Compston, J.; Lewiecki, E.M. Quantitative ultrasound of the heel and fracture risk assessment: An updated meta-analysis. Osteoporos. Int. 2012, 23, 143–153. [Google Scholar] [CrossRef] [PubMed]
- Nayak, S.; Olkin, I.; Liu, H.; Grabe, M.; Gould, M.K.; Allen, I.E.; Owens, D.K.; Bravata, D.M. Meta-analysis: Accuracy of quantitative ultrasound for identifying patients with osteoporosis. Ann. Intern. Med. 2006, 144, 832–841. [Google Scholar] [CrossRef] [PubMed]
- Henry, M.J.; Pasco, J.A.; Nicholson, G.C.; Kotowicz, M.A. Prevalence of osteoporosis in Australian men and women: Geelong osteoporosis study. Med. J. Aust. 2011, 195, 321–322. [Google Scholar] [CrossRef] [PubMed]


| OP—%(95% CI) | No OP—%(95% CI) | Odds Ratio (95% CI) | |
|---|---|---|---|
| At-risk serology | 11.3 (3.7–18.8) | 4.7 (3.8–5.7) | 2.56 (1.19–5.49) |
| Anti-tTG (IU/mL); mean (SD) | 20.3 (50.4) | 11.1 (31.0) | 1.01 (1.00–1.01) |
| Positive anti-tTG | 15.5 (6.9–24.1) | 7.0 (5.9–8.1) | 2.44 (1.26–4.75) |
| Positive HLA | 63.4 (51.9–74.9) | 59.0 (56.8–61.1) | 1.20 (0.74–1.97) |
| Age (years); mean (SD) | 80.2 (7.4) | 75.8 (7.2) | 1.08 (1.05–1.11) |
| BMI (kg/m2); mean (SD) | 27.3 (5.3) | 28.8 (4.9) | 0.93 (0.88–0.98) |
| Gender (male) | 36.6 (25.1–48.1) | 50.4 (48.3–52.6) | 0.57 (0.35–0.93) |
| Current smoker | 6.1 (5.1–7.2) | 9.9 (2.8–17.0) | 1.67 (0.75–3.72) |
| Hazardous alcohol intake | 1.4 (0.0–4.2) | 9.7 (8.4–10.9) | 0.13 (0.02–0.97) |
| Physical activity (step count per day); mean (SD) | 6160 (5106–7216) | 6700 (6530–6871) | 1.00 (1.00–1.00) |
| Odds Ratio | 95% CI | p Value | |
|---|---|---|---|
| At-risk serology | 3.09 | 1.32–7.23 | 0.009 |
| BMI | 0.94 | 0.89–1.00 | 0.04 |
| Gender (male) | 0.51 | 0.29–0.89 | 0.02 |
| Current smoking | 3.22 | 1.36–7.61 | 0.008 |
| Hazardous alcohol intake | 0.22 | 0.30–1.66 | 0.14 |
| Age | 1.08 | 1.04–1.12 | <0.001 |
| Fracture—% (95% CI) | No Fracture—% (95% CI) | Odds Ratio (95% CI) | |
|---|---|---|---|
| Osteoporosis (baseline) | 10.0 (5.0–15.0) | 3.0 (2.2–3.8) | 3.6 (1.9–6.7) |
| At-risk serology | 2.9 (0.1–5.7) | 5.3 (4.3–6.4) | 0.52 (0.19–1.44) |
| Anti-tTG (IU/mL); mean (SD) | 8.0 (5.1–10.8) | 11.6 (10.1–13.2) | 0.99 (0.98–1.00) |
| Positive anti-tTG | 5.0 (1.3–8.7) | 7.5 (6.3–8.8) | 0.64 (0.30–1.41) |
| Positive HLA | 6.4 (5.6–7.2) | 5.9 (5.7–6.2) | 1.2 (0.9–1.8) |
| Positive tTG with non-permissive HLA | 2.3 (−0.3–4.6) | 2.2 (1.5–2.9) | 0.98 (0.30–3.22) |
| Age (years); mean (SD) | 80.4 (79.0–81.7) | 76.0 (75.6–76.3) | 1.08 (1.06–1.11) |
| BMI (kg/m2); mean (SD) | 28.9 (27.9–29.9) | 28.9 (28.6–29.1) | 1.00 (0.97–1.04) |
| Gender (male) | 33.6 (25.7–41.5) | 51.7 (49.3–54.0) | 0.47 (0.33–0.68) |
| Current smoker | 5.0 (1.3–8.7) | 6.0 (4.9–7.1) | 0.83 (0.38–1.82) |
| Hazardous alcohol intake | 7.1 (2.8–11.5) | 9.8 (8.4–11.2) | 0.71 (0.36–1.37) |
| Physical activity (step count per day); mean | 6282 (5554–7101) | 6615 (6433–6797) | 1.00 (1.00–1.00) |
| Timed up and go test (seconds) | 10.7 (10.0–11.4) | 9.9 (8.8–11.1) | 1.00 (1.00–1.01) |
© 2018 by the authors. Licensee MDPI, Basel, Switzerland. This article is an open access article distributed under the terms and conditions of the Creative Commons Attribution (CC BY) license (http://creativecommons.org/licenses/by/4.0/).
Share and Cite
Potter, M.D.E.; Walker, M.M.; Hancock, S.; Holliday, E.; Brogan, G.; Jones, M.; McEvoy, M.; Boyle, M.; Talley, N.J.; Attia, J. A Serological Diagnosis of Coeliac Disease Is Associated with Osteoporosis in Older Australian Adults. Nutrients 2018, 10, 849. https://doi.org/10.3390/nu10070849
Potter MDE, Walker MM, Hancock S, Holliday E, Brogan G, Jones M, McEvoy M, Boyle M, Talley NJ, Attia J. A Serological Diagnosis of Coeliac Disease Is Associated with Osteoporosis in Older Australian Adults. Nutrients. 2018; 10(7):849. https://doi.org/10.3390/nu10070849
Chicago/Turabian StylePotter, Michael D. E., Marjorie M. Walker, Stephen Hancock, Elizabeth Holliday, Gregory Brogan, Michael Jones, Mark McEvoy, Michael Boyle, Nicholas J. Talley, and John Attia. 2018. "A Serological Diagnosis of Coeliac Disease Is Associated with Osteoporosis in Older Australian Adults" Nutrients 10, no. 7: 849. https://doi.org/10.3390/nu10070849
APA StylePotter, M. D. E., Walker, M. M., Hancock, S., Holliday, E., Brogan, G., Jones, M., McEvoy, M., Boyle, M., Talley, N. J., & Attia, J. (2018). A Serological Diagnosis of Coeliac Disease Is Associated with Osteoporosis in Older Australian Adults. Nutrients, 10(7), 849. https://doi.org/10.3390/nu10070849