Article

Association between Dietary Inflammatory Index, C-Reactive Protein and Metabolic Syndrome: A Cross-Sectional Study

1
Department of Nutrition and Food Hygiene, School of Public Health, Peking University Health Science Center, Beijing 100191, China
2
Department of Social Science and Health Education, School of Public Health, Peking University Health Science Center, Beijing 100191, China
3
Inner Mongolia Dairy Technology Research Institute Co. Ltd., Hohhot 010110, China
4
Yili Innovation Center, Inner Mongolia Yili Industrial Group Co. Ltd., Hohhot 010110, China
*
Author to whom correspondence should be addressed.
Nutrients 2018, 10(7), 831; https://doi.org/10.3390/nu10070831
Submission received: 29 May 2018 / Revised: 23 June 2018 / Accepted: 25 June 2018 / Published: 27 June 2018

Abstract

:
Increased prevalence of metabolic syndrome (MetS) has become a global major public health problem. Chronic low-grade inflammation associated with diet was found to play an import role in the development of MetS, although further studies are needed. The main purpose of this study was to explore the association between the dietary inflammatory index (DII), C-reactive protein (CRP) as a sign of inflammation status, and MetS. A total of 1712 participants from eight cities in China were included. Sociodemographic and health-related information was collected by a self-administrated questionnaire. Anthropometric information and fasting blood samples were collected for identification of MetS. DII scores were computed based on one time 24-h dietary recall. No significant association between MetS and DII was observed except for the blood pressure component of MetS (OR T3 versus T1 = 1.40; 95% CI: 1.03 to 1.89). A significant increased prevalence for MetS was observed for higher CRP (OR = 1.66; 95% CI: 1.26 to 2.18), as well as four out of five of MetS components. In stratified analyses by sex, the associations between DII/CRP and MetS among women, but not men, are comparable to the whole sample. In addition, Both the 2nd and 3rd tertile of the DII had a higher CRP level (β-Coefficients T2 versus T1 = 0.086, 95% CI: 0.004 to 0.167; β-Coefficients T3 versus T1 = 0.145, 95% CI: 0.045 to 0.245) among subjects with MetS. Participants with higher DII scores reported a higher degree of “Shanghuo” (p = 0.007), which is a traditional concept characterized by “redness, swelling, fever and pain” in Chinese Medicine. This study suggested a close association between CRP and MetS, while the association between the DII and MetS was limited. DII was only specifically associated with CRP at a higher level among participants with MetS.

1. Introduction

The metabolic syndrome (MetS), defined as a complex of risk factors including elevated blood glucose levels, elevated triglyceride levels, reduced high-density lipoprotein cholesterol (HDL-c) levels, raised blood pressure, and obesity, has become a global public health problem [1]. Although the average figures remain difficult to evaluate due to the varying definitions and population distribution, the prevalence of MetS varies between 20% and 45% according to epidemiological studies from different countries [2]. The situation in China is not optimistic as a recent study reported that the average prevalence of MetS was 33.9% (31.0% in men and 36.8% in women) for 31 provinces of China in 2010 [3].
Even though researchers have proposed that insulin resistance played a causative role and central obesity was a highly possible early step in the development of MetS, the cause of MetS remains unclear to us [4]. Recent studies implicated that inflammation, especially chronic low-grade inflammation, might play an even greater role [5]. One possible mechanism is that the growth of adipose tissue and infiltration of immune cells lead to the increase of pro-inflammatory adipokines such as tumor necrosis factor alpha (TNF-α), C-reactive protein (CRP), and interleukin-6 (IL-6) [6,7,8,9], which cause increased insulin resistance from insulin-sensitive tissues by decreasing insulin signaling [10,11]. In addition, other components of MetS, such as dyslipidemia, glucose intolerance and hypertension were also found to be co-mechanisms with inflammation [5]. MetS raises major public health concerns as it is a known risk factor of cardiovascular diseases, in which immune mechanisms interact with metabolic risk factors to dominate and accelerate progression of lesions [12].
Diet has been demonstrated as an important lifestyle factor associated with MetS. Most previous studies were mainly concerned with the over nutrition of unhealthy dietary patterns, especially with high consumption of fat (energy-dense), which causes the imbalance of energy [13,14]. In addition, epidemiologic and clinical studies focused on the effects of diet on inflammation [15]. For example, higher consumption of meat-instant foods (rich in animal protein, saturated fat, sweets, sodium and food additives) was found to be significantly associated with CRP and MetS [16]. In a dietary study of individuals with MetS, the intake of saturated fats was associated with IL-1 Ra [17].
To improve the specificity for inflammation of dietary scores, the Dietary Inflammatory Index (DII) was first developed in 2009 [18] and then updated in 2014 [19] in order to evaluate the inflammatory potential of diet on a continuum. Two components will be taken into account in the evaluation of DII: statistically inflammatory potential and personal intake of specific food parameters, both of which can represent important sources of variability [20]. The relevance of the DII scores in the association between inflammation and cardio-metabolic diseases such as cardiovascular disease (CVD), MetS, and mortality has been critically reviewed and the DII seems to be a useful tool [20,21]. However, to date, no such studies have been performed in China.
In addition, from the perspective of traditional Chinese medicine (TCM), it is widely believed that the status of Shanghuo of the human body is closely related to diet, which in turn is related to health status. Shanghuo, characterized by “redness, swelling, fever, and pain”, usually occurs in infectious diseases especially in the middle and late period, and also exists in some non-infectious diseases such as autoimmune or endocrine diseases [22]. Considering that Shanghuo has symptoms similar to inflammation [23], in this study we also regard Shanghuo as a sign of inflammation.
Thus, our main objective was to explore the association between the DII and the prevalence of MetS among adults in eight cities in China. The secondary objective was to investigate whether CRP, as one of the inflammatory factors, has a possible mediation effect between them. Further, we also aimed to evaluate whether the DII is simply associated with the self-reported frequency of Shanghuo.

2. Methods

2.1. Subjects

This study is a sub-research of the Chinese Urban Adults Diet and Health study (CUADHS), which was conducted in eight cities in China from March to July 2016. The details of recruitment of subjects in this research have been described elsewhere [24]. Briefly, eight cities were purposively selected according to their geographical position and economy level. The convenience sampling method was then used to select two communities in each first-tier city (Beijing and Guangzhou) and one community in every non-first tier city (Chengdu, Chenzhou, Jilin, Lanzhou, Wuhu and Xuchang). Next, based on resident registration, a random sampling method was used to identify potential participants. Eligible subjects were ages 18–75 years old and natives of an urban area or having lived in urban areas for at least 1 year. A total of 1806 subjects were invited and 1739 of them were subsequently included with a response rate of 96.3%. At least 60, 60 and 50 residents were included for three age groups in every community: 18–44 years, 45–64 years, and >65 years, respectively. In accordance with the purpose of this study and its required data, 27 subjects were excluded due to missing responses in dietary records. Finally, the sample size of Beijing, Guangzhou, Chengdu, Chenzhou, Jilin, Lanzhou, Wuhu and Xuchang was 326, 326, 168, 173, 165, 175, 196 and 183, respectively.

2.2. Data Collection

Interviewers were trained to effectively collect baseline sociodemographic information using an interviewer-administered questionnaire. At the same time information was collected about self-reported health-related status such as physical activity status, smoking status and the frequency of “Shanghuo” (Never, Sometimes or Often/always). We used one-time 24-h dietary recall to collect information about daily food consumption with the help of a standard reference picture book, bowls, plates, and spoons. Nutrients intake was calculated according to a food composition database derived from the Chinese Food Composition (CFC) tables of 2004 and 2009 [25,26]. Standard protocols were used to take anthropometric measurements consisting of blood pressure, height, weight, and waist circumference. In addition, fasting blood samples were obtained to determine serum triglycerides, HDL-c, glucose and CRP by glycerol phosphate oxidase methods, directed methods, glucose oxidase methods and immunoturbidimetry, respectively, by a single qualified laboratory (Lawke Health Laboratory, Beijing, China).

2.3. Calculation of DII Scores

The details of the DII can be found elsewhere [19]. Briefly, a total of 1943 published studies were reviewed to assign an “inflammatory effect score” for 45 food parameters. A “world” mean and standard deviation was then established from 11 databases based on actual human consumption for each parameter. Raw food parameter intakes were calculated from the 24-h dietary recall record and were first standardized by subtracting the “world” mean and dividing by the “world” standard deviation, and then converted to percentile scores. The adjusted scores were multiplied by 2 and subtracted 1 to establish symmetrical distributions which centered on 0 and were bounded between −1 and +1. The centred percentile score for each parameter was then multiplied by its corresponding “inflammatory effect score”, and finally summed to obtain the overall DII score. Available food parameters in this study included: carbohydrate; protein; total fat; saturated, monounsaturated and polyunsaturated fatty acids; fibre; cholesterol; niacin; thiamine; riboflavin; folic acid; vitamins A, B6, B12, C and E; iron; magnesium; selenium; and zinc. The nutrient density method (intake per 1000 kcal of energy) was used to decrease the influence of the different energy intake among subjects [27].

2.4. Identification of the Metabolic Syndrome

MetS was identified as conforming to at least three of the following criteria according the 2009 Joint Interim Statement [1]: elevated waist circumference (≥90 cm for men, ≥80 cm for women), elevated triglycerides (≥1.7 mmol/L or drug treatment), reduced HDL-c (<1.0 mmol/L for men, <1.3 mmol/L for women or drug treatment), raised blood pressure (systolic blood pressure [SBP] ≥130 and/or diastolic blood pressure [DBP] ≥85 mm Hg or drug treatment), and elevated fasting glucose (glycaemia ≥5.6 mmol/L or drug treatment). A total of 1690 participants were eligible for determination of their MetS status in this study.

2.5. Ethics

This study was implemented in accordance with the Declaration of Helsinki. Ethical approval for research procedures was granted by the Medical Ethics Research Board of Peking University (No. IRB00001052-15059). Participation was voluntary and participants signed an informed consent document after being told the details of the study.

2.6. Statistical Analysis
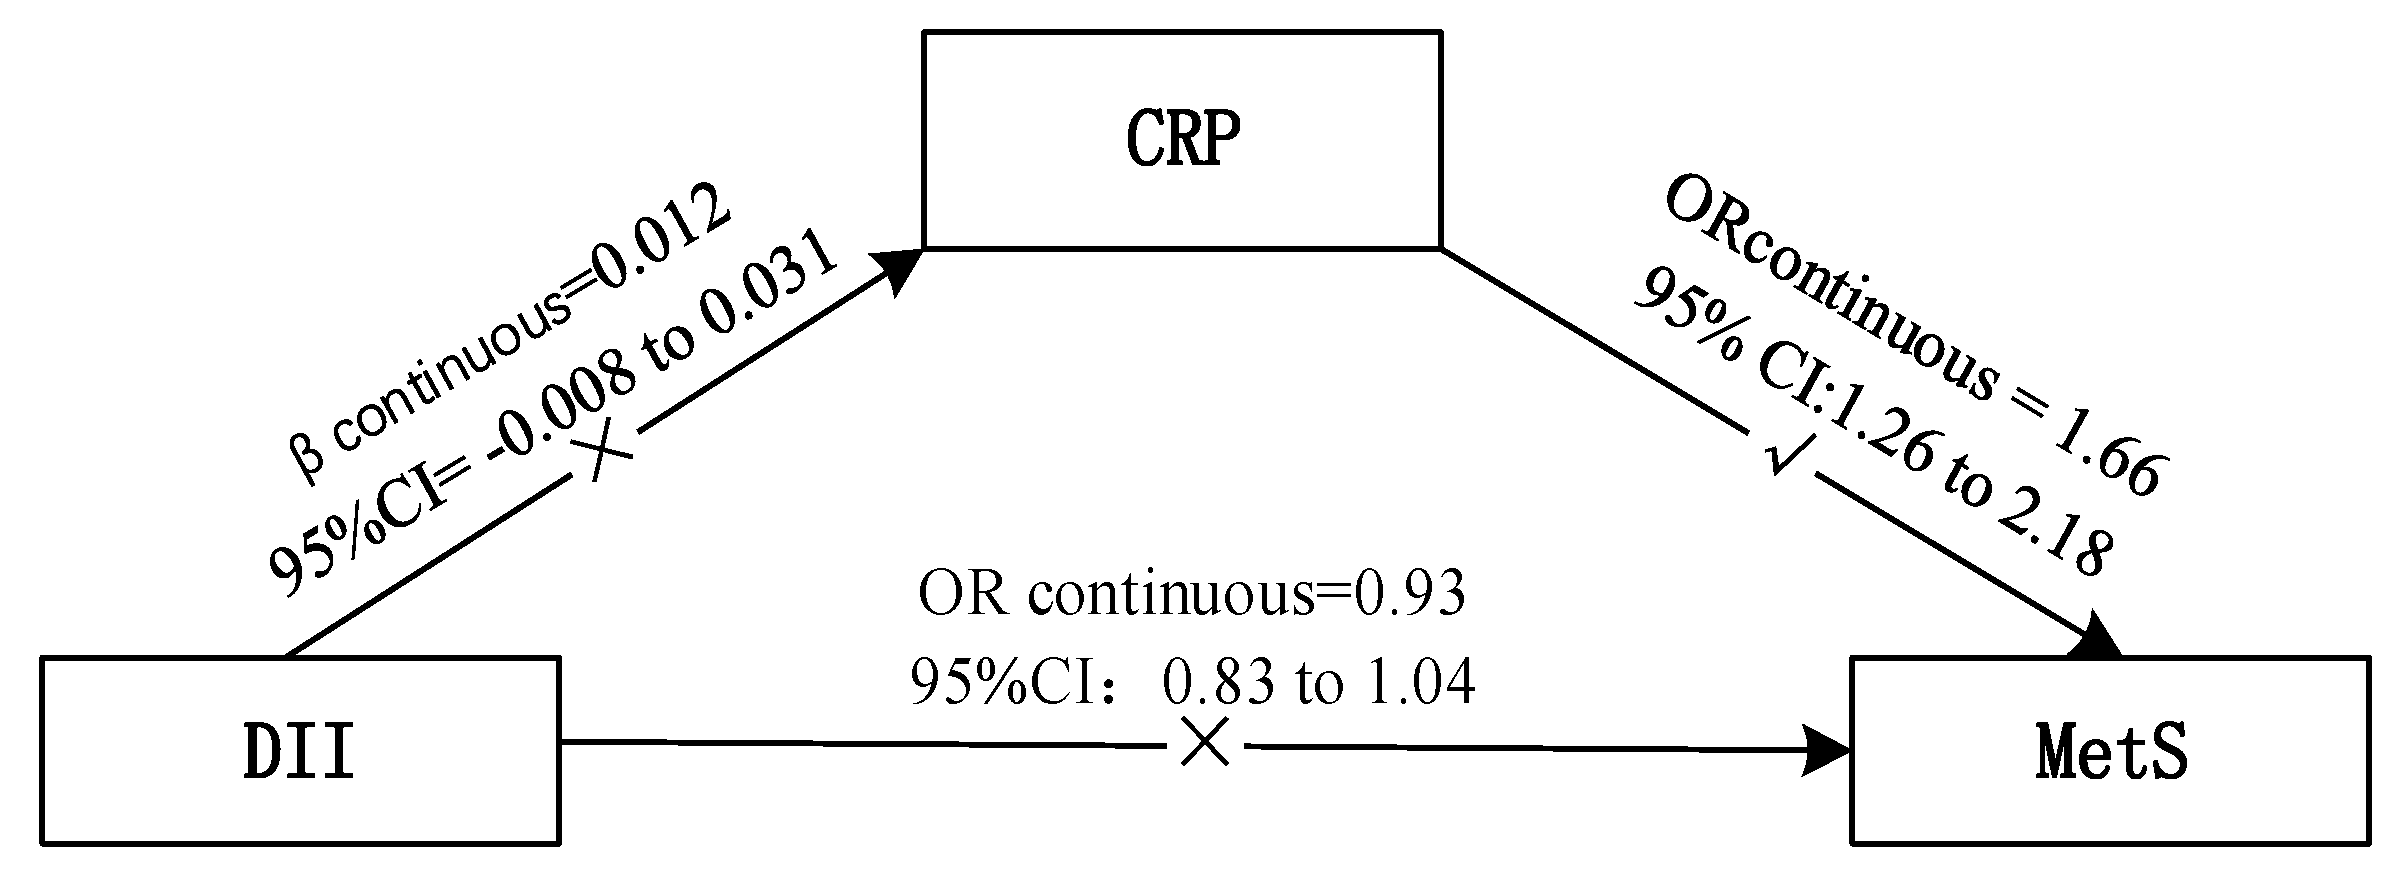
Analyses were performed using IBM SPSS version 20.0 (International Business Machines Corporation, Armonk, NY, USA). DII scores were transformed to tertiles (Tertile 1 = −3.50 to 0.04; Tertile 2 = 0.05 to 1.11; Tertile 1 = 1.12 to 3.49). Normality for continuous data was tested before analysis. Values for serum CRP were log-transformed to improve normality. Descriptive statistics were presented as mean (standard deviation), P50th (P25th, P75th) or percentage. For single factor analysis, Chi-squared analysis or One-way ANOVA test were used for categorical or continuous confounding variables across tertiles of DII scores, respectively. Kruskal-Wallis tests were used for nutrients intakes across tertiles of DII. Binary logistic regression was carried out to explore the association between tertiles of DII scores/continuous CRP and dichotomous MetS outcomes, as well as dichotomous independent components of MetS. Linear regression was used to assess the relationship between tertiles of DII scores and serum CRP levels. In addition, the DII scores were analyzed as a continuous form. The multivariate analyses were also stratified by sex. The following confounding factors were included in the multivariate analysis according to baseline differences across DII tertiles with a p ≤ 0.20: age, gender, city, family monthly expenditure on food, smoking status and BMI. In addition, educational level was also included as a potential confounder according to an extensive review of related literature. The Chi-squared analysis was used to simply estimate the association between DII and the frequency of Shanghuo. The level of statistical significance in the study was set to p < 0.05.
Finally, for the purpose of optimizing the robustness of the statistical tests, we performed sensitivity analyses after removing participants who self-reported that they had changed their dietary habits. A total of 1319 subjects were eligible for inclusion in the supplementary analyses.

3. Results

A total of 1712 adults from eight cities in China were analyzed in this study, including 582 males and 1130 females, with an average age of 50.4 ± 17.4 years. The DII scores ranged from −3.50 (most anti-inflammatory) to 3.49 (most pro-inflammatory), and the mean ± standard deviation was 0.46 ± 1.16.

3.1. Baseline Characteristics

Baseline characteristics of tertiles of DII scores are shown in Table 1. Compared with the lowest DII score tertile (T1), subjects with the highest DII scores (T3) were younger, and more of them were males, spent less on food and lived in south of China, especially in Chengdu, Chenzhou or Wuhu.
Table 2 shows the macro- and micro-nutrients intakes according to tertiles of the DII. A higher DII score was significantly associated with higher intake of total fat and monounsaturated fatty acids, lower intake of carbohydrate, protein, polyunsaturated fatty acids, fiber, niacin, thiamine, riboflavin, folic acid, vitamins A, B6, B12, C, and E, iron, magnesium, selenium, and zinc (p < 0.05).

3.2. Incidence of MetS and DII/CRP

No significant association was observed between the prevalence of MetS or its individual components and DII, except for the blood pressure component for DII T3 compared to T1(OR T3 versus T1 = 1.40; 95% CI: 1.03 to 1.89), after considering confounding variables including age, gender, city, education level, family monthly expenditure on food, smoking status and BMI (Table 3).
A significantly increased prevalence of MetS was observed for higher CRP (OR = 1.66; 95% CI: 1.26 to 2.18), as well as for four out of five MetS components as follows (Table 3): waist component (OR = 1.91; 95% CI: 1.36 to 2.66); HDL component (OR = 1.64; 95% CI: 1.27 to 2.11); triglycerides component (OR = 1.44; 95% CI: 1.12 to 1.85) and glucose component (OR = 1.73; 95% CI: 1.34 to 2.24).
The results of stratified analysis by sex are shown in Table 4. Similar associations were found among women: A significant association was observed for the blood pressure component of MetS for DII T3 compared to T1(OR T3 versus T1 = 1.72; 95% CI: 1.15 to 2.56); In addition, a significantly increased prevalence of MetS was observed for higher CRP (OR = 2.17; 95% CI: 1.49 to 3.15), as well as for four out of five of MetS components as follows: waist component (OR = 1.85; 95% CI: 1.20 to 2.88); HDL component (OR = 1.77; 95% CI: 1.31 to 2.38); triglycerides component (OR = 1.86; 95% CI: 1.33 to 2.60) and glucose component (OR = 1.69; 95% CI: 1.21 to 2.37). Among men, no significant association was observed except for the association between the glucose component and higher CRP (OR = 1.79; 95% CI: 1.17 to 2.73).
In supplementary analyses, conducted after removing participants who self-reported that they had changed their dietary habits, findings were similar (Table S1).

3.3. DII and CRP

No statistically significant mean differences for CRP were observed between the upper and lower DII tertiles among all subjects (Table 5), after adjusting for confounding variables. The same was true when using the continuous form of DII.
When the data were stratified based on whether the participants had MetS, compared with T1, both the 2nd and 3rd tertiles of the DII had a higher CRP level (β-Coefficients T2 versus T1 = 0.086, 95% CI: 0.004–0.167; β-Coefficients T3 versus T1 = 0.145, 95% CI: 0.045–0.245) among subjects with MetS. The same was true when using the continuous form of DII (β-Coefficients = 0.040, 95% CI: 0.010–0.069). Among subjects without MetS, no significant differences were observed (Table 5). When the data were stratified by sex, no significant association between CRP and DII was observed in both men and women (Table S2).
In supplementary analyses, the differences were only significant when using the continuous form of DII among subjects with MetS (Table S3).

3.4. DII and the Frequency of “Shanghuo”

Among participants with highest DII scores (T3), the self-reported percentages of experiencing never, sometimes and often/always “Shanghuo” in the past six months were 11.8%, 59.5% and 28.7%, respectively. Among participants with median DII scores (T2), the corresponding percentages were 12.9%, 59.1% and 28.0%. Among T1, the corresponding percentages were 14.7%, 65.1% and 20.2%. Results of a Chi-squared analysis showed that the differences were significant (p = 0.007).

4. Discussion

In this study, no positive association was observed between the DII and MetS except for the blood pressure component. To further understand the association between them, we also investigated whether inflammation plays a role as mediator using CRP as a representative inflammatory marker (Figure 1). The results suggested that higher CRP was linked to increased prevalence of MetS and four out of five of its components. Among subjects with MetS, higher DII scores, reflecting a more pro-inflammatory diet, were associated with higher CRP, while in the overall sample the association was not significant.
To date, there have been two prospective studies and four cross-sectional studies investigating the inflammatory effects of diet on MetS. Similar with us, in three cross-sectional studies, higher DII scores were associated with only a few individual components of the MetS, such as glucose intolerance, greater diastolic blood pressure, and lower HDL-C levels, respectively [28,29,30]. One prospective study conducted in France suggested a significant association between the DII score and MetS (adjusted ORDII quartile 4 versus 1 = 1.39, 95% CI: 1.01–1.92) after a 13-year follow-up [31]. In another prospective study, the SUN cohort from Spain [32] and one cross-sectional among Lebanese adults [33], no significant association was observed. Thus, the lack of association might be partly due to the cross-sectional design or some residual confounders. In addition, possible reasons include the difference in the numbers of food parameters, the times of 24h recall and the definitions of the MetS. The possible association between DII and the incidence of CVD, as one of the major clinical outcomes in MetS, has also been examined. For example, result of the PREDIMED study showed that the multiple-adjusted hazard ratio (HR) for each additional standard deviation of the continuous DII was 1.22 (1.06–1.40), which indicated that a pro-inflammatory diet might relate with a higher risk of CVD [34].
The existence of a significant relation between MetS and inflammation has been long acknowledged. Among a series of inflammatory factors, CRP is a special liver-derived pattern-recognition molecule that contributes to host defence [35]. The abnormal increase of CRP might stimulate liver cells and monocytes to secrete more pro-inflammatory factors, which cause serine phosphorylation of insulin receptor substrate (IRS) proteins, decreasing insulin signaling, and finally increased insulin resistance from insulin-sensitive tissue [10,11]. CRP also induces adhesion molecule expression in endothelial cells, increasing the risk of CVD [36]. In this study, we did demonstrate that CRP is related to MetS and four out of five of its individual components. The same was true with other studies conducted among Chinese patients with type 2 diabetes [37] or among low-income rural residents [38].
According to stratified analyses by sex, the associations between DII/CRP and MetS among women are comparable to our whole sample, while these associations are limited among men. There are important and complex differences in the pathophysiology, clinical presentation, and implications on cardiovascular risk of MetS in men and women [39], which are difficult to make a consensus. Consistent with the findings of our study, Michael D. Wirth et al. also found that participants with higher DII scores were more likely to meet the diagnosis of hypertension among women (OR Q4 versus Q1 = 1.19, 95% CI: 1.05 to 1.34), but not men [40]. However, decreased odds of meeting the diagnosis of hypertension and MetS overall were observed for females with higher DII scores in Alexis Sokol et al.’s study [29]. When it comes to CRP, Ming-May Lai et al.’s study showed that all components of MetS are more strongly associated with CRP in women than in man and all sex interaction were significant except for hypertension, which are in line with our study [41]. In addition, the stratified analyses among men have a relative lower statistical power to detect the true effect due to the small sample size (men comprise about 34% of the overall sample), which might be another possible explanation. Further studies are needed to obtain more evidence of the possible interaction of gender.
As for DII and CRP, Shivappa et al. reported for the first time that higher DII scores (updated DII) were significantly associated with CRP (values >3 mg/L) [42]. Other studies carried out among Iranian and Korean participants and among African Americans also showed this trend [43,44,45]. In this study, the absence of an association between the DII and CRP might be explained by the reduction in the number of food parameters. To the best of our knowledge, the shortest list used to calculate the DII was 17 food parameters reported by Nitin Shivappa et al.’s study, in which inflammatory markers such as IL-6 and homocysteine were found significant associated with DII, while the CRP and fibrinogen were not [46]. Although it is not significant among the whole population, the results of stratified analyses showed that DII was associated with CRP among subjects with MetS. Coincidently, research by Ghayour-Mobarhan et al. showed no association between diet and CRP among healthy participants, while a weak association was identified among the dyslipidaemic patients [47]. Masaki Ohsawa et al.’s study showed that the association between intake of n-3PUFA and CRP was more evident in male smokers, who have higher levels of inflammatory factors than do nonsmokers [48]. Further studies should determine the possible presence of an interaction effect, which implies that the effect of DII on serum CRP varies with differing health status (illness or not).
Another interesting finding in the present study was that participants with higher DII scores showed a higher degree of self-reported frequency of “Shanghuo” (heatiness). As one essential element in TCM, Shanghuo has been associated with some oral ailments such as oral dryness and mucosal ulcer [22], which were probably caused by consumption of a large amount of spicy food or by emotional stress such as depression, anxiety or anger [23]. A case-control study among Chinese students showed that habits such as eating barbecued food, spicy food, or insomnia would induce the occurrence of Shanghuo [49]. This study also demonstrates the possible association between DII, which indicates the inflammatory potential of diet, and Shanghuo, calling for further studies.
In order to explore the impact of changes of dietary habits, we performed subgroup analyses after removing participants who self-reported that they had changed their dietary habits. The results were similar, which indicated that the self-reported changes in dietary habits had little effect on the inflammatory potential of diet in this study.
The primary strength of this study was its use of the DII, which was literature-derived, population-based and standardized to facilitate quantitative comparisons. To the best of our knowledge, this is the first study to report the distribution of DII scores among a relatively large, representative population of China. In addition, we do not only analyzed the association between the DII and MetS, but also explored the possible mediation effect of inflammation (CRP) between them. Further, we were able to examine the degree of self-reported frequency of “Shanghuo”, which contributes to further understanding and application of the DII, especially in the Chinese population.
Some limitations of our study should be mentioned. Information for some potential confounders were not collected, such as medication and family history. Additionally, we had limited information on some of the parameters of the DII, such as flavones and trans fat, which are not included in the Chinese food composition table. In addition, using only one 24 h food recall is not sufficient to give a complete overview of dietary habits, so the DII score might not be a perfect representation of the real inflammatory potential of diet. The current study only included CRP as an inflammatory marker, while recent studies have found that other inflammatory markers such as IL-6, TNF-α, adiponectin or leptin were also closely associated with MetS [9]. Unfortunately, we have no information on other possible related markers. Future studies with a prospective design and more comprehensive factors are needed to fully understand the association between the DII, inflammation, and MetS.

5. Conclusions

In conclusion, this study suggested a close association between CRP and MetS; however, the association between the DII and MetS was relatively limited. Given that the DII was specially associated with CRP among subjects with MetS, it may serve as a useful tool to regulate the inflammatory state.

Supplementary Materials

The following are available online at https://www.mdpi.com/2072-6643/10/7/831/s1. Table S1: Association between the incidence of MetS (components) and DII/CRP in supplementary analyses; Table S2: Stratified analysis of association between the DII and CRP by sex; Table S3: Association between the DII and CRP in supplementary analyses.

Author Contributions

Z.R. and Y.Z. contributed to the design of this study; Y.W., L.M., I.M.-Y.S., T.L., H.G. and Z.T. collected the data; Y.Z., Y.W., L.M., I.M.-Y.S., and T.L. were responsible for quality control; Z.R., H.G. and Z.T. analysed the data; Z.R. drafted the paper; A.Z. and P.W. revised this paper.

Funding

This research received no external funding.

Acknowledgments

The Inner Mongolia Yili Industrial Group Co., Ltd. (Inner Mongolia Dairy Technology Research Institute Co. Ltd.) is acknowledged for sponsoring this project.

Conflicts of Interest

The authors declare no conflict of interest.

References

  1. Alberti, K.G.; Eckel, R.H.; Grundy, S.M.; Zimmet, P.Z.; Cleeman, J.I.; Donato, K.A.; Fruchart, J.C.; James, P.T.; Loria, P.Z.; Smith, S.J. Harmonizing the metabolic syndrome: A joint interim statement of the International Diabetes Federation Task Force on Epidemiology and Prevention; National Heart, Lung, and Blood Institute; American Heart Association; World Heart Federation; International Atherosclerosis Society; and International Association for the Study of Obesity. Circulation 2009, 120, 1640–1645. [Google Scholar] [CrossRef] [PubMed]
  2. Engin, A. The definition and prevalence of obesity and metabolic syndrome. Adv. Exp. Med. Biol. 2017, 960, 1–17. [Google Scholar] [CrossRef] [PubMed]
  3. Lu, J.; Wang, L.; Li, M.; Xu, Y.; Jiang, Y.; Wang, W.; Li, J.; Mi, S.; Zhang, M.; Li, Y.; et al. Metabolic syndrome among adults in China—The 2010 China Noncommunicable Disease Surveillance. J. Clin. Endocrinol. Metab. 2017, 102, 507–515. [Google Scholar] [CrossRef] [PubMed]
  4. Alberti, K.G.; Zimmet, P.; Shaw, J. The metabolic syndrome—A new worldwide definition. Lancet 2005, 366, 1059–1062. [Google Scholar] [CrossRef]
  5. Lopez-Candales, A.; Hernandez, B.P.; Hernandez-Suarez, D.F. Linking chronic inflammation with cardiovascular disease: From normal aging to the metabolic syndrome. J. Nat. Sci. 2017, 3, e341. [Google Scholar] [PubMed]
  6. Weisberg, S.P.; McCann, D.; Desai, M.; Rosenbaum, M.; Leibel, R.L.; Ferrante, A.J. Obesity is associated with macrophage accumulation in adipose tissue. J. Clin. Investig. 2003, 112, 1796–1808. [Google Scholar] [CrossRef] [PubMed] [Green Version]
  7. Xu, H.; Barnes, G.T.; Yang, Q.; Tan, G.; Yang, D.; Chou, C.J.; Sole, J.; Nichols, A.; Ross, J.S.; Tartaglia, L.A.; et al. Chronic inflammation in fat plays a crucial role in the development of obesity-related insulin resistance. J. Clin. Investig. 2003, 112, 1821–1830. [Google Scholar] [CrossRef] [PubMed] [Green Version]
  8. Jo, J.; Gavrilova, O.; Pack, S.; Jou, W.; Mullen, S.; Sumner, A.E.; Cushman, S.W.; Periwal, V. Hypertrophy and/or hyperplasia: Dynamics of adipose tissue growth. PLoS Comput. Biol. 2009, 5, e1000324. [Google Scholar] [CrossRef] [PubMed]
  9. Ma, K.; Jin, X.; Liang, X.; Zhao, Q.; Zhang, X. Inflammatory mediators involved in the progression of the metabolic syndrome. Diabetes Metab. Res. Rev. 2012, 28, 388–394. [Google Scholar] [CrossRef] [PubMed]
  10. Hotamisligil, G.S.; Peraldi, P.; Budavari, A.; Ellis, R.; White, M.F.; Spiegelman, B.M. IRS-1-mediated inhibition of insulin receptor tyrosine kinase activity in TNF-alpha- and obesity-induced insulin resistance. Science 1996, 271, 665–668. [Google Scholar] [CrossRef] [PubMed]
  11. Hirabara, S.M.; Gorjao, R.; Vinolo, M.A.; Rodrigues, A.C.; Nachbar, R.T.; Curi, R. Molecular targets related to inflammation and insulin resistance and potential interventions. J. Biomed. Biotechnol. 2012, 2012, 379024. [Google Scholar] [CrossRef] [PubMed]
  12. Hansson, G.K. Inflammation, atherosclerosis, and coronary artery disease. N. Engl. J. Med. 2005, 352, 1685–1695. [Google Scholar] [CrossRef] [PubMed]
  13. Mazidi, M.; Pennathur, S.; Afshinnia, F. Link of dietary patterns with metabolic syndrome: Analysis of the National Health and Nutrition Examination Survey. Nutr. Diabetes 2017, 7, 255. [Google Scholar] [CrossRef] [PubMed]
  14. Cheng, M.; Wang, H.; Wang, Z.; Du, W.; Ouyang, Y.; Zhang, B. Relationship between dietary factors and the number of altered metabolic syndrome components in Chinese adults: A cross-sectional study using data from the China Health and Nutrition Survey. BMJ Open 2017, 7, e014911. [Google Scholar] [CrossRef] [PubMed]
  15. Giugliano, D.; Ceriello, A.; Esposito, K. The effects of diet on inflammation: Emphasis on the metabolic syndrome. J. Am. Coll. Cardiol. 2006, 48, 677–685. [Google Scholar] [CrossRef] [PubMed]
  16. Syauqy, A.; Hsu, C.Y.; Rau, H.H.; Chao, J.C. Association of dietary patterns with components of metabolic syndrome and inflammation among middle-aged and older adults with metabolic syndrome in Taiwan. Nutrients 2018, 10, 143. [Google Scholar] [CrossRef] [PubMed]
  17. Uusitupa, M.; Hermansen, K.; Savolainen, M.J.; Schwab, U.; Kolehmainen, M.; Brader, L.; Mortensen, L.S.; Cloetens, L.; Johansson-Persson, A.; Onning, G.; et al. Effects of an isocaloric healthy Nordic diet on insulin sensitivity, lipid profile and inflammation markers in metabolic syndrome—A randomized study (SYSDIET). J. Intern Med. 2013, 274, 52–66. [Google Scholar] [CrossRef] [PubMed] [Green Version]
  18. Cavicchia, P.P.; Steck, S.E.; Hurley, T.G.; Hussey, J.R.; Ma, Y.; Ockene, I.S.; Hébert, J.R. A new Dietary Inflammatory Index predicts interval changes in serum high-sensitivity C-reactive protein. J. Nutr. 2009, 139, 2365–2372. [Google Scholar] [CrossRef] [PubMed]
  19. Shivappa, N.; Steck, S.E.; Hurley, T.G.; Hussey, J.R.; Hebert, J.R. Designing and developing a literature-derived, population-based dietary inflammatory index. Public Health Nutr. 2014, 17, 1689–1696. [Google Scholar] [CrossRef] [PubMed]
  20. Gambardella, J.; Santulli, G. Integrating diet and inflammation to calculate cardiovascular risk. Atherosclerosis 2016, 253, 258–261. [Google Scholar] [CrossRef] [PubMed]
  21. Ruiz-Canela, M.; Bes-Rastrollo, M.; Martínez-González, M.A. The role of dietary inflammatory index in cardiovascular disease, metabolic syndrome and mortality. Int. J. Mol. Sci. 2016, 17, 1265. [Google Scholar] [CrossRef] [PubMed]
  22. Liu, S.J.; Huang, Z.S.; Wu, Q.G.; Huang, Z.J.; Wu, L.R.; Yan, W.L.; Chang, D.L.; Yang, Z.; Wang, Z.W. Quantization and diagnosis of Shanghuo (Heatiness) in Chinese medicine using a diagnostic scoring scheme and salivary biochemical parameters. Chin. Med. 2014, 9, 2. [Google Scholar] [CrossRef] [PubMed] [Green Version]
  23. Ge, N.; Gong, J.; Ni, S.F.; Luo, R.F.; Zhao, T.; Lu, F.; Wu, Y.B.; Cao, M.Y. “Shanghuo” “Inflammatory” and the Relationship between Free Radicals (in Chinese). J. Liaoning Univ. TCM 2011, 13, 87–89. [Google Scholar]
  24. Zhao, A.; Szeto, I.M.; Wang, Y.; Li, C.; Pan, M.; Li, T.; Wang, P.; Zhang, Y. Knowledge, Attitude, and Practice (KAP) of Dairy Products in Chinese Urban Population and the Effects on Dairy Intake Quality. Nutrients 2017, 9, 668. [Google Scholar] [CrossRef]
  25. Yang, Y. China Food Composition, 1st ed.; Peking University Medical Press: Beijing, China, 2004. [Google Scholar]
  26. Yang, Y. China Food Composition, 2nd ed.; Peking University Medical Press: Beijing, China, 2009. [Google Scholar]
  27. Willett, W.C.; Howe, G.R.; Kushi, L.H. Adjustment for total energy intake in epidemiologic studies. Am. J Clin. Nutr. 1997, 65, S1220–S1228. [Google Scholar] [CrossRef] [PubMed]
  28. Wirth, M.D.; Burch, J.; Shivappa, N.; Violanti, J.M.; Burchfiel, C.M.; Fekedulegn, D.; Andrew, M.E.; Hartley, T.A.; Miller, D.B.; Mnatsakanova, A.; et al. Association of a dietary inflammatory index with inflammatory indices and metabolic syndrome among police officers. J. Occup. Environ. Med. 2014, 56, 986–989. [Google Scholar] [CrossRef] [PubMed]
  29. Sokol, A.; Wirth, M.D.; Manczuk, M.; Shivappa, N.; Zatonska, K.; Hurley, T.G.; Hébert, J.R. Association between the dietary inflammatory index, waist-to-hip ratio and metabolic syndrome. Nutr. Res. 2016, 36, 1298–1303. [Google Scholar] [CrossRef] [PubMed] [Green Version]
  30. Alkerwi, A.A.; Shivappa, N.; Crichton, G.; Hébert, J.R. No significant independent relationships with cardiometabolic biomarkers were detected in the Observation of Cardiovascular Risk Factors in Luxembourg study population. Nutr. Res. 2014, 34, 1058–1065. [Google Scholar] [CrossRef] [PubMed] [Green Version]
  31. Neufcourt, L.; Assmann, K.E.; Fezeu, L.K.; Touvier, M.; Graffouillère, L.; Shivappa, N.; Hébert, J.R.; Wirth, M.D.; Hercberg, S.; Galan, P.; et al. Prospective association between the dietary inflammatory index and metabolic syndrome: Findings from the SU.VI.MAX study. Nutr. Metab. Cardiovasc. Dis. 2015, 25, 988–996. [Google Scholar] [CrossRef] [PubMed]
  32. Pimenta, A.M.; Toledo, E.; Rodriguez-Diez, M.C.; Gea, A.; Lopez-Iracheta, R.; Shivappa, N.; Hébert, J.R.; Martinez-Gonzalez, M.A. Dietary indexes, food patterns and incidence of metabolic syndrome in a Mediterranean cohort: The SUN project. Clin. Nutr. 2015, 34, 508–514. [Google Scholar] [CrossRef] [PubMed] [Green Version]
  33. Naja, F.; Shivappa, N.; Nasreddine, L.; Kharroubi, S.; Itani, L.; Hwalla, N.; Mehio Sibai, A.; Hebert, J.R. Role of inflammation in the association between the western dietary pattern and metabolic syndrome among Lebanese adults. Int. J. Food Sci. Nutr. 2017, 68, 997–1004. [Google Scholar] [CrossRef] [PubMed]
  34. Garcia-Arellano, A.; Ramallal, R.; Ruiz-Canela, M.; Salas-Salvadó, J.; Corella, D.; Shivappa, N.; Schröder, H.; Hébert, J.R.; Ros, E.; Gómez-Garcia, E.; et al. Dietary Inflammatory Index and Incidence of Cardiovascular Disease in the PREDIMED Study. Nutrients 2015, 7, 4124–4138. [Google Scholar] [CrossRef] [PubMed] [Green Version]
  35. Pfutzner, A.; Schöndorf, T.; Hanefeld, M.; Forst, T. High-sensitivity C-reactive protein predicts cardiovascular risk in diabetic and nondiabetic patients: Effects of insulin-sensitizing treatment with pioglitazone. J. Diabetes Sci. Technol. 2010, 4, 706–716. [Google Scholar] [CrossRef] [PubMed]
  36. Venugopal, S.K.; Devaraj, S.; Yuhanna, I.; Shaul, P.; Jialal, I. Demonstration that C-reactive protein decreases eNOS expression and bioactivity in human aortic endothelial cells. Circulation 2002, 106, 1439–1441. [Google Scholar] [CrossRef] [PubMed]
  37. Lu, B.; Zhang, S.; Wen, J.; Yang, Y.; Yang, Z.; Zhang, Z.; Wang, X.; Hu, R. The New Unified International Diabetes Federation/American Heart Association/National Heart, Lung, and Blood Institute Metabolic Syndrome definition: Does it correlate better with C-reactive protein in Chinese patients diagnosed with type 2 diabetes? J. Int. Med. Res. 2010, 38, 1923–1932. [Google Scholar] [CrossRef] [PubMed]
  38. Yan, Y.Z.; Ma, R.L.; Ding, Y.S.; Guo, H.; Zhang, J.Y.; Mu, L.T.; Zhang, M.; Liu, J.M.; Rui, D.A.; He, J.; et al. Association of inflammation with metabolic syndrome among low-income rural Kazakh and Uyghur Adults in Far Western China. Mediators Inflamm. 2015, 2015, 706768. [Google Scholar] [CrossRef] [PubMed]
  39. Regitz-Zagrosek, V.; Oertelt-Prigione, S.; Prescott, E.; Franconi, F.; Gerdts, E.; Foryst-Ludwig, A.; Maas, A.H.; Kautzky-Willer, A.; Knappe-Wegner, D.; Kintscher, U.; et al. Gender in cardiovascular diseases: Impact on clinical manifestations, management, and outcomes. Eur. Heart J. 2016, 37, 24–34. [Google Scholar] [CrossRef] [PubMed]
  40. Wirth, M.D.; Shivappa, N.; Hurley, T.G.; Hébert, J.R. Association between previously diagnosed circulatory conditions and a dietary inflammatory index. Nutr. Res. 2016, 36, 227–233. [Google Scholar] [CrossRef] [PubMed] [Green Version]
  41. Lai, M.M.; Li, C.I.; Kardia, S.L.; Liu, C.S.; Lin, W.Y.; Lee, Y.D.; Chang, P.C.; Lin, C.C.; Li, T.C. Sex difference in the association of metabolic syndrome with high sensitivity C-reactive protein in a Taiwanese population. BMC Public Health 2010, 10, 429. [Google Scholar] [CrossRef] [PubMed]
  42. Shivappa, N.; Steck, S.E.; Hurley, T.G.; Hussey, J.R.; Ma, Y.; Ockene, I.S.; Tabung, F.; Hébert, J.R. A population-based dietary inflammatory index predicts levels of C-reactive protein in the Seasonal Variation of Blood Cholesterol Study (SEASONS). Public Health Nutr. 2014, 17, 1825–1833. [Google Scholar] [CrossRef] [PubMed]
  43. Farhangi, M.A.; Najafi, M. Dietary inflammatory index: A potent association with cardiovascular risk factors among patients candidate for coronary artery bypass grafting (CABG) surgery. Nutr. J. 2018, 17, 20. [Google Scholar] [CrossRef] [PubMed]
  44. Na, W.; Kim, M.; Sohn, C. Dietary inflammatory index and its relationship with high-sensitivity C-reactive protein in Korean: Data from the health examinee cohort. J. Clin. Biochem. Nutr. 2018, 62, 83–88. [Google Scholar] [CrossRef] [PubMed]
  45. Wirth, M.D.; Shivappa, N.; Davis, L.; Hurley, T.G.; Ortaglia, A.; Drayton, R.; Blair, S.N.; Hébert, J.R. Construct validation of the Dietary Inflammatory Index among African Americans. J. Nutr. Health Aging 2017, 21, 487–491. [Google Scholar] [CrossRef] [PubMed]
  46. Shivappa, N.; Hebert, J.R.; Rietzschel, E.R.; Marcos, A.; Gomez, S.; Nova, E.; Michels, N.; Arouca, A.; González-Gil, E.; Frederic, G.; et al. Association between dietary inflammatory index and inflammatory markers in the HELENA study. Br. J. Nutr. 2015, 113, 665–671. [Google Scholar] [CrossRef] [PubMed]
  47. Ghayour-Mobarhan, M.; Yaghootkar, H.; Lanham-New, S.A.; Lamb, D.J.; Ferns, G.A. Association between serum CRP concentrations with dietary intake in healthy and dyslipidaemic patients. Asia Pac. J. Clin. Nutr. 2007, 16, 262–268. [Google Scholar] [PubMed]
  48. Ohsawa, M.; Itai, K.; Onoda, T.; Tanno, K.; Sasaki, S.; Nakamura, M.; Ogawa, A.; Sakata, K.; Kawamura, K.; Kuribayashi, T.; et al. Dietary intake of n-3 polyunsaturated fatty acids is inversely associated with CRP levels, especially among male smokers. Atherosclerosis 2008, 201, 184–191. [Google Scholar] [CrossRef] [PubMed]
  49. Bao, J.; Wang, Q.I.; Li, S.M.; Zhu, Y.F.; Chen, N.N.; Zheng, W.J.; Xie, Z.J.; Fan, Y.S. Case-control study of inducing factors in ‘Shanghuo’. Chin. J. Tradit. Chin. Med. 2015, 30, 1013–1016. (In Chinese) [Google Scholar]
Figure 1. Association between DII, CRP and MetS. DII: dietary inflammatory index, CRP: C-reactive protein, MetS: metabolic syndrome.
Nutrients 10 00831 g001
Table 1. Baseline characteristics of tertiles of the DII score, Mean ± SD or N (%).
VariablesDietary Inflammatory Index
Tertile 1Tertile 2Tertile 3pa
N566567579
DII scores−0.91(0.74)0.62(0.30)1.63(0.38)
Age53.8(15.7)51.5(17.6)46.2(18.0)<0.001 *
BMI (kg/m2)24.0(3.6)23.8(3.4)23.6(3.6)0.157
Gender0.047 *
Male173(30.6)192(33.9)217(37.5)
Female393(69.4)375(66.1)362(62.5)
Education0.218
Never28(4.9)16(2.8)30(5.2)
Secondary or under155(27.4)176(31.2)160(27.8)
high or equal242(42.8)238(42.1)222(38.6)
Bachelor 118(20.8)108(19.1)136(23.7)
Master or above23(4.1)27(4.8)27(4.7)
Family monthly income (RMB: yuan)0.105
≤3000113(20.1)114(20.2)134(23.3)
3000–4999144(25.6)169(30.0)176(30.6)
5000–7999138(24.5)106(18.8)122(21.2)
8000–999961(10.8)54(9.6)57 (9.9)
10,000–14,99958 (10.3)66(11.7)48(8.3)
≥15,00049(8.7)55(9.8)39(6.8)
Family monthly expenditure on food (RMB: yuan)<0.001 *
≤50030(5.3)36(6.4)52(9.0)
500–999112(19.8)138(24.4)143(24.8)
1000–2999288(50.9)288(50.9)302(52.3)
3000–4999104(18.4)68(12.0)65(11.3)
≥500032(5.7)36(6.4)15(2.6)
City0.002 *
Beijing120(21.2)105(18.5)101(17.4)
Chengdu53(9.4)51(9.0)64(11.1)
Chenzhou57(10.1)45(7.9)71(12.3)
Jilin33(5.8)69(12.2)63(10.9)
Guangzhou122(21.6)107(18.9)97(16.8)
Lanzhou64(11.3)60(10.6)51(8.8)
Wuhu59(10.4)58(10.2)79(13.6)
Xuchang58(10.3)72(12.7)53(9.2)
Geographic location0.029 *
South291(51.4)261(46.0)311(53.7)
North275(48.6)306(54.0)268(46.3)
Physical activity 0.499
Low109(20.3)100(19.3)119(21.5)
Medium301(56.2)291(56.3)286(51.6)
High126(23.5)126(24.4)149(26.9)
Smoking status0.102
Non-smoker436(77.7)431(76.6)431(74.7)
Former smoker68(12.1)52(9.2)62(10.8)
Smoker57(10.2)80(14.2)84(14.6)
DII: dietary inflammatory index, SD: standard deviation, BMI: body mass index, RMB: RenMinbi. a Age and BMI were continuous variables, and they were analyzed with one-way ANOVA test; Other variables were analyzed with chi-square analysis. * Significant p values that met the 5% level.
Table 2. Nutrients intakes of tertiles of the DII, P50th (P25th, P75th) a.
NutrientsDietary Inflammatory Index
Tertile 1Tertile 2Tertile 3pb
Carbohydrate (g)280.8(239.0,323.5)288.2(241.9,326.8)272.6(221.7,318.6)0.003 *
Protein (g)73.2(62.4,84.8)65.2(56.3,76.4)57.8(49.6,67.5)<0.001 *
Total fat (g)72.7(54.8,89.2)69(53.7,86.3)76(57.8,96.7)<0.001 *
Saturated fat (g)10.4(6.7,14.5)10.2(6.9,14.5)10.1(6.7,16.2)0.674
MUFA (g)19.8(13,27.5)18.9(11.8,28.6)21(13.6,32.2)0.010 *
PUFA (g)15.4(10.2,22.2)13.9(9.9,18.7)11.6(8.2,16.2)<0.001 *
Fiber (g)17.7(13.3,24.4)11(8.6,13.8)7.3(5.7,9.5)<0.001 *
Cholesterol (mg)341.1(107.5,600.0)304.5(111.2,625.6)349.3(122.3,564.5)0.911
Niacin (mg)15.4(12.3,19.5)13.3(10.9,16.6)11.4(9.3,14.0)<0.001 *
Thiamine (mg)1.1(0.9,1.3)1.0(0.8,1.2)0.9(0.7,1.0)<0.001 *
Riboflavin (mg)1.1(0.9,1.5)0.9(0.7,1.2)0.7(0.6,1.0)<0.001 *
Folic acid (μg)349.9(243.5,469.6)230.9(165.9,300.2)154.7(116.7,196.0)<0.001 *
Vitamins A (RE)635.2(388.1,1054.7)379.9(222.6,574.2)278.8(169.4,408.6)<0.001 *
Vitamins B6 (mg)1.3(1.1,1.6)1.0(0.8,1.2)0.8(0.7,1.0)<0.001 *
Vitamins B12 (μg)2.3(0.8,5.1)2.2(0.8,4.7)1.9(0.9,3.5)0.011 *
Vitamins C (mg)141.8(85.6,198.2)74.8(41.3,109.9)39.4(20.9,60.9)<0.001 *
Vitamins E (mg)33.1(23.7,43.8)25.1(17.6,37.0)17.8(12.3,30.5)<0.001 *
Iron (mg)24.9(21.7,30.3)20.5(18.2,23.4)17.4(15.4,19.5)<0.001 *
Magnesium (mg)368.2(322.8,440.2)288.5(258.5,327.7)226.4(194.3,262.8)<0.001 *
Selenium (μg)44.6(33.7,59.2)41.9(31.3,55.4)38.8(29.9,48.8)<0.001 *
Zinc (mg)13.1(11.7,14.9)11.4(10.3,12.8)10.0(9.1,11.3)<0.001 *
DII: dietary inflammatory index, MUFA: monounsaturated fatty acids, PUFA: polyunsaturated fatty acids, RE: retinol equivalent. a Nutrients data after adjustment with nutrient density method; b Distributions of nutrients intakes were non-normal, presented as P50th (P25th, P75th), and analyzed with Kruskal–Wallis tests; * Significant p values that met the 5% level.
Table 3. Association between the incidence of MetS (components) and DII/CRP a.
MetS/ComponentsDietary Inflammatory Index OR (95% CI) CRP (Continuous)
OR (95% CI)
Tertile 1Tertile 2Tertile 3Continuous
Metabolic Syndrome
Model 1 b1.00(Ref.)0.74(0.58–0.95)0.72(0.56–0.92)0.85(0.78–0.92)3.83(3.05–4.80)
Model 2 c1.00(Ref.)0.76(0.56–1.03)1.02(0.75–1.40)0.93(0.83–1.04)1.66(1.26–2.18) *
Waist circumference
Model 1 b1.00(Ref.)0.86(0.68–1.09)0.69(0.54–0.86)0.85(0.79–0.93)4.61(3.67–5.79)
Model 2 c1.00(Ref.)0.92(0.64–1.32)0.86(0.59–1.24)0.93(0.81–1.06)1.91(1.36–2.66) *
Blood pressure
Model 1 b1.00(Ref.)0.96(0.76–1.21)0.86(0.68–1.08)0.91(0.84–0.99)2.80(2.28–3.45)
Model 2 c1.00(Ref.)1.04(0.77–1.39)1.40(1.03–1.89) *1.06(0.96–1.18)1.17(0.89–1.53)
HDL-cholesterol
Model 1 b1.00(Ref.)0.90(0.69–1.17)1.01(0.78–1.31)0.96(0.88–1.06)2.13(1.72–2.64)
Model 2 c1.00(Ref.)0.95(0.71–1.26)1.17(0.88–1.56)1.02(0.92–1.12)1.64(1.27–2.11) *
Triglycerides
Model 1 b1.00(Ref.)0.69(0.54–0.88)0.73(0.58–0.93)0.88(0.81–0.96)3.01(2.43–3.72)
Model 2 c1.00(Ref.)0.73(0.55–0.96)1.03(0.78–1.37)0.99(0.90–1.09)1.44(1.12–1.85) *
Fasting glucose
Model 1 b1.00(Ref.)0.78(0.61–1.00)0.71(0.56–0.92)0.86(0.79–0.94)2.47(2.00–3.05)
Model 2 c1.00(Ref.)0.78(0.59–1.04)0.85(0.64–1.14)0.91(0.82–1.00)1.73(1.34–2.24) *
MetS: metabolic syndrome, DII: dietary inflammatory index, CRP: C-reactive protein, HDL-cholesterol: high-density lipoprotein cholesterol. a MetS outcomes and its components were analyzed as dichotomous variables with binary logistic regression; b Model 1 was used to obtain the crude odds ratio; c Model 2 was adjusted for age, gender, city, education level, family monthly expenditure on food, smoking status and BMI. * OR (95% CI) of adjusted model that were significant.
Table 4. Stratified analysis of association between the incidence of MetS (components) and DII/CRP a by sex.
MetS/ComponentsDietary Inflammatory Index OR (95% CI) CRP (Continuous)
OR (95% CI)
Tertile 1Tertile 2Tertile 3Continuous
Males
Metabolic Syndrome
Model 1 b1.00(Ref.)0.86(0.56–1.32)0.86(0.57–1.30)0.92(0.80–1.07)1.67(1.15–2.41)
Model 2 c1.00(Ref.)0.91(0.55–1.50)1.06(0.64–1.75)0.97(0.82–1.16)1.09(0.70–1.70)
Waist circumference
Model 1 b1.00(Ref.)1.03(0.68–1.57)0.97(0.65–1.46)0.95(0.82–1.09)2.63(1.79–3.87)
Model 2 c1.00(Ref.)1.07(0.59–1.96)1.21(0.66–2.23)0.99(0.80–1.23)1.73(0.97–3.08)
Blood pressure
Model 1 b1.00(Ref.)1.08(0.70–1.66)0.72(0.48–1.08)0.87(0.75–1.01)1.45(1.00–2.09)
Model 2 c1.00(Ref.)1.25(0.76–2.07)1.04(0.63–1.70)0.99(0.83–1.17)0.97(0.62–1.53)
HDL-Cholesterol
Model 1 b1.00(Ref.)1.09(0.64–1.86)1.40(0.84–2.31)1.08(0.91–1.30)1.65(1.07–2.53)
Model 2 c1.00(Ref.)1.16(0.65–2.07)1.47(0.83–2.58)1.10(0.90–1.35)1.31(0.80–2.17)
Triglycerides
Model 1 b1.00(Ref.)0.77(0.50–1.17)0.76(0.50–1.13)0.93(0.81–1.08)1.52(1.06–2.18)
Model 2 c1.00(Ref.)0.75(0.47–1.19)0.78(0.49–1.20)0.94(0.80–1.11)0.92(0.61–1.39)
Fasting glucose
Model 1 b1.00(Ref.)0.88(0.58–1.33)0.67(0.45–1.01)0.85(0.75–0.94)1.81(1.26–2.61)
Model 2 c1.00(Ref.)0.96(0.60–1.54)0.90(0.56–1.44)0.91(0.77–1.08)1.79(1.17–2.73) *
Females
Metabolic Syndrome
Model 1 b1.00(Ref.)0.69(0.51–0.93)0.65(0.48–0.87)0.80(0.72–0.89)5.96(4.43–8.02)
Model 2 c1.00(Ref.)0.67(0.45–1.00)1.01(0.66–1.53)0.90(0.78–1.04)2.17(1.49–3.15) *
Waist circumference
Model 1 b1.00(Ref.)0.81(0.61–1.07)0.59(0.44–0.79)0.82(0.74–0.91)6.70(4.99–9.00)
Model 2 c1.00(Ref.)0.91(0.56–1.46)0.74(0.45–1.20)0.92(0.77–1.08)1.85(1.20–2.88) *
Blood pressure
Model 1 b1.00(Ref.)0.87(0.65–1.16)0.86(0.64–1.15)0.90(0.81–0.99)3.53(2.72–4.58)
Model 2 c1.00(Ref.)0.90(0.62–1.32)1.72(1.15–2.56) *1.12(0.98–1.28)1.25(0.88–1.77)
HDL-Cholesterol
Model 1 b1.00(Ref.)0.86(0.63–1.17)0.94(0.69–1.28)0.94(0.84–1.05)2.50(1.94–3.23)
Model 2 c1.00(Ref.)0.90(0.65–1.25)1.06(0.76–1.49)0.99(0.88–1.11)1.77(1.31–2.38) *
Triglycerides
Model 1 b1.00(Ref.)0.64(0.47–0.86)0.70(0.52–0.94)0.84(0.76–0.94)4.15(3.16–5.45)
Model 2 c1.00(Ref.)0.66(0.46–0.94) *1.17(0.80–1.70)1.01(0.89–1.15)1.86(1.33–2.60) *
Fasting glucose
Model 1 b1.00(Ref.)0.69(0.51–0.95)0.69(0.50–0.94)0.84(0.75–0.94)2.77(2.13–3.62)
Model 2 c1.00(Ref.)0.68(0.47–0.98) *0.83(0.57–1.21)0.89(0.78–1.02)1.69(1.21–2.37) *
MetS: metabolic syndrome, DII: dietary inflammatory index, CRP: C-reactive protein, HDL-cholesterol: high-density lipoprotein cholesterol. a MetS outcomes and its components were analyzed as dichotomous variables with binary logistic regression; b Model 1 was used to obtain the crude odds ratio; c Model 2 was adjusted for age, city, education level, family monthly expenditure on food, smoking status and BMI. * OR (95% CI) of adjusted model that were significant.
Table 5. Association between the DII and CRP a.
SubjectsDietary Inflammatory Beta Estimates (95% CI)
Tertile 1Tertile 2Tertile 3Continuous
Whole sample
Model 1 b1.00(Ref.)−0.004(−0.064,0.055)−0.032(−0.101,0.036)−0.012(−0.033,0.009)
Model 2 c1.00(Ref.)0.035(−0.018,0.089)0.040(−0.024,0.103)0.012(−0.008,0.031)
Subjects with MetS
Model 1 b1.00(Ref.)0.072(−0.010,0.154)0.110(0.009,0.211)0.033(0.003,0.062)
Model 2 c1.00(Ref.)0.086(0.004,0.167) *0.145(0.045,0.245) *0.040(0.010,0.069) *
Subjects without MetS
Model 1 b1.00(Ref.)−0.021(−0.097,0.056)−0.048(−0.134,0.038)−0.018(−0.045,0.009)
Model 2 c1.00(Ref.)0.021(−0.050,0.091)0.001(−0.080,0.082)0.002(−0.024,0.027)
DII: dietary inflammatory index, CRP: C-reactive protein, MetS: metabolic syndrome. a CRP was analyzed as a continuous variable with linear regression; b Model 1 was used to obtain the crude beta estimates; c Model 2 was adjusted for age, gender, city, education level, family monthly expenditure on food, smoking status, and BMI. * Beta estimates (95% CI) of adjusted model that were significant.

