The Effect of Low-Carbohydrate Diet on Glycemic Control in Patients with Type 2 Diabetes Mellitus


 ,
,
Abstract
:1. Introduction
2. Materials and Methods
2.1. Subjects
2.2. Study Design
2.3. Sample Size Calculation
2.4. Biochemical Parameters and Analyses
2.5. Anthropometric Measurements
2.6. Diet Record
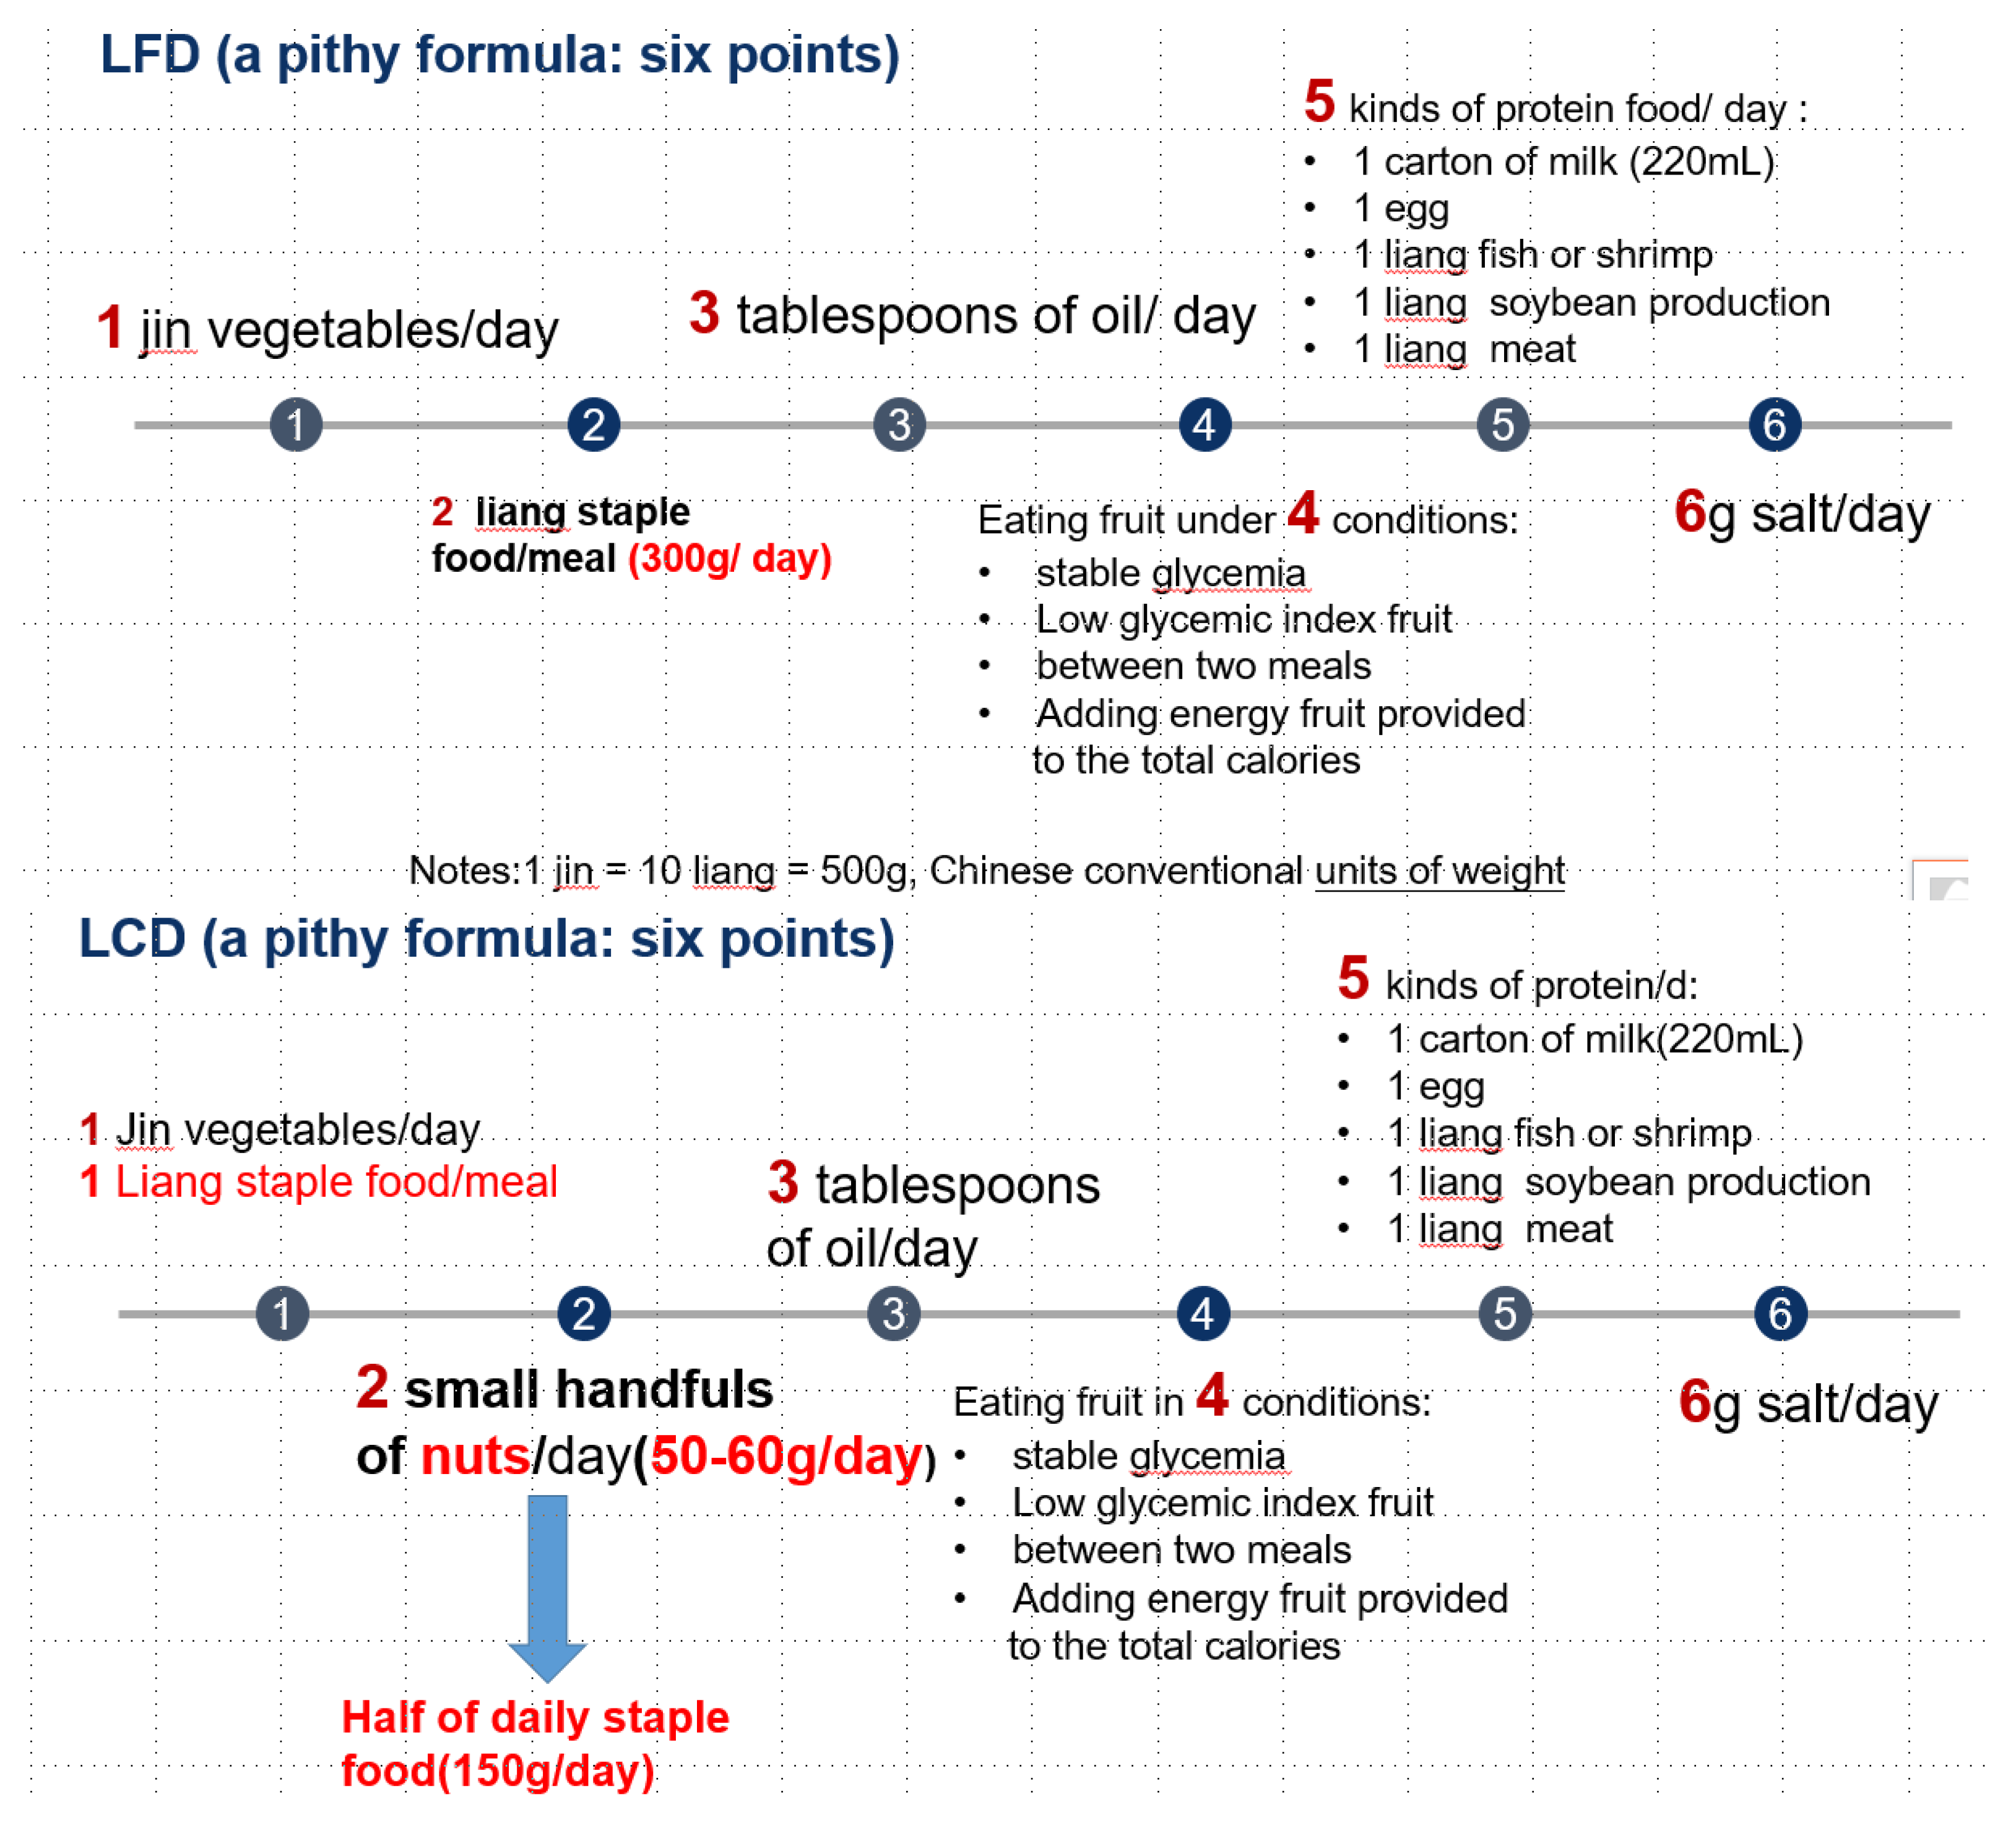
2.7. Intervention
2.8. Statistical Analysis
3. Results
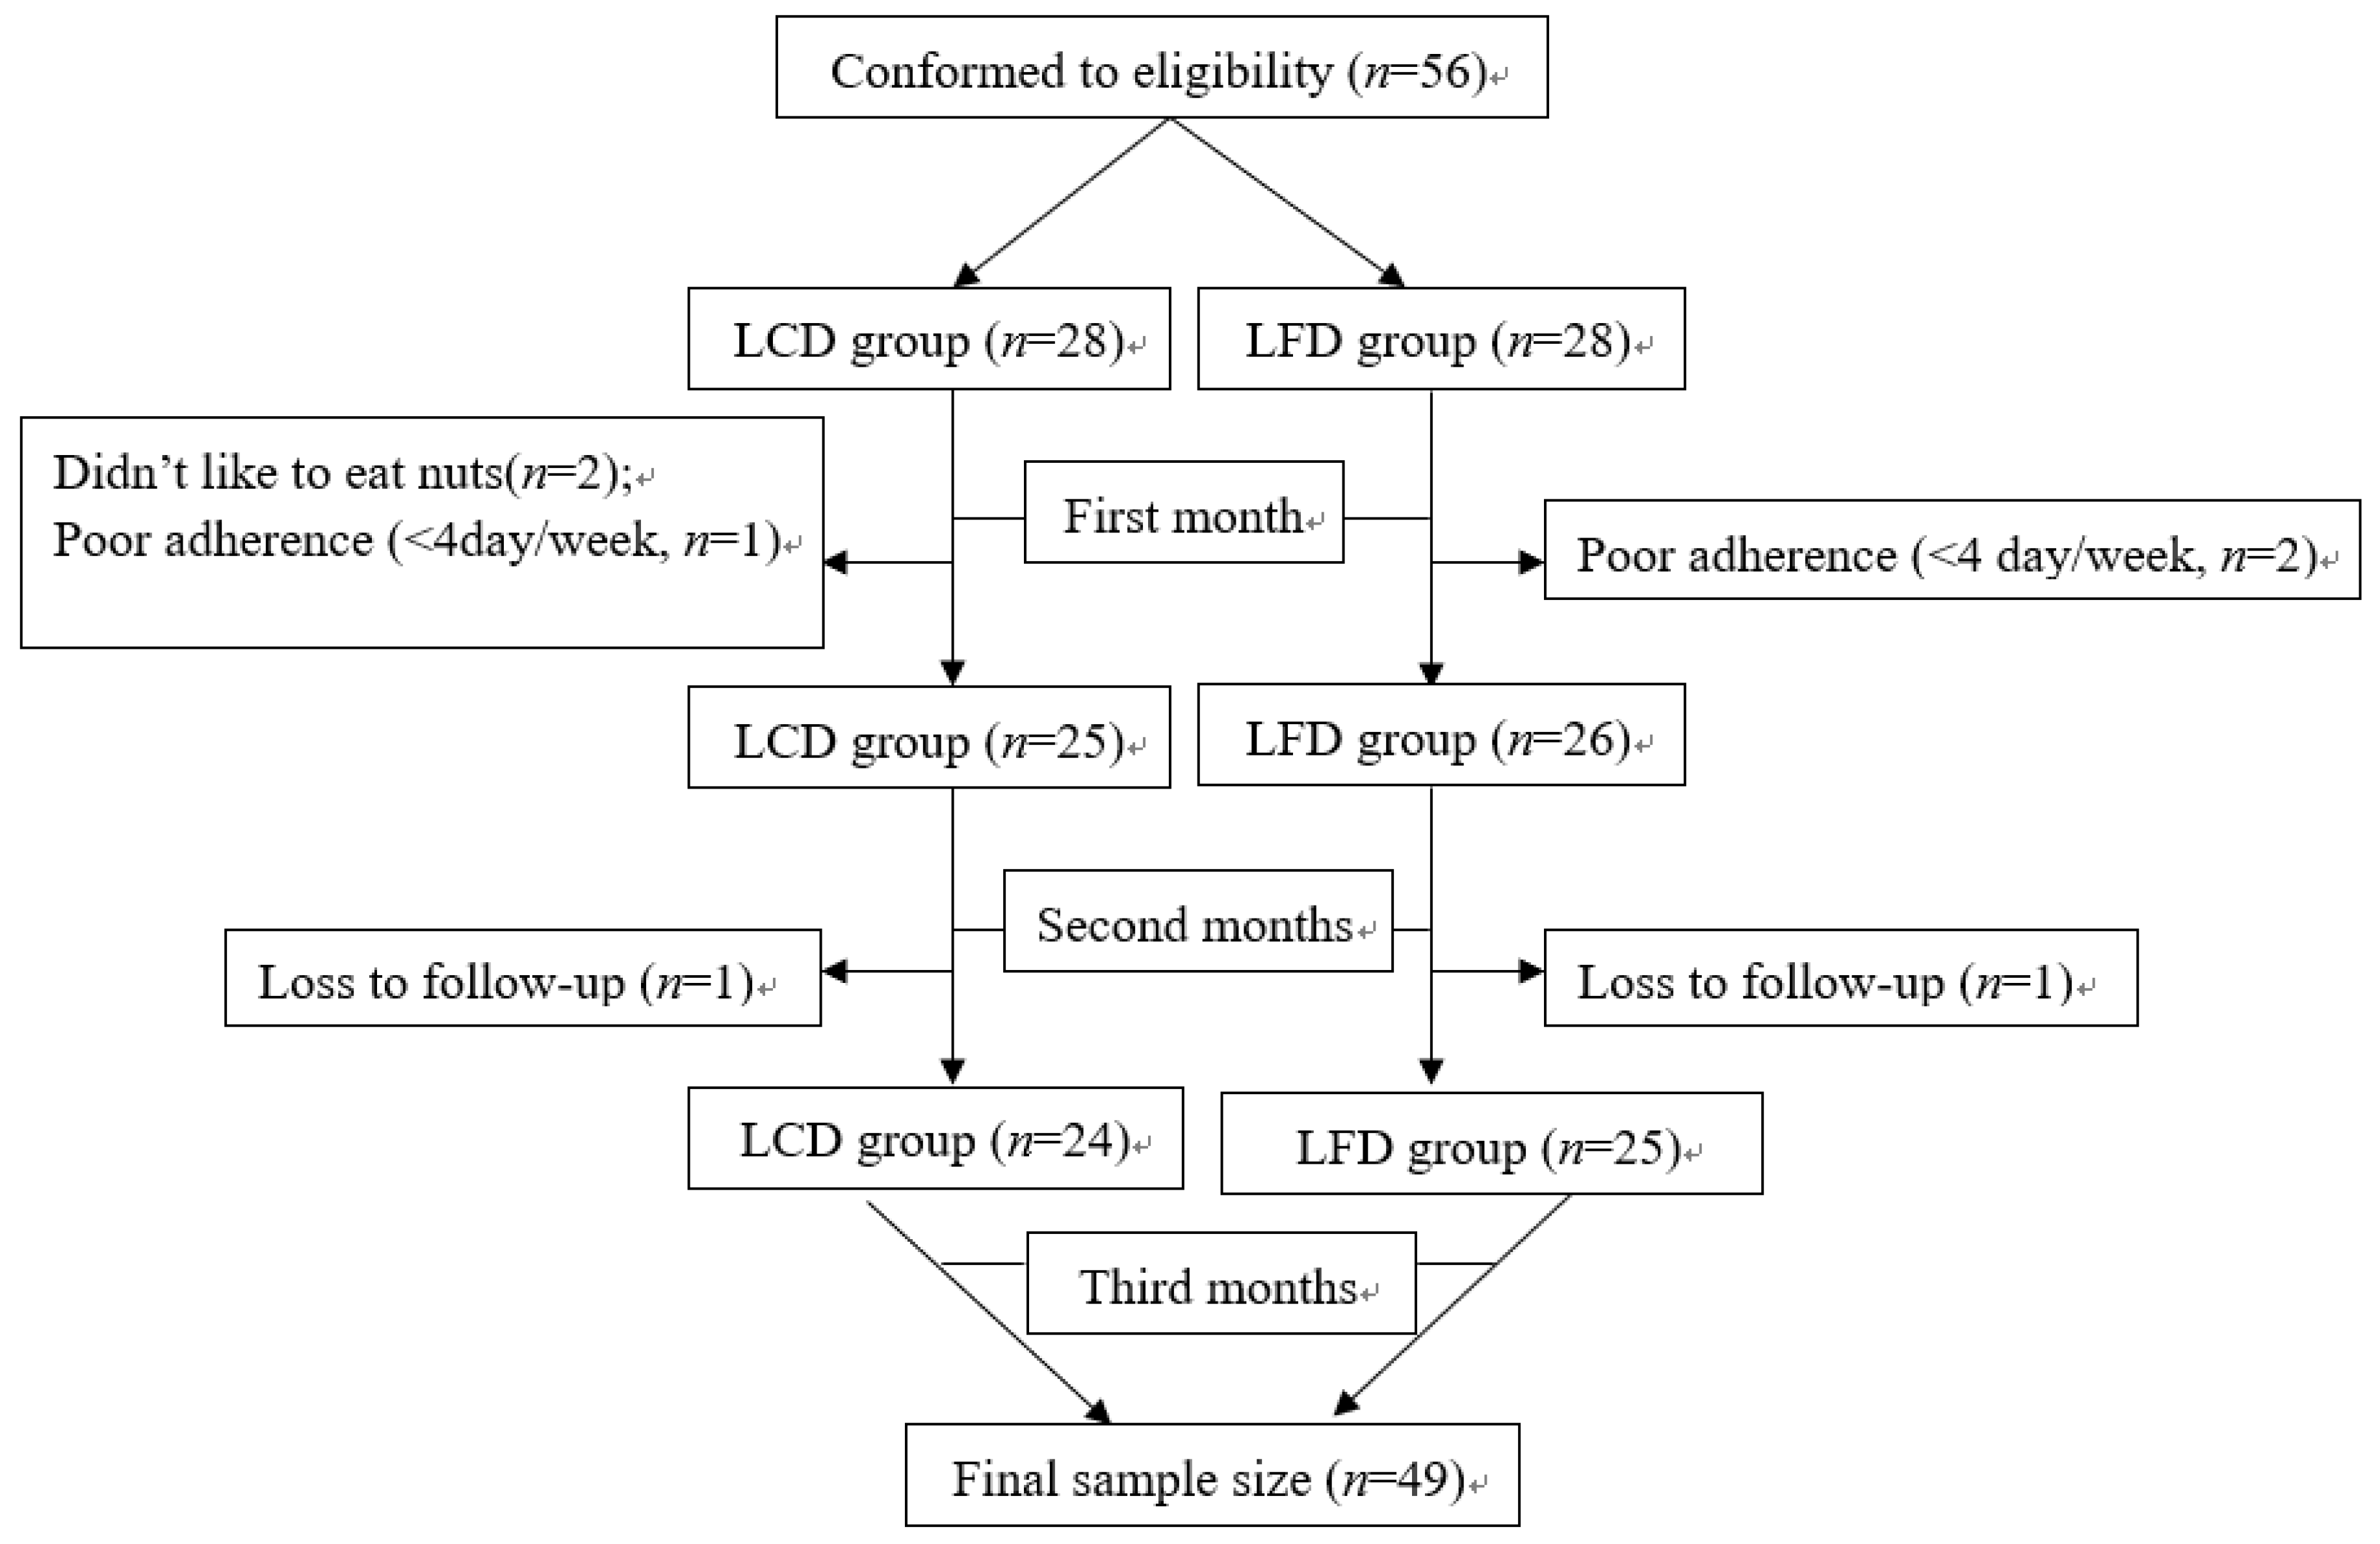
3.1. Study Participants
3.2. Dietary Adherence
3.2.1. Comparison of Dietary Adherence
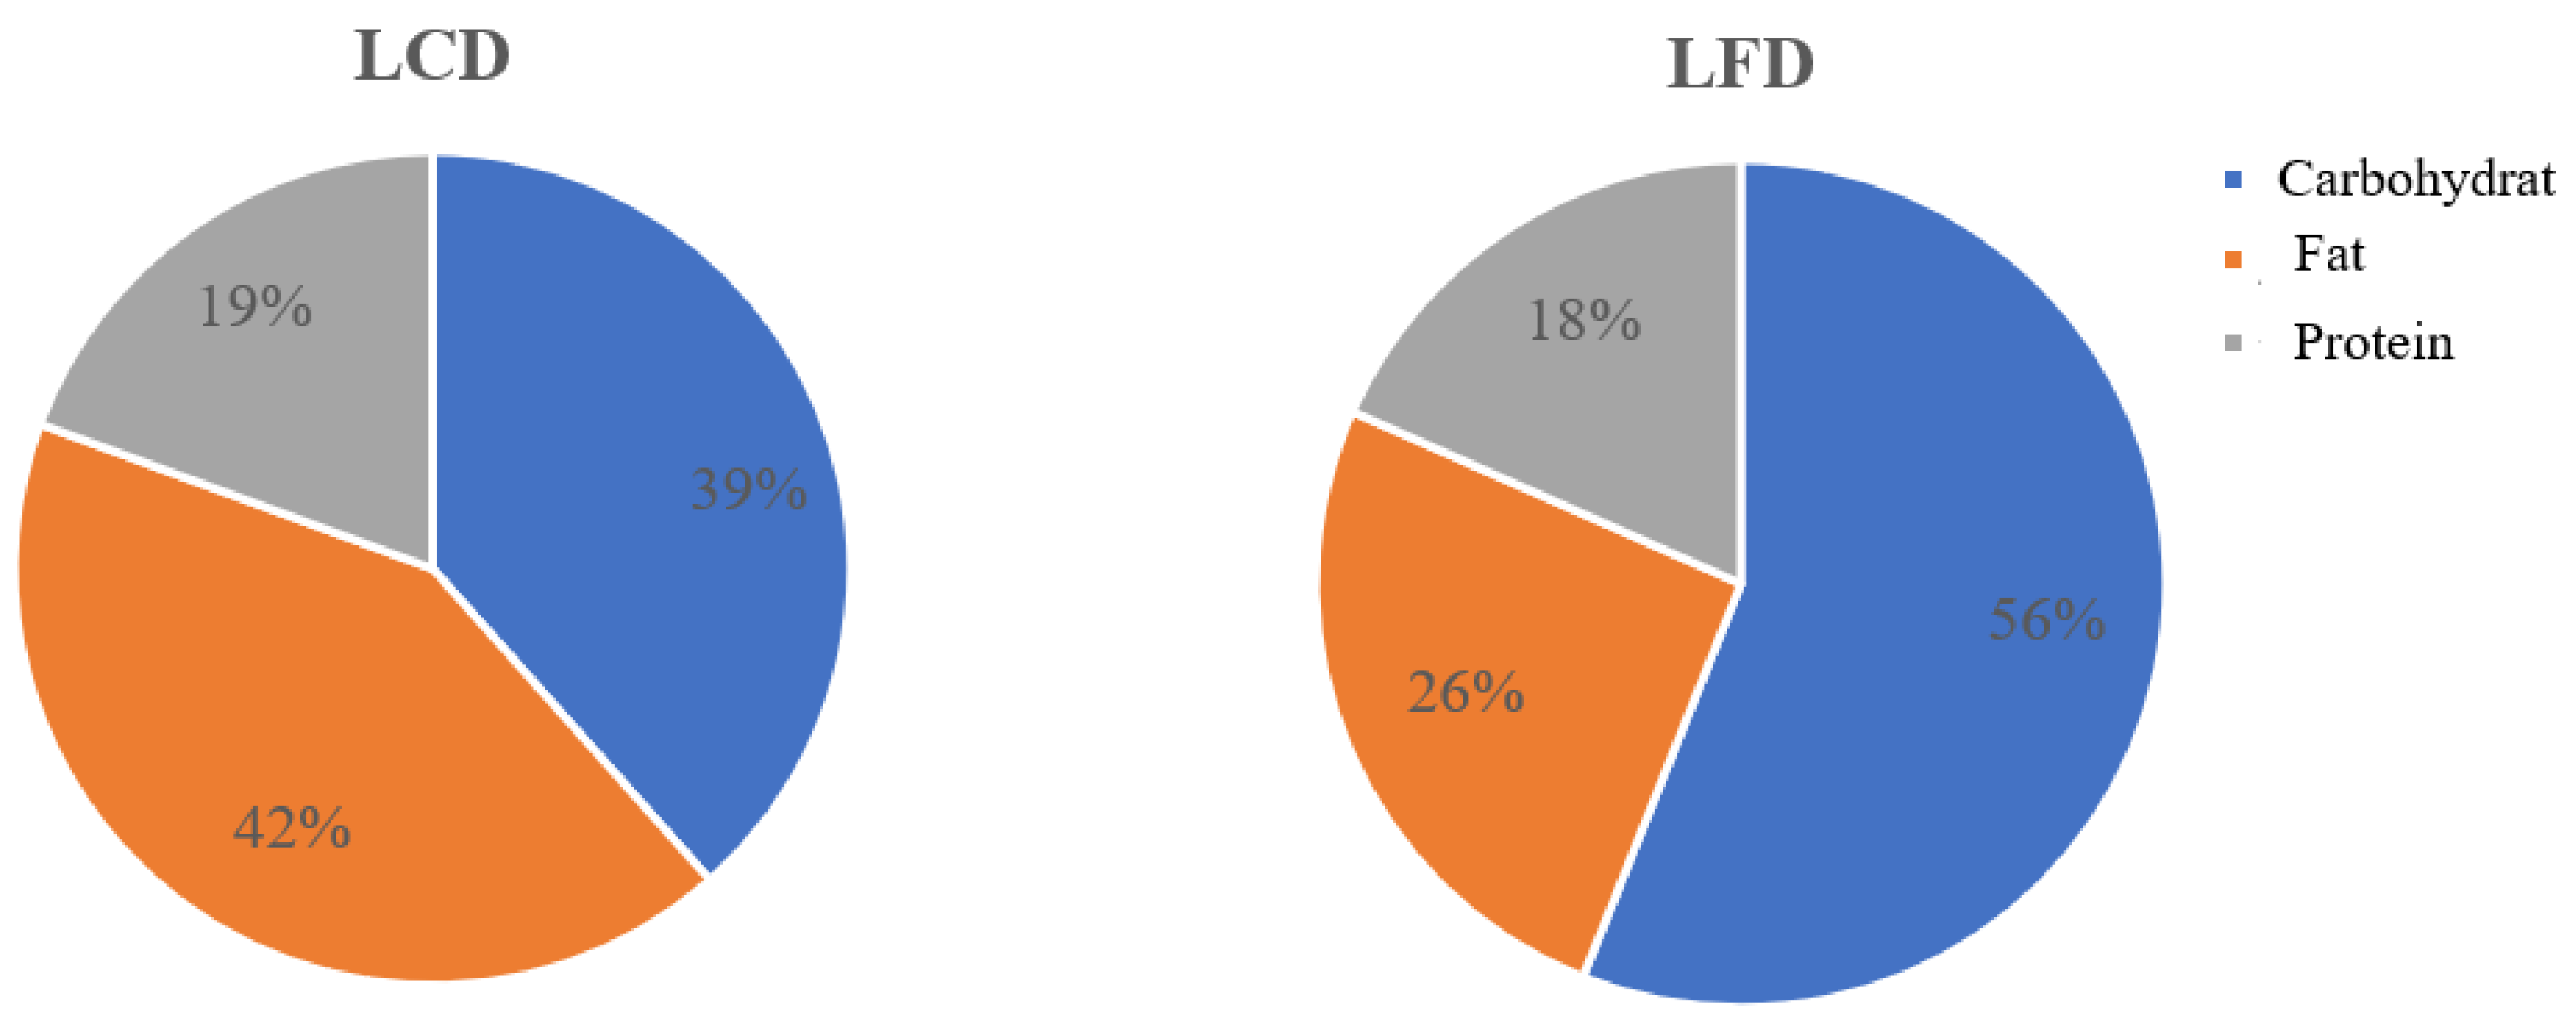
3.2.2. Proportions of Calories from Three Macronutrients the Patients Consumed
3.3. Effect of LCD on Glycemic Control
Glycated Hemoglobin
3.4. Fasting Blood Glucose
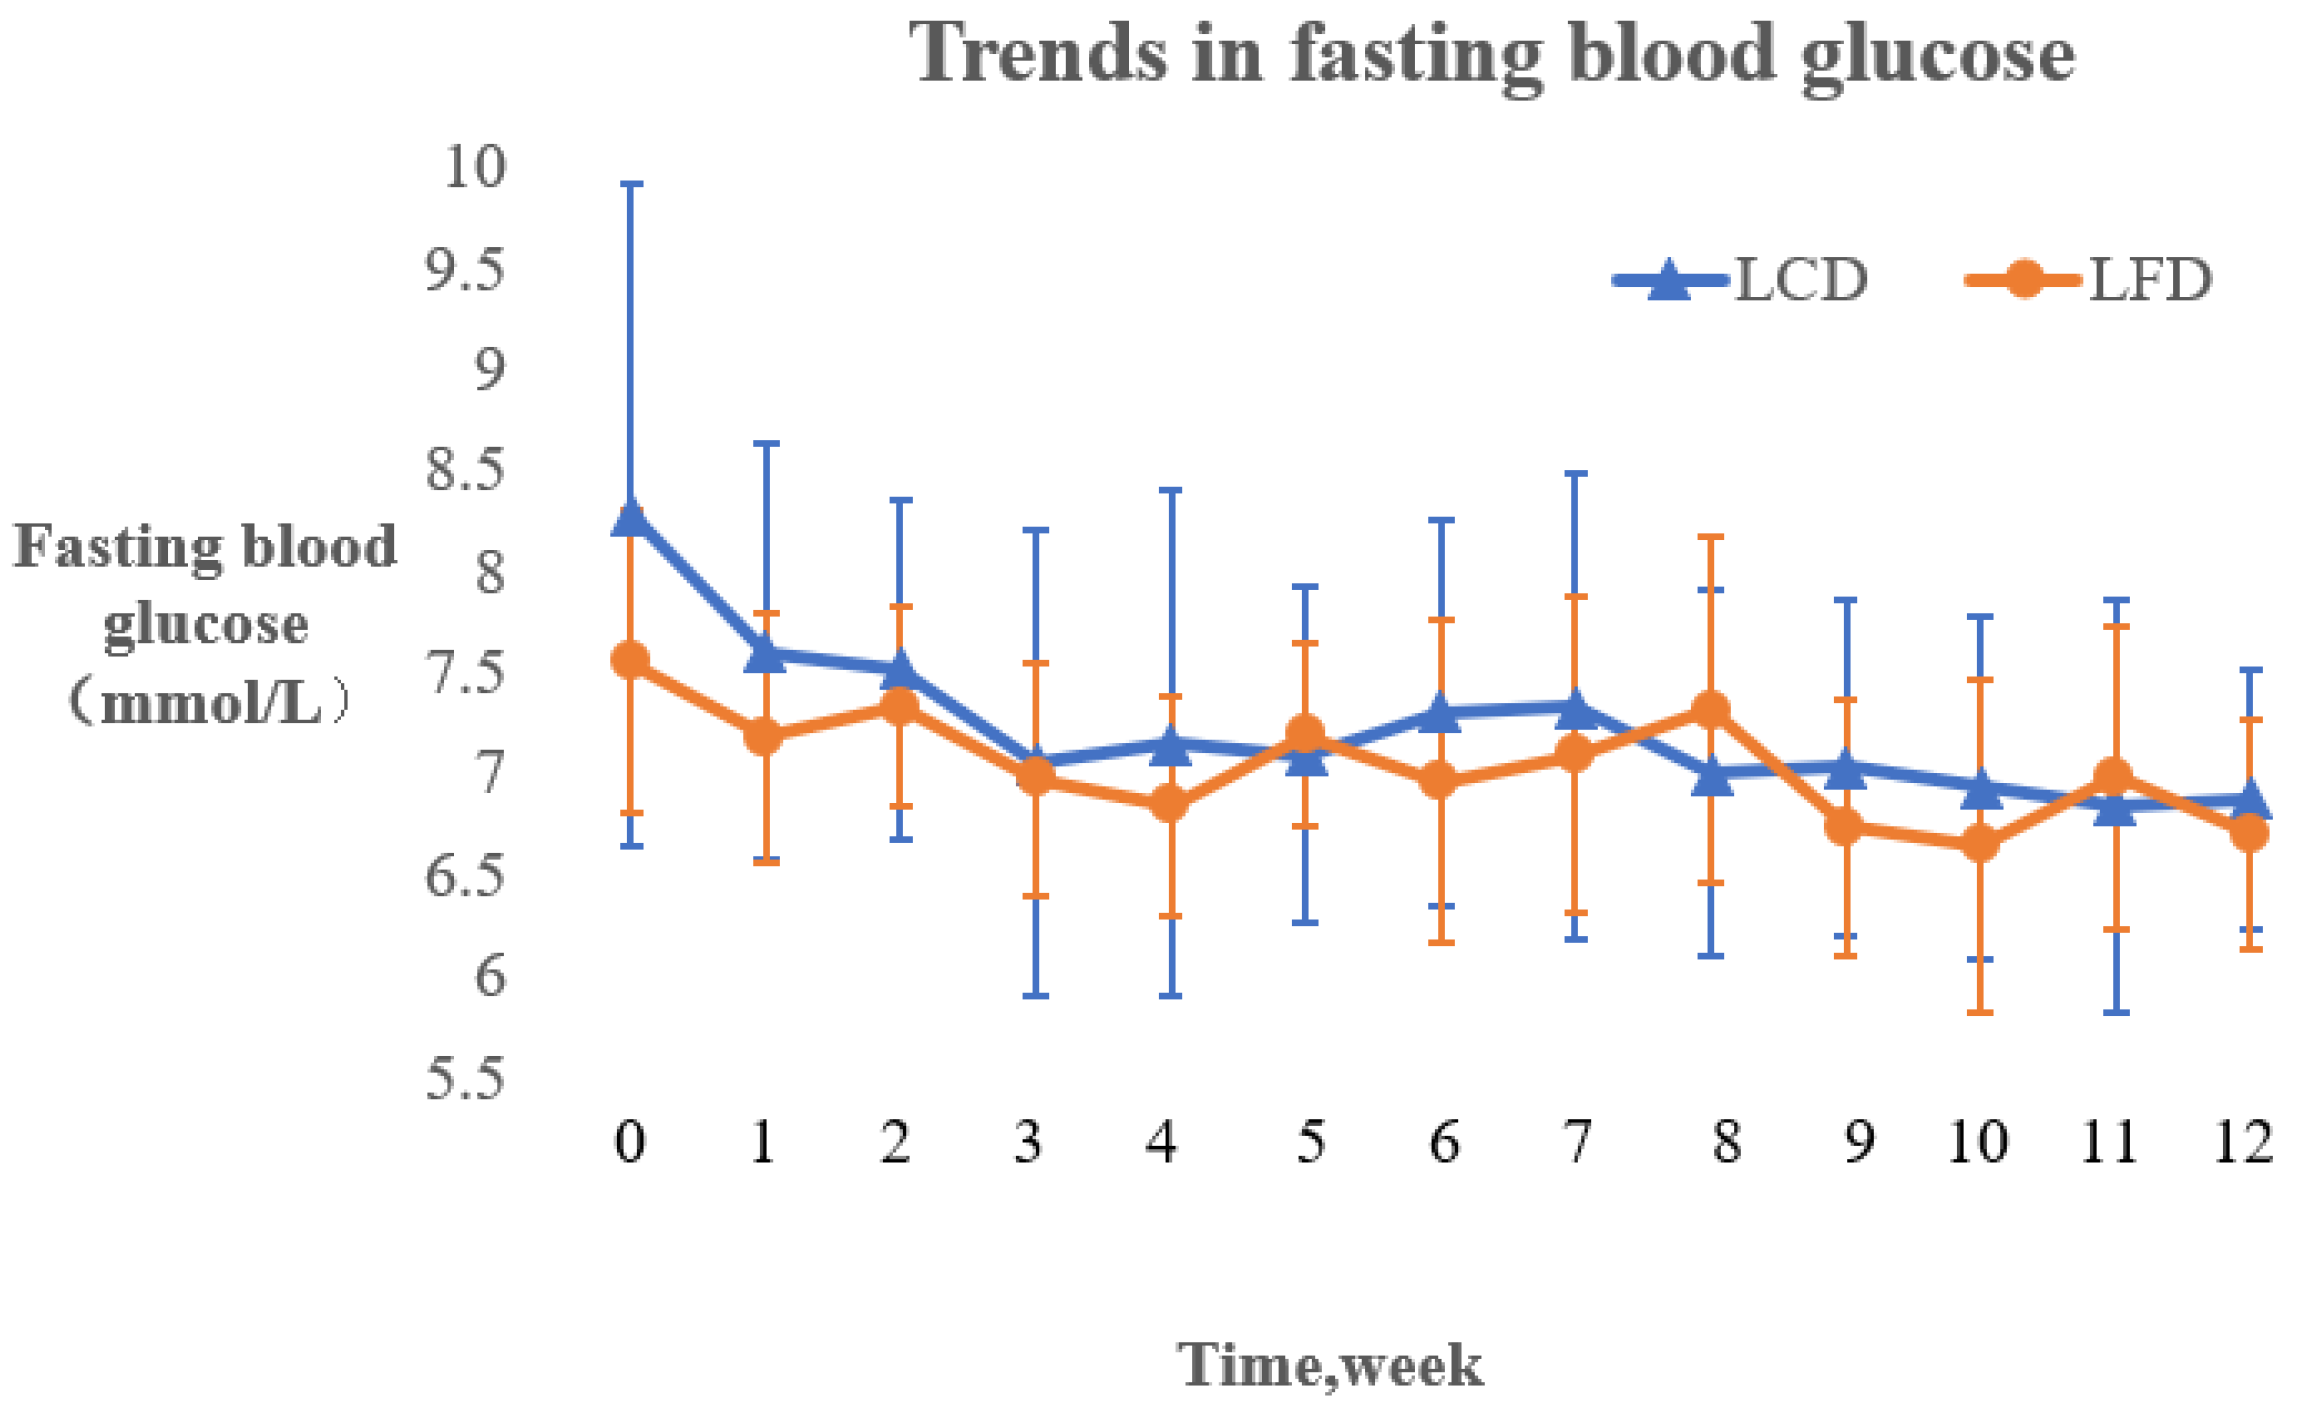
3.4.1. Changing Trends of Fasting Blood Glucose
3.4.2. Comparison of Fasting Blood Glucose levels
3.5. Postprandial Two-Hour Blood Glucose
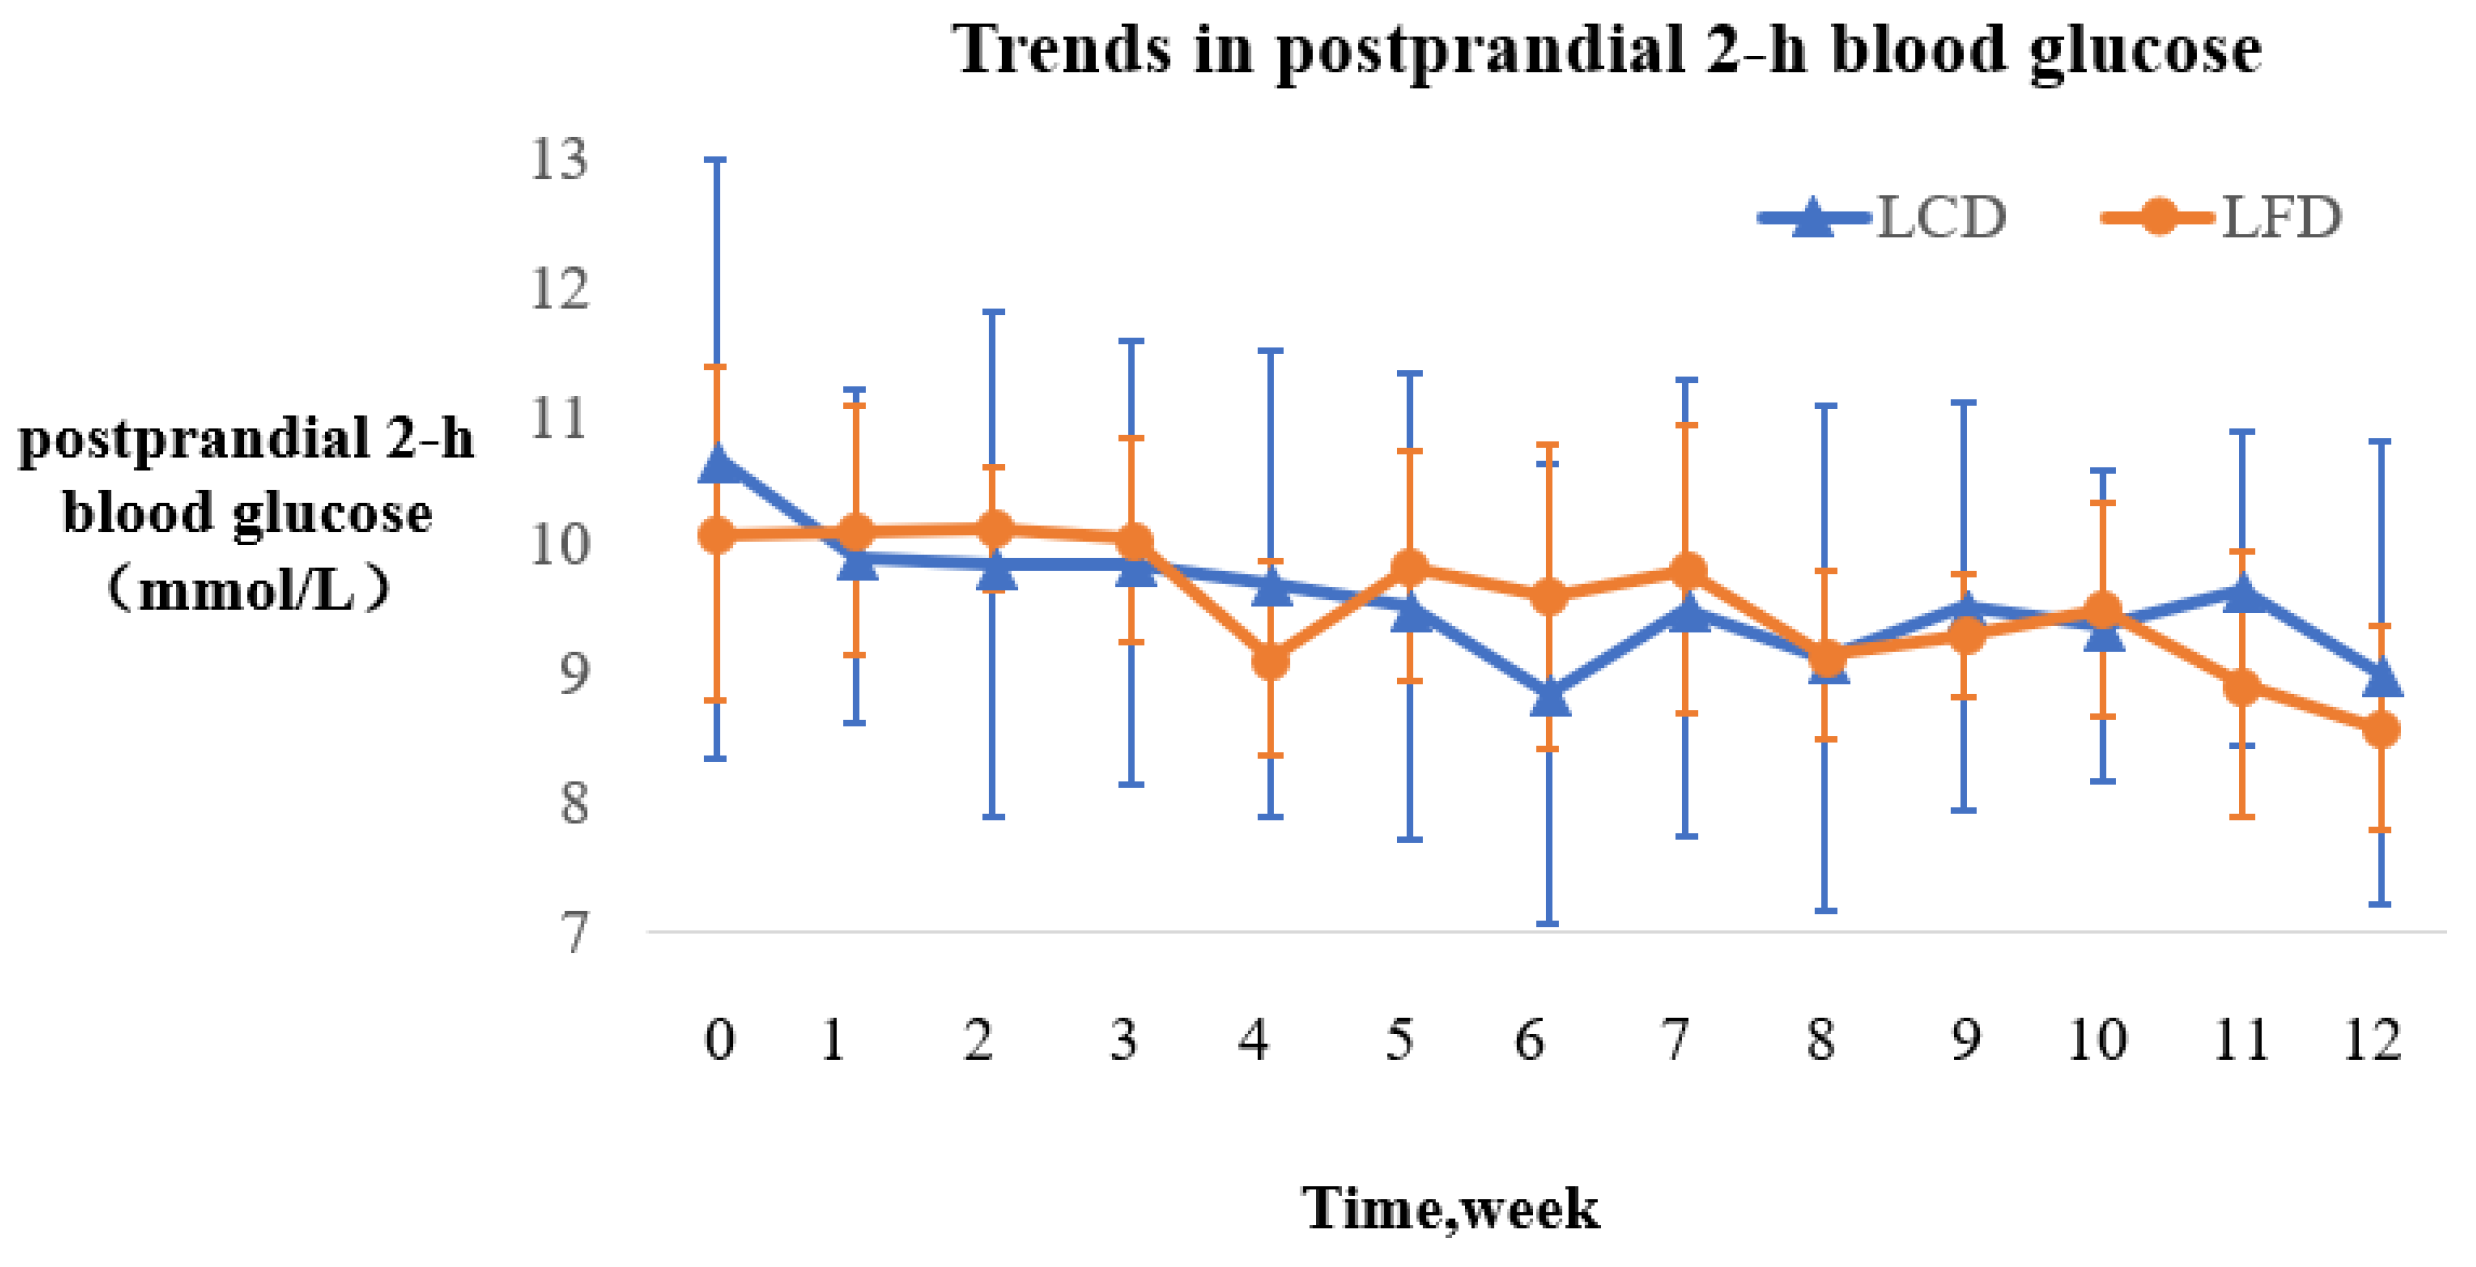
3.5.1. Trends in Postprandial Two-Hour Blood Glucose
3.5.2. Comparison of Postprandial Two-Hour Blood Glucose
3.6. Effect of LCD on Other Metabolic and Anthropometric Indicators
3.7. Hypoglycemia and Medication Changes
3.7.1. Frequency of Hypoglycemia
3.7.2. The Dosages of Insulin Used
3.7.3. The Changes of Other Antidiabetic Drugs
4. Discussion
4.1. Effect of LCD on Glycemic Control
4.2. Other Metabolic Indicators
4.3. Hypoglycemia and Medication Changes
5. Limitation
6. Conclusions
Author Contributions
Acknowledgments
Conflicts of Interest
References
- Breen, C.; Ryan, M.; Gibney, M.J.; O’Shea, D. Diabetes-related nutrition knowledge and dietary intake among adults with type 2 diabetes. Br. J. Nutr. 2015, 114, 439–447. [Google Scholar] [CrossRef] [PubMed]
- Ley, S.H.; Hamdy, O.; Mohan, V.; Hu, F.B. Prevention and management of type 2 diabetes: Dietary components and nutritional strategies. Lancet 2014, 383, 1999–2007. [Google Scholar] [CrossRef]
- Seetharaman, S.; Andel, R.; McEvoy, C.; Aslan, A.K.D.; Finkel, D.; Pedersen, N.L. Blood Glucose, Diet-Based Glycemic Load and Cognitive Aging Among Dementia-Free Older Adults. J. Gerontol. A Biol. Sci. Med. Sci. 2015, 70, 471. [Google Scholar] [CrossRef] [PubMed]
- Seetharaman, S. The Influences of Dietary Sugar and Related Metabolic Disorders on Cognitive Aging and Dementia. Mol. Basis Nutr. Aging 2016, 331–344. [Google Scholar] [CrossRef]
- Chinese Diabetes Society. Guidelines for the prevention and treatment of type 2 diabetes in China. Chin. Med. J. 2017, 10, 4–67. [Google Scholar]
- Cao, A.H.; Sun, L.Z.; Cui, J.W. Effects of A Low-Carbohydrate Diet and A Low-Fat Diet on Weight and Glycemic Control in Type 2 Diabetics Mellitus. Chin. Gener. Pract. 2011, 14, 52–56. [Google Scholar]
- Cao, A.L.; Xin, B. Effects of low-fat diet on body mass, blood lipids and sugar control in obese patients with type 2 diabetes mellitus. Clin. Focus 2012, 27, 1025–1031. [Google Scholar]
- Wang, Y.L.; Yao, Y.N.; Yang, X.L. Clinical study of the changing of bodyweight (BW) and fasting blood glucose (FBG) in obese patients with type 2 diabetes on a low-carbohydrate diet (LCD). J. Xinjiang Med. Univ. 2009, 32, 914–916. [Google Scholar]
- Hite, A.H.; Berkowitz, V.G.; Berkowitz, K. Low-carbohydrate diet review: Shifting the paradigm. Nutr. Clin. Pract. 2011, 26, 300. [Google Scholar] [CrossRef] [PubMed]
- Forsythe, C.E.; Phinney, S.D.; Fernandez, M.L.; Quann, E.E.; Wood, R.J.; Bibus, D.M.; Kraemer, W.J.; Feinman, R.D.; Volek, J.S. Comparison of Low Fat and Low Carbohydrate Diets on Circulating Fatty Acid Composition and Markers of Inflammation. Lipids 2008, 43, 65–77. [Google Scholar] [CrossRef] [PubMed]
- Dyson, P.A.; Kelly, T.; Deakin, T.; Duncan, A.; Frost, G.; Harrison, Z.; Khatri, D.; Kunka, D.; McArdle, P.; Mellor, D. Diabetes UK evidence-based nutrition guidelines for the prevention and management of diabetes. Diabet. Med. 2011, 28, 1282–1288. [Google Scholar] [CrossRef] [PubMed]
- Wheeler, M.L.; Dunbar, S.A.; Jaacks, L.M.; Wahida, K.; Mayer-Davis, E.J.; Judith, W.R., Jr.; William, S. Macronutrients, Food Groups, and Eating Patterns in the Management of Diabetes. Diabet. Care 2010, 35, 434–445. [Google Scholar] [CrossRef] [PubMed]
- Yamada, Y.; Uchida, J.; Izumi, H.; Tsukamoto, Y.; Inoue, G.; Watanabe, Y.; Irie, J.; Yamada, S. A non-calorie-restricted low-carbohydrate diet is effective as an alternative therapy for patients with type 2 diabetes. Int. Med. 2012, 53, 13. [Google Scholar] [CrossRef]
- Zhu, H.M.; Ji, C. The status and compliance of medical nutrition education in patients with type 2 diabetes. J. Nurs. 2015, 50–52. [Google Scholar]
- Asghari, G.; Ghorbani, Z.; Mirmiran, P.; Azizi, F. Nut consumption is associated with lower incidence of type 2 diabetes: The Tehran Lipid and Glucose Study. Diabet. Metab. 2017, 43, 18. [Google Scholar] [CrossRef] [PubMed]
- Chen, L. A brief discussion on the increase of fasting blood glucose. Health Guide 2014, 20, 34–35. [Google Scholar]
- Daving, Y.; Andrén, E.; Nordholm, L.; Grimby, G. Reliability of an interview approach to the Functional Independence Measure. Clin. Rehabil. 2001, 15, 301. [Google Scholar] [CrossRef] [PubMed]
- Turner, R.; Holman, R.; Cull, C.; Stratton, I.; Matthews, D.; Frighi, V.; Manley, S.; Neil, A.; McElroy, K.; Wright, D. Intensive blood-glucose control with sulphonylureas or insulin compared with conventional treatment and risk of complications in patients with type 2 diabetes (UKPDS 33). UK Prospective Diabetes Study (UKPDS) Group. Lancet 1998, 352, 837. [Google Scholar]
- Association WOHAD. Defining and reporting hypoglycemia in diabetes: A report from the American Diabetes Association Workgroup on Hypoglycemia. Diabet. Care 2005, 28, 1245. [Google Scholar]
- Cai, W. Modern Nutrition; Fudan University Press: Shanghai, China, 2011. [Google Scholar]
- Akhoundan, M.; Shadman, Z.; Jandaghi, P.; Aboeerad, M.; Larijani, B.; Jamshidi, Z.; Ardalani, H.; Nikoo, M.K. The Association of Bread and Rice with Metabolic Factors in Type 2 Diabetic Patients. PLoS ONE 2016, 11, e0167921. [Google Scholar] [CrossRef] [PubMed]
- Cohen, A.E.; Johnston, C.S. Almond ingestion at mealtime reduces postprandial glycemia and chronic ingestion reduces hemoglobin A in individuals with well-controlled type 2 diabetes mellitus. Metab. Clin. Exp. 2011, 60, 1312. [Google Scholar] [CrossRef] [PubMed]
- Li, S.C.; Liu, Y.H.; Liu, J.F.; Chang, W.H.; Chen, C.M.; Chen, C.Y. Almond consumption improved glycemic control and lipid profiles in patients with type 2 diabetes mellitus. Metab. Clin. Exp. 2011, 60, 474–479. [Google Scholar] [CrossRef] [PubMed]
- Sacks, F.M.; Carey, V.J.; Anderson, C.A.; Miller, E.R.; Copeland, T.; Charleston, J.; Harshfield, B.J.; Laranjo, N.; McCarron, P.; Swain, J. Effects of high vs low glycemic index of dietary carbohydrate on cardiovascular disease risk factors and insulin sensitivity: The OmniCarb randomized clinical trial. JAMA 2014, 312, 2531–2541. [Google Scholar] [CrossRef] [PubMed]
- Mayer, S.B.; Jeffreys, A.S.; Olsen, M.K.; McDuffie, J.R.; Feinglos, M.N., Jr.; Yancy, W.S. Two Diets with Different Hemoglobin A1c and Antiglycemic Medication Effects Despite Similar Weight Loss in Type 2 Diabetes. Diabet. Obes. Metab. 2014, 16, 90–93. [Google Scholar] [CrossRef] [PubMed]
- Liu, J.F.; Liu, Y.H.; Chen, C.M.; Chang, W.H.; Chen, C.O. The effect of almonds on inflammation and oxidative stress in Chinese patients with type 2 diabetes mellitus: A randomized crossover controlled feeding trial. Eur. J. Nutr. 2013, 52, 927–935. [Google Scholar] [CrossRef] [PubMed]
- Vadivel, V.; Kunyanga, C.N.; Biesalski, H.K. Health benefits of nut consumption with special reference to body weight control. Nutrition 2015, 28, 1089–1097. [Google Scholar] [CrossRef] [PubMed]
- Tan, S.Y.; Dhillon, J.; Mattes, R.D. A review of the effects of nuts on appetite, food intake, metabolism, and body weight. Am. J. Clin. Nutr. 2014, 100 (Suppl. 1), 412S–422S. [Google Scholar] [CrossRef] [PubMed]
- Barbour, J.A.; Howe, P.R.; Buckley, J.D.; Bryan, J.; Coates, A.M. Effect of 12 Weeks High Oleic Peanut Consumption on Cardio-Metabolic Risk Factors and Body Composition. Nutrients 2015, 7, 7381–7398. [Google Scholar] [CrossRef] [PubMed]
- Lovejoy, J.C.; Most, M.M.; Lefevre, M.; Greenway, F.L.; Rood, J.C. Effect of diets enriched in almonds on insulin action and serum lipids in adults with normal glucose tolerance or type 2 diabetes. Am. J. Clin. Nutr. 2002, 76, 1000–1006. [Google Scholar] [CrossRef] [PubMed]
- Westman, E.C.; Feinman, R.D.; Mavropoulos, J.C.; Vernon, M.C.; Volek, J.S.; Wortman, J.A.; Yancy, W.S.; Phinney, S.D. Low-carbohydrate nutrition and metabolism. Am. J. Clin. Nutr. 2007, 86, 276–284. [Google Scholar] [CrossRef] [PubMed]


| Variables | LCD (n = 24) | LFD (n = 25) | t/χ2 | p | |
|---|---|---|---|---|---|
| ± SD/n (%) | ± SD/n (%) | ||||
| Demographic data | |||||
| Age, years | 66.79 ± 9.12 | 61.20 ± 11.71 | 1.860 a | NS | |
| Gender, Male | 13 (54.2) | 13 (52.0) | 0.023 b | NS | |
| Marital Status | Married | 23 (95.8) | 22 (88) | 1.728 c | NS |
| Unmarried | 0 (0) | 1 (4.0) | |||
| Widowhood | 1 (4.2) | 2 (8.0) | |||
| Education level, years | 9.63 ± 4.10 | 8.36 ± 3.12 | 1.219 a | NS | |
| Occupation status | On the job | 4 (16.7) | 10 (40.0) | 3.267 b | NS |
| Retirement | 20 (83.3) | 15 (60.0) | |||
| Residential status | Living by oneself | 1 (4.2) | 4 (16.0) | 3.733 c | NS |
| Living with spouse | 21 (87.4) | 19 (76.0) | |||
| Living with children | 1 (4.2) | 2 (8.0) | |||
| Living with mother | 1 (4.2) | 0 (0) | |||
| Medical insurance, No | 1 (4.2) | 1 (4.0) | 0.001 b | NS | |
| Family Support | Value | 19 (79.2) | 14 (56.0) | 2.988 b | NS |
| Ordinary | 5 (20.8) | 11 (44.0) | |||
| Exercise | Never exercise | 1 (4.2) | 2 (8.0) | 0.400 c | NS |
| Never regular exercise | 11 (45.8) | 12 (48.0) | |||
| Regular exercise | 12 (50.0) | 11 (44.0) | |||
| Clinical data | |||||
| Smoking, yes | 2 (8.3) | 5 (20.0) | 1.361 d | NS | |
| SBP, mmHg | 131.42 ± 10.89 | 130.84 ± 14.83 | 0.155 a | NS | |
| DBP, mmHg | 77.54 ± 10.48 | 76.40 ± 10.43 | 0.382 a | NS | |
| Family history of diabetes, yes | 12 (50.0) | 9 (36.0) | 0.980 b | NS | |
| Diabetes duration, years | 12.79 ± 6.49 | 9.10 ± 6.52 | 1.985 a | NS | |
| Oral antilipemic agents, yes | 8 (33.3) | 11 (44.0) | 0.587 a | NS | |
| Oral antidiabetic drugs or/and insulin | 22 (91.7) | 22 (88.0) | - d | NS | |
| Complications, yes | 9 (37.5) | 5 (20.0) | 1.838 b | NS | |
| Accompanying diseases, yes | 17 (70.8) | 19 (76.0) | 0.168 b | NS | |
| LCD (n = 24) | LFD (n = 25) | Z | p | |
|---|---|---|---|---|
| 4 d/W | 3 (12.5) | 7 (28.0) | 4.449 | NS |
| 5~6 d/W | 7 (29.2) | 10 (40.0) | ||
| 7 d/W | 14 (58.3) | 8 (32.0) |
| Variables | LCD (n = 24) | LFD (n = 25) | T | p | |
|---|---|---|---|---|---|
| Baseline | Total calorie intake/day | 1796.0 ± 186.6 | 1768.8 ± 138.7 | 0.421 | NS |
| Carbohydrate-calorie (Kcal) | 948.8 ± 130.9 | 922.5 ± 145.1 | 0.485 | NS | |
| Fat-calorie (Kcal) | 538.9 ± 92.4 | 542.0 ± 94.8 | −0.084 | NS | |
| Protein-calorie (Kcal) | 306.6 ± 56.7 | 303.3 ± 41.8 | 0.166 | NS | |
| 3rd month | Total calorie intake/day | 1808.0 ± 190.7 | 1731.5 ± 109.6 | 1.257 | NS |
| Carbohydrate-calorie (Kcal) | 695.2 ± 106.6 | 970.2 ± 101.1 | −6.747 | <0.001 ** | |
| Fat-calorie (Kcal) | 763.1 ± 99.1 | 442.8 ± 52.0 | 10.320 | <0.001 ** | |
| Protein-calorie (Kcal) | 350.3 ± 64.4 | 317.4 ± 52.0 | 1.433 | NS |
| Study Period | LCD (n = 24) | LFD (n = 25) | t | p |
|---|---|---|---|---|
| Baseline | 7.43 ± 1.39 | 7.79 ± 1.20 | −0.971 | NS |
| 3rd month | 6.80 ± 0.83 | 7.48 ± 1.15 | −2.350 | 0.023 * |
| MD | 0.63 ± 1.18 | 0.31 ± 0.70 | - | - |
| t | 2.601 | 2.213 | - | - |
| p | 0.016 * | 0.037 * | - | - |
| Study Period | LCD (n = 28) | LFD (n = 28) | T | p |
|---|---|---|---|---|
| Baseline | 7.39 ± 1.29 | 8.16 ± 1.59 | −1.994 | NS |
| 3rd month | 6.85 ± 0.79 | 7.89 ± 1.63 | −3.017 | 0.004 ** |
| MD | 0.54 ± 1.12 | 0.28 ± 0.67 | - | - |
| t | 2.556 | 2.194 | - | - |
| p | 0.017 * | 0.037 * | - | - |
| Study Period | LCD (n = 24) | LFD (n = 25) | t | p |
|---|---|---|---|---|
| Baseline | 8.28 ± 1.64 | 7.55 ± 0.75 | 1.469 | NS |
| 3rd month | 6.87 ± 0.65 | 6.70 ± 0.57 | 0.793 | NS |
| t | 4.873 | 3.889 | - | - |
| p | <0.001 ** | 0.003 ** | - | - |
| Study Period | LCD (n = 24) | LFD (n = 25) | t | p |
|---|---|---|---|---|
| Baseline | 10.67 ± 2.33 | 10.08 ± 1.29 | 0.818 | NS |
| 3rd month | 9.00 ± 1.80 | 8.58 ± 0.80 | 0.761 | NS |
| t | 4.690 | 3.786 | - | - |
| p | <0.001 ** | 0.003 ** | - |
| Variables | Study Period | LCD (n = 24) | LFD (n = 25) | t | p |
|---|---|---|---|---|---|
| BMI (Kg/m2) | Baseline | 24.29 ± 3.36 | 24.62 ± 5.17 | −0.261 | NS |
| 3rd month | 23.52 ± 2.70 | 23.47 ± 3.11 | 0.060 | NS | |
| t | 2.756 | 1.235 | - | - | |
| p | 0.011 * | NS | - | - | |
| TC (mmol/L) | Baseline | 4.85 ± 0.87 | 4.55 ± 1.04 | 1.101 | NS |
| 3rd month | 4.49 ± 0.86 | 4.63 ± 0.99 | −0.521 | NS | |
| t | 2.540 | −0.363 | - | - | |
| p | 0.018 * | NS | - | - |
| Time | LCD (n = 24) | LFD (n = 25) | t | P |
|---|---|---|---|---|
| Baseline | 0.21 ± 0.59 | 0.52 ± 0.77 | −1.596 | NS |
| 3rd month | 0.04 ± 0.20 | 0.36 ± 0.86 | −1.798 | NS |
| t | 1.282 | 0.778 | - | - |
| p | NS | NS | - | - |
| Times | LCD (n = 7) | LFD (n = 13) | t | P |
|---|---|---|---|---|
| Baseline | 31.14 ± 16.38 | 29.00 ± 12.27 | 0.332 | NS |
| 3rd month | 28.29 ± 13.74 | 26.62 ± 11.20 | 0.294 | NS |
| t | 2.765 | 3.023 | - | - |
| p | 0.033 * | 0.011 * | - | - |
| LCD (n = 23) | LFD (n = 11) | χ2 | p | |
|---|---|---|---|---|
| No change | 20 (87.0%) | 11 (100%) | 2.482 | NS |
| Reduction | 2 (8.7%) | 0 (0) | ||
| Addition | 1 (4.3%) | 0 (0) |
© 2018 by the authors. Licensee MDPI, Basel, Switzerland. This article is an open access article distributed under the terms and conditions of the Creative Commons Attribution (CC BY) license (http://creativecommons.org/licenses/by/4.0/).
Share and Cite
Wang, L.-L.; Wang, Q.; Hong, Y.; Ojo, O.; Jiang, Q.; Hou, Y.-Y.; Huang, Y.-H.; Wang, X.-H. The Effect of Low-Carbohydrate Diet on Glycemic Control in Patients with Type 2 Diabetes Mellitus. Nutrients 2018, 10, 661. https://doi.org/10.3390/nu10060661
Wang L-L, Wang Q, Hong Y, Ojo O, Jiang Q, Hou Y-Y, Huang Y-H, Wang X-H. The Effect of Low-Carbohydrate Diet on Glycemic Control in Patients with Type 2 Diabetes Mellitus. Nutrients. 2018; 10(6):661. https://doi.org/10.3390/nu10060661
Chicago/Turabian StyleWang, Li-Li, Qi Wang, Yong Hong, Omorogieva Ojo, Qing Jiang, Yun-Ying Hou, Yu-Hua Huang, and Xiao-Hua Wang. 2018. "The Effect of Low-Carbohydrate Diet on Glycemic Control in Patients with Type 2 Diabetes Mellitus" Nutrients 10, no. 6: 661. https://doi.org/10.3390/nu10060661
APA StyleWang, L.-L., Wang, Q., Hong, Y., Ojo, O., Jiang, Q., Hou, Y.-Y., Huang, Y.-H., & Wang, X.-H. (2018). The Effect of Low-Carbohydrate Diet on Glycemic Control in Patients with Type 2 Diabetes Mellitus. Nutrients, 10(6), 661. https://doi.org/10.3390/nu10060661