Habitual Flavonoid Intake from Fruit and Vegetables during Adolescence and Serum Lipid Levels in Early Adulthood: A Prospective Analysis

 , ,
, , 
Abstract
:1. Introduction
2. Materials and Methods
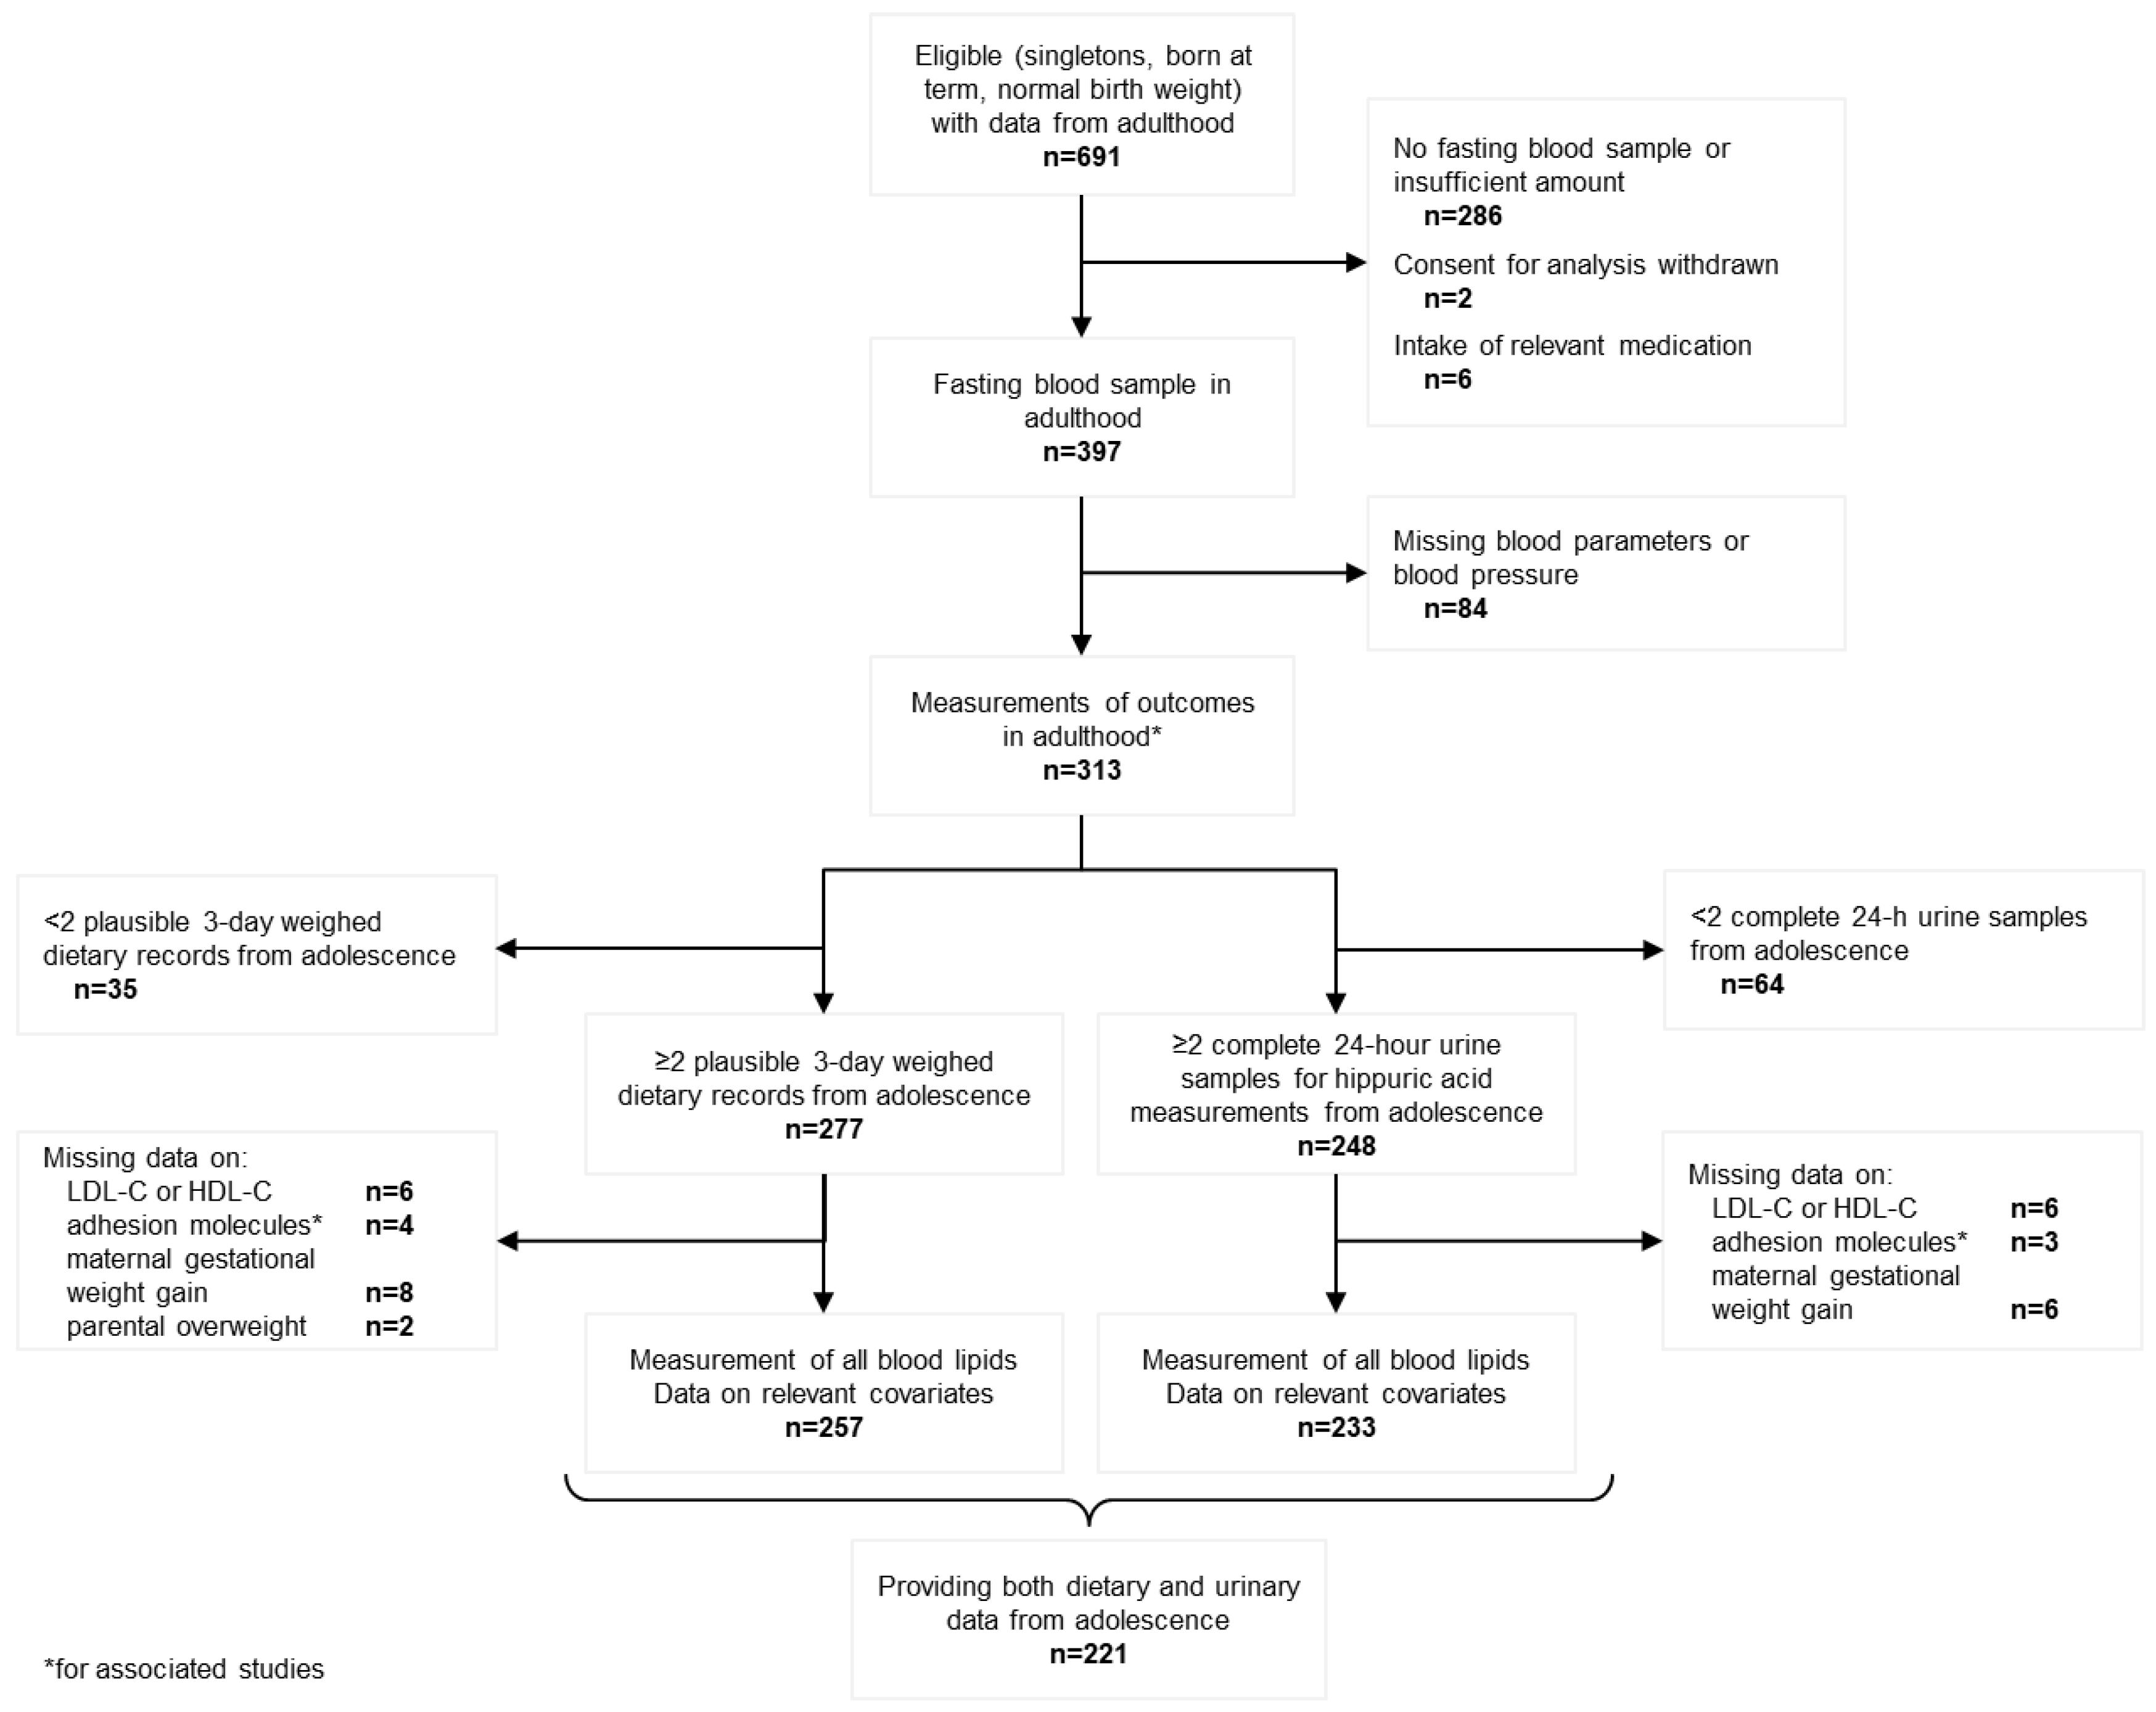
2.1. Study Population
2.2. Dietary Assessment
2.3. Urine Collection and Analysis
2.4. Blood Sampling and Analysis
2.5. Anthropometric Measurements and Assessment of Additional Data
2.6. Statistical Analysis
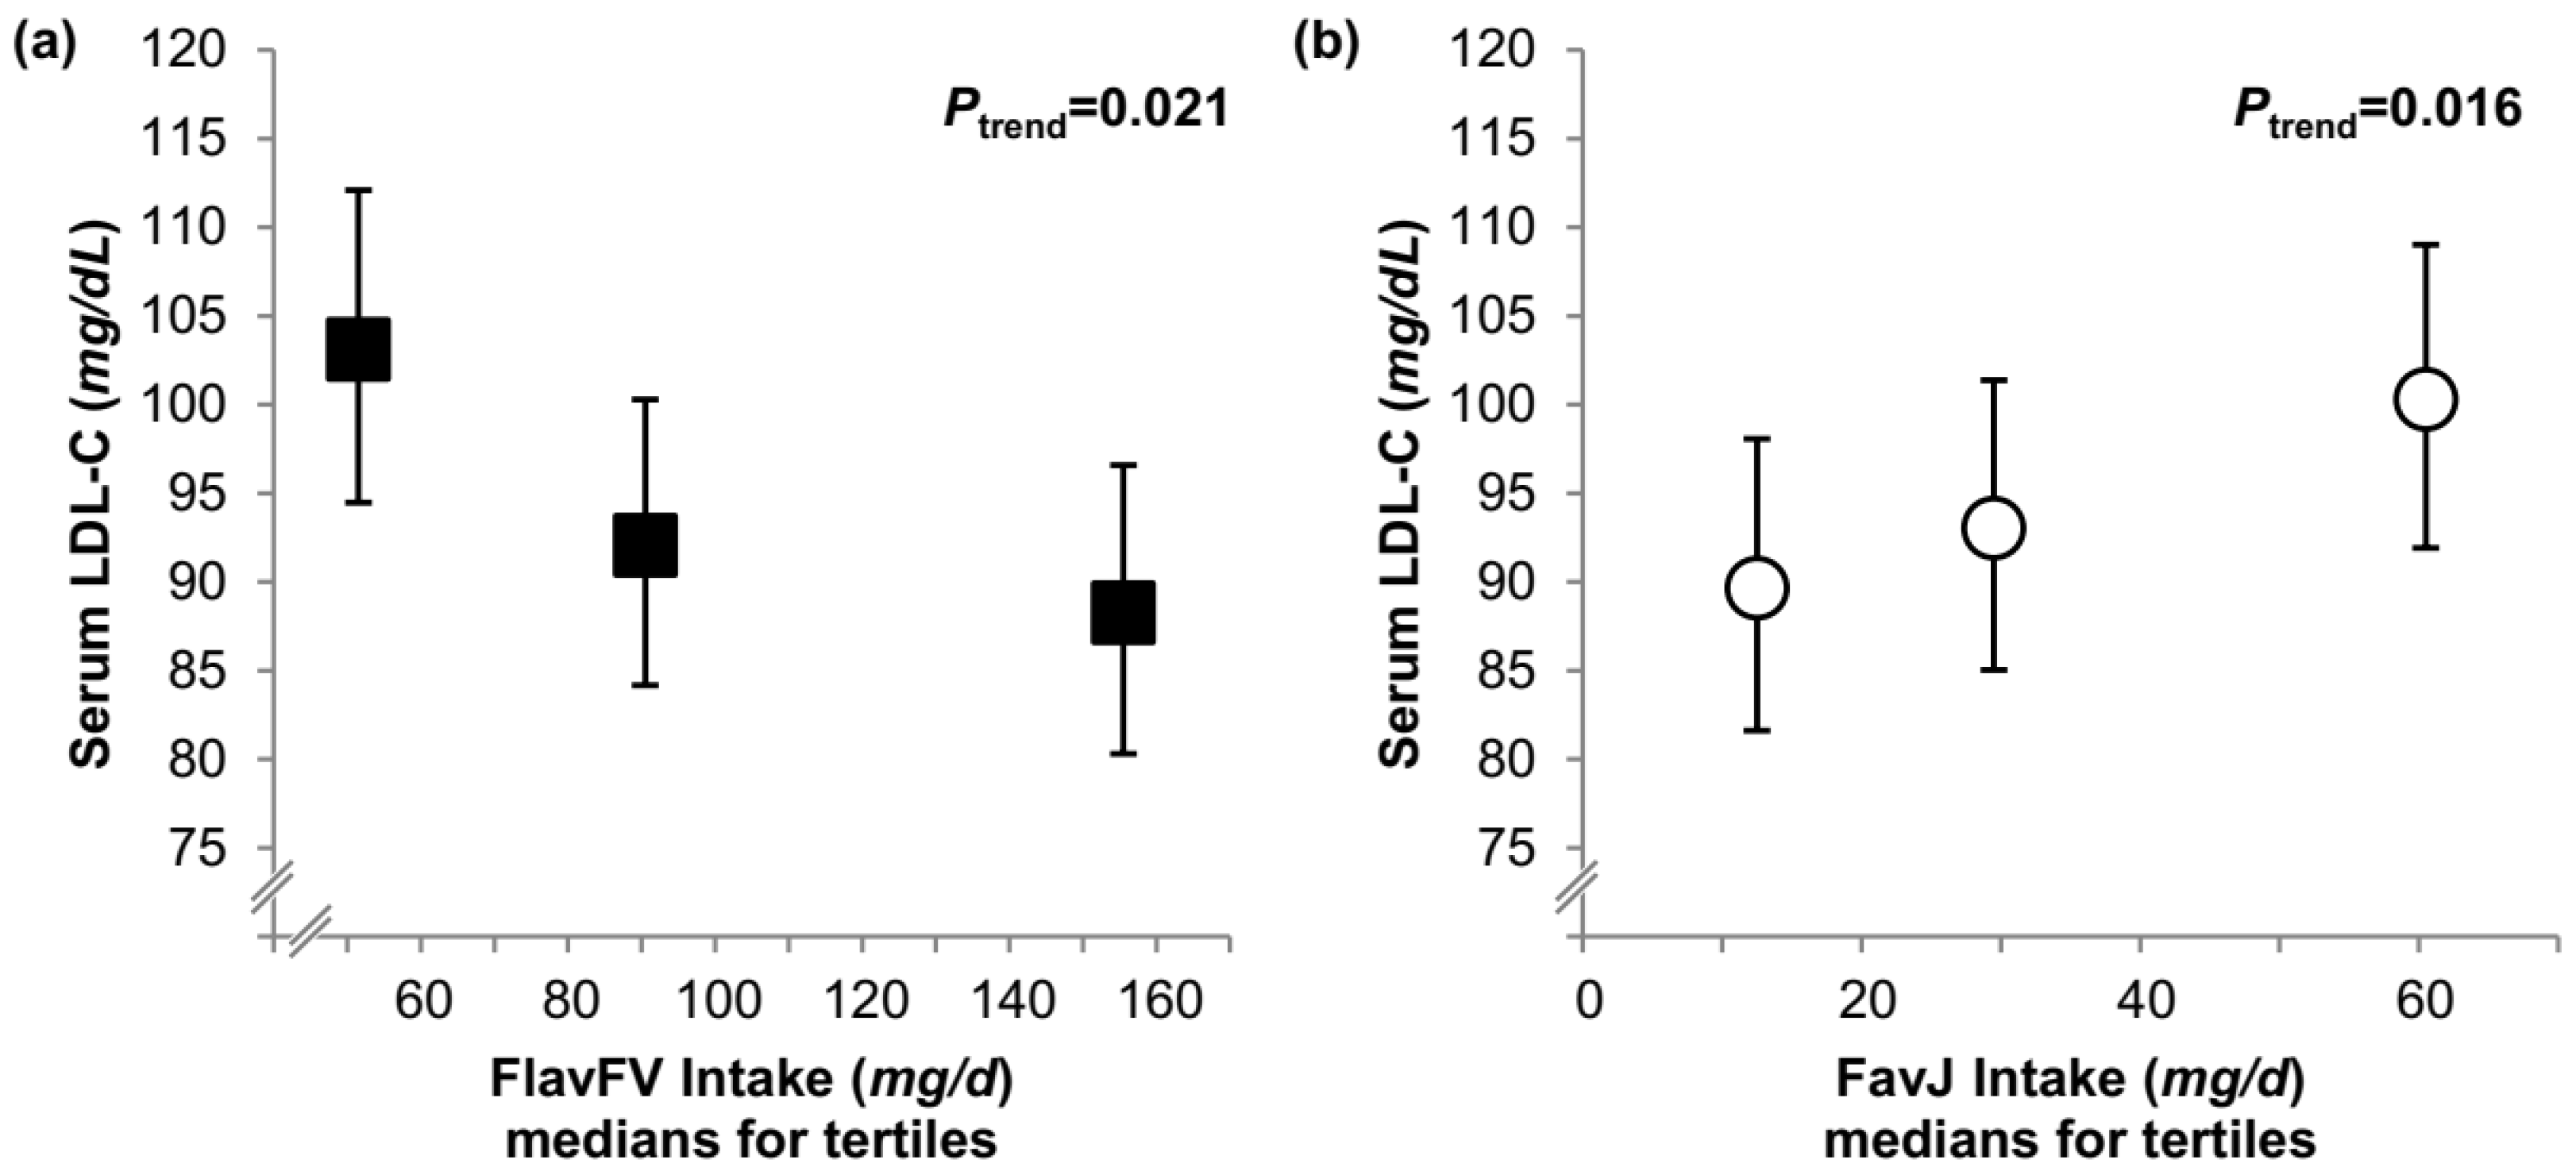
3. Results
4. Discussion
Acknowledgments
Author Contributions
Conflicts of Interest
References
- Zanotti, I.; Dall’Asta, M.; Mena, P.; Mele, L.; Bruni, R.; Ray, S.; Del Rio, D. Atheroprotective effects of (poly)phenols: A focus on cell cholesterol metabolism. Food Funct. 2015, 6, 13–31. [Google Scholar] [CrossRef] [PubMed]
- Williamson, G. The role of polyphenols in modern nutrition. Nutr. Bull. 2017, 42, 226–235. [Google Scholar] [CrossRef] [PubMed]
- Crozier, A.; Jaganath, I.B.; Clifford, M.N. Dietary phenolics: Chemistry, bioavailability and effects on health. Nat. Prod. Rep. 2009, 26, 1001–1043. [Google Scholar] [CrossRef] [PubMed]
- Zamora-Ros, R.; Knaze, V.; Luján-Barroso, L.; Romieu, I.; Scalbert, A.; Slimani, N.; Hjartåker, A.; Engeset, D.; Skeie, G.; Overvad, K.; et al. Differences in dietary intakes, food sources and determinants of total flavonoids between Mediterranean and non-Mediterranean countries participating in the European Prospective Investigation into Cancer and Nutrition (EPIC) study. Br. J. Nutr. 2013, 109, 1498–1507. [Google Scholar] [CrossRef] [PubMed]
- Van Dam, R.M.; Naidoo, N.; Landberg, R. Dietary flavonoids and the development of type 2 diabetes and cardiovascular diseases: Review of recent findings. Curr. Opin. Lipidol. 2013, 24, 25–33. [Google Scholar] [CrossRef] [PubMed]
- Wang, X.; Ouyang, Y.Y.; Liu, J.; Zhao, G. Flavonoid intake and risk of CVD: A systematic review and meta-analysis of prospective cohort studies. Br. J. Nutr. 2014, 111, 1–11. [Google Scholar] [CrossRef] [PubMed]
- Catapano, A.L.; Graham, I.; De Backer, G.; Wiklund, O.; Chapman, M.J.; Drexel, H.; Hoes, A.W.; Jennings, C.S.; Landmesser, U.; Pedersen, T.R.; et al. 2016 ESC/EAS Guidelines for the Management of Dyslipidaemias. Eur. Heart J. 2016, 37, 2999–3058. [Google Scholar] [CrossRef] [PubMed]
- Steinberger, J.; Daniels, S.R.; Hagberg, N.; Isasi, C.R.; Kelly, A.S.; Lloyd-Jones, D.; Pate, R.R.; Pratt, C.; Shay, C.M.; Towbin, J.A.; et al. Cardiovascular Health Promotion in Children: Challenges and Opportunities for 2020 and Beyond: A Scientific Statement From the American Heart Association. Circulation 2016, 134, e236–e255. [Google Scholar] [CrossRef] [PubMed]
- Magnussen, C.G.; Thomson, R.; Cleland, V.J.; Ukoumunne, O.C.; Dwyer, T.; Venn, A. Factors affecting the stability of blood lipid and lipoprotein levels from youth to adulthood: Evidence from the Childhood Determinants of Adult Health Study. Arch.Pediatr. Adolesc. Med. 2011, 165, 68–76. [Google Scholar] [CrossRef] [PubMed]
- Vogiatzoglou, A.; Heuer, T.; Mulligan, A.A.; Lentjes, M.A.H.; Luben, R.N.; Kuhnle, G.G.C. Estimated dietary intakes and sources of flavanols in the German population (German National Nutrition Survey II). Eur. J. Nutr. 2014, 53, 635–643. [Google Scholar] [CrossRef] [PubMed]
- Ravn-Haren, G.; Dragsted, L.O.; Buch-Andersen, T.; Jensen, E.N.; Jensen, R.I.; Németh-Balogh, M.; Paulovicsová, B.; Bergström, A.; Wilcks, A.; Licht, T.R.; et al. Intake of whole apples or clear apple juice has contrasting effects on plasma lipids in healthy volunteers. Eur. J. Nutr. 2013, 52, 1875–1889. [Google Scholar] [CrossRef] [PubMed]
- Linseisen, J.; Rohrmann, S. Biomarkers of dietary intake of flavonoids and phenolic acids for studying diet-cancer relationship in humans. Eur. J. Nutr. 2008, 47, 60–68. [Google Scholar] [CrossRef] [PubMed]
- Penczynski, K.J.; Krupp, D.; Bring, A.; Bolzenius, K.; Remer, T.; Buyken, A.E. Relative validation of 24-h urinary hippuric acid excretion as a biomarker for dietary flavonoid intake from fruit and vegetables in healthy adolescents. Eur. J. Nutr. 2017, 56, 757–766. [Google Scholar] [CrossRef] [PubMed]
- Kroke, A.; Manz, F.; Kersting, M.; Remer, T.; Sichert-Hellert, W.; Alexy, U.; Lentze, M.J. The DONALD Study. Eur. J. Nutr. 2004, 43, 45–54. [Google Scholar] [CrossRef] [PubMed]
- Penczynski, K.J.; Remer, T.; Herder, C.; Krupp, D.; Rienks, J.; Bolzenius, K.; Roden, M.; Buyken, A.E. Prospektive Relevanz habitueller Flavonoidzufuhr aus Obst und Gemüse während der Pubertät für Blutspiegel von Lipiden und Adhäsionsmolekülen im jungen Erwachsenenalter. In Abstractband Zum 54 Wissenschaftlichen Kongress; Proceedings of the German Nutrition Society, Kiel, Germany, 1–3 March 2017; Deutsche Gesellschaft für Ernährung e.V.: Bonn, Germany, 2017; Volume 23. [Google Scholar]
- Penczynski, K.J.; Herder, C.; Krupp, D.; Rienks, J.; Egert, S.; Wudy, S.A.; Roden, M.; Remer, T.; Buyken, A.E. Flavonoid intake from fruit and vegetables during adolescence is prospectively associated with a favourable risk factor profile for type 2 diabetes in early adulthood. Eur. J. Nutr. 2018, 1–14. [Google Scholar] [CrossRef] [PubMed]
- Sichert-Hellert, W.; Kersting, M.; Chahda, C.; Schäfer, R.; Kroke, A. German food composition database for dietary evaluations in children and adolescents. J. Food Comp. Anal. 2007, 20, 63–70. [Google Scholar] [CrossRef]
- Tomokuni, K.; Ogata, M. Direct colorimetric determination of hippuric acid in urine. Clin. Chem. 1972, 18, 349–351. [Google Scholar] [PubMed]
- Kromeyer-Hauschild, K.; Wabitsch, M.; Kunze, D.; Geller, F.; Geiß, H.C.; Hesse, V.; von Hippel, A.; Jaeger, U.; Johnsen, D.; Korte, W.; et al. Perzentile für den Body-mass-Index für das Kindes- und Jugendalter unter Heranziehung verschiedener deutscher Stichproben. Monat. Kinderheilk. 2001, 149, 807–818. [Google Scholar] [CrossRef]
- Cole, T.J.; Bellizzi, M.C.; Flegal, K.M.; Dietz, W.H. Establishing a standard definition for child overweight and obesity worldwide: International survey. BMJ (Clinical Research Ed.) 2000, 320, 1240–1243. [Google Scholar] [CrossRef]
- Taylor, T.P.; Wang, W.; Shrayyef, M.Z.; Cheek, D.; Hutchison, F.N.; Gadegbeku, C.A. Glomerular filtration rate can be accurately predicted using lean mass measured by dual-energy X-ray absorptiometry. Nephrol. Dial. Transplant. 2006, 21, 84–87. [Google Scholar] [CrossRef] [PubMed]
- Victora, C.G.; Huttly, S.R.; Fuchs, S.C.; Olinto, M.T. The role of conceptual frameworks in epidemiological analysis: A hierarchical approach. Int. J. Epidemiol. 1997, 26, 224–227. [Google Scholar] [CrossRef] [PubMed]
- Guo, X.; Tresserra-Rimbau, A.; Estruch, R.; Martinez-Gonzalez, M.A.; Medina-Remon, A.; Castaner, O.; Corella, D.; Salas-Salvado, J.; Lamuela-Raventos, R.M. Effects of Polyphenol, Measured by a Biomarker of Total Polyphenols in Urine, on Cardiovascular Risk Factors After a Long-Term Follow-Up in the PREDIMED Study. Oxid. Med. Cell. Longev. 2016, 2016, 1–11. [Google Scholar] [CrossRef] [PubMed]
- Sohrab, G.; Hosseinpour-Niazi, S.; Hejazi, J.; Yuzbashian, E.; Mirmiran, P.; Azizi, F. Dietary polyphenols and metabolic syndrome among Iranian adults. Int. J. Food Sci. Nutr. 2013, 64, 661–667. [Google Scholar] [CrossRef] [PubMed]
- Vitale, M.; Vaccaro, O.; Masulli, M.; Bonora, E.; Del Prato, S.; Giorda, C.B.; Nicolucci, A.; Squatrito, S.; Auciello, S.; Babini, A.C.; et al. Polyphenol intake and cardiovascular risk factors in a population with type 2 diabetes: The TOSCA.IT study. Clin. Nutr. (Edinburgh, Scotland) 2017, 36, 1686–1692. [Google Scholar] [CrossRef] [PubMed]
- Li, G.; Zhu, Y.; Zhang, Y.; Lang, J.; Chen, Y.; Ling, W. Estimated daily flavonoid and stilbene intake from fruits, vegetables, and nuts and associations with lipid profiles in Chinese adults. J. Acad. Nutr. Diet. 2013, 113, 786–794. [Google Scholar] [CrossRef] [PubMed]
- Kim, K.; Vance, T.M.; Chun, O.K. Greater flavonoid intake is associated with improved CVD risk factors in US adults. Br. J. Nutr. 2016, 115, 1481–1488. [Google Scholar] [CrossRef] [PubMed]
- Grosso, G.; Stepaniak, U.; Micek, A.; Stefler, D.; Bobak, M.; Pajak, A. Dietary polyphenols are inversely associated with metabolic syndrome in Polish adults of the HAPIEE study. Eur. J. Nutr. 2017, 56, 1409–1420. [Google Scholar] [CrossRef] [PubMed]
- Arai, Y.; Watanabe, S.; Kimira, M.; Shimoi, K.; Mochizuki, R.; Kinae, N. Dietary intakes of flavonols, flavones and isoflavones by Japanese women and the inverse correlation between quercetin intake and plasma LDL cholesterol concentration. J. Nutr. 2000, 130, 2243–2250. [Google Scholar] [CrossRef] [PubMed]
- Alsaif, M.A.; Khan, L.A.; Alhamdan, A.A.; Alorf, S.; Al-Othman, A.M.; Alawami, S. Effects of dietary flavonoids intake in saudi patients with coronary heart disease. J. Fam. Commun. Med. 2007, 14, 119–126. [Google Scholar]
- Oh, J.S.; Kim, H.; Vijayakumar, A.; Kwon, O.; Choi, Y.J.; Huh, K.B.; Chang, N. Association between dietary flavanones intake and lipid profiles according to the presence of metabolic syndrome in Korean women with type 2 diabetes mellitus. Nutr. Res. Pract. 2016, 10, 67–73. [Google Scholar] [CrossRef] [PubMed]
- Liu, C.; Sun, J.; Lu, Y.; Bo, Y. Effects of Anthocyanin on Serum Lipids in Dyslipidemia Patients: A Systematic Review and Meta-Analysis. PLoS ONE 2016, 11, e0162089. [Google Scholar] [CrossRef] [PubMed]
- Menezes, R.; Rodriguez-Mateos, A.; Kaltsatou, A.; Gonzalez-Sarrias, A.; Greyling, A.; Giannaki, C.; Andres-Lacueva, C.; Milenkovic, D.; Dumont, E.R.G.J.; Schar, M.; et al. Impact of Flavonols on Cardiometabolic Biomarkers: A Meta-Analysis of Randomized Controlled Human Trials to Explore the Role of Inter-Individual Variability. Nutrients 2017, 9, 117. [Google Scholar] [CrossRef] [PubMed]
- Hooper, L.; Kroon, P.A.; Rimm, E.B.; Cohn, J.S.; Harvey, I.; Le Cornu, K.A.; Ryder, J.J.; Hall, W.L.; Cassidy, A. Flavonoids, flavonoid-rich foods, and cardiovascular risk: A meta-analysis of randomized controlled trials. Am. J. Clin. Nutr. 2008, 88, 38–50. [Google Scholar] [CrossRef] [PubMed]
- Liu, K.; Xing, A.; Chen, K.; Wang, B.; Zhou, R.; Chen, S.; Xu, H.; Mi, M. Effect of fruit juice on cholesterol and blood pressure in adults: A meta-analysis of 19 randomized controlled trials. PLoS ONE 2013, 8, e61420. [Google Scholar] [CrossRef] [PubMed]
- Sahebkar, A.; Simental-Mendia, L.E.; Giorgini, P.; Ferri, C.; Grassi, D. Lipid profile changes after pomegranate consumption: A systematic review and meta-analysis of randomized controlled trials. Phytomedicine 2016, 23, 1103–1112. [Google Scholar] [CrossRef] [PubMed]
- Shin, J.Y.; Kim, J.Y.; Kang, H.T.; Han, K.H.; Shim, J.Y. Effect of fruits and vegetables on metabolic syndrome: A systematic review and meta-analysis of randomized controlled trials. Int. J. Food Sci. Nutr. 2015, 66, 416–425. [Google Scholar] [CrossRef] [PubMed]
- Huang, H.; Chen, G.; Liao, D.; Zhu, Y.; Xue, X. Effects of Berries Consumption on Cardiovascular Risk Factors: A Meta-analysis with Trial Sequential Analysis of Randomized Controlled Trials. Sci. Rep. 2016, 6, 23625. [Google Scholar] [CrossRef] [PubMed]
- Link, J.C.; Reue, K. Genetic Basis for Sex Differences in Obesity and Lipid Metabolism. Annu. Rev. Nutr. 2017, 37, 225–245. [Google Scholar] [CrossRef] [PubMed]
- Wang, X.; Magkos, F.; Mittendorfer, B. Sex differences in lipid and lipoprotein metabolism: It’s not just about sex hormones. J. Clin. Endocrinol. Metab. 2011, 96, 885–893. [Google Scholar] [CrossRef] [PubMed]
- Tamargo, J.; Rosano, G.; Walther, T.; Duarte, J.; Niessner, A.; Kaski, J.C.; Ceconi, C.; Drexel, H.; Kjeldsen, K.; Savarese, G.; et al. Gender differences in the effects of cardiovascular drugs. Eur. Heart J. Cardiovasc. Pharmacother. 2017, 3, 163–182. [Google Scholar] [CrossRef] [PubMed]
- Qin, Y.; Xia, M.; Ma, J.; Hao, Y.; Liu, J.; Mou, H.; Cao, L.; Ling, W. Anthocyanin supplementation improves serum LDL- and HDL-cholesterol concentrations associated with the inhibition of cholesteryl ester transfer protein in dyslipidemic subjects. Am. J. Clin. Nutr. 2009, 90, 485–492. [Google Scholar] [CrossRef] [PubMed]

| Dietary Sample (n = 257) | Urinary Sample (n = 233) | |||
|---|---|---|---|---|
| Males (n = 123) | Females (n = 134) | Males (n = 115) | Females (n = 118) | |
| Data from adolescence | ||||
| Age (years) | 13.0 (12.9, 13.0) | 12.0 (11.9, 12.0) | 12.8 (12.2, 13.3) | 11.8 (11.4, 12.4) |
| Anthropometry, dietary and urinary data | ||||
| BMI-SD score | −0.19 ± 0.77 | −0.24 ± 0.93 | −0.09 ± 0.84 | −0.19 ± 0.93 |
| BMI (kg/m2) | 18.8 (17.6, 20.2) | 17.7 (16.5, 20.1) | 19.3 (17.5, 20.7) | 18.0 (16.7, 20.5) |
| BSA (m2) | 1.5 (1.4, 1.6) | 1.4 (1.3, 1.5) | 1.5 (1.4, 1.6) | 1.4 (1.3, 1.5) |
| Overweight (%) 2 | 22.0 | 21.6 | 28.7 | 22.9 |
| Total energy (MJ/day) | 8.9 (8.1, 10.2) | 7.1 (6.5, 8.0) | ||
| Fat (%en) | 35.4 ± 3.9 | 36.0 ± 4.0 | ||
| SFA (%en) | 15.5 ± 2.1 | 15.9 ± 2.1 | ||
| Protein (%en) | 13.1 ± 1.3 | 12.9 ± 1.7 | ||
| Carbohydrate (%en) | 51.4 ± 4.0 | 51.0 ± 4.5 | ||
| Fibre (g/MJ) | 2.33 (2.05, 2.76) | 2.52 (2.18, 2.82) | ||
| FVJ (g/day) | 465 (355, 612) | 423 (314, 534) | ||
| FlavFVJ (mg/day) | 129 (86, 189) | 130 (88, 173) | ||
| FlavFVJ (mg/MJ) | 14.4 (10.1, 20.5) | 18.3 (12.8, 24.4) | ||
| FlavFV (mg/day) | 80 (51, 133) | 90 (59, 136) | ||
| FlavJ (mg/day) | 40 (23, 64) | 29 (19, 49) | ||
| Urinary hippuric acid (mmol/24 h) | 3.0 (2.6, 3.6) | 2.6 (2.3, 3.2) | ||
| Early life and socioeconomic factors | ||||
| Birth weight (g) | 3500 (3170, 3840) | 3428 (3100, 3750) | 3550 (3200, 3850) | 3405 (3100, 3730) |
| Gestational age (week) 3 | 40 (39, 41) | 40 (40, 41) | 40 (39, 41) | 40 (40, 41) |
| Maternal gestational weight gain (kg) 3 | 12 (9, 14) | 12 (10, 15) | 12 (9, 15) | 12 (10, 15) |
| Maternal age at birth (year) | 30.7 (28.1, 33.7) | 29.8 (27.7, 32.7) | 30.6 (28.1, 33.7) | 29.9 (27.7, 33.2) |
| Smokers in the household (%) | 24.4 | 35.8 | 27.0 | 34.7 |
| Paternal high education (%) 3,4 | 64.5 | 55.6 | 61.7 | 54.0 |
| Overweight parent (%) 3,5 | 73.2 | 67.2 | 76.3 | 70.3 |
| Data from early adulthood | ||||
| Age (years) | 20.9 (18.1, 23.2) | 21.7 (18.1, 24.9) | 19.6 (18.1, 23.0) | 21.3 (18.1, 24.5) |
| Anthropometry, dietary and lifestyle data | ||||
| BMI (kg/m2) | 22.8 (21.1, 25.6) | 21.9 (20.2, 24.1) | 23.1 (21.1, 26.2) | 21.9 (20.3, 24.3) |
| Waist circumference (cm) | 79.2 (75.6, 87.3) | 72.0 (67.8, 76.8) | 79.7 (75.7, 87.6) | 72.1 (68.0, 77.0) |
| Total energy (MJ/day) 3 | 10.6 (9.3, 12.5) | 7.9 (6.6, 8.9) | ||
| FVJ (g/day) 3 | 423 (247, 712) | 472 (304, 627) | ||
| FlavFVJ (mg/day) 3 | 99 (39, 174) | 114 (71, 175) | ||
| Alcohol (g/day) 3 | 1.2 (0.1, 12.3) | 0.2 (0.1, 2.6) | ||
| Current smoker (%) 3 | 26.2 | 24.2 | 29.8 | 21.7 |
| Serum lipid levels | ||||
| TG (mg/dL) | 82 (68, 123) | 97 (73, 120) | 83 (68, 124) | 94 (73, 120) |
| TC (mg/dL) | 157 (137, 188) | 178 (155, 203) | 157 (139, 188) | 179 (157, 204) |
| LDL-C (mg/dL) | 91 (73, 111) | 95 (77, 112) | 90 (73, 109) | 94 (77, 113) |
| HDL-C (mg/dL) | 50 (43, 59) | 65 (54, 77) | 50 (42, 59) | 66 (54, 77) |
| Tertiles of FlavFVJ Intake during Adolescence (n = 123) | Tertiles of uHA Excretion during Adolescence (n = 115) | |||||||
|---|---|---|---|---|---|---|---|---|
| Outcomes | T1 | T2 | T3 | Ptrend | T1 | T2 | T3 | Ptrend |
| FlavFVJ (mg/day)2 | 68 (55, 86) | 128 (115, 148) | 206 (187, 235) | |||||
| uHA (mmol/24 h)2 | 2.3 (2.0, 2.6) | 3.0 (2.7, 3.3) | 4.0 (3.4, 4.7) | |||||
| TG (mg/dL) | ||||||||
| Model A | 87 (76, 99) | 89 (78, 102) | 91 (80, 105) | 0.9 | 92 (80,106) | 91 (79, 105) | 87 (76, 101) | 0.7 |
| Model B | 89 (78, 102) | 90 (78, 103) | 89 (78, 102) | 0.8 | 94 (82, 109) | 90 (79, 104) | 86 (75, 99) | 0.7 |
| Conditional model | 88 (78, 101) | 88 (77, 100) | 91 (80, 105) | >0.9 | 93 (81, 108) | 90 (79, 103) | 87 (76, 100) | 0.7 |
| TC (mg/dL) | ||||||||
| Model A | 153 (143, 163) | 166 (156, 176) | 167 (157, 178) | 0.099 | 163 (153, 174) | 162 (152, 172) | 165 (154, 175) | 0.5 |
| Model B | 155 (145, 165) | 165 (154, 175) | 167 (157, 177) | 0.1 | 164 (154, 175) | 162 (151, 172) | 164 (154, 175) | 0.5 |
| Conditional model | 155 (145, 165) | 163 (153, 174) | 168 (158, 178) | 0.1 | 164 (154, 174) | 161 (151, 171) | 165 (155, 175) | 0.4 |
| HDL-C (mg/dL) | ||||||||
| Model A | 48 (45, 52) | 52 (48, 55) | 51 (48, 55) | 0.053 | 51 (48, 55) | 49 (45, 52) | 53 (49, 56) | 0.4 |
| Model B | 48 (45, 51) | 52 (48, 55) | 52 (48, 55) | 0.038 | 52 (48, 55) | 49 (45, 53) | 52 (48, 56) | 0.6 |
| Conditional model | 48 (45, 51) | 52 (49, 56) | 51 (48, 55) | 0.053 | 52 (48, 55) | 49 (46, 53) | 52 (48, 56) | 0.6 |
| LDL-C (mg/dL) | ||||||||
| Model A | 85 (77, 93) | 92 (84, 100) | 94 (86, 102) | 0.3 | 90 (82, 98) | 92 (84, 100) | 89 (81, 97) | 0.6 |
| Model B | 87 (80, 95) | 89 (82, 97) | 93 (86, 101) | 0.4 | 90 (82, 99) | 91 (83, 100) | 89 (81, 97) | 0.5 |
| Conditional model | 87 (80, 95) | 88 (81, 96) | 95 (87, 103) | 0.3 | 90 (82, 98) | 91 (83, 99) | 90 (82, 98) | 0.4 |
| Tertiles of FlavFVJ Intake during Adolescence (n = 134) | Tertiles of uHA Excretion during Adolescence (n = 118) | |||||||
|---|---|---|---|---|---|---|---|---|
| Outcomes | T1 | T2 | T3 | Ptrend | T1 | T2 | T3 | Ptrend |
| FlavFVJ (mg/day)2 | 74 (60, 87) | 131 (111, 144) | 199 (173, 228) | |||||
| uHA (mmol/24 h)2 | 2.2 (1.9, 2.5) | 2.6 (2.4, 2.8) | 3.4 (2.8, 4.1) | |||||
| TG (mg/dL) | ||||||||
| Model A | 95 (86, 106) | 91 (82, 101) | 94 (84, 104) | 0.8 | 93 (83, 104) | 92 (82, 103) | 91 (81, 102) | 0.9 |
| Model B | 93 (84, 104) | 91 (82, 101) | 96 (86, 107) | 0.7 | 93 (84, 105) | 92 (82, 103) | 91 (81, 101) | >0.9 |
| Conditional model | 93 (84, 104) | 90 (82, 101) | 96 (86, 107) | 0.8 | 93 (83, 104) | 91 (82, 102) | 91 (82, 103) | 0.9 |
| TC (mg/dL) | ||||||||
| Model A | 189 (179, 199) | 175 (165, 186) | 174 (164, 184) | 0.071 | 185 (174, 196) | 180 (169, 192) | 178 (167, 189) | 0.2 |
| Model B | 188 (178, 199) | 176 (166, 186) | 174 (163, 184) | 0.1 | 185 (173, 197) | 180 (169, 192) | 178 (167, 190) | 0.2 |
| Conditional model | 188 (178, 199) | 176 (166, 186) | 174 (163, 184) | 0.1 | 184 (173, 196) | 180 (168, 191) | 179 (168, 191) | 0.3 |
| HDL-C (mg/dL) | ||||||||
| Model A | 68 (63, 73) | 63 (59, 68) | 63 (59, 68) | 0.2 | 67 (62, 73) | 63 (58, 69) | 65 (60, 70) | 0.5 |
| Model B | 69 (64, 74) | 63 (58, 68) | 62 (58, 67) | 0.1 | 68 (62, 73) | 63 (58, 69) | 65 (59, 70) | 0.4 |
| Conditional model | 69 (64, 74) | 63 (59, 68) | 62 (58, 67) | 0.1 | 68 (63, 73) | 64 (59, 69) | 64 (59, 69) | 0.3 |
| LDL-C (mg/dL) | ||||||||
| Model A | 101 (92, 109) | 89 (81, 98) | 93 (85, 102) | 0.2 | 96 (87, 106) | 95 (86, 105) | 95 (86, 105) | 0.6 |
| Model B | 100 (91, 109) | 90 (82, 99) | 93 (85, 102) | 0.3 | 96 (87, 106) | 95 (86, 105) | 96 (87, 106) | 0.7 |
| Conditional model | 100 (91, 109) | 90 (82, 99) | 93 (85, 102) | 0.3 | 95 (86, 105) | 94 (86, 104) | 97 (88, 107) | 0.8 |
© 2018 by the authors. Licensee MDPI, Basel, Switzerland. This article is an open access article distributed under the terms and conditions of the Creative Commons Attribution (CC BY) license (http://creativecommons.org/licenses/by/4.0/).
Share and Cite
Penczynski, K.J.; Remer, T.; Herder, C.; Kalhoff, H.; Rienks, J.; Markgraf, D.F.; Roden, M.; Buyken, A.E. Habitual Flavonoid Intake from Fruit and Vegetables during Adolescence and Serum Lipid Levels in Early Adulthood: A Prospective Analysis. Nutrients 2018, 10, 488. https://doi.org/10.3390/nu10040488
Penczynski KJ, Remer T, Herder C, Kalhoff H, Rienks J, Markgraf DF, Roden M, Buyken AE. Habitual Flavonoid Intake from Fruit and Vegetables during Adolescence and Serum Lipid Levels in Early Adulthood: A Prospective Analysis. Nutrients. 2018; 10(4):488. https://doi.org/10.3390/nu10040488
Chicago/Turabian StylePenczynski, Katharina J., Thomas Remer, Christian Herder, Hermann Kalhoff, Johanna Rienks, Daniel F. Markgraf, Michael Roden, and Anette E. Buyken. 2018. "Habitual Flavonoid Intake from Fruit and Vegetables during Adolescence and Serum Lipid Levels in Early Adulthood: A Prospective Analysis" Nutrients 10, no. 4: 488. https://doi.org/10.3390/nu10040488
APA StylePenczynski, K. J., Remer, T., Herder, C., Kalhoff, H., Rienks, J., Markgraf, D. F., Roden, M., & Buyken, A. E. (2018). Habitual Flavonoid Intake from Fruit and Vegetables during Adolescence and Serum Lipid Levels in Early Adulthood: A Prospective Analysis. Nutrients, 10(4), 488. https://doi.org/10.3390/nu10040488