

Comprehensive Nutritional and Dietary Intervention for Autism Spectrum Disorder—A Randomized, Controlled 12-Month Trial

 ,
,  and
and
Abstract
1. Introduction
1.1. Vitamins/Minerals
1.2. Essential Fatty Acids
1.3. Sulfate
1.4. Carnitine and Mitochondrial Disorders
1.5. Gastrointestinal Problems, Digestive Enzymes, Limited Diets, and Food Sensitivities
1.6. Study Goal
1.7. Hypothesis
2. Methods
2.1. Study Design and Justification
2.2. Participant Enrollment
2.3. Enrollment Criteria—ASD Group
- Diagnosis of autism spectrum disorder (autism, Pervasive Developmental Disorder-Not Otherwise Specified (PDD-NOS), or Asperger’s) by a psychiatrist, psychologist, or developmental pediatrician.
- Verification of diagnosis by ASU staff based on the ADOS and/or CARS-2.
- Age of 2.5–60 years.
- No major changes in behavioral or medical treatments in the previous two months, and no intention to make such changes during the 12 months of the study.
- No usage of nutritional supplements (vitamins, minerals essential fatty acids, carnitine) or special diets in the previous two months.
2.4. Enrollment Criteria—Neurotypical Group
- No diagnosed mental disorders, including autism spectrum disorders, Attention Deficit Hyperactivity Disorder (ADHD), depression, anxiety, etc.
- No first-degree relatives of individuals with ASD (no siblings or parents).
- Age of 2.5–60 years.
- No usage of nutritional supplements (vitamins, minerals, essential fatty acids, carnitine) or special diets in the previous two months.
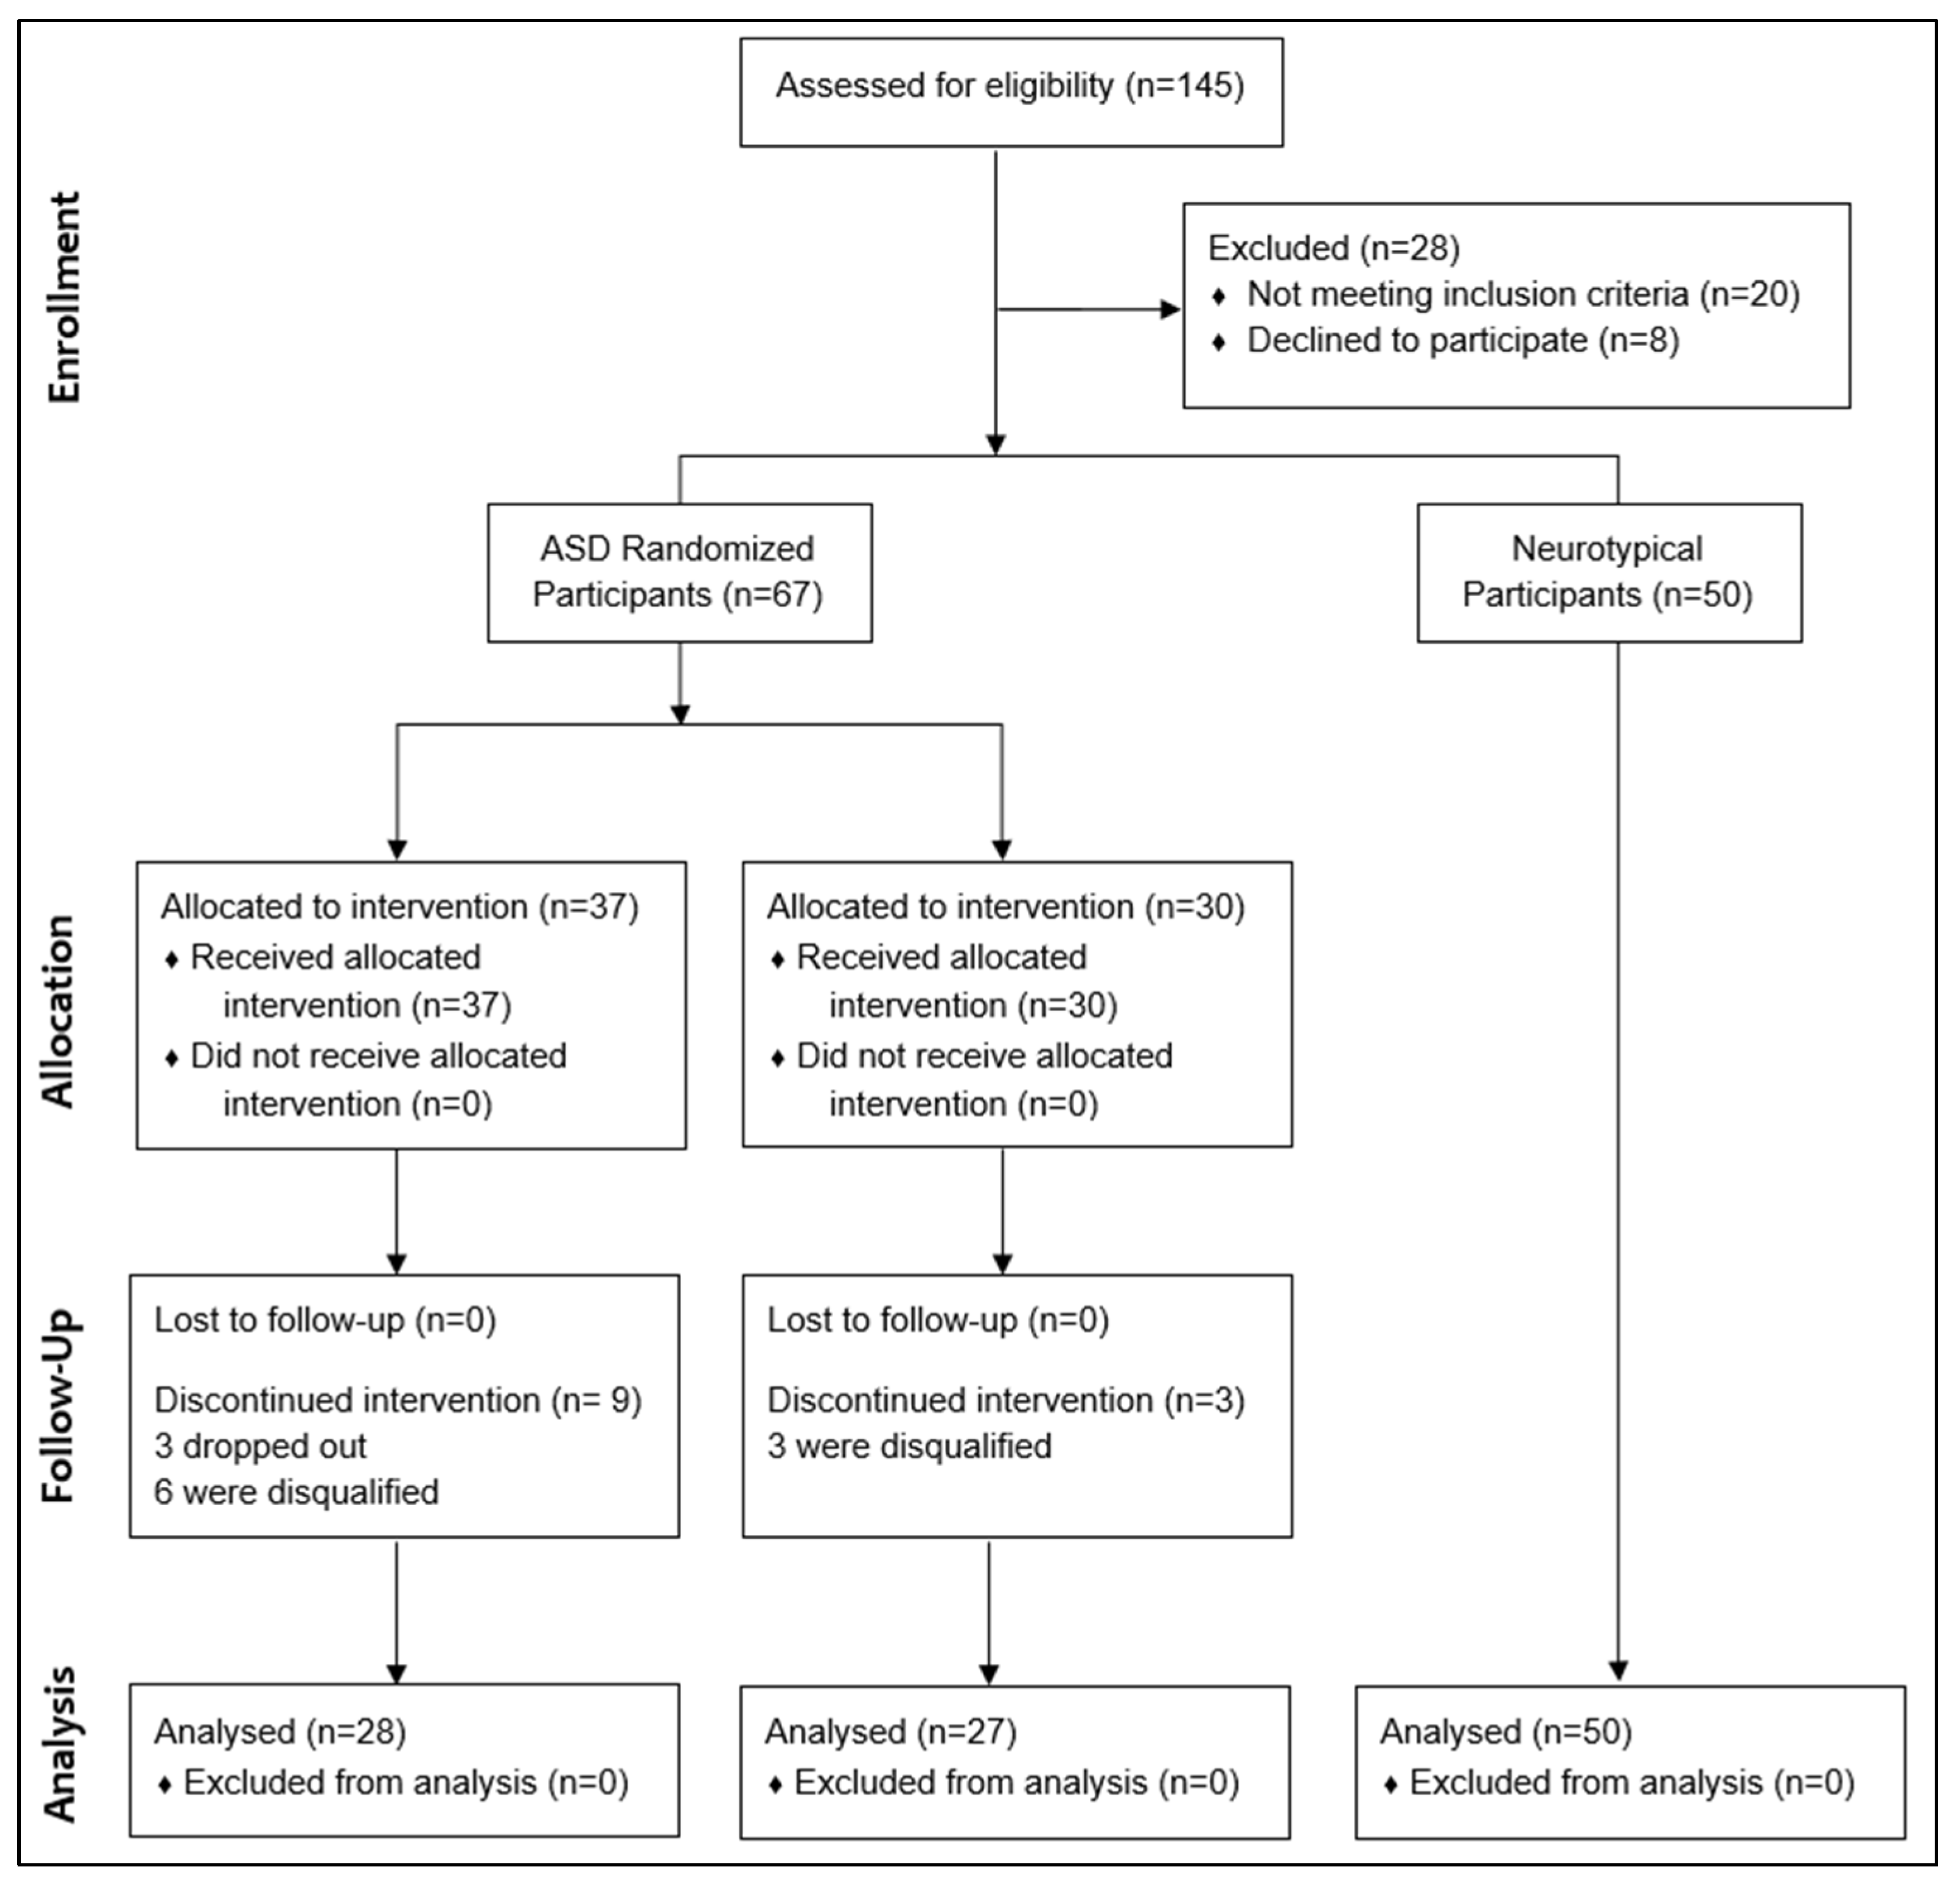
2.5. Participants
2.6. Randomization
2.7. Protocols
2.7.1. Protocol for ASD Treatment Group
2.7.2. Protocol for ASD Non-Treatment Group
2.7.3. Protocol for Neurotypical Group
2.8. Biomarker Measurements
- High sensitivity C-Reactive Protein was measured using an immunoturbidimetric method using Kamiya Reagents and analyzed on a Beckman Coulter AU680 Chemistry Analyzer (Brea, CA, USA)
- Homocysteine was measured by LC/MS after reduction using dithiothreitol and derivatization.
2.9. Handgrip Strength
2.10. Autism Severity and Overall Functioning Assessments
2.11. Treatments
2.11.1. Vitamin/Mineral Supplement
2.11.2. Essential Fatty Acids
- 30–50 pounds (14–23 kg): 2 capsules/day
- 51–100 pounds (23–45 kg): 3 capsules/day
- 100+ pounds (45+ kg): 4 capsules/day
2.11.3. Epsom Salt Baths
2.11.4. Carnitine
2.11.5. Digestive Enzymes
2.11.6. Healthy, Gluten-Free, Casein-Free, Soy-Free Diet
- Adequate intake of a variety of vegetables (including leafy greens) and fruit (preferably whole fruit).
- Adequate protein quality and intake.
- Adequate, but not excessive, caloric intake.
- Minimal consumption of “junk” foods and replacement with healthy snacks.
- Healthy, gluten-free, casein-free, and soy-free (HGCSF).
- Avoidance of artificial flavors, colors, and preservatives.
2.12. Statistical Analysis
2.13. Participant Withdrawals, Removals, and Adverse Effects
2.14. Treatment Group
- one participant dropped after four months because of lack of benefit
- one family dropped after seven months due to insufficient benefit and disinterest in taking supplements
- one participant dropped after four months for unknown reasons
- four participants were disqualified by researchers due to poor compliance with study protocol (parents were inconsistent in giving supplements due to parental, not child, issues)
- two participants (brothers) were disqualified because they discontinued all supplements and only completed the special diet
2.15. Non-Treatment Group
3. Results
3.1. Adverse Effects
3.2. Compliance
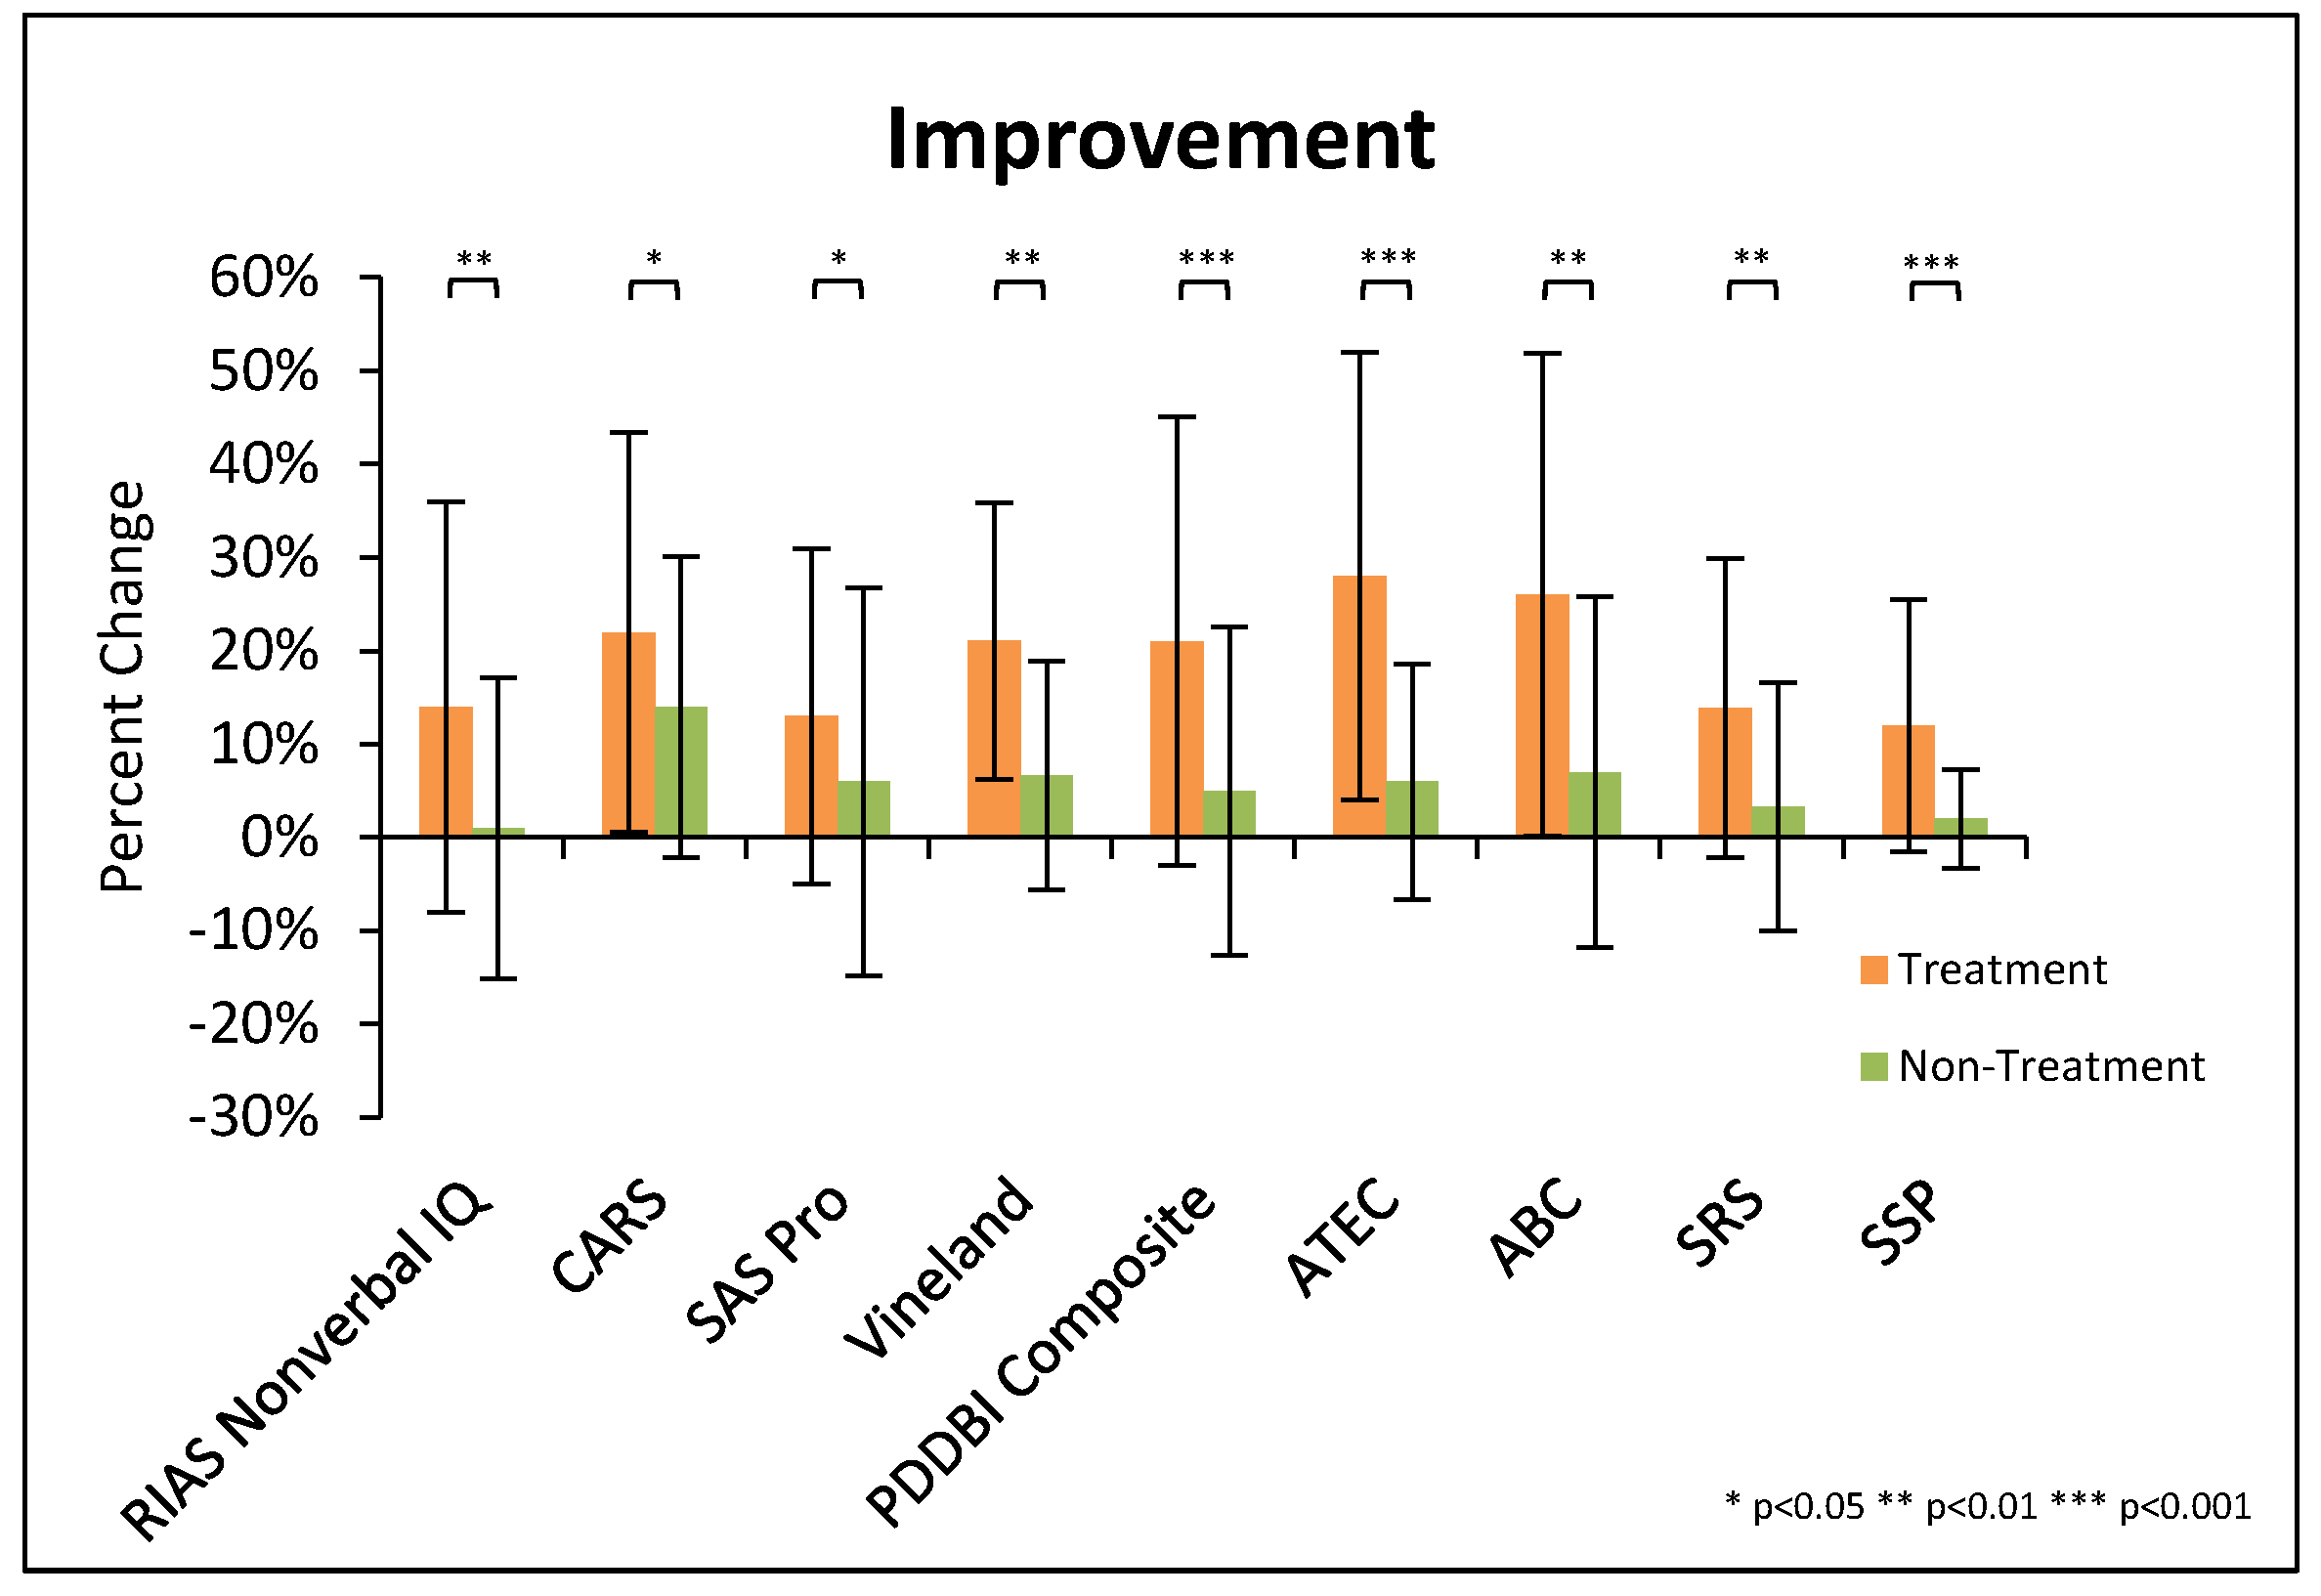
3.3. Highlights
3.4. Blinded Evaluations (RIAS, ADOS)
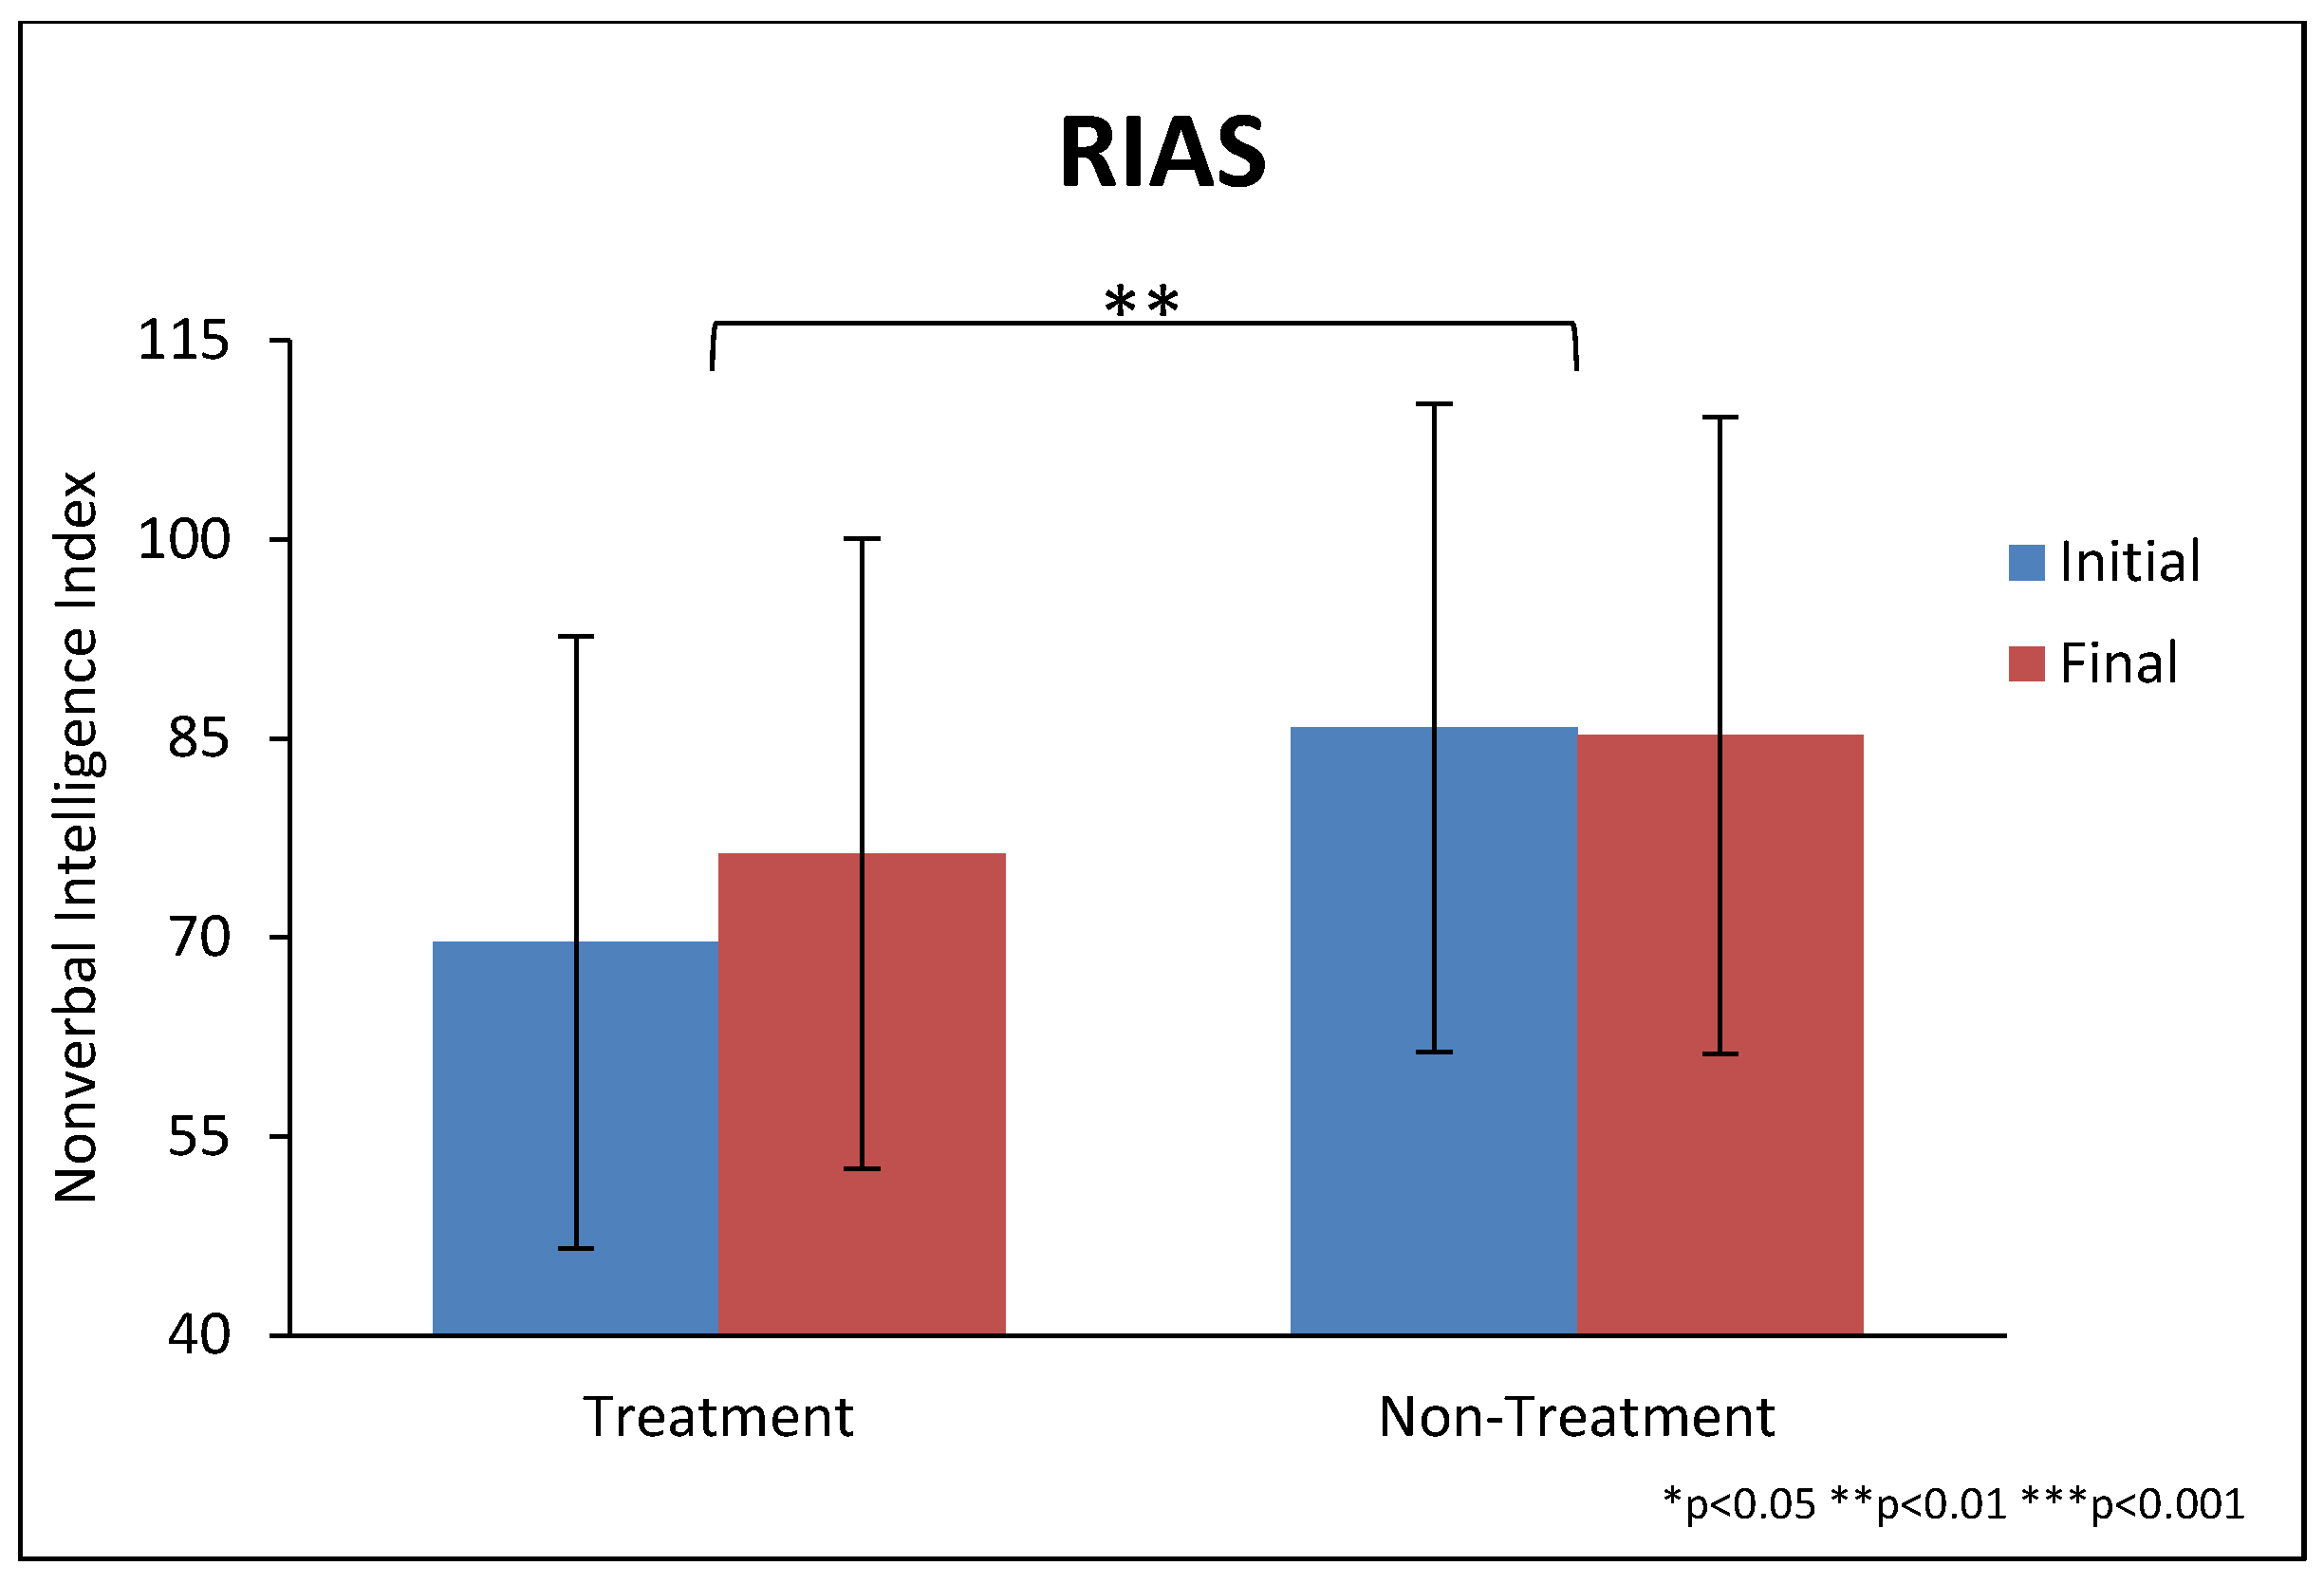
3.4.1. Reynolds Intellectual Assessment Scales (RIAS)
3.4.2. Autism Diagnostic Observation Schedule (ADOS)
3.5. Semi-Blinded Evaluations (CARS-2, SAS-Pro, Vineland)
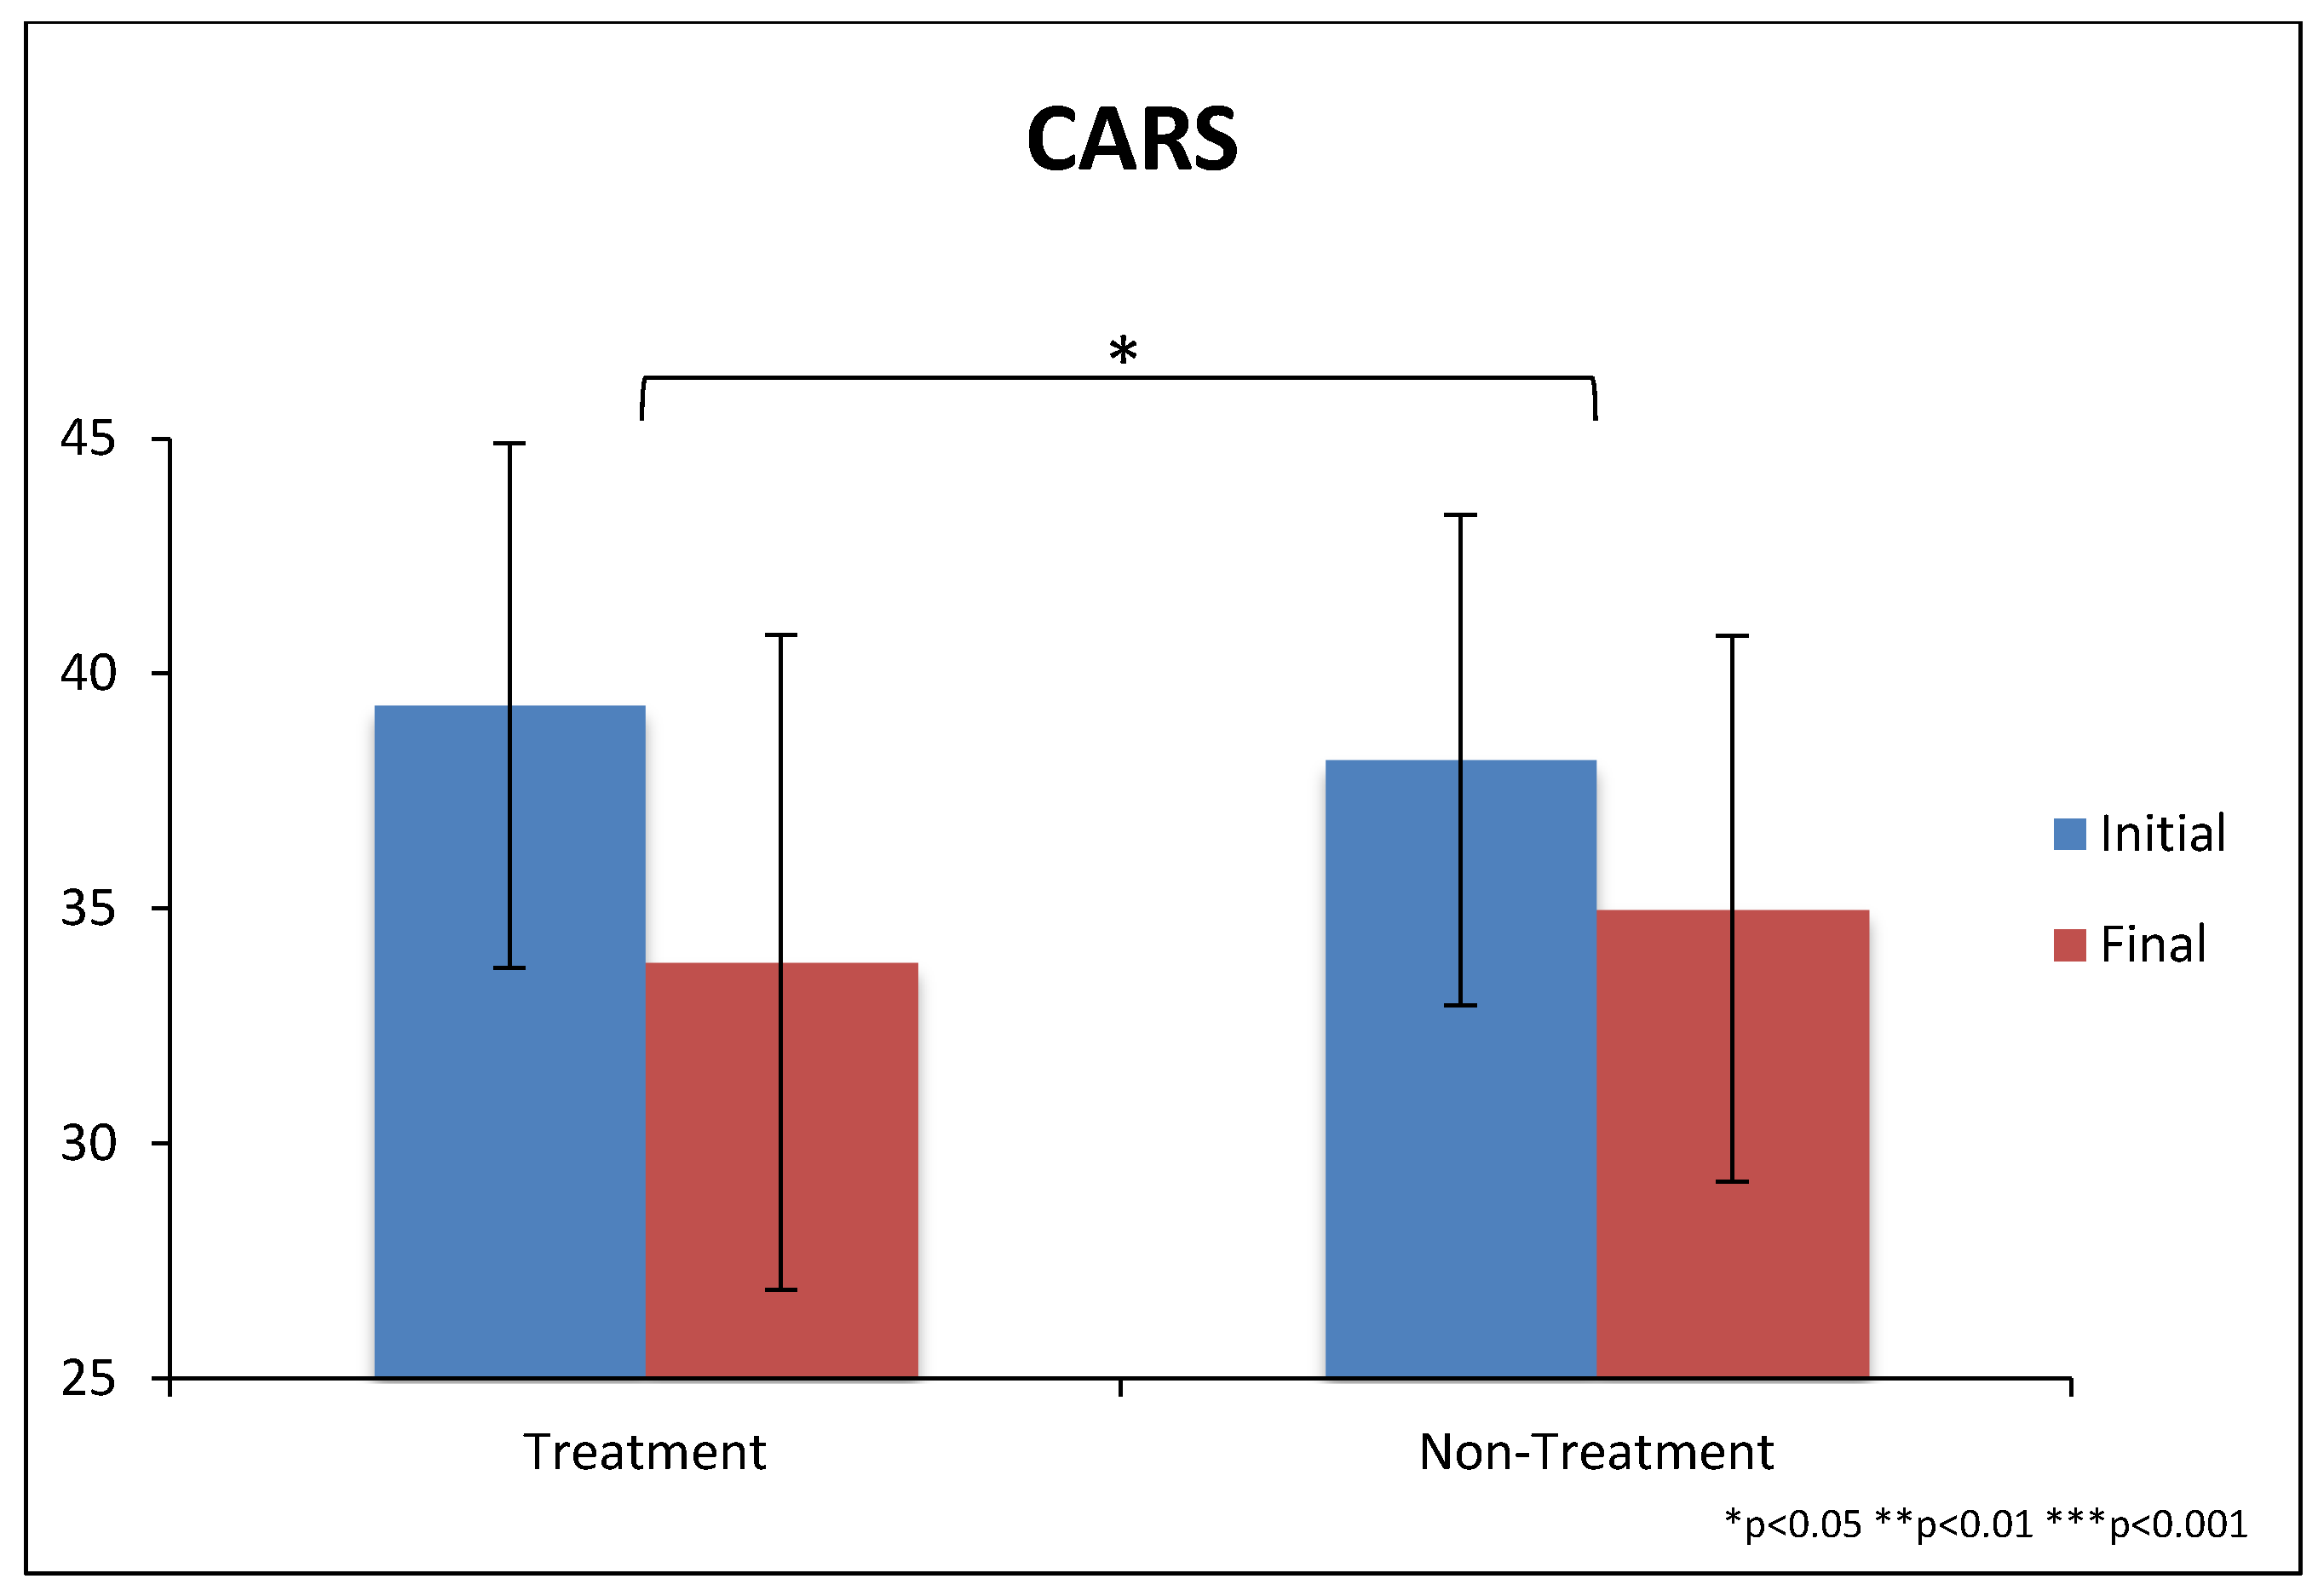
3.5.1. Childhood Autism Rating Scale (CARS-2)
3.5.2. Severity of Autism Scale—Professional Evaluation (SAS-Pro)
3.5.3. Vineland Adaptive Behavior Scale II (VABS-II)
3.6. Unblinded Parent/Self Evaluations
3.6.1. Pervasive Developmental Disorders Behavior Inventory (PDD-BI)
3.6.2. Autism Treatment Evaluation Checklist (ATEC)
3.6.3. Aberrant Behavior Checklist (ABC)
3.6.4. Social Responsiveness Scale (SRS)
3.6.5. Short Sensory Profile (SSP)
3.6.6. Parent Global Impressions—Revised-2 (PGI-2)
3.6.7. 6-item Gastrointestinal Severity Index (6-GSI)
3.7. Handgrip Strength
3.8. Treatment Effectiveness
3.9. Treatment Continuation
3.10. Medical Tests
3.10.1. Complete Blood Count (CBC)
3.10.2. Blood Chemistry Panel (ChemPanel)
3.10.3. Body Mass Index (BMI)
3.10.4. Fatty Acids
3.10.5. C-Reactive Protein (CRP)
3.10.6. Vitamins
3.10.7. RBC Elements
3.10.8. Homocysteine Pathway
3.10.9. Carnitine
3.11. Case Studies
3.11.1. Case Study A
3.11.2. Case Study B
3.11.3. Case Study C
4. Discussion
4.1. Blinded Evaluations (RIAS)
4.2. Semi-Blinded Evaluations (VABS-II, CARS-2, SAS-Pro)
4.3. Unblinded Parent/Self Evaluations (PDD-BI, ATEC, ABC, SRS, SSP, PGI-2, 6-GSI)
4.4. GI Symptoms
4.5. Handgrip Strength
4.6. Treatment Effectiveness and Continuation
4.7. Medical Tests
4.7.1. PUFAs
4.7.2. Vitamins
4.7.3. Essential Elements (“Minerals”)
4.7.4. Homocysteine
4.7.5. Carnitine
4.7.6. Digestive Enzymes
4.8. Case Studies
4.9. Age Effects
4.10. Developmental History
4.11. Age and Gender Sub-Analysis
4.12. Limitations and Strengths
4.13. Relevance to Clinical Practice
4.14. Suggestions for Future Research
5. Conclusions
Acknowledgments
Author Contributions
Conflicts of Interest
Abbreviations
| 6-GSI | 6-item Gastrointestinal Severity Index |
| AA | Arachidonic Acid |
| ABC | Aberrant Behavior Checklist |
| ADHD | Attention Deficit Hyperactivity Disorder |
| ADOS | Autism Diagnostic Observation Schedule |
| AGG | Aggressiveness |
| AROUSE | Arousal Regulation Problems |
| ASD | Autism Spectrum Disorder |
| ASU | Arizona State University |
| ATEC | Autism Treatment Evaluation Checklist |
| ATP | Adenosine Triphosphate |
| BMI | Body Mass Index |
| BUN | Blood Urea Nitrogen |
| CARS-2 | Childhood Autism Rating Scale 2 |
| CBC | Complete Blood Count |
| CGI | Clinical Global Impressions |
| CLIA | Clinical Laboratory Improvements Amendments |
| CRP | C-Reactive Protein |
| DGLA | Dihomo-Gamma-Linolenic Acid |
| DHA | Docosahexaenoic Acid |
| EFA | Essential Fatty Acids |
| EPA | Eicosapentaenoic Acid |
| GABA | Gamma-Aminobutyric Acid |
| GFCF | Gluten-Free, Casein-Free |
| GLA | Gamma-Linolenic Acid |
| HGCSF | Healthy Gluten-Free Casein-Free Soy Free |
| IRB | Institutional Review Board |
| LC-MS/MS | Liquid Chromatography Tandem Mass Spectrometry |
| LMRL | Learning, Memory, and Receptive Language |
| MCV | Mean Corpuscular Volume |
| n.s. | Not Significant |
| NADH | Nicotinamide Adenine Dinucleotide |
| NADPH | Nicotinamide Adenine Dinucleotide Phosphate |
| PDD-BI | Pervasive Developmental Disorders Behavior Inventory |
| PDD-NOS | Pervasive Developmental Disorder-Not Otherwise Specified |
| PGI-2 | Parent Global Impressions-2 |
| PUFA | Polyunsaturdated Fatty Acid |
| RBC | Red Blood Count |
| RIAS | Reynolds Intellectual Assessment Scales |
| S.D. | Standard Deviation |
| SAM | S-Adenosylmethionine |
| SAS-Pro | Severity of Autism Scale |
| SEMPP | Semantic/Pragmatic Problems |
| SOCPP | Social Pragmatic Problems |
| SRS | Social Responsiveness Scale |
| SSP | Short Sensory Profile |
| VABS-II | Vineland Adaptive Behavior Scale II |
References
- Li, Y.J.; Ou, J.J.; Li, Y.M.; Xiang, D.X. Dietary Supplement for Core Symptoms of Autism Spectrum Disorder: Where Are We Now and Where Should We Go? Front. Psychiatry 2017, 8, 155. [Google Scholar] [CrossRef] [Scilit] [PubMed]
- Cekic, H.; Sanlier, N. Current nutritional approaches in managing autism spectrum disorder: A review. Nutr. Neurosci. 2017, 1–11. [Google Scholar] [CrossRef] [Scilit] [PubMed]
- Gogou, M.; Kolios, G. The effect of dietary supplements on clinical aspects of autism spectrum disorder: A systematic review of the literature. Brain Dev. 2017, 39, 656–664. [Google Scholar] [CrossRef] [Scilit] [PubMed]
- James, S.J.; Cutler, P.; Melnyk, S.; Jernigan, S.; Janak, L.; Gaylor, D.W.; Neubrander, J.A. Metabolic biomarkers of increased oxidative stress and impaired methylation capacity in children with autism. Am. J. Clin. Nutr. 2004, 80, 1611–1617. [Google Scholar] [CrossRef] [Scilit] [PubMed]
- James, S.J.; Melnyk, S.; Jernigan, S.; Cleves, M.A.; Halsted, C.H.; Wong, D.H.; Cutler, P.; Bock, K.; Boris, M.; Bradstreet, J.J.; et al. Metabolic endophyenotype and related genotypes are associated with oxidative stress in children with autism. Am. J. Med. Genet. Neuropsychiatr. Genet. 2006, 141, 947–956. [Google Scholar] [CrossRef] [Scilit] [PubMed]
- James, S.J.; Melnyk, S.; Fuchs, G.; Reid, T.; Jernigan, S.; Pavliv, O.; Hubanks, A.; Gaylor, D.W. Efficacy of methylcobalamin and folinic acid treatment on glutathione redox status in children with autism. Am. J. Clin. Nutr. 2009, 89, 425–430. [Google Scholar] [CrossRef] [Scilit] [PubMed]
- Chauhan, A.; Chauhan, V.; Brown, W.T.; Cohen, I.L. Oxidative stress in autism: Increased lipid peroxidation and reduced serum levels of ceruloplasmin and transferrin—The antioxidant proteins. Life Sci. 2004, 75, 2539–2549. [Google Scholar] [CrossRef] [Scilit] [PubMed]
- Chauhan, A.; Chauhan, V. Oxidative stress in autism. Pathophysiology 2006, 13, 171–181. [Google Scholar] [CrossRef] [Scilit] [PubMed]
- Al-Mosalem, O.A.; El-Ansary, A.; Al-Ayadhi, L. Metabolic biomarkers related to energy metabolism in Saudi autistic children. Clin. Biochem. 2009, 42, 949–957. [Google Scholar] [CrossRef] [Scilit] [PubMed]
- Al-Gadani, Y.; El-Ansary, A.; Attas, O.; Al-Ayadhi, L. Metabolic biomarkers related to oxidative stress and antioxidant status in Saudi autistic children. Clin. Biochem. 2009, 42, 1032–1040. [Google Scholar] [CrossRef] [Scilit] [PubMed]
- Frustaci, A.; Neri, M.; Cesario, A.; Adams, J.B.; Domenici, E.; Bernardina, B.D.; Bonassi, S. Oxidative stress biomarkers in autism: Systematic review and meta-analyses. Free Radic. Biol. Med. 2012, 52, 2128–2141. [Google Scholar] [CrossRef] [Scilit] [PubMed]
- El-Ansary, A.; Bjørklund, G.; Chirumbolo, S.; Alnakhli, O.M. Predictive value of selected biomarkers related to metabolism and oxidative stress in children with autism spectrum disorder. Metab. Brain Dis. 2017, 32, 1209–1221. [Google Scholar] [CrossRef] [Scilit] [PubMed]
- Nardone, S.; Sams, D.S.; Zito, A.; Reuveni, E.; Elliot, E. Dysregulation of Cortical Neuron DNA Methylation Profile in Autism Spectrum Disorder. Cereb. Cortex 2017, 27, 5739–5754. [Google Scholar] [CrossRef] [Scilit] [PubMed]
- Adams, J.B.; Audhya, T.; McDonough-Means, S.; Rubin, R.A.; Quig, D.; Geis, E.; Gehn, E.; Loresto, M.; Mitchell, J.; Atwood, S.; et al. Nutritional and Metabolic Status of Children with Autism vs. Neurotypical Children, and the Association with Autism Severity. Nutr. Metab. 2011, 8, 34. [Google Scholar] [CrossRef] [Scilit] [PubMed]
- Adams, J.B.; Audhya, T.; McDonough-Means, S.; Rubin, R.A.; Quig, D.; Geis, E.; Gehn, E.; Loresto, M.; Mitchell, J.; Atwood, S.; et al. Effect of a Vitamin/Mineral Supplement on Children and adults with Autism. BMC Pediatr. 2011, 11, 111. [Google Scholar] [CrossRef] [Scilit] [PubMed]
- Van der Kemp, W.J.; Klomp, D.W.; Kahn, R.S.; Luijten, P.R.; Hulshoff Pol, H.E. A meta-analysis of the polyunsaturated fatty acid composition of erythrocyte membranes in schizophrenia. Schizophr. Res. 2012, 141, 153–161. [Google Scholar] [CrossRef] [Scilit] [PubMed]
- Hawkey, E.; Nigg, J.T. Omega-3 fatty acid and ADHD: Blood level analysis and meta-analytic extension of supplementation trials. Clin. Psychol. Rev. 2014, 34, 496–505. [Google Scholar] [CrossRef] [Scilit] [PubMed]
- Lin, P.Y.; Huang, S.Y.; Su, K.P. A meta-analytic review of polyunsaturated fatty acid compositions in patients with depression. Biol. Psychiatry 2010, 68, 140–147. [Google Scholar] [CrossRef] [Scilit] [PubMed]
- McNamara, R.K.; Welge, J.A. Meta-analysis of erythrocyte polyunsaturated fatty acid biostatus in bipolar disorder. Bipolar Disord. 2016, 18, 300–306. [Google Scholar] [CrossRef] [Scilit] [PubMed]
- Lin, P.Y.; Chiu, C.C.; Huang, S.Y.; Su, K.P. A meta-analytic review of polyunsaturated fatty acid compositions in dementia. J. Clin. Psychiatry 2012, 73, 1245–1254. [Google Scholar] [CrossRef] [Scilit] [PubMed]
- Chen, A.T.; Chibnall, J.T.; Nasrallah, H.A. A meta-analysis of placebo-controlled trials of omega-3 fatty acid augmentation in schizophrenia: Possible stage-specific effects. Ann. Clin. Psychiatry 2015, 27, 289–296. [Google Scholar] [PubMed]
- Mocking, R.J.; Harmsen, I.; Assies, J.; Koeter, M.W.; Ruhé, H.G.; Schene, A.H. Meta-analysis and meta-regression of omega-3 polyunsaturated fatty acid supplementation for major depressive disorder. Transl Psychiatry 2016, 6, e756. [Google Scholar] [CrossRef] [Scilit] [PubMed]
- Sarris, J.; Mischoulon, D.; Schweitzer, I. Omega-3 for bipolar disorder: Meta-analyses of use in mania and bipolar depression. J. Clin. Psychiatry 2012, 73, 81–86. [Google Scholar] [CrossRef] [Scilit] [PubMed]
- Yanai, H. Effects of N-3 Polyunsaturated Fatty Acids on Dementia. J. Clin. Med. Res. 2017, 9, 1–9. [Google Scholar] [CrossRef] [Scilit] [PubMed]
- De Felice, C.; Signorini, C.; Durand, T.; Ciccoli, L.; Leoncini, S.; D’Esposito, M.; Filosa, S.; Oger, C.; Guy, A.; Bultel-Poncé, V.; et al. Partial rescue of Rett syndrome by ω-3 polyunsaturated fatty acids (PUFAs) oil. Genes Nutr. 2012, 7, 447–458. [Google Scholar] [CrossRef] [Scilit] [PubMed]
- Shoda, R.; Matsueda, K.; Yamato, S.; Umeda, N. Epidemiologic analysis of Crohn disease in Japan: increased dietary intake of n-6 polyunsaturated fatty acids and animal protein relates to the increased incidence of Crohn disease in Japan. Am. J. Clin. Nutr. 1996, 63, 741–745. [Google Scholar] [CrossRef] [Scilit] [PubMed]
- Belluzzi, A.; Brignola, C.; Campieri, M.; Pera, A.; Boschi, S.; Miglioli, M. Effect of an enteric-coated fish-oil preparation on relapses in Crohn’s disease. N. Engl. J. Med. 1996, 334, 1557–1560. [Google Scholar] [CrossRef] [Scilit] [PubMed]
- Buie, T.; Campbell, D.B.; Fuchs, G.J., 3rd; Furuta, G.T.; Levy, J.; Vandewater, J.; Whitaker, A.H.; Atkins, D.; Bauman, M.L.; Beaudet, A.L.; et al. Evaluation, diagnosis, and treatment of gastrointestinal disorders in individuals with ASDs: A consensus report. Pediatrics 2010, 125 (Suppl. 1), S1–S18. [Google Scholar] [CrossRef] [Scilit] [PubMed]
- Mazahery, H.; Stonehouse, W.; Delshad, M.; Kruger, M.C.; Conlon, C.A.; Beck, K.L.; von Hurst, P.R. Relationship between Long Chain n-3 Polyunsaturated Fatty Acids and Autism Spectrum Disorder: Systematic Review and Meta-Analysis of Case-Control and Randomised Controlled Trials. Nutrients 2017, 9, 155. [Google Scholar] [CrossRef] [Scilit] [PubMed]
- Amminger, G.P.; Berger, G.E.; Schäfer, M.R.; Klier, C.; Friedrich, M.H.; Feucht, M. Omega-3 Fatty Acids Supplementation in Children with Autism: A Double-blind Randomized, Placebo-controlled Pilot Study. Biol. Psychiatry 2007, 61, 551–553. [Google Scholar] [CrossRef] [Scilit] [PubMed]
- Bent, S.; Bertoglio, K.; Ashwood, P.; Bostrom, A.; Hendren, R.L. A pilot randomized controlled trial of omega-3 fatty acids for autism spectrum disorder. J. Autism Dev. Disord. 2011, 41, 545–554. [Google Scholar] [CrossRef] [Scilit] [PubMed]
- Bent, S.; Hendren, R.L.; Zandi, T.; Law, K.; Choi, J.E.; Widjaja, F.; Kalb, L.; Nestle, J.; Law, P. Internet-based, randomized, controlled trial of omega-3 fatty acids for hyperactivity in autism. J. Am. Acad. Child Adolesc. Psychiatry 2014, 53, 658–666. [Google Scholar] [CrossRef] [Scilit] [PubMed]
- Yui, K.; Koshiba, M.; Nakamura, S.; Kobayashi, Y. Effects of Large Doses of Arachidonic Acid Added to Docosahexaenoic Acid on Social Impairment in Individuals With Autism Spectrum Disorders: A Double-Blind, Placebo-Controlled, Randomized Trial. J. Clin. Psychopharmacol. 2012, 32, 200–206. [Google Scholar] [CrossRef] [Scilit] [PubMed]
- Katan, M.B.; Deslypere, J.P.; van Birgelen, A.P.; Penders, M.; Zegwaard, M. Kinetics of the incorporation of dietary fatty acids into serum cholesteryl esters, erythrocyte membranes, and adipose tissue: An 18-month controlled study. J. Lipid Res. 1997, 38, 2012–2022. [Google Scholar] [PubMed]
- Mankad, D.; Dupuis, A.; Smile, S.; Roberts, W.; Brian, J.; Lui, T.; Genore, L.; Zaghloul, D.; Iaboni, A.; Marcon, P.M.A.; et al. A randomized, placebo controlled trial of omega-3 fatty acids in the treatment of young children with autism. Mol. Autism 2015, 6, 18. [Google Scholar] [CrossRef] [Scilit] [PubMed]
- Voigt, R.G.; Mellon, M.W.; Katusic, S.K.; Weaver, A.L.; Matern, D.; Mellon, B.; Jensen, C.L.; Barbaresi, W.J. Dietary docosahexaenoic acid supplementation in children with autism. J. Pediatr. Gastroenterol. Nutr. 2014, 58, 715–722. [Google Scholar] [CrossRef] [Scilit] [PubMed]
- Chang, R. Chemistry, 9th ed.; McGraw-Hill: New York, NY, USA, 2007; p. 52. [Google Scholar]
- Waring, R.H.; Ngong, J.M.; Klovsra, L.; Green, S. Sharp, H. Biochemical Parameters in Autistic Children. Dev. Brain Dysfunct. 1997, 10, 40–43. [Google Scholar]
- Geier, D.A.; Kern, J.K.; Garver, C.R.; Adams, J.B.; Audhya, T.; Geier, M.R. A prospective study of transsulfuration biomarkers in autistic disorders. Neurochem. Res. 2009, 34, 386–393, Erratum in Neurochem. Res. 2009, 34, 394. [Google Scholar] [CrossRef] [Scilit] [PubMed]
- O’Reilly, B.A.; Warning, R.H. Enzyme and Sulphur Oxidation Deficiencies in Autistic Children with Known Food/Chemical Sensitivities. J. Orthomol. Med. 1993, 8, 198–200. [Google Scholar]
- Alberti, A.; Pirrone, P.; Elia, M.; Waring, R.H.; Romano, C. Sulphation deficit in “low-functioning” autistic children: A pilot study. Biol. Psychiatry 1999, 46, 420–424. [Google Scholar] [CrossRef] [Scilit]
- Horvath, K.; Perman, J.A. Autistic disorder and gastrointestinal disease. Curr. Opin. Pediatr. 2002, 14, 583–587. [Google Scholar] [CrossRef] [Scilit] [PubMed]
- Waring, R.H.; Klovrsa, L.V. Sulfur Metabolism in Autism. J. Nutr. Environ. Med. 2000, 10, 25–32. [Google Scholar] [CrossRef] [Scilit]
- Weissman, J.R.; Kelley, R.I.; Bauman, M.L.; Cohen, B.H.; Murray, K.F.; Mitchell, R.L.; Kern, R.L.; Natowicz, M.R. Mitochondrial disease in autism spectrum disorder patients: A cohort analysis. PLoS ONE 2008, 3, e3815. [Google Scholar] [CrossRef] [Scilit] [PubMed]
- Oliveira, G.; Ataíde, A.; Marques, C.; Miguel, T.S.; Coutinho, A.M.; Mota-Vieira, L.; Goncalves, E.; Lopes, N.M.; Rodrigues, V.; Carmona da Mota, H.; et al. Epidemiology of autism spectrum disorder in Portugal: Prevalence, clinical characterization, and medical conditions. Dev. Med. Child Neurol. 2007, 49, 726–733. [Google Scholar] [CrossRef] [Scilit] [PubMed]
- Oliveira, G.; Diogo, L.; Grazina, M.; Garcia, P.; Ataíde, A.; Marques, C.; Miguel, T.; Borges, L.; Vicente, A.M.; Oliveira, C.R. Mitochondrial dysfunction in autism spectrum disorders: A population-based study. Dev. Med. Child Neurol. 2005, 47, 185–189. [Google Scholar] [CrossRef] [Scilit] [PubMed]
- Correia, C.; Coutinho, A.M.; Diogo, L.; Grazina, M.; Marques, C.; Miguel, T.; Ataíde, A.; Almeida, J.; Borges, L.; Oliveira, C.; et al. Brief report: High frequency of biochemical markers for mitochondrial dysfunction in autism: No association with the mitochondrial aspartate/glutamate carrier SLC25A12 gene. J. Autism Dev. Disord. 2006, 36, 1137–1140. [Google Scholar] [CrossRef] [Scilit] [PubMed]
- Rossignol, D.A.; Frye, R.E. Mitochondrial dysfunction in autism spectrum disorders: A systematic review and meta-analysis. Mol. Psychiatry 2012, 17, 290–314. [Google Scholar] [CrossRef] [Scilit] [PubMed]
- Filipek, P.A.; Juranek, J.; Nguyen, M.T.; Cummings, C.; Gargus, J.J. Relative carnitine deficiency in autism. J. Autism Dev. Disord 2004, 34, 615–623. [Google Scholar] [CrossRef] [Scilit] [PubMed]
- Geier, D.A.; Kern, J.K.; Davis, G.; King, P.G.; Adams, J.B.; Young, J.L.; Geier, M.R. A prospective double-blind, randomized clinical trial of levocarnitine to treat autism spectrum disorders. Med. Sci. Monit. 2011, 17, PI15–PI23. [Google Scholar] [CrossRef] [Scilit] [PubMed]
- Fahmy, S.F.; El-hamamsy, M.H.; Zaki, O.K.; Badary, O.A. L-Carnitine supplementation improves the behavioral symptoms in autistic children. Res. Autism Spectr. Disord. 2013, 7, 159–166. [Google Scholar] [CrossRef] [Scilit]
- Buie, T.; Fuchs, G.J., 3rd; Furuta, G.T.; Kooros, K.; Levy, J.; Lewis, J.D.; Wershil, B.K.; Winter, H. Recommendations for evaluation and treatment of common gastrointestinal problems in children with ASDs. Pediatrics 2010, 125 (Suppl. 1), S19–S29. [Google Scholar] [CrossRef] [Scilit] [PubMed]
- Adams, J.B.; Johansen, L.J.; Powell, L.D.; Quig, D.; Rubin, R.A. Gastrointestinal Flora and Gastrointestinal Status in Children with Autism—Comparisons to Neurotypical Children and Correlation with Autism Severity. BMC Gastroenterol. 2011, 11, 22. [Google Scholar] [CrossRef] [Scilit] [PubMed]
- Kang, D.W.; Adams, J.B.; Gregory, A.C.; Borody, T.; Chittick, L.; Fasano, A.; Khoruts, A.; Geis, E.; Maldonado, J.; McDonough-Means, S.; et al. Microbiota Transfer Therapy alters gut ecosystem and improves gastrointestinal and autism symptoms: An open-label study. Microbiome 2017, 5, 10. [Google Scholar] [CrossRef] [Scilit] [PubMed]
- Kushak, R.I.; Lauwers, G.Y.; Winter, H.S.; Buie, T.M. Intestinal disaccharidase activity in patients with autism: Effect of age, gender, and intestinal inflammation. Autism 2011, 15, 285–294. [Google Scholar] [CrossRef] [Scilit] [PubMed]
- Brudnak, M.A.; Rimland, B.; Kerry, R.E.; Dailey, M.; Taylor, R.; Stayton, B.; Waickman, F.; Waickman, M.; Pangborn, J.; Buchholz, I. Enzyme-based therapy for autism spectrum disorders—Is it worth another look? Med. Hypotheses 2002, 58, 422–428. [Google Scholar] [CrossRef] [Scilit] [PubMed]
- Munasinghe, S.A.; Oliff, C.; Finn, J.; Wray, J.A. Digestive enzyme supplementation for autism spectrum disorders: A double-blind randomized controlled trial. J. Autism Dev. Disord. 2010, 40, 1131–1138. [Google Scholar] [CrossRef] [Scilit] [PubMed]
- Saad, K.; Eltayeb, A.A.; Mohamad, I.L.; Al-Atram, A.A.; Elserogy, Y.; Bjørklund, G.; El-Houfey, A.A.; Nicholson, B. A Randomized, Placebo-controlled Trial of Digestive Enzymes in Children with Autism Spectrum Disorders. Clin. Psychopharmacol. Neurosci. 2015, 13, 188–193. [Google Scholar] [CrossRef] [Scilit] [PubMed]
- Meguid, N.A.; Anwar, M.; Bjørklund, G.; Hashish, A.; Chirumbolo, S.; Hemimi, M.; Sultan, E. Dietary adequacy of Egyptian children with autism spectrum disorder compared to healthy developing children. Metab. Brain Dis. 2017, 32, 607–615. [Google Scholar] [CrossRef] [Scilit] [PubMed]
- Bandini, L.G.; Anderson, S.E.; Curtin, C.; Cermak, S.; Evans, E.W.; Scampini, R.; Maslin, M.; Must, A. Food Selectivity in Children with Autism Spectrum Disorders and Typically Developing Children. J. Pediatr. 2010, 157, 259–264. [Google Scholar] [CrossRef] [Scilit] [PubMed]
- Vojdani, A.; O’Bryan, T.; Green, J.A.; Mccandless, J.; Woeller, K.N.; Vojdani, E.; Nourian, A.A.; Cooper, E.L. Immune response to dietary proteins, gliadin and cerebellar peptides in children with autism. Nutr Neurosci. 2004, 7, 151–161. [Google Scholar] [CrossRef] [Scilit] [PubMed]
- Jyonouchi, H.; Geng, L.; Ruby, A.; Zimmerman-Bier, B. Dysregulated innate immune responses in young children with autism spectrum disorders: Their relationship to gastrointestinal symptoms and dietary intervention. Neuropsychobiology 2005, 51, 77–85. [Google Scholar] [CrossRef] [Scilit] [PubMed]
- Jyonouchi, H.; Geng, L.; Ruby, A.; Reddy, C.; Zimmerman-Bier, B. Evaluation of an association between gastrointestinal symptoms and cytokine production against common dietary proteins in children with autism spectrum disorders. J. Pediatr. 2005, 146, 605–610. [Google Scholar] [CrossRef] [Scilit] [PubMed]
- Jyonouchi, H.; Sun, S.; Itokazu, N. Innate immunity associated with inflammatory responses and cytokine production against common dietary proteins in patients with autism spectrum disorder. Neuropsychobiology 2002, 46, 76–84. [Google Scholar] [CrossRef] [Scilit] [PubMed]
- De Magistris, L.; Picardi, A.; Siniscalco, D.; Riccio, M.P.; Sapone, A.; Cariello, R.; Abbadessa, S.; Medici, N.; Lammers, K.M.; Schiraldi, C.; et al. Antibodies against Food Antigens in Patients with Autistic Spectrum Disorders. BioMed Res. Int. 2013, 2013, 1–11. [Google Scholar] [CrossRef] [Scilit] [PubMed]
- Iovene, M.R.; Bombace, F.; Maresca, R.; Sapone, A.; Iardino, P.; Picardi, A.; Marotta, R.; Schiraldi, C.; Siniscalco, D.; Serra, N.; et al. Intestinal Dysbiosis and Yeast Isolation in Stool of Subjects with Autism Spectrum Disorders. Mycopathologia 2016, 182, 349–363. [Google Scholar] [CrossRef] [Scilit] [PubMed]
- Cade, R.; Privette, M.; Fregly, M.; Rowland, N.; Sun, Z.; Zele, V.; Wagemaker, H.; Edelstein, C. Autism and Schizophrenia: Intestinal Disorders. Nutr. Neurosci 2000, 3, 57–72. [Google Scholar] [CrossRef] [Scilit] [PubMed]
- Lucarelli, S.; Frediani, T.; Zingoni, A.M.; Ferruzzi, F.; Giardini, O.; Quintieri, F.; Barbato, M.; D’eufemia, P.; Cardi, E. Food allergy and infantile autism. Panminerva Med. 1995, 37, 137–141. [Google Scholar] [PubMed]
- Knivsberg, A.M.; Reichelt, K.L.; Hoien, T.; Nodland, M. A randomised, controlled study of dietary intervention in autistic syndromes. Nutr. Neurosci. 2002, 5, 251–261. [Google Scholar] [CrossRef] [Scilit] [PubMed]
- Elder, J.H.; Shankar, M.; Shuster, J.; Theriaque, D.; Burns, S.; Sherrill, L. The gluten-free, casein-free diet in autism: Results of a preliminary double blind clinical trial. J. Autism Dev. Disord. 2006, 36, 413–420. [Google Scholar] [CrossRef] [Scilit] [PubMed]
- Whiteley, P.; Haracopos, D.; Knivsberg, A.M.; Reichelt, K.L.; Parlar, S.; Jacobsen, J.; Seim, A.; Pedersen, L.; Schondel, M.; Shattock, P. The ScanBrit randomised, controlled, single-blind study of a gluten- and casein-free dietary intervention for children with autism spectrum disorders. Nutr. Neurosci. 2010, 13, 87–100. [Google Scholar] [CrossRef] [Scilit] [PubMed]
- Adams, J.B. Nutritional, Dietary, and Medical Treatments for Autism—Based on over 150 published research studies. Autism Res. Inst. Publ. 2013, 41, 1–53. [Google Scholar]
- Naviaux, J.C.; Wang, L.; Li, K.; Bright, A.T.; Alaynick, W.A.; Williams, K.R.; Powell, S.B.; Naviaux, R.K. Antipurinergic therapy corrects the autism-like features in the Fragile X (Fmr1 knockout) mouse model. Mol. Autism 2015, 6, 1. [Google Scholar] [CrossRef] [Scilit] [PubMed]
- Dyerberg, J.; Madsen, P.; Møller, J.M.; Aardestrup, I.; Schmidt, E.B. Bioavailability of marine n-3 fatty acid formulations. Prostaglandins Leuk. Essent. Fat. Acids 2010, 83, 137–141. [Google Scholar] [CrossRef] [Scilit] [PubMed]
- Saad, K.; Abdel-Rahman, A.A.; Elserogy, Y.M.; Al-Atram, A.A.; Cannell, J.J.; Bjørklund, G.; Abdel-Reheim, M.K.; Othman, H.A.; El-Houfey, A.A.; Abd El-Aziz, N.H.; et al. Vitamin D status in autism spectrum disorders and the efficacy of vitamin D supplementation in autistic children. Nutr. Neurosci. 2016, 19, 346–351. [Google Scholar] [CrossRef] [Scilit] [PubMed]
- Saad, K.; Abdel-Rahman, A.A.; Elserogy, Y.M.; Al-Atram, A.A.; El-Houfey, A.A.; Othman, H.A.; Bjørklund, G.; Jia, F.; Urbina, M.A.; Abo-Elela, M.G.M.; et al. Randomized controlled trial of vitamin D supplementation in children with autism spectrum disorder. J. Child Psychol. Psychiatr. 2016, 59, 20–29. [Google Scholar] [CrossRef] [Scilit] [PubMed]
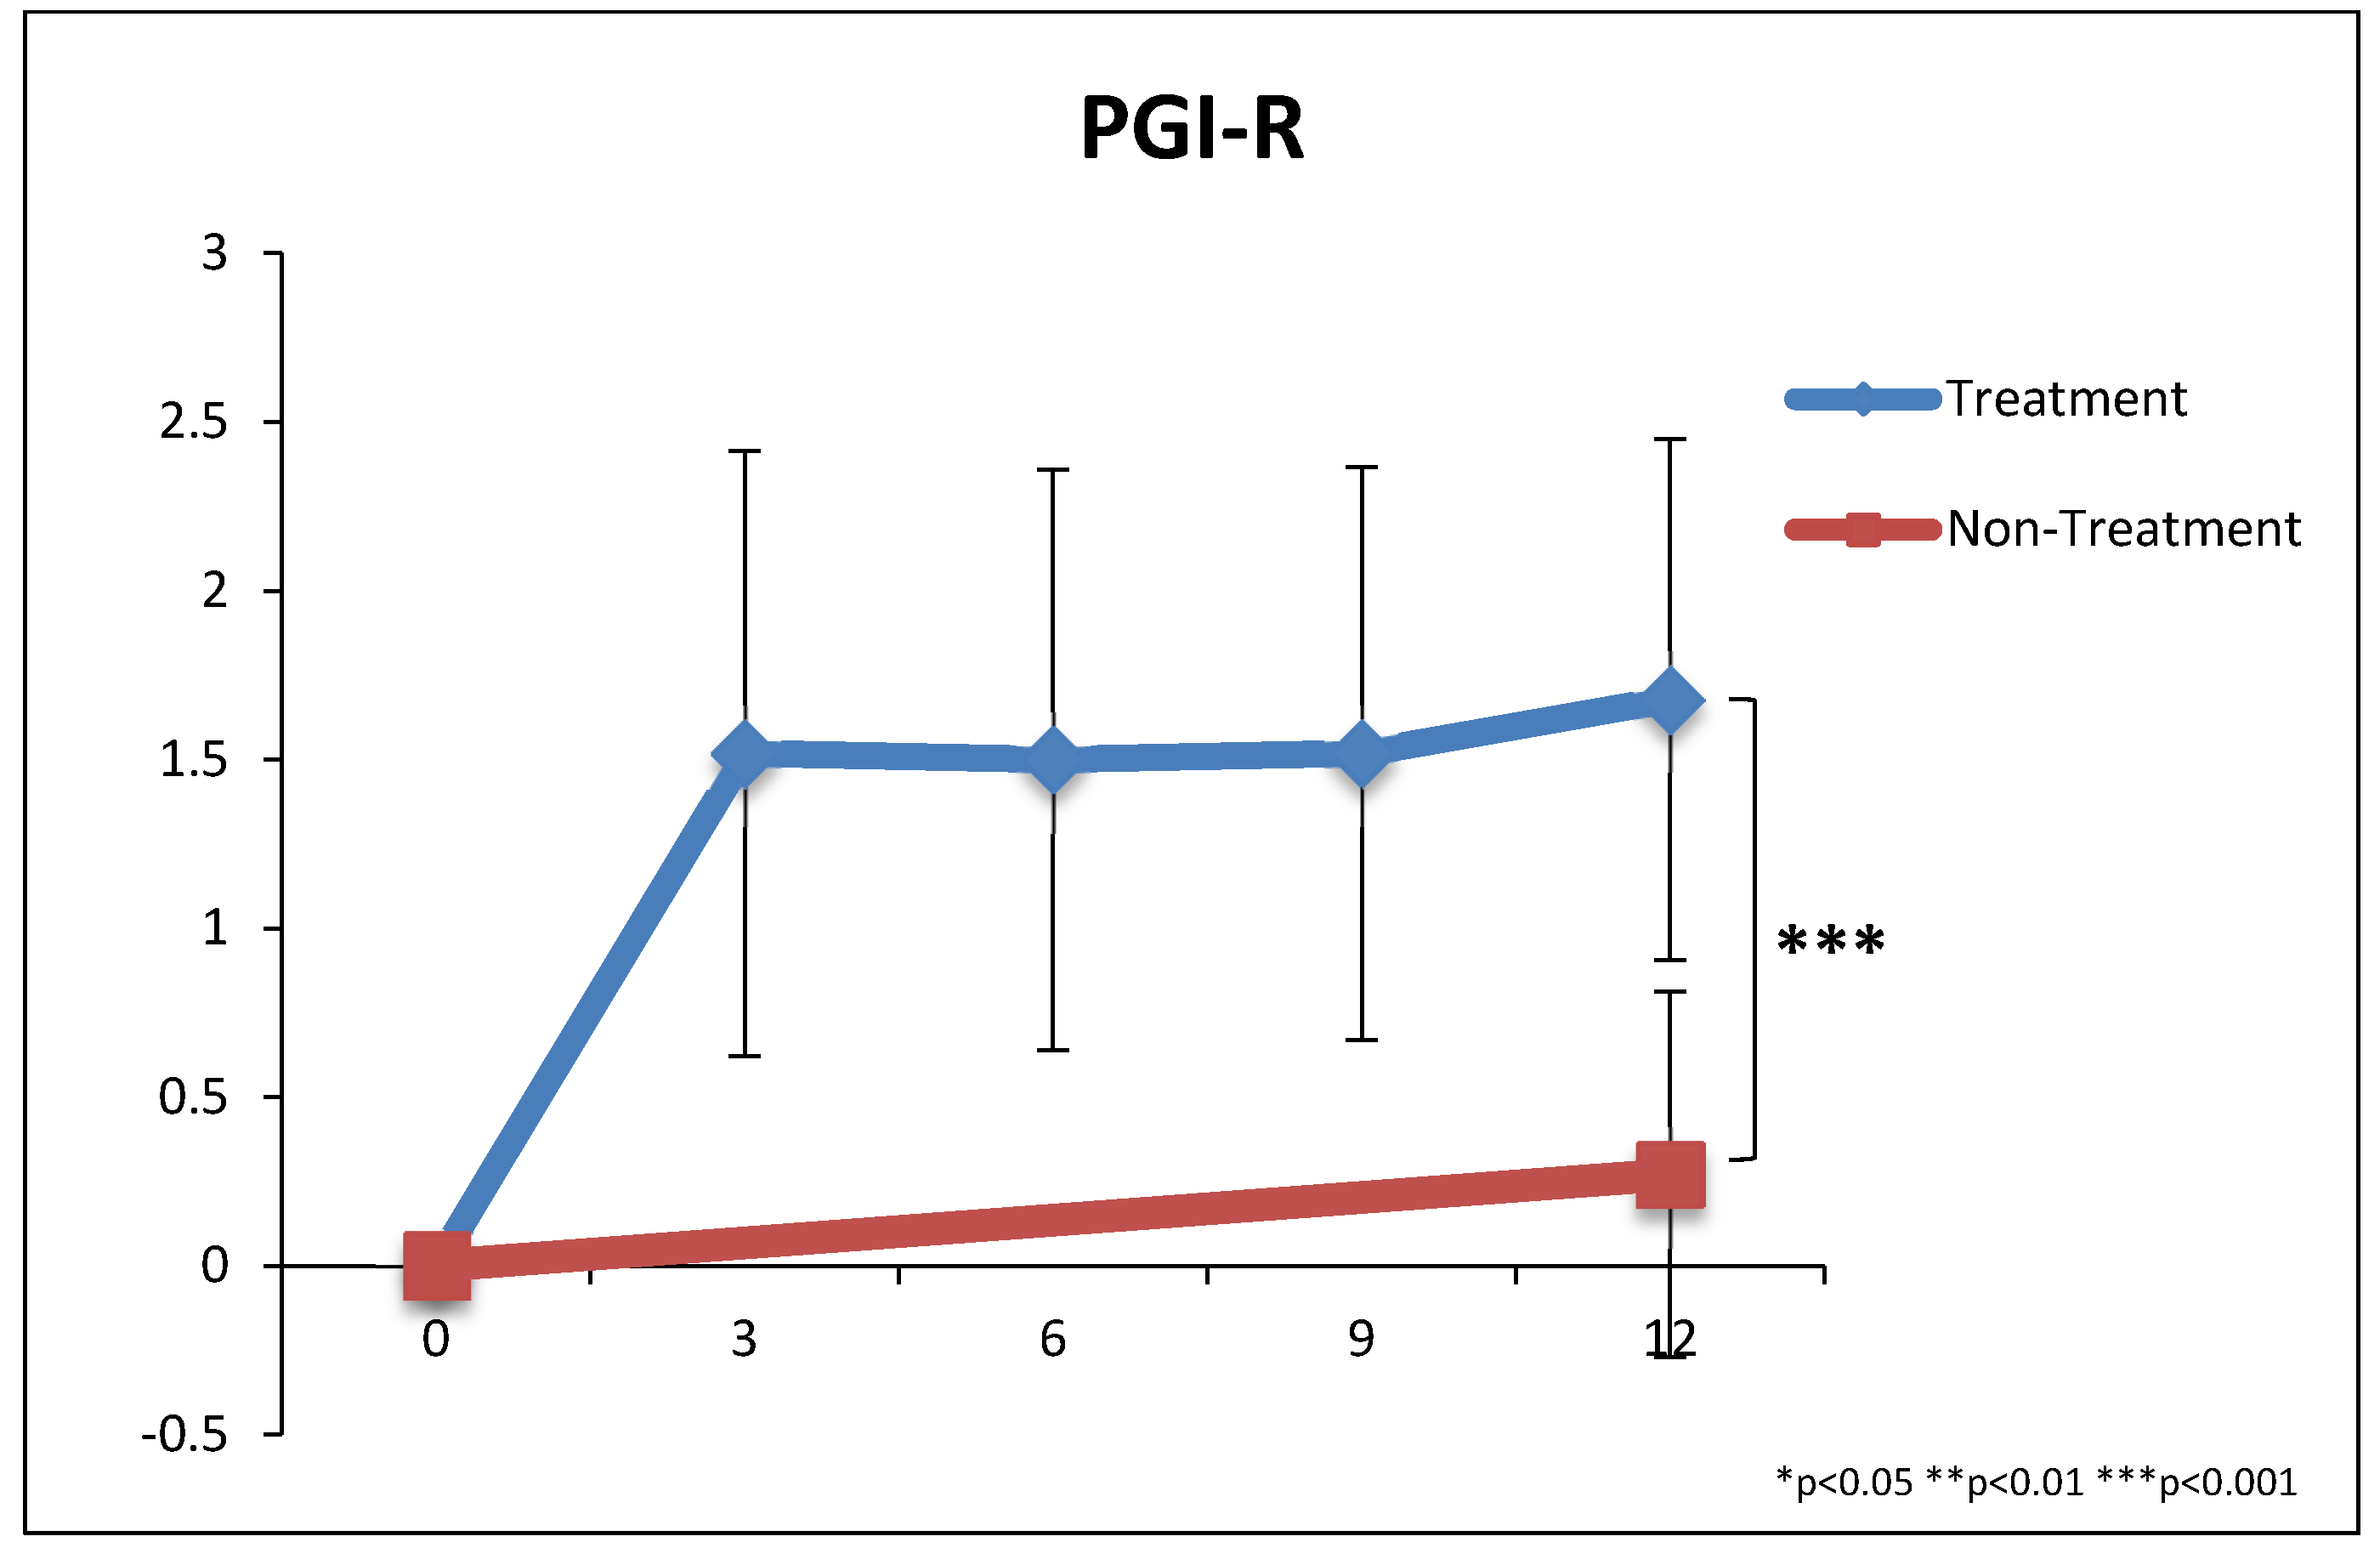
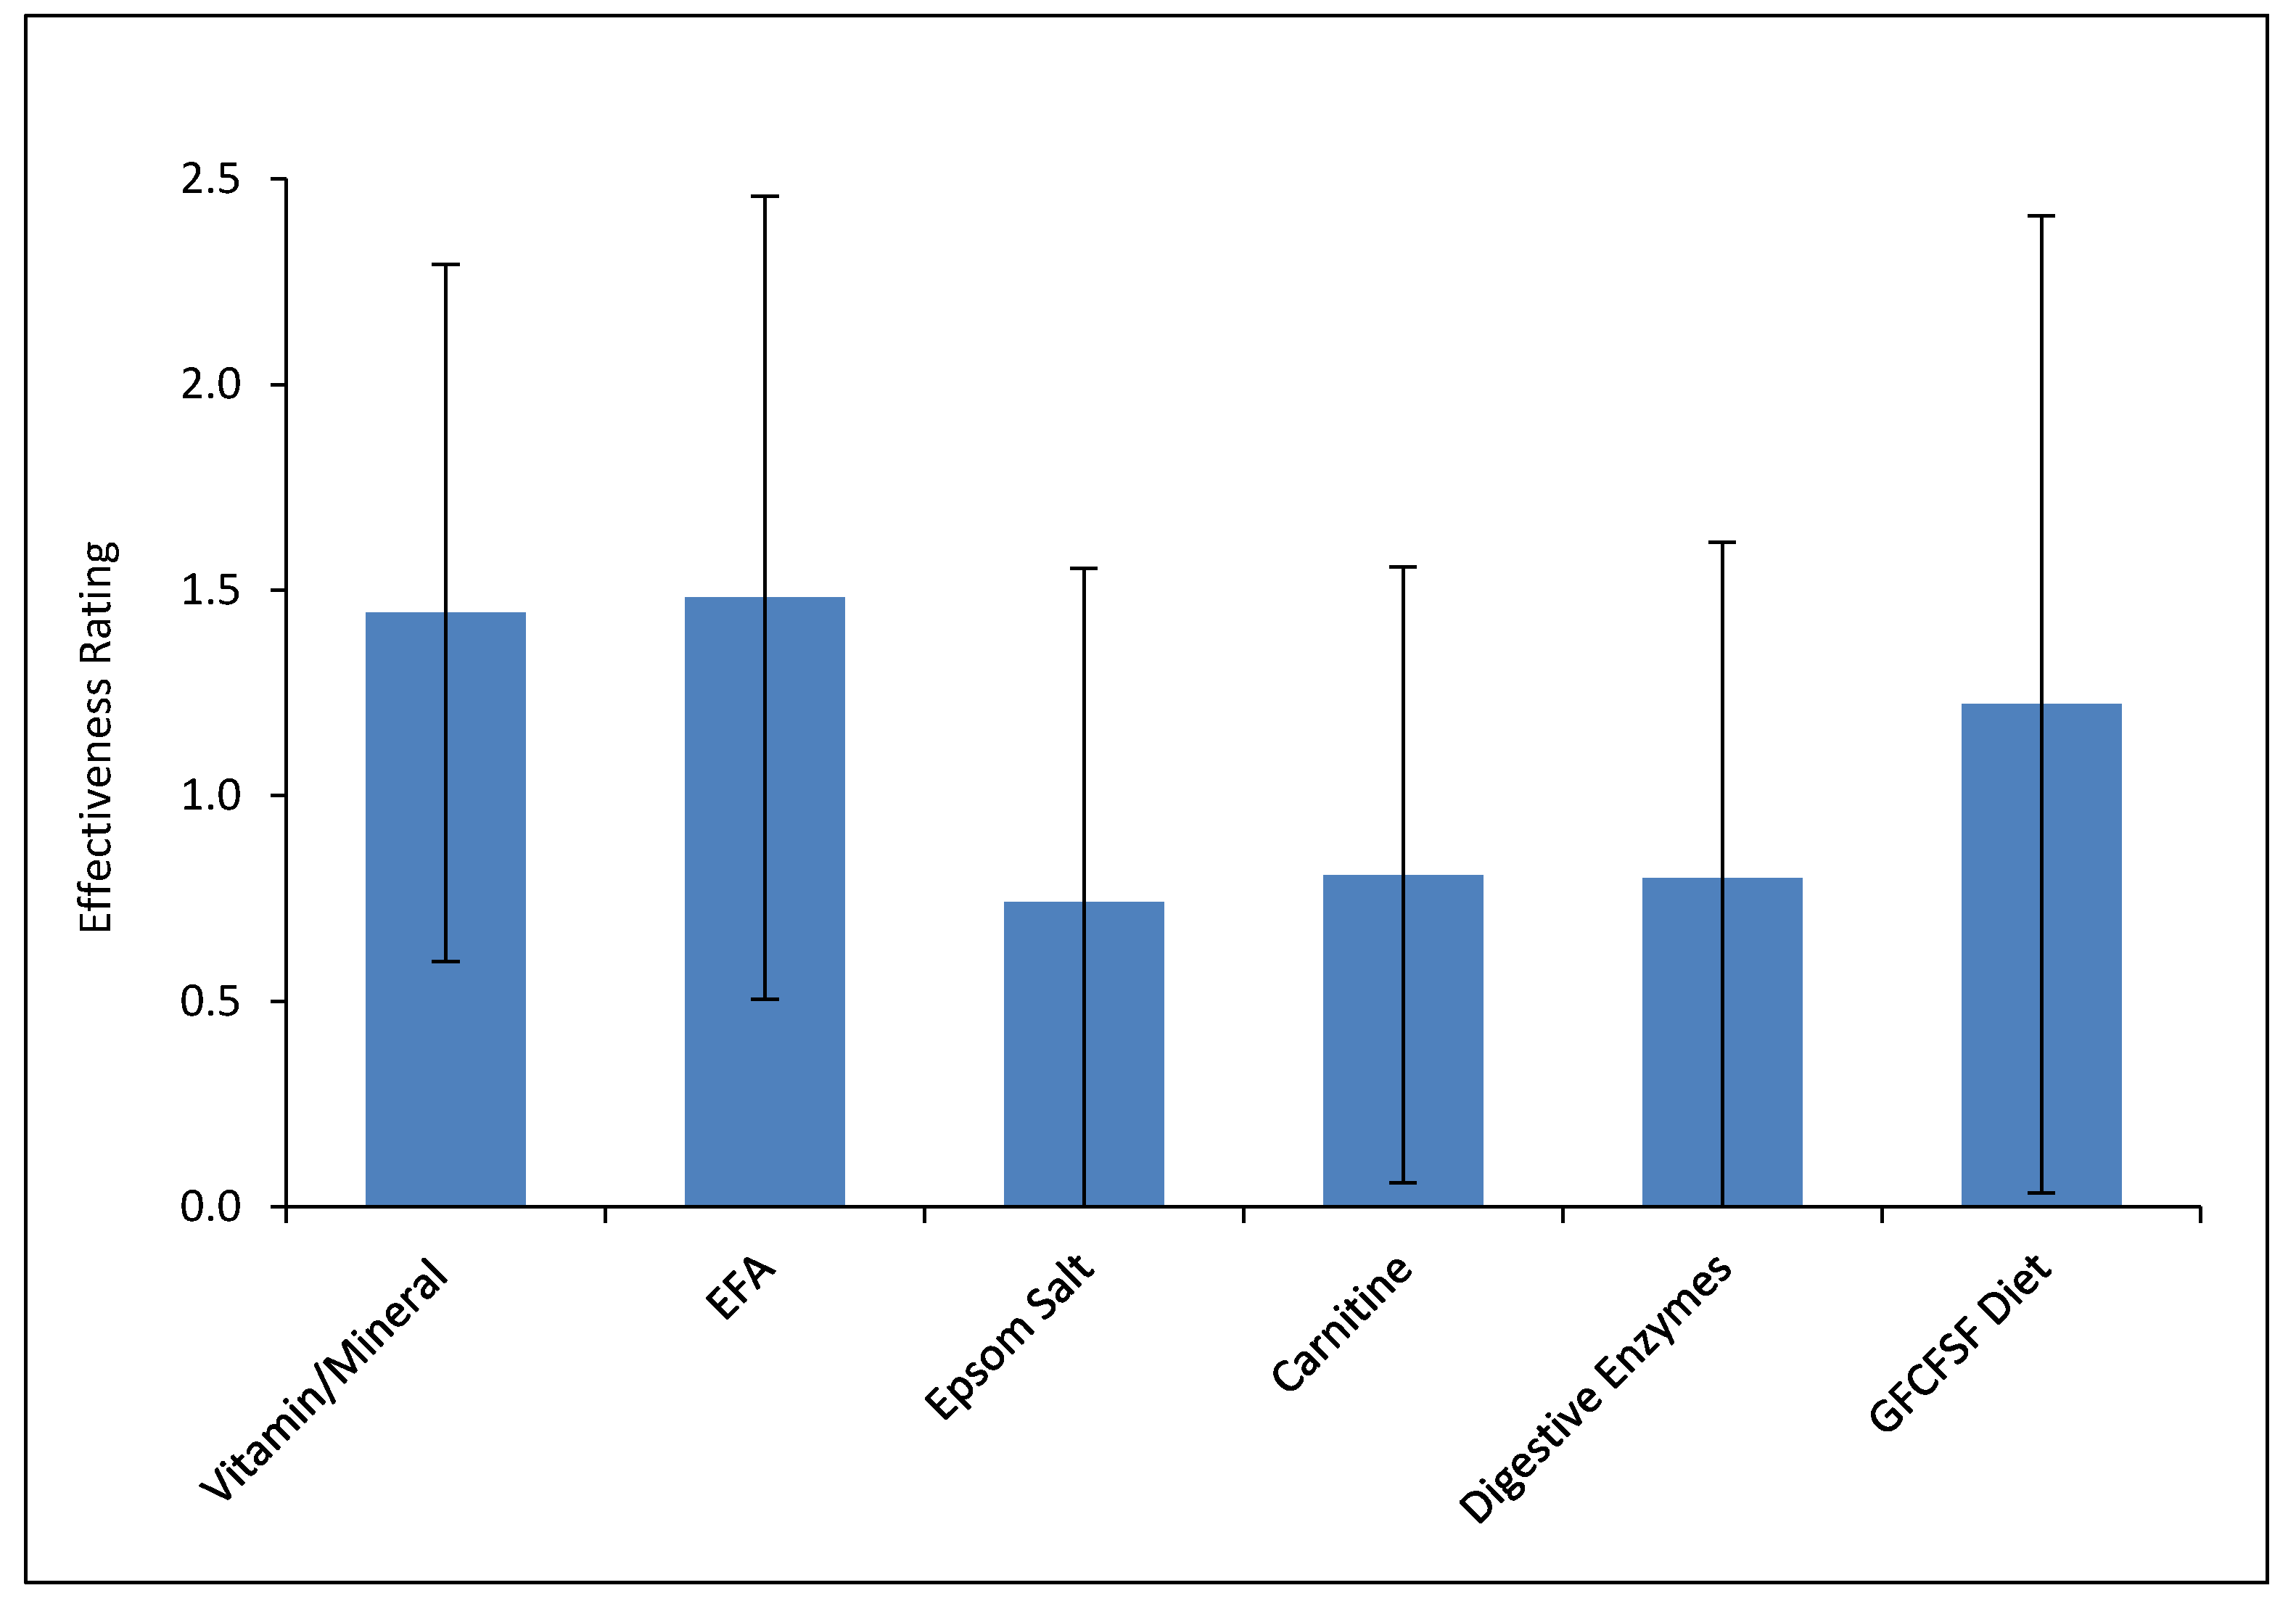
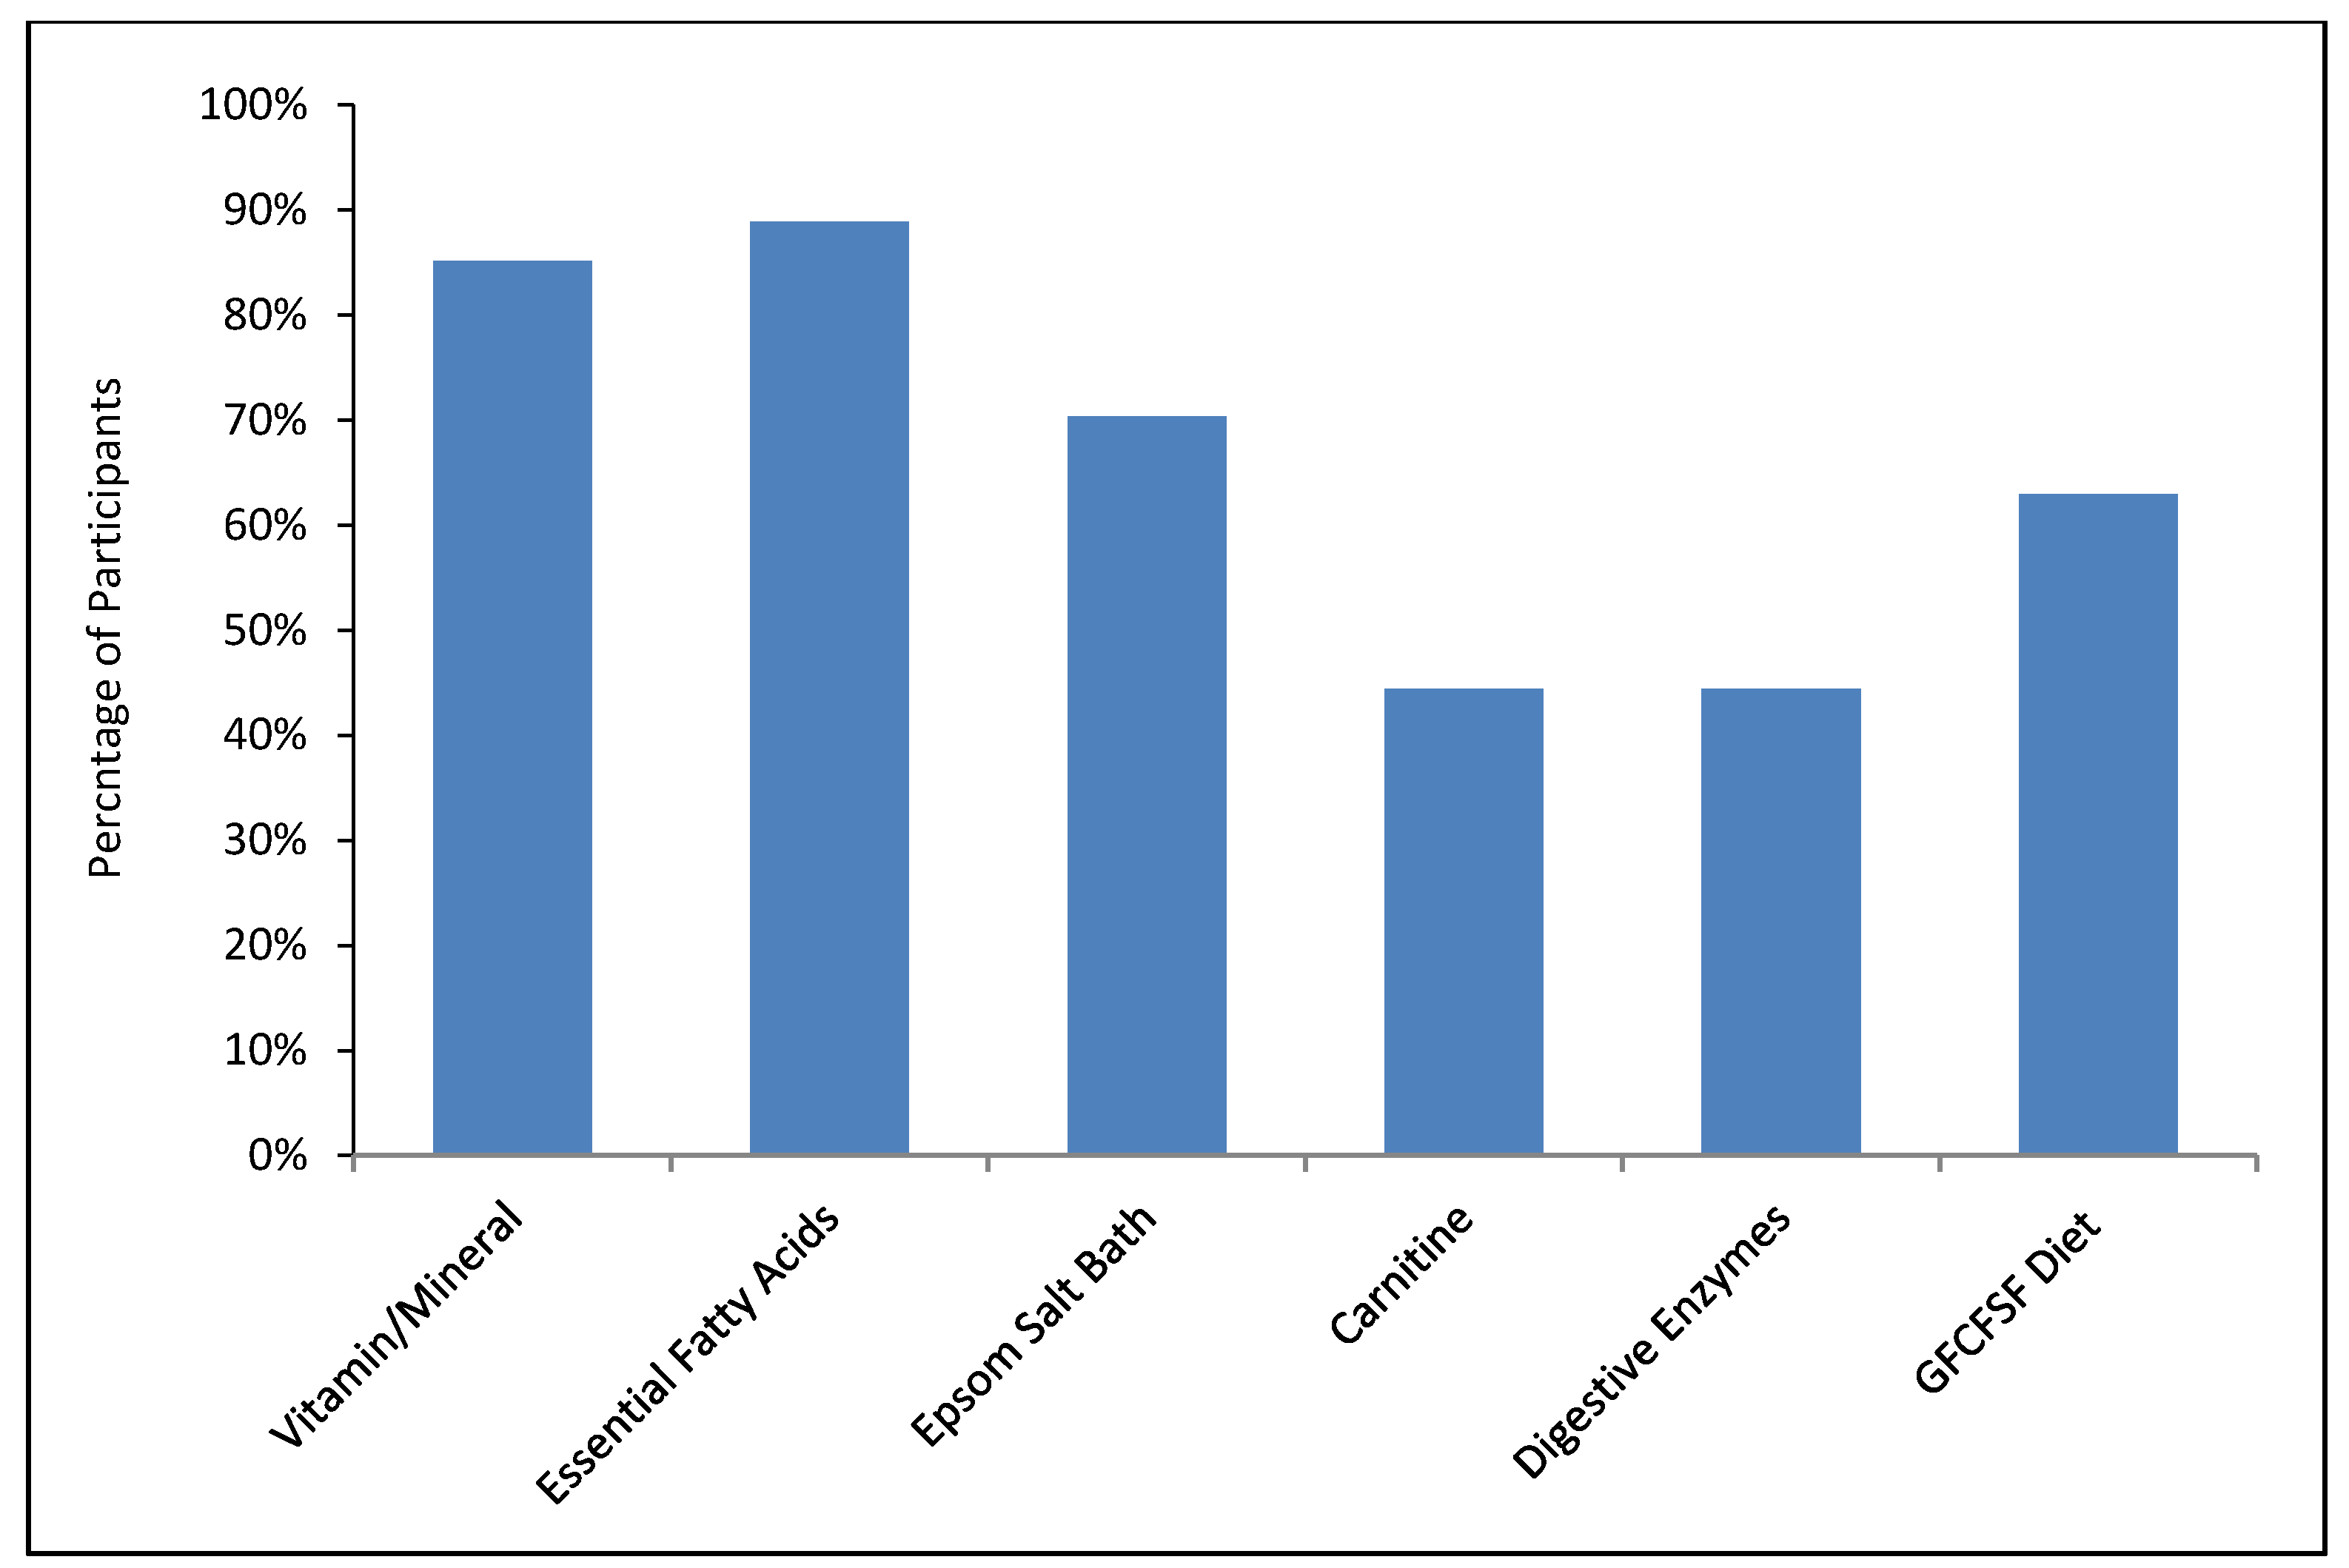

| ASD–Treatment | ASD–Non–Treatment | Neurotypical | |
|---|---|---|---|
| Total Participants | 37 | 30 | 50 |
| Male | 30 (81%) | 25 (83%) | 41 (82%) |
| Female | 7 (19%) | 5 (17%) | 9 (18%) |
| Age (years) | 10.8 ± 7.0 | 12.3 ± 10.1 | 12.2 ± 7.5 |
| Children (ages 3–12) | Children n = 28 (76%) | Children n = 20 (67%) | Children n = 34 (68%) |
| Teens (ages 13–20) | Teens n = 6 (16%) | Teens n = 7 (23%) | Teens n = 11 (22%) |
| Adults (ages 20+) | Adults n = 3 (8%) | Adults n = 3 (10%) | Adults n = 5 (10%) |
| Diagnosis | Autism = 29 (83%) | Autism = 21 (70%) | |
| Asperger’s = 3 (9%) | Asperger’s = 5 (17%) | ||
| PDD-NOS = 3 (9%) | PDD-NOS = 4 (13%) | ||
| Autism Onset | Regressive = 13 (36%) | Regressive = 9 (31%) | |
| Plateau = 8 (22%) | Plateau = 10 (34%) | ||
| Early Onset = 15 (42%) | Early Onset = 10 (34%) | ||
| Asthma | 9 (25%) | 8 (27%) | 8 (16%) |
| Food Allergies | 13 (36%) | 3 (10%) | 2 (4%) |
| Other Allergies | 19 (51%) | 13 (43%) | 15 (30%) |
| Other Health Issues—frequency | 15 (41%) | 14 (47%) | 2 (4%) |
| Other Health Issues—description (note: these are likely under-reported since we only asked a general question about “other health conditions”, and some of these symptoms might be viewed as part of autism) | ADHD-4; sensory problems-3; intellectual disability-2; seizures; early puberty; vascular malformation; mood disorder; spinal fusion; agenesis of lung; gastritis; eczema; apraxia; type 2 diabetes | ADHD-6, cerebral palsy-3, hypotonia-2, learning disability-2, depression-2, dysphagia, sensory disorder, reflux, seizures, sleep disorder, sexual prematurity, type 1 diabetes, OCD, anxiety | nocturnal enuresis; Hashimoto’s thyroiditis |
| Medications (participants taking one or more of the different types of medications) | allergy-6; psych-4; asthma-3; seizure-2; sleep-2; diabetes-1; cholesterol-1; laxative-1 | psych-8; allergy-4; seizure-2; thyroid-2; sleep-2; blood pressure-1; diabetes-1; acne-1 | Allergies-2; asthma-1; thyroid-1 |
| Ingredients | Amount |
|---|---|
| Vitamin A (85% beta carotene and 15% palmitate, IU) | 6500 |
| Vitamin C (from calcium ascorbate, mg) | 500 |
| Vitamin D3 (cholecalciferol, IU) | 1000 |
| Vitamin E (as alpha-tocopherol, IU) | 150 |
| Vitamin K (K1 and K2, mcg) | 55 |
| Vitamin B1 (thiamin hydrochloride, mg) | 20 |
| Vitamin B2 Riboflavin (mg) | 40 |
| Niacin (71% inositol hexanicotinate & 29% niacinamide, mg) | 35 |
| Vitamin B6 (50% as P5P pyridoxal 5 phosphate, 50% as pyridoxine hydrochloride, mg) | 40 |
| Folate (as folic acid, folinic acid, and l-5-methyltetrahydrofolate, mcg) | 600 |
| Vitamin B12 (50% as methylcobalamin & 50% as cyanocobalamin, mcg) | 500 |
| Biotin (mcg) | 225 |
| Pantothenic Acid (calcium d-pantothenate, mg) | 30 |
| Iodine (potassium iodide, mcg) | 100 |
| Lithium (mcg) | 350 |
| Choline (from choline bitartrate, mg) | 250 |
| Inositol (mg) | 100 |
| Calcium (mg) | 70 |
| Magnesium (magnesium citrate, mg) | 100 |
| Zinc (zinc gluconate, mg) | 15 |
| Selenium (selenomethionine and sodium selenite, mcg) | 40 |
| Manganese (manganese amino acid chelate, mg) | 1 |
| Chromium (chromium amino acid chelate, mcg) | 70 |
| Molybdenum (sodium molybdate dihydrate, mcg) | 100 |
| Potassium (from potassium chloride, mg) | 50 |
| MSM (methylsulfonylmethane, mg) | 500 |
| Vitamin E as mixed tocopherols (mg) | 100 |
| CoQ10 (mg) | 50 |
| N-acetyl-cysteine (mg) | 45 |
| Acetyl-l-carnitine (mg) | 200 |
| Vanadium (mcg) | 25 |
| Boron (mcg) | 250 |
| Ingredients | |
|---|---|
| Amylase | 3500 DU |
| Peptidase | 13,000 HUT |
| Glucoamylase | 50 AGU |
| Xylanase | 7000 XU |
| Protease 4.5 | 22,000 HUT |
| Protease 3.0 | 35 SAPU |
| Amylase | 1500 DU |
| Invertase | 800 SU |
| Alpha-galactosidase | 100 GalU |
| Lactase | 500 ALU |
| Lipase | 500 FIP |
| Treatment Group (n = 28) | Non-Treatment Group (n = 27) | t-Test | |||||||||
|---|---|---|---|---|---|---|---|---|---|---|---|
| Initial | S.D. | Final | S.D. | % Change | Initial | S.D. | Final | S.D. | % Change | ||
| RIAS | |||||||||||
| Nonverbal Intelligence Index | 69.6 | 23 | 76.3 | 24 | +10% | 85.8 | 24 | 85.3 | 24 | −1% | 0.01 |
| Verbal Intelligence Index | 63.1 | 24 | 66.0 | 26 | +5% | 77.6 | 24 | 81.5 | 25 | +5% | n.s. |
| Composite Memory Index | 71.3 | 20 | 75.3 | 23 | +6% | 81.0 | 23 | 87.9 | 25 | +8% | n.s. |
| CARS-2 | 39.3 | 5.6 | 33.9 | 7.0 | −22% # | 38.2 | 5.2 | 35.0 | 5.8 | −14% # | 0.03 |
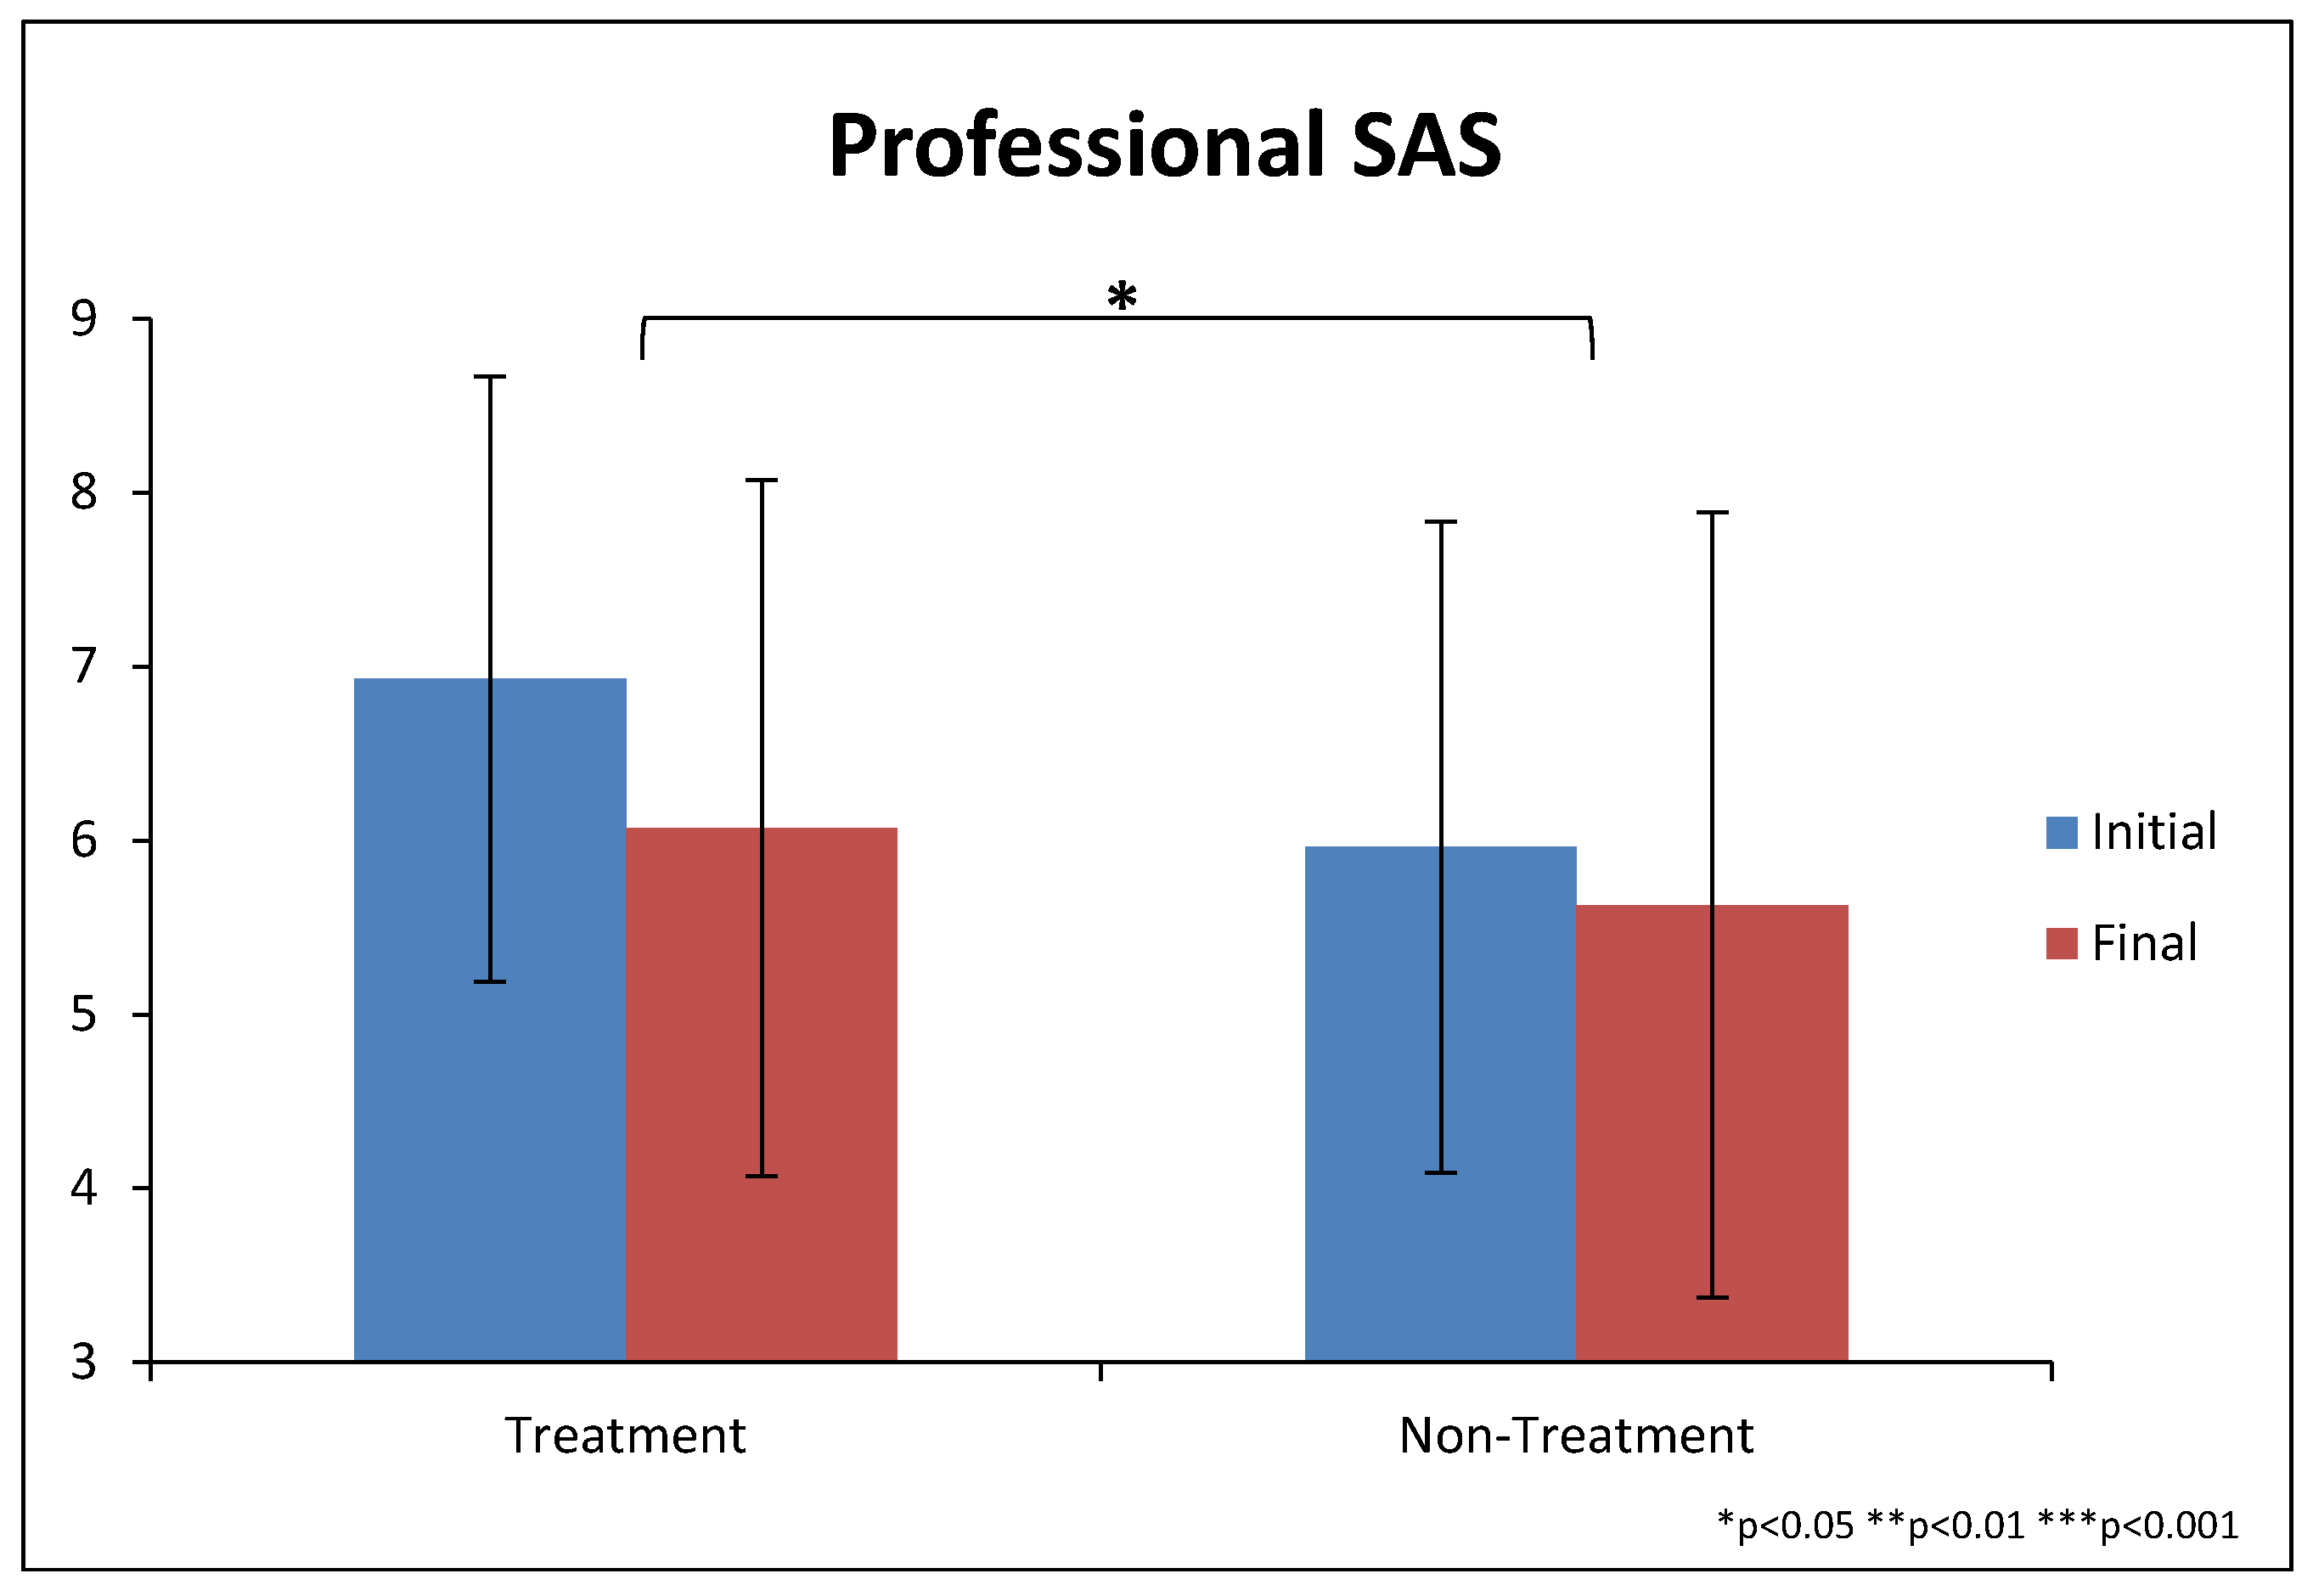
| SAS-Pro | 6.9 | 1.7 | 6.0 | 2.1 | −13% | 6.0 | 1.9 | 5.6 | 2.3 | −6% | 0.04 |
| Treatment Group (n = 19) | Non-Treatment Group (n = 16) | t-Test | |||||||||
|---|---|---|---|---|---|---|---|---|---|---|---|
| Initial | S.D. | Final | S.D. | % Change | Initial | S.D. | Final | S.D. | % Change | ||
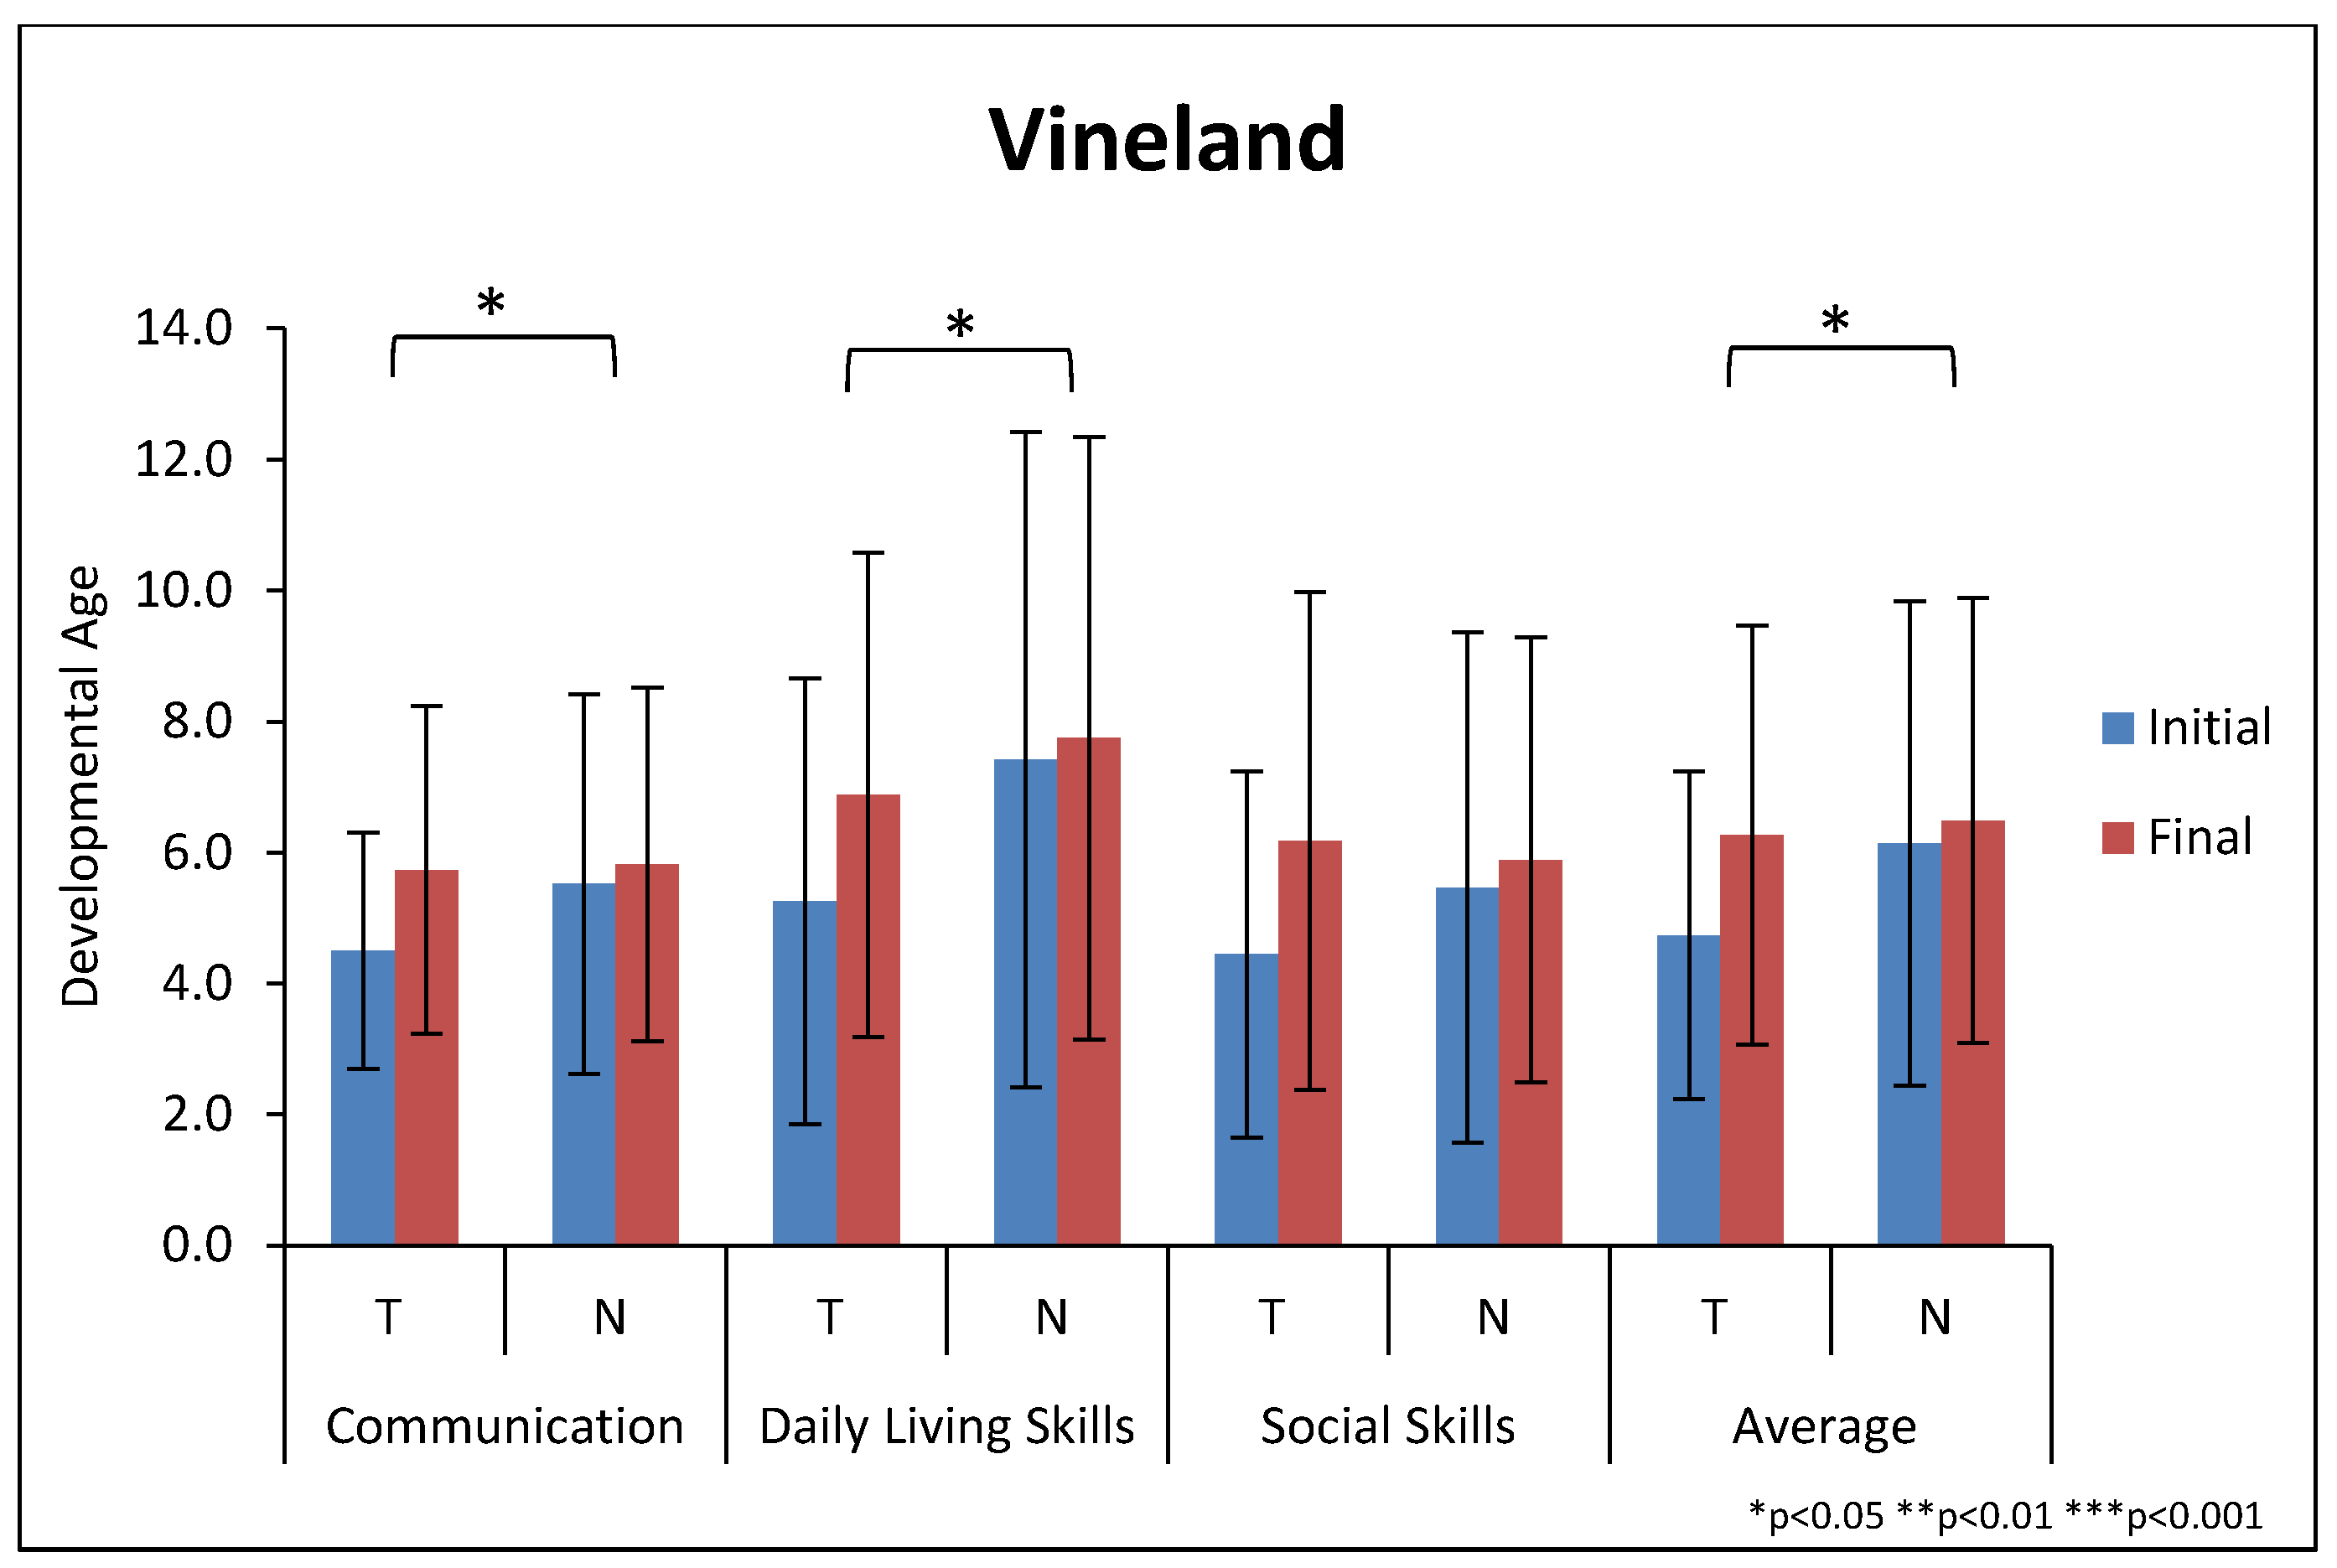
| Communication | 4.5 | 1.8 | 5.7 | 2.5 | +27% | 5.5 | 2.9 | 5.8 | 2.7 | +5% | 0.01 |
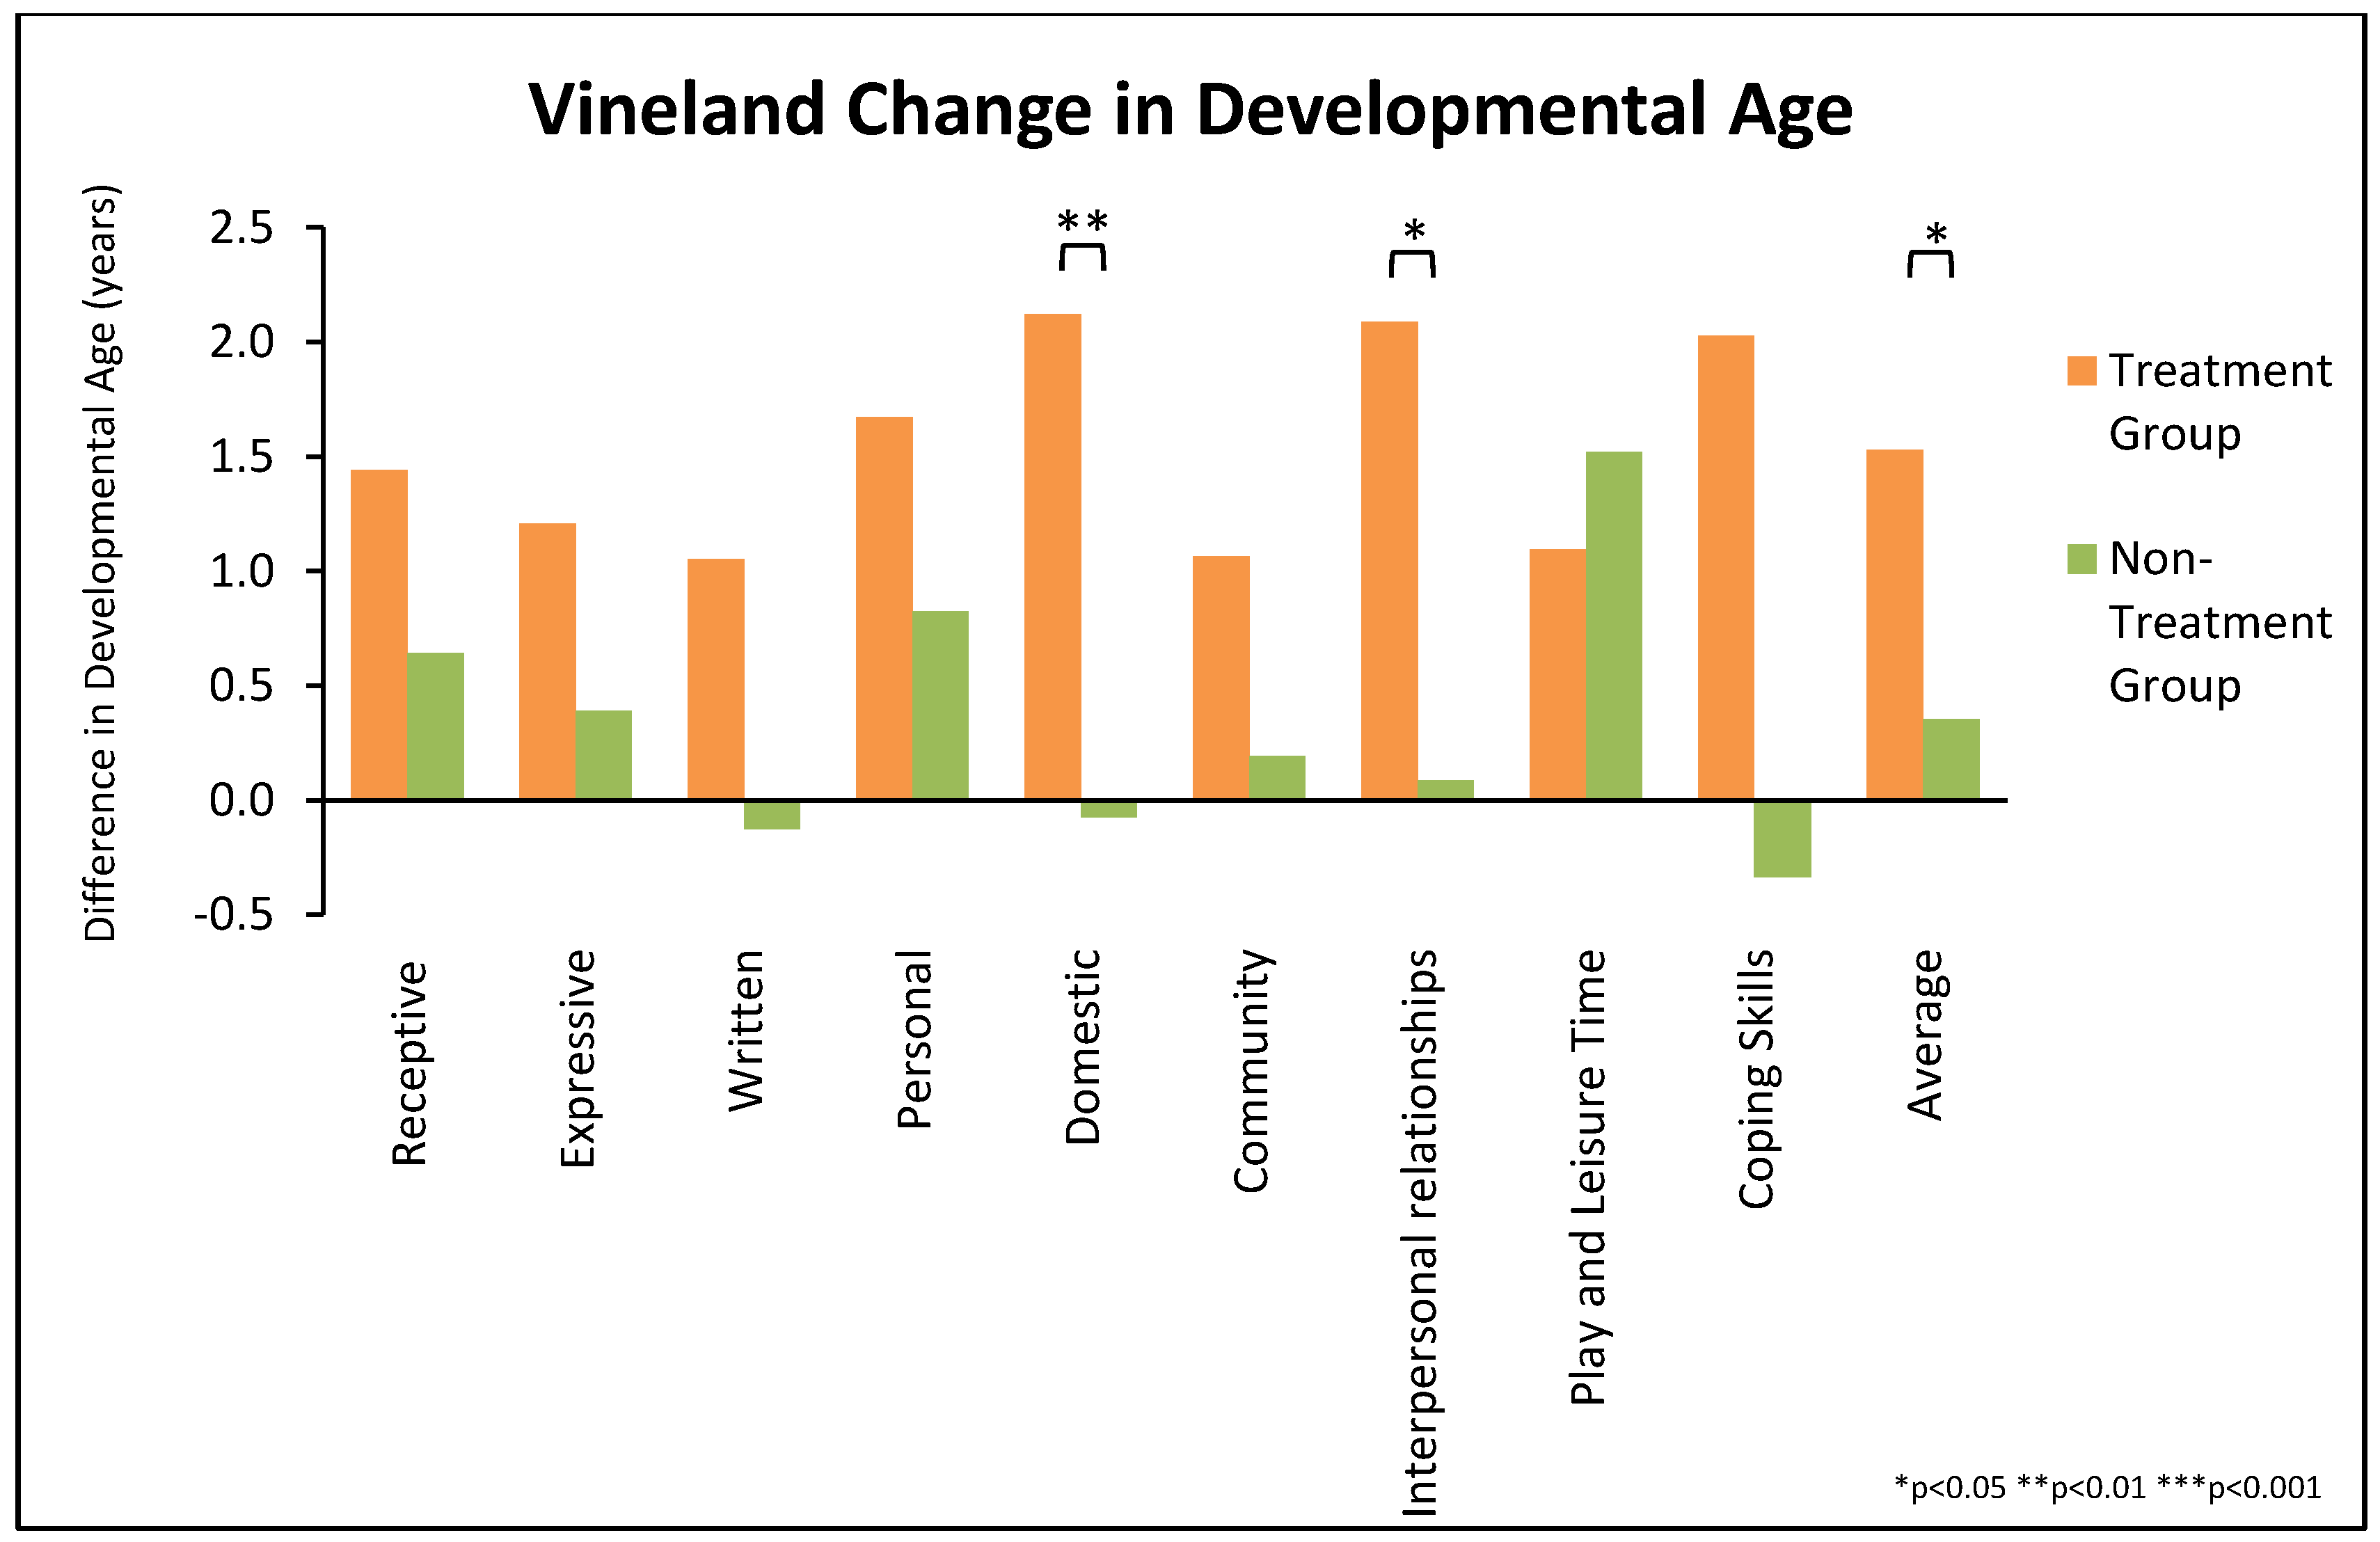
| Receptive | 3.3 | 2.3 | 4.8 | 2.8 | +43% | 3.8 | 2.1 | 4.5 | 2.6 | +17% | 0.09 |
| Expressive | 3.6 | 1.7 | 4.8 | 2.5 | +34% | 4.5 | 2.8 | 4.9 | 2.9 | +9% | 0.06 |
| Written | 6.6 | 2.3 | 7.6 | 2.7 | +16% | 8.2 | 4.1 | 8.1 | 3.1 | −2% | 0.03 |
| Daily Living Skills | 5.3 | 3.4 | 6.9 | 3.7 | +31% | 7.4 | 5.0 | 7.7 | 4.6 | +4% | 0.007 |
| Personal | 4.9 | 3.6 | 6.5 | 4.3 | +34% | 7.5 | 5.5 | 8.3 | 5.6 | +11% | n.s. |
| Domestic | 4.8 | 3.6 | 6.9 | 3.7 | +44% | 7.0 | 4.5 | 7.0 | 4.3 | −1% | 0.002 |
| Community | 6.1 | 4.1 | 7.1 | 3.7 | +18% | 8.2 | 5.5 | 8.4 | 4.5 | +2% | 0.07 |
| Social | 4.4 | 2.8 | 6.2 | 3.8 | +39% | 5.5 | 3.9 | 5.9 | 3.4 | +8% | 0.05 |
| Interpersonal Relationships | 3.5 | 2.5 | 5.6 | 4.2 | +59% | 3.9 | 3.1 | 3.9 | 2.6 | +2% | 0.01 |
| Play and Leisure Time | 4.3 | 2.6 | 5.4 | 2.7 | +25% | 5.4 | 3.5 | 6.9 | 4.2 | +28% | n.s. |
| Coping Skills | 5.5 | 3.9 | 7.5 | 5.3 | +37% | 7.1 | 5.8 | 6.8 | 4.8 | −5% | 0.03 |
| Motor Skills | 4.4 | 1.3 | 5.1 | 1.0 | +15% | 5.1 | 1.6 | 5.7 | 1.0 | +12% | n.s. |
| Gross Motor | 4.0 | 1.3 | 4.5 | 1.2 | +13% | 4.8 | 1.6 | 5.6 | 1.3 | +16% | n.s. |
| Fine Motor | 4.8 | 1.6 | 5.6 | 1.2 | +17% | 5.4 | 1.6 | 5.8 | 1.0 | +9% | n.s. |
| Average VABS (excluding motor skills) | 4.7 | 2.5 | 6.3 | 3.2 | +32% | 6.1 | 3.7 | 6.5 | 3.4 | +6% | 0.008 |
| Treatment Group (n = 27) | Non-Treatment Group (n = 26) | t-Test | |||||||||
|---|---|---|---|---|---|---|---|---|---|---|---|
| Initial | S.D. | Final | S.D. | % Change | Initial | S.D. | Final | S.D. | % Change | ||
| Maladaptive Behaviors—higher scores mean worse problems | |||||||||||
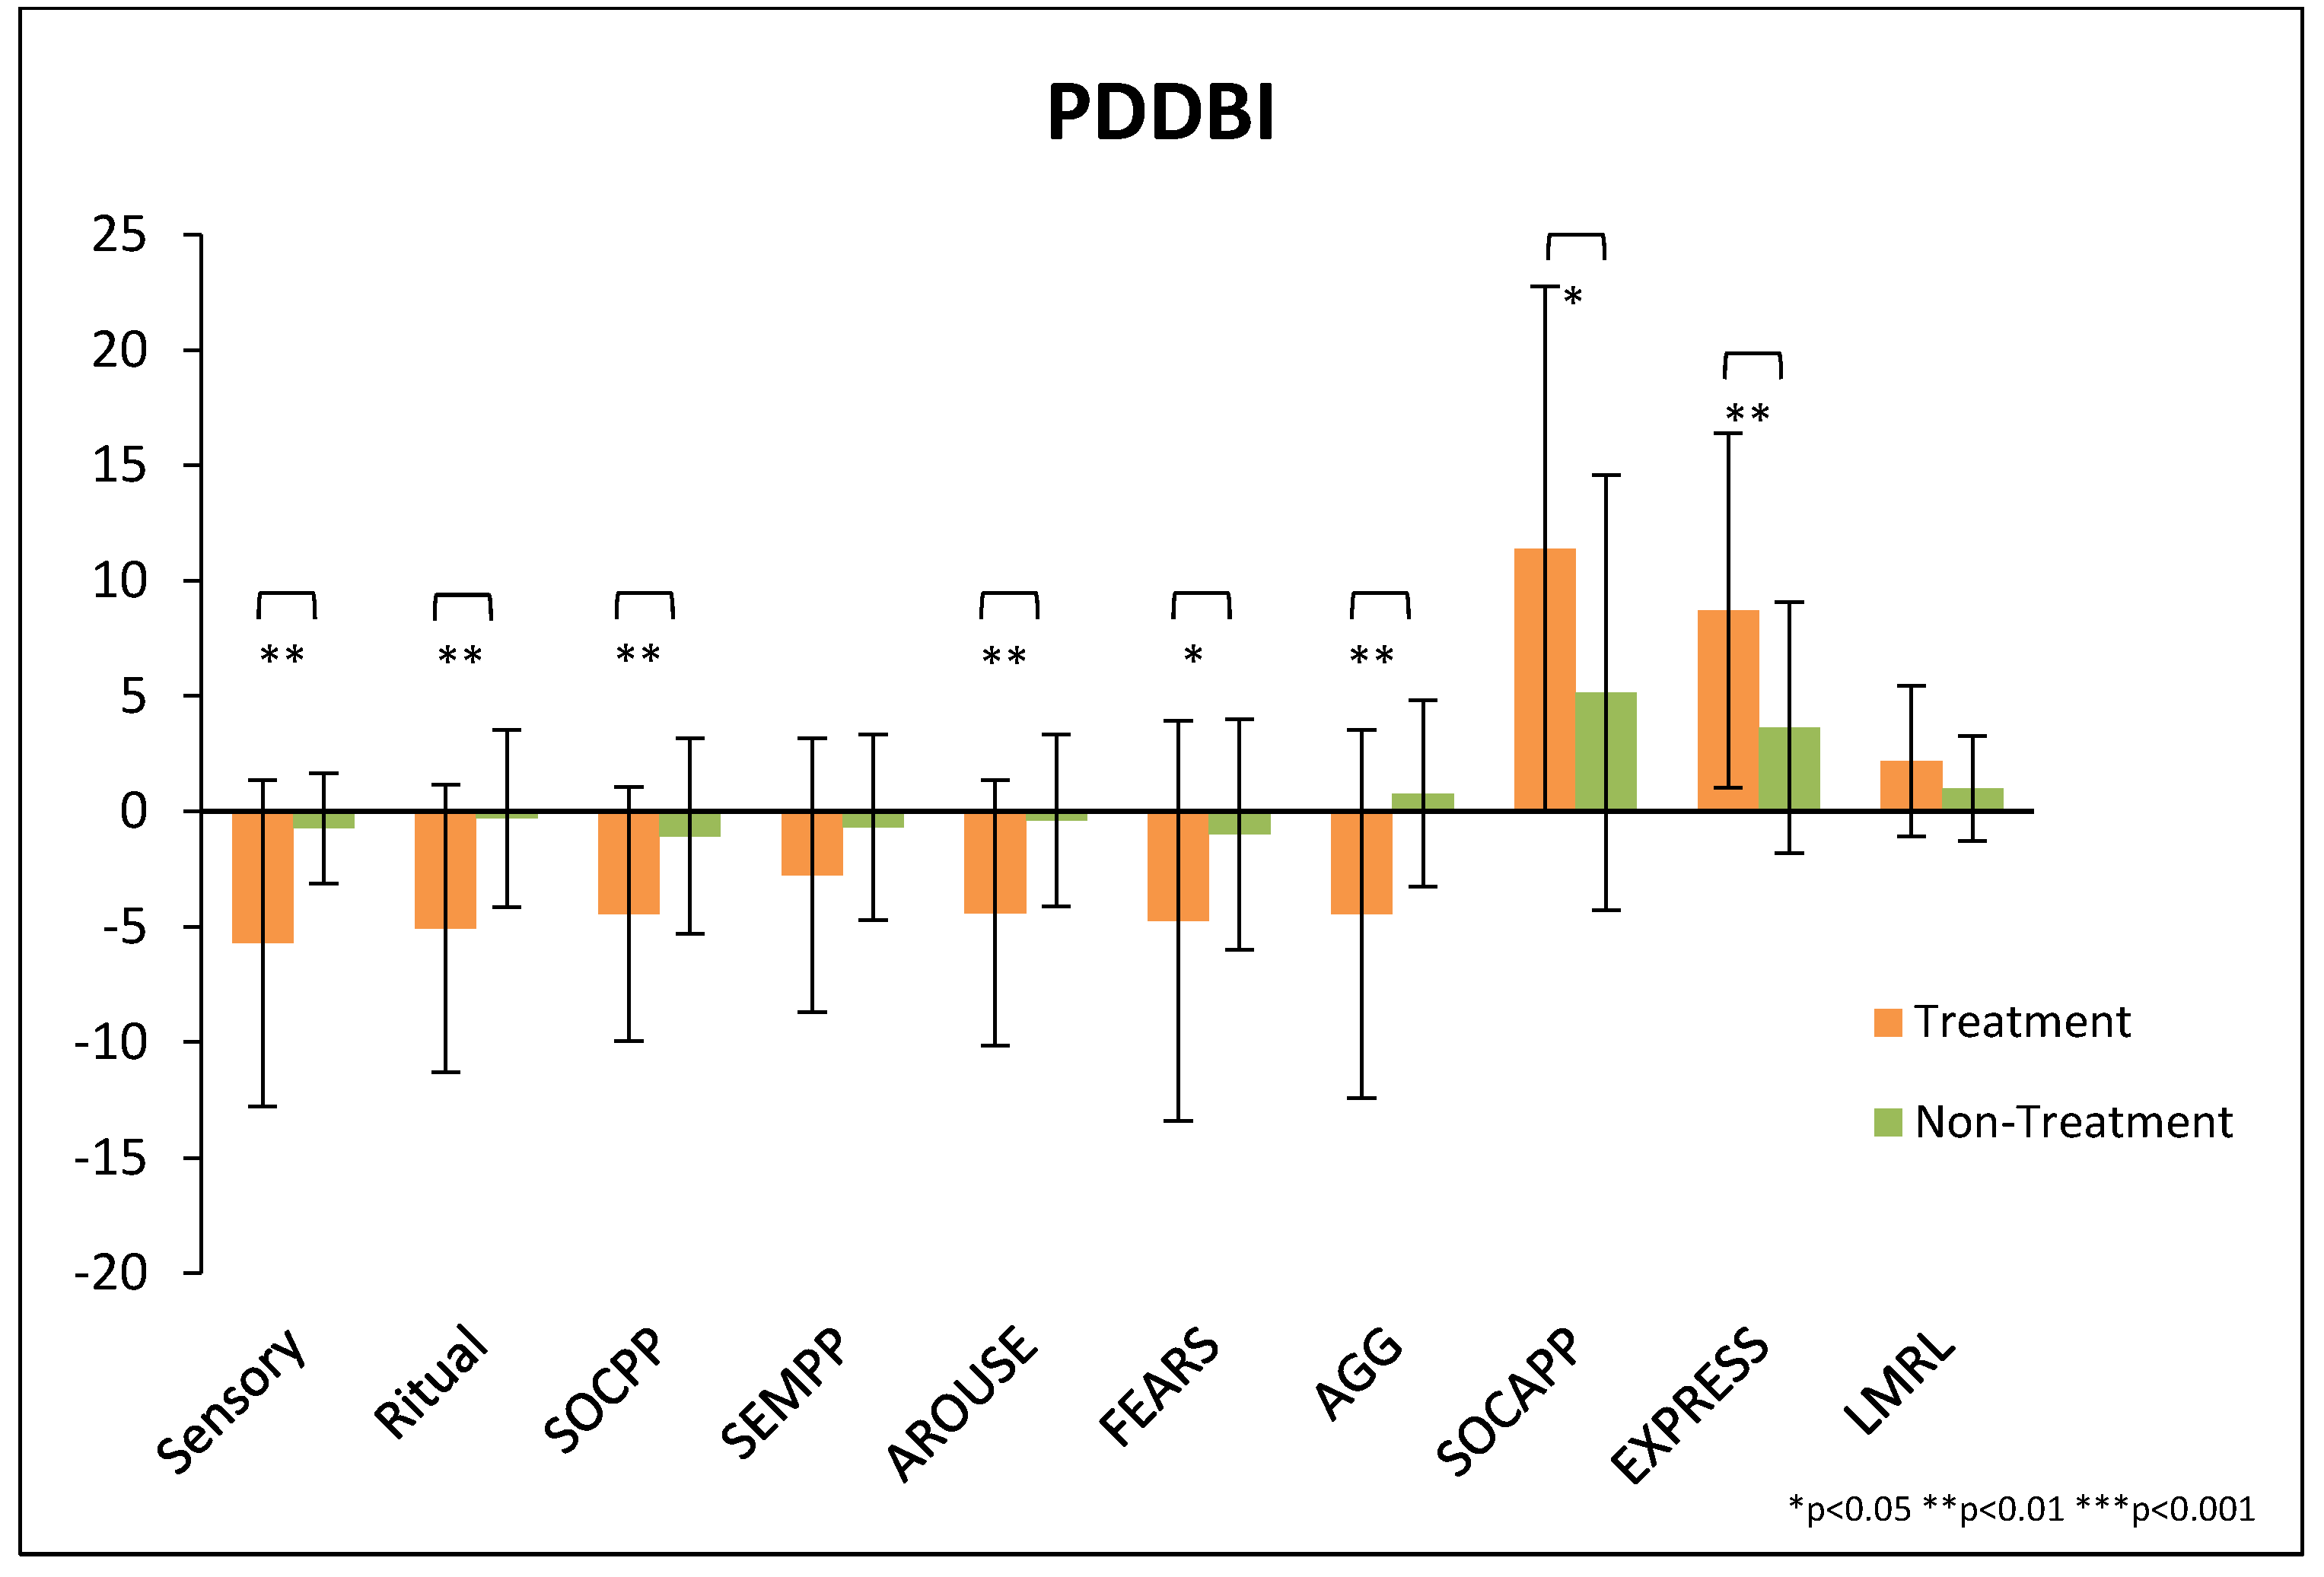
| Sensory | 24.4 | 14.1 | 18.7 | 12.3 | −23% | 14.4 | 11.0 | 13.7 | 11.2 | −5% | 0.001 |
| Ritual | 18.9 | 7.2 | 13.9 | 7.6 | −27% | 15.4 | 7.8 | 15.1 | 8.1 | −2% | 0.001 |
| SOCPP | 20.6 | 7.8 | 16.1 | 8.2 | −22% | 17.3 | 6.7 | 16.3 | 6.6 | −6% | 0.008 |
| SEMPP | 20.1 | 7.8 | 17.3 | 7.7 | −14% | 15.2 | 6.8 | 14.5 | 6.5 | −5% | 0.08 |
| AROUSE | 20.7 | 7.2 | 16.3 | 7.8 | −21% | 17.4 | 7.2 | 17.0 | 7.2 | −2% | 0.002 |
| FEARS | 23.4 | 9.0 | 18.7 | 9.4 | −20% | 24.4 | 8.1 | 23.4 | 8.8 | −4% | 0.03 |
| AGG | 18.6 | 12.4 | 14.2 | 11.0 | −24% | 14.0 | 11.0 | 14.8 | 11.2 | 5% | 0.002 |
| Adaptive Behaviors—higher scores mean higher ability | |||||||||||
| SOCAPP | 62.8 | 22.2 | 74.2 | 23.3 | +18% | 68.2 | 20.1 | 73.3 | 17.3 | +8% | 0.02 |
| EXPRESS | 57.4 | 24.7 | 66.1 | 24.2 | +15% | 66.8 | 24.3 | 70.5 | 21.0 | +5% | 0.004 |
| LMRL | 27.4 | 8.9 | 29.6 | 8.6 | +8% | 27.1 | 8.6 | 28.1 | 7.9 | +4% | 0.07 |
| Modified Autism Composite | −56.3 | 57.7 | −91.6 | 60.7 | −21% # | −85.2 | 53.0 | −96.0 | 50.2 | −5% # | 0.0002 |
| Treatment Group (n = 27) | Non-Treatment Group (n = 26) | t-Test | |||||||||
|---|---|---|---|---|---|---|---|---|---|---|---|
| Initial | S.D. | Final | S.D. | % Change | Initial | S.D. | Final | S.D. | % Change | ||
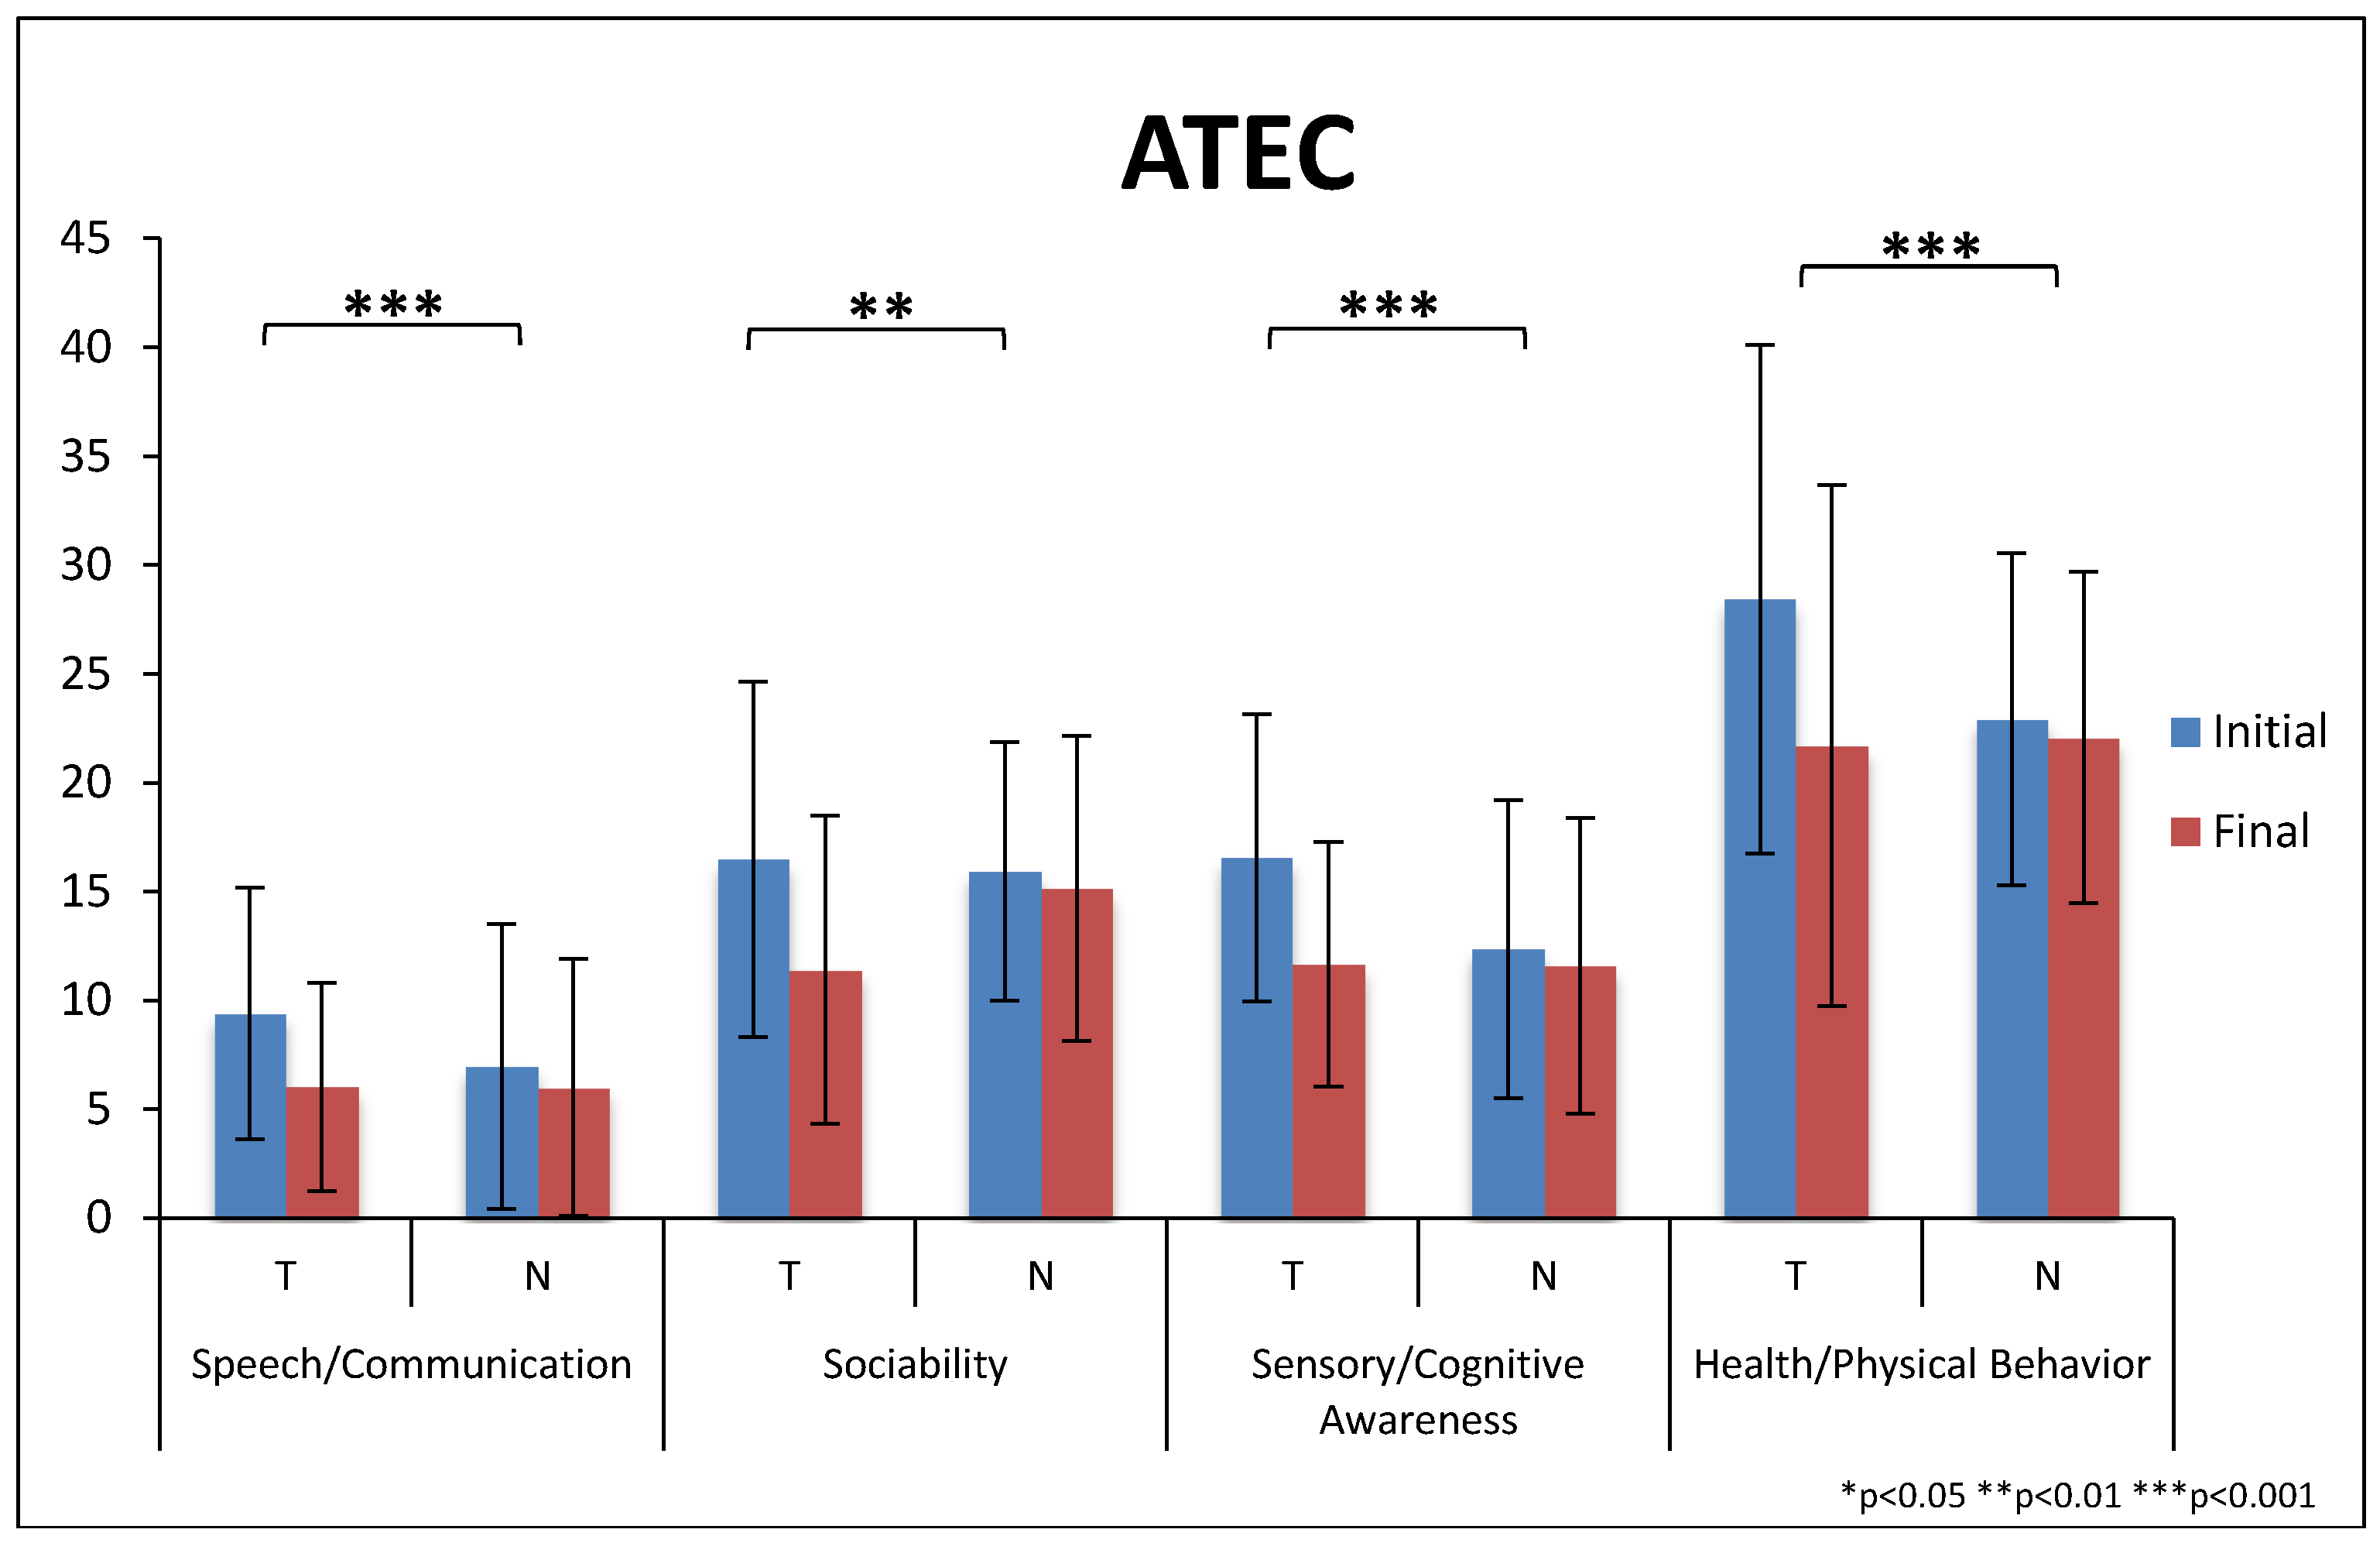
| Speech Communication | 9.4 | 5.8 | 6.0 | 4.8 | −36% | 7.0 | 6.5 | 6.0 | 5.9 | −14% | 0.0007 |
| Sociability | 16.5 | 8.2 | 11.4 | 7.1 | −31% | 15.9 | 5.9 | 15.2 | 7.0 | −5% | 0.003 |
| Sensory/Cognitive Awareness | 16.6 | 6.6 | 11.7 | 5.6 | −30% | 12.3 | 6.9 | 11.6 | 6.8 | −6% | 0.00002 |
| Health/Physical/Behavior | 28.4 | 11.7 | 21.7 | 12.0 | −24% | 22.9 | 7.6 | 22.1 | 7.6 | −4% | 0.0009 |
| Total ATEC Score | 70.9 | 25.7 | 50.8 | 24.2 | −28% | 58.2 | 20.7 | 54.8 | 22.7 | −6% | 0.00004 |
| Treatment Group (n = 27) | Non-Treatment Group (n = 25) | t-Test | |||||||||
|---|---|---|---|---|---|---|---|---|---|---|---|
| Initial | S.D. | Final | S.D. | % Change | Initial | S.D. | Final | S.D. | % Change | ||
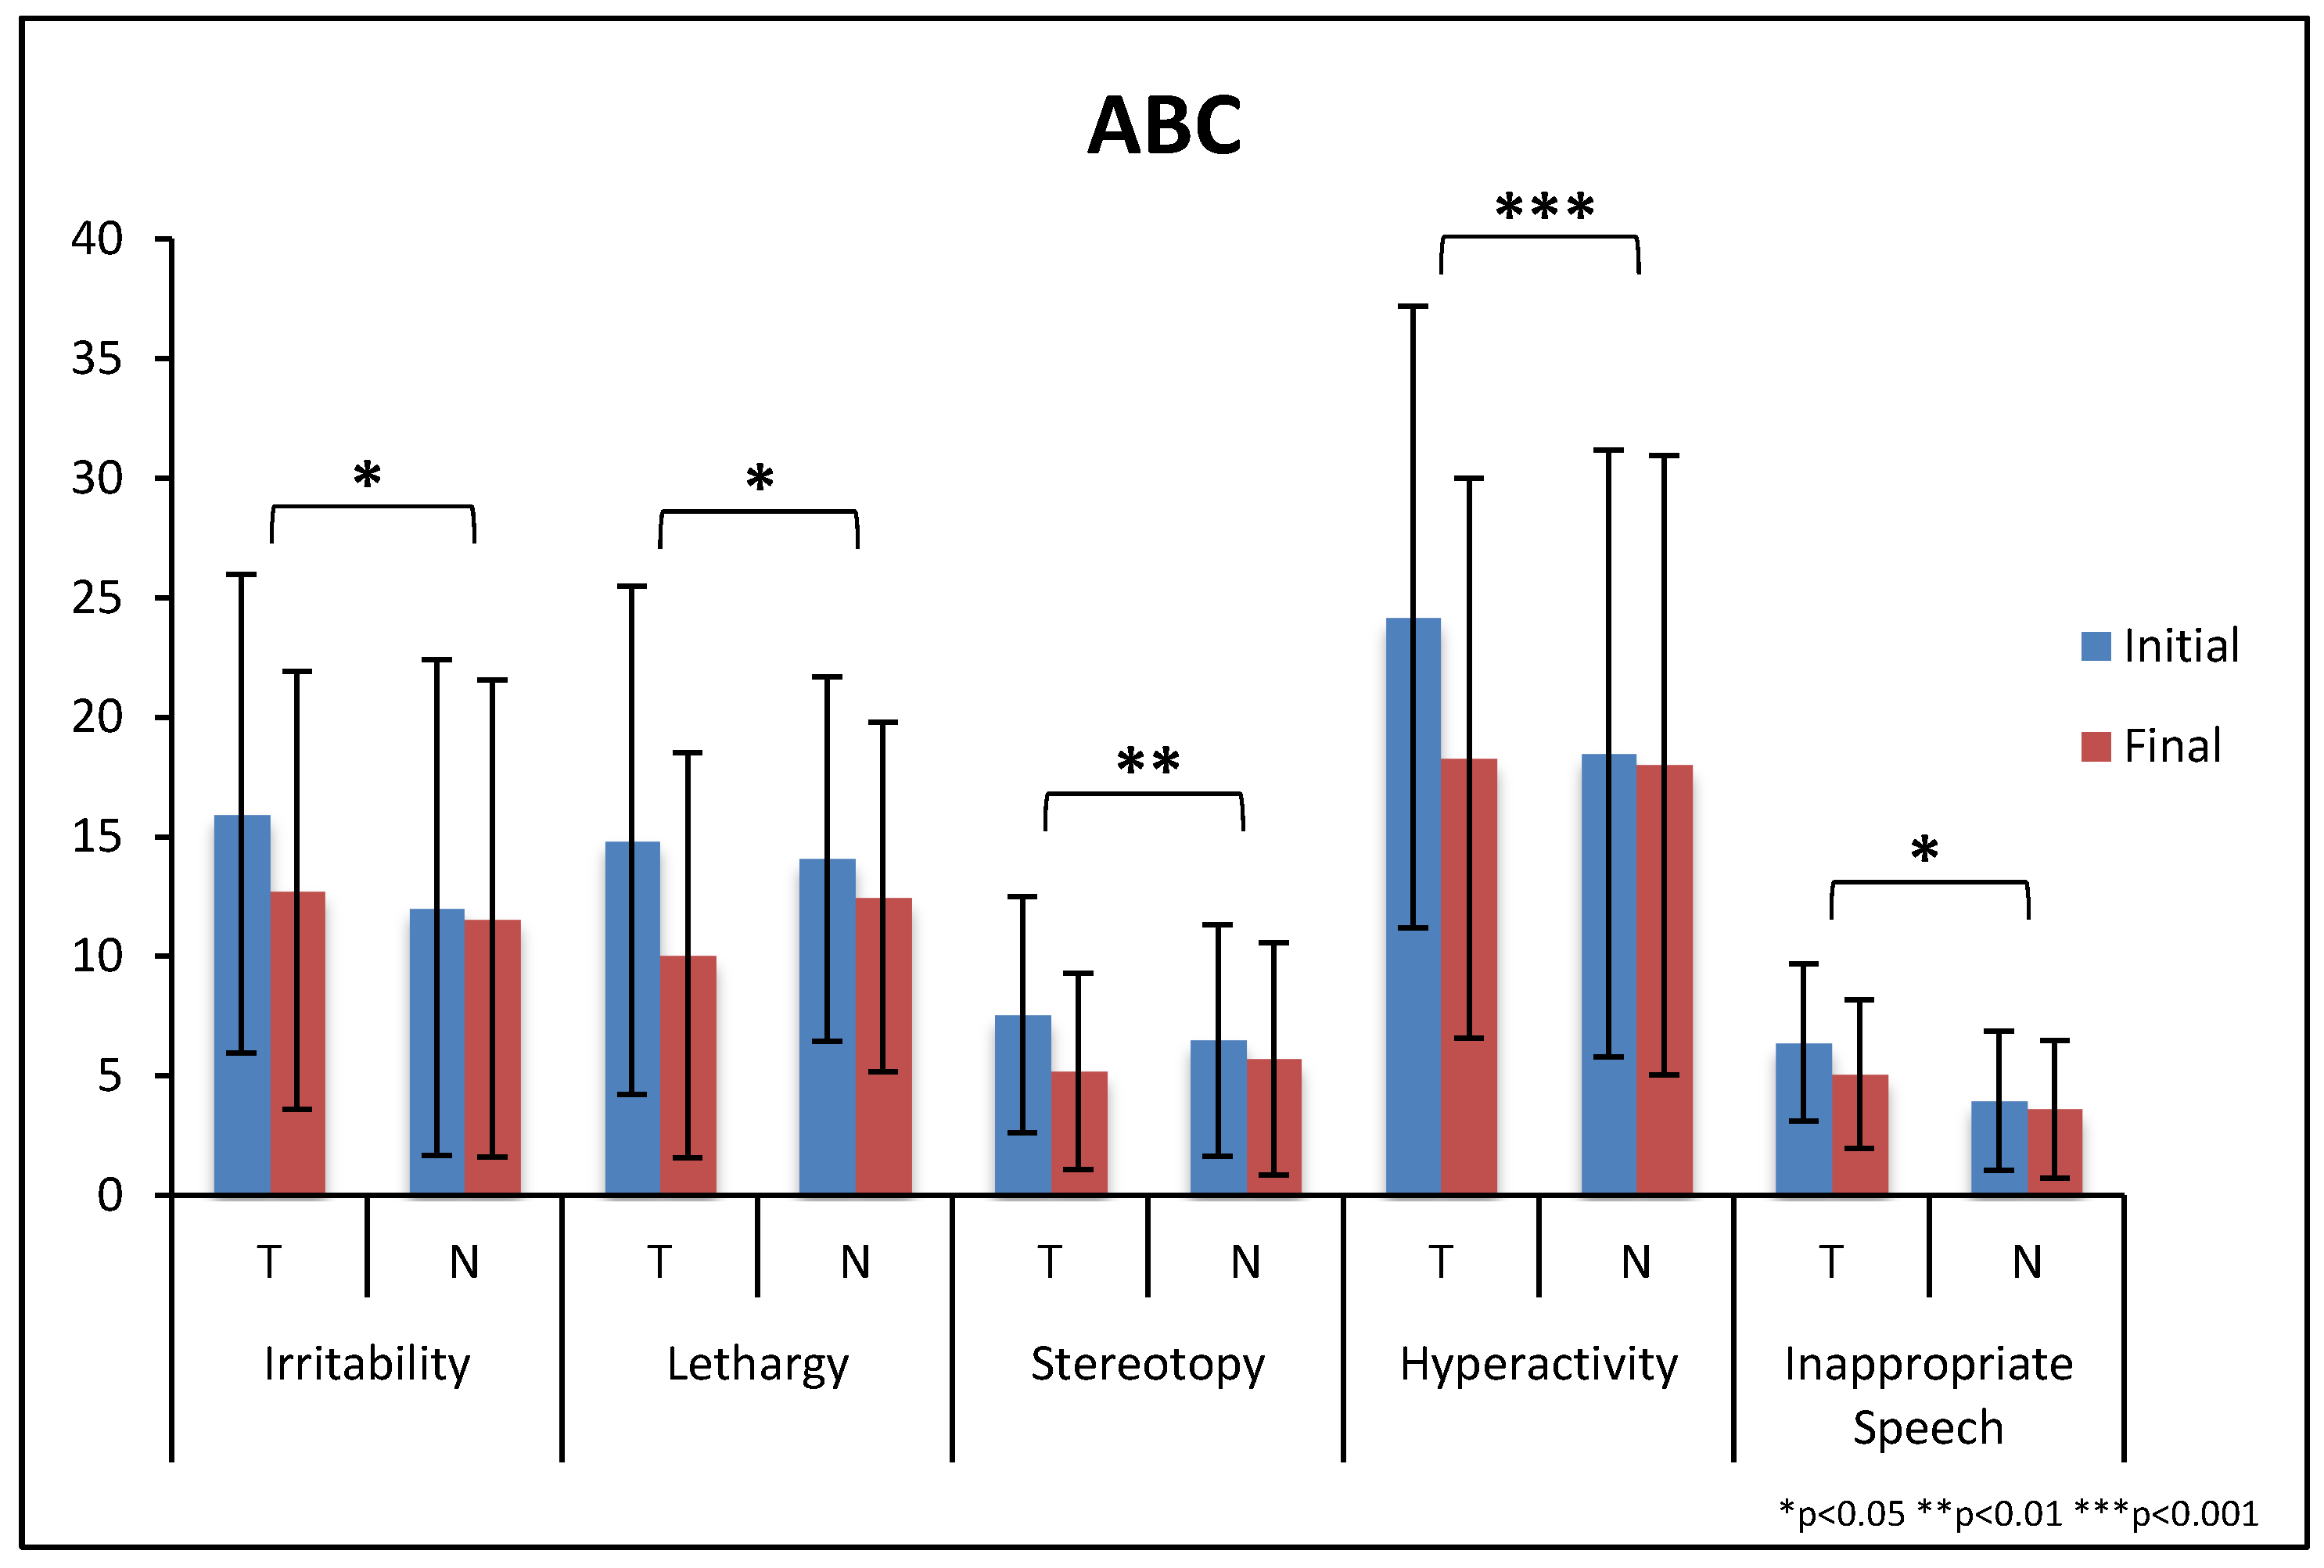
| Irritability | 16.0 | 10.0 | 12.8 | 9.2 | −20% | 12.0 | 10 | 11.6 | 10.0 | −4% | 0.02 |
| Lethargy/Social Withdrawal | 14.9 | 10.6 | 10.1 | 8.5 | −32% | 14.1 | 7.6 | 12.5 | 7.3 | −11% | 0.01 |
| Stereotypy | 7.6 | 4.9 | 5.2 | 4.1 | −31% | 6.5 | 4.8 | 5.7 | 4.9 | −12% | 0.01 |
| Hyperactivity | 24.2 | 13.0 | 18.3 | 11.7 | −24% | 18.5 | 13 | 18.0 | 12.9 | −3% | 0.0001 |
| Inappropriate Speech | 6.4 | 3.3 | 5.1 | 3.1 | −21% | 4.0 | 2.9 | 3.6 | 2.9 | −9% | 0.05 |
| Total ABC Score | 68.9 | 33.5 | 51.4 | 31.7 | −26% | 55.0 | 27 | 51.4 | 27.5 | −7% | 0.001 |
| Treatment Group (n = 27) | Non-Treatment Group (n = 25) | t-Test | |||||||||
|---|---|---|---|---|---|---|---|---|---|---|---|
| Initial | S.D. | Final | S.D. | % Change | Initial | S.D. | Final | S.D. | % Change | ||
| Awareness | 15.0 | 4.1 | 13.4 | 4.0 | −11% | 12.4 | 2.7 | 11.7 | 2.5 | −6% | n.s. |
| Cognition | 21.4 | 6.4 | 18.6 | 7.4 | −13% | 18.8 | 4.1 | 18.3 | 4.5 | −3% | 0.01 |
| Communication | 38.8 | 11.6 | 33.2 | 12.4 | −14% | 34.5 | 6.8 | 33.3 | 8.0 | −4% | 0.01 |
| Motivation | 17.3 | 6.1 | 14.5 | 6.1 | −16% | 17.6 | 4.7 | 16.8 | 4.7 | −5% | 0.03 |
| Mannerisms | 23.3 | 6.1 | 20.0 | 7.0 | −14% | 20.7 | 6.4 | 20.6 | 6.8 | 0% | 0.02 |
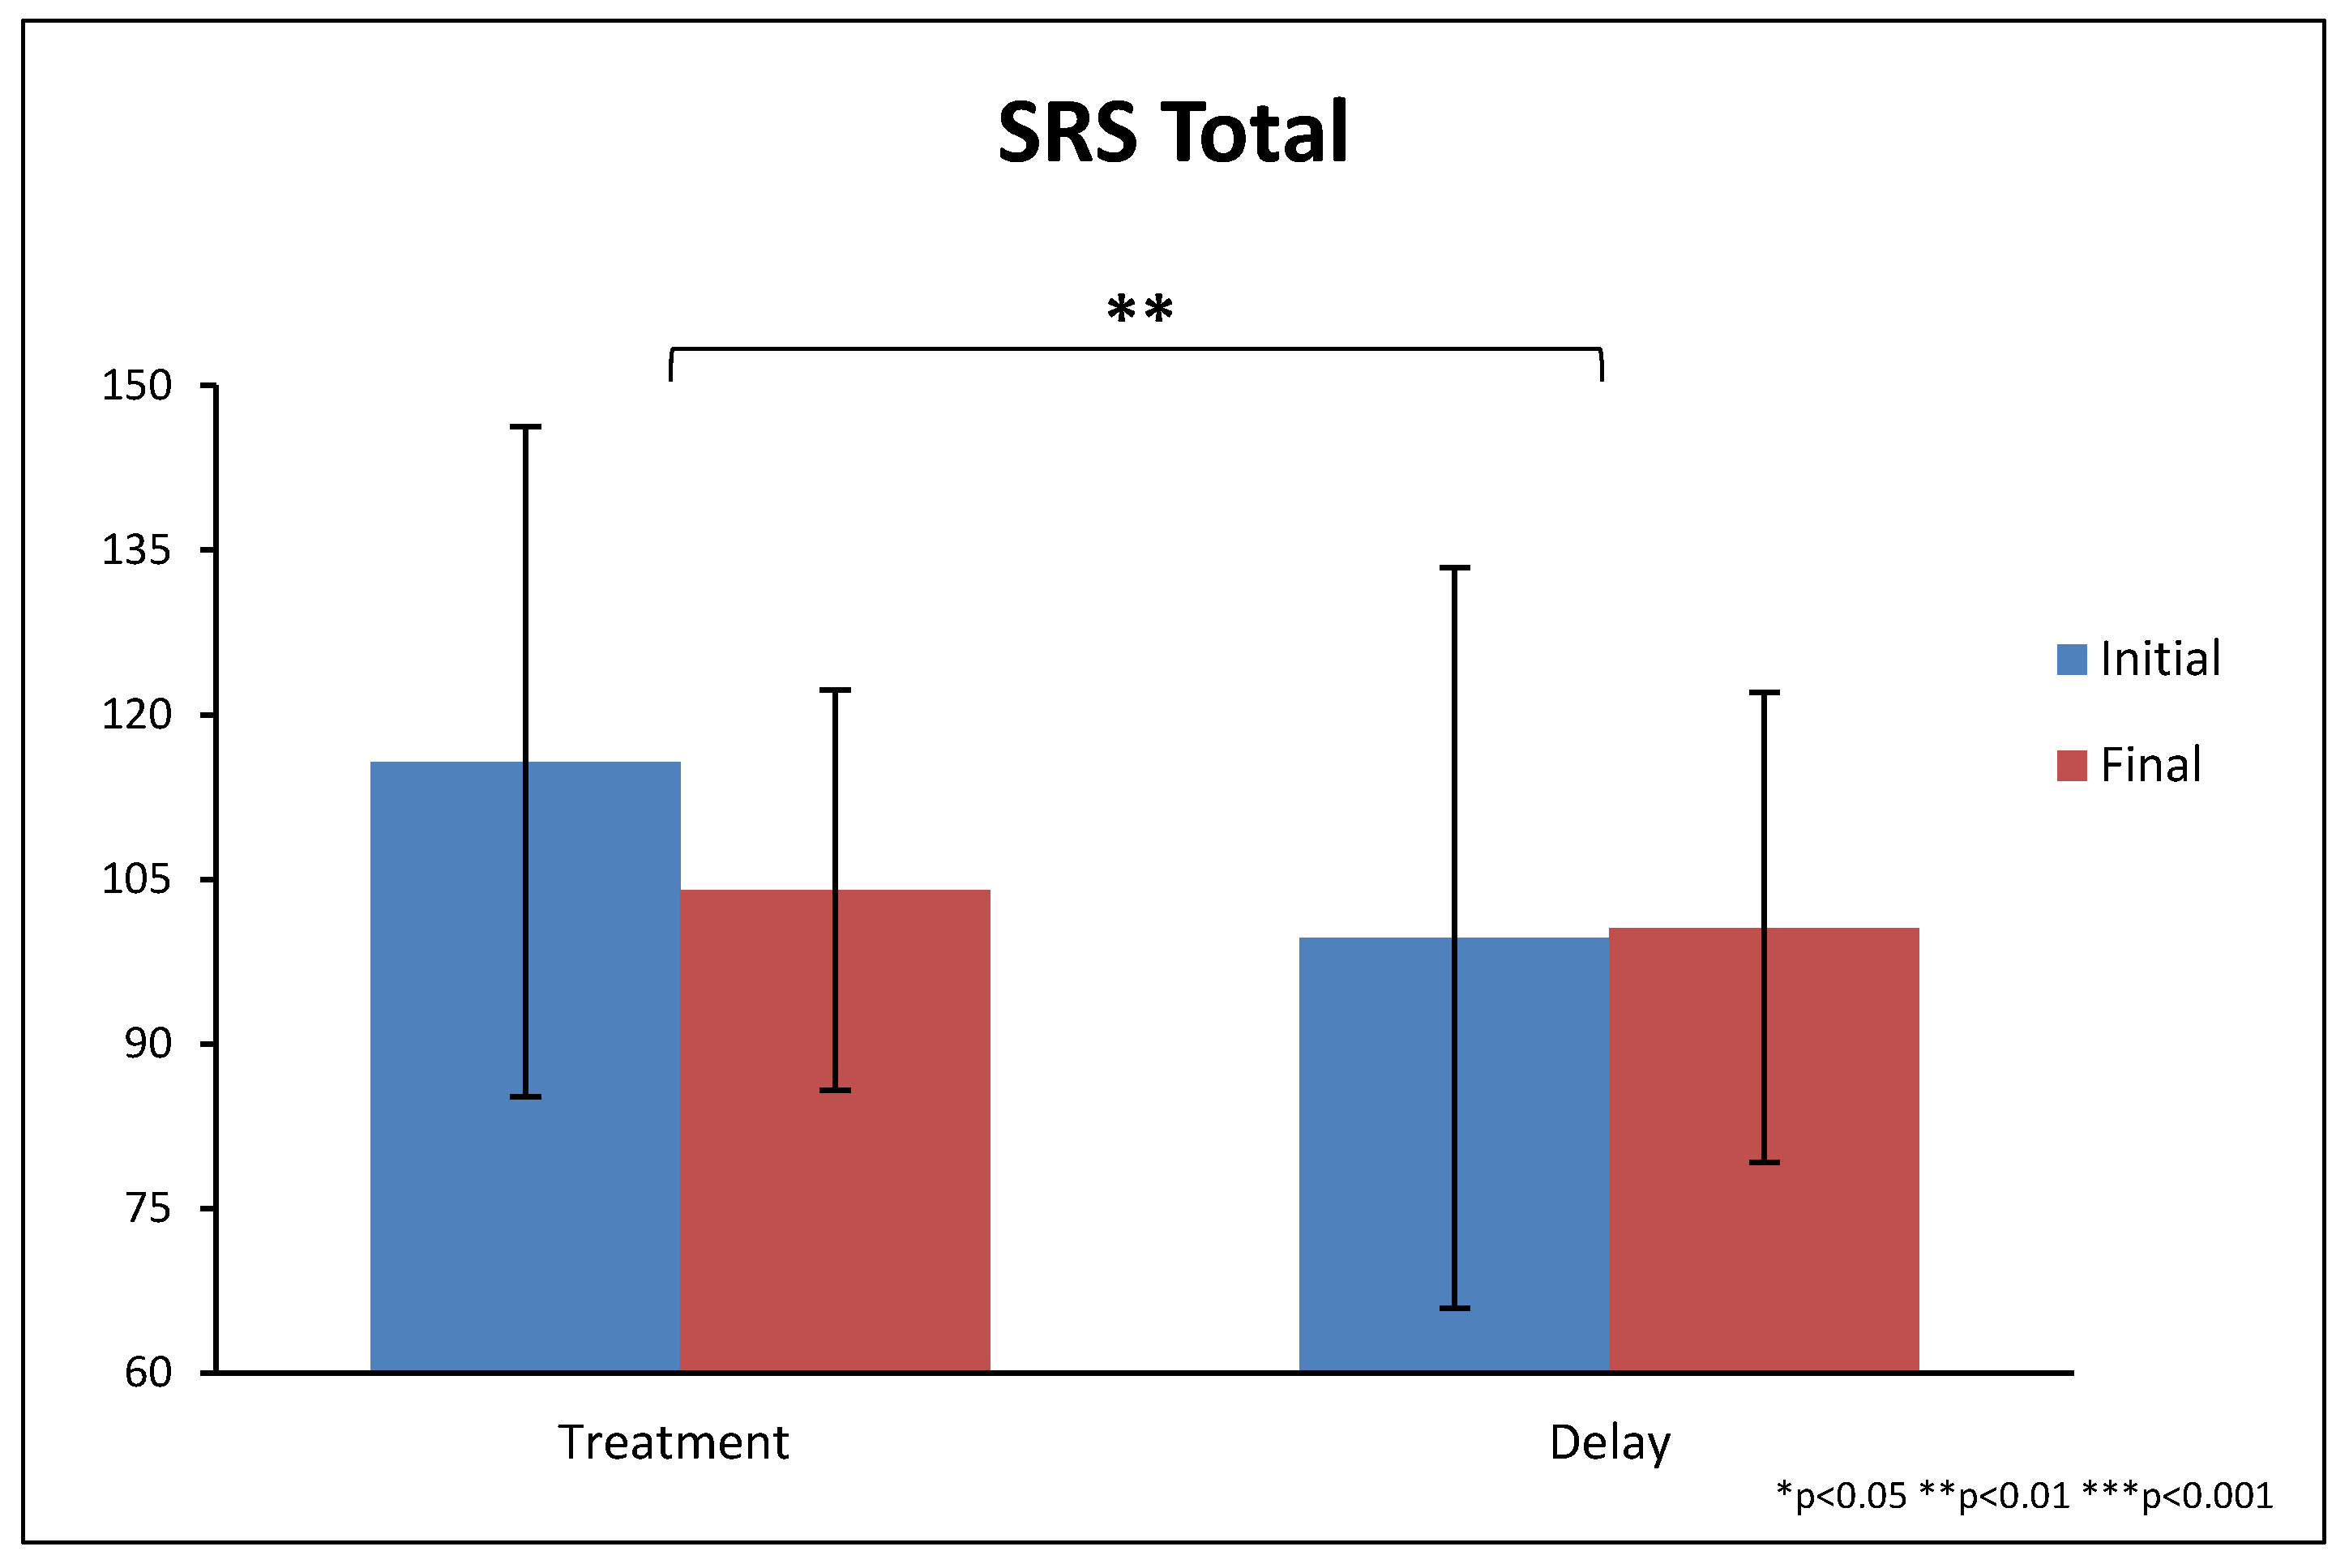
| Total SRS | 115.7 | 30.6 | 99.7 | 33.7 | −14% | 104.0 | 18.2 | 100.6 | 21.4 | −3% | 0.01 |
| Treatment Group (n = 27) | Non-Treatment Group (n = 26) | t-Test | |||||||||
|---|---|---|---|---|---|---|---|---|---|---|---|
| Initial | S.D. | Final | S.D. | % Change | Initial | S.D. | Final | S.D. | % Change | ||
| Tactile Sensitivity | 22.7 | 5.9 | 26.4 | 5.2 | +16% | 24.1 | 4.9 | 25.2 | 5.1 | +4% | 0.007 |
| Taste/Smell Sensitivity | 10.5 | 6.0 | 11.8 | 5.3 | +12% | 11.1 | 5.4 | 11.5 | 5.5 | +3% | 0.05 |
| Movement Sensitivity | 11.2 | 4.4 | 11.7 | 4.0 | +4% | 10.8 | 3.5 | 10.6 | 3.3 | −1% | 0.06 |
| Underresponsiveness/Seeks Sensation | 17.9 | 6.9 | 20.5 | 5.5 | +14% | 22.0 | 7.1 | 22.3 | 7.3 | +2% | 0.006 |
| Auditory Filtering | 16.2 | 4.7 | 18.9 | 5.1 | +16% | 16.2 | 5.5 | 16.0 | 5.3 | −1% | 0.0003 |
| Low Energy/Weak | 19.3 | 7.5 | 20.4 | 7.3 | +6% | 17.5 | 7.1 | 17.9 | 7.4 | +2% | n.s. |
| Visual/Auditory Sensitivity | 14.9 | 4.8 | 16.9 | 4.5 | +13% | 16.0 | 4.1 | 16.0 | 4.2 | 0% | 0.004 |
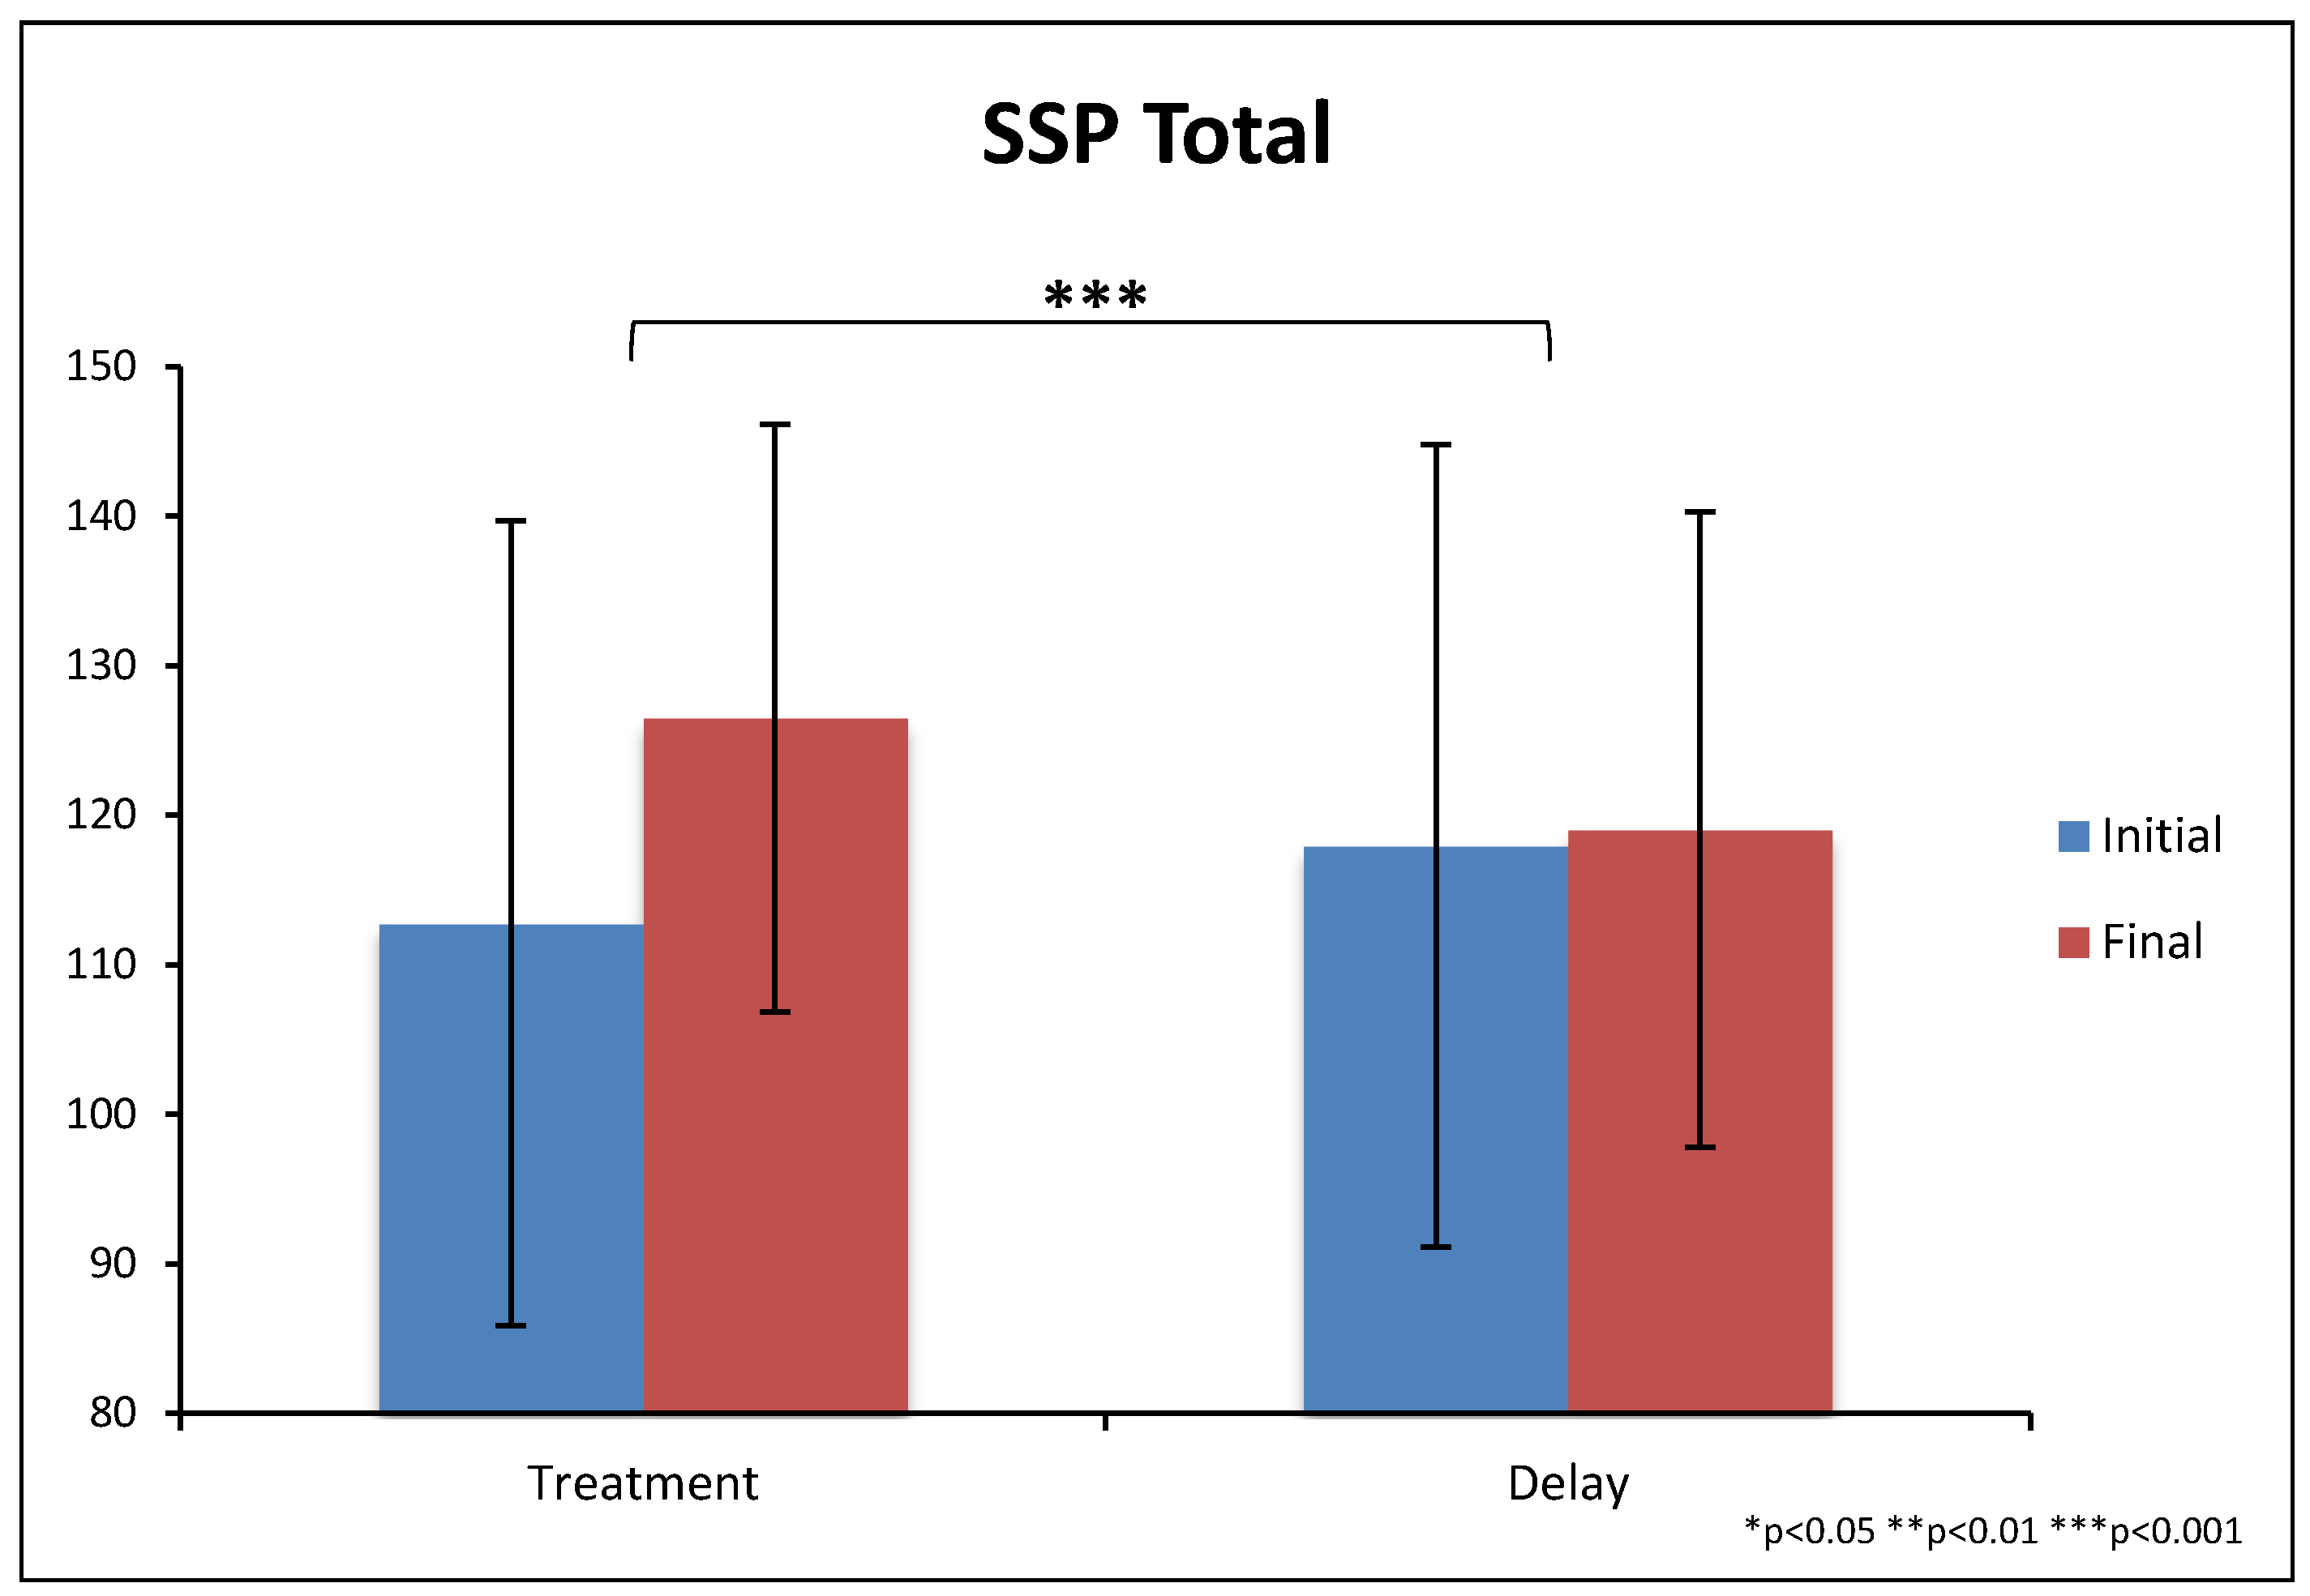
| Total SSP | 113 | 27 | 127 | 27 | +12% | 118 | 20 | 120 | 21 | +2% | 0.0003 |
| Treatment n = 28 | Non-Treatment n = 26 | t-Test | |||||
|---|---|---|---|---|---|---|---|
| n for Each Symptom at Start of Study | Change | S.D. | n for Each Symptom at Start of Study | Change | S.D. | ||
| Expressive Language/Speech | 27 | 1.7 | 0.8 | 25 | 0.3 | 0.9 | 0.0000006 |
| Receptive Language/Comprehension | 26 | 1.9 | 0.9 | 26 | 0.3 | 0.7 | 0.000000003 |
| Play Skills | 27 | 1.5 | 0.8 | 24 | 0.3 | 0.8 | 0.0000008 |
| Cognition Thinking | 28 | 1.6 | 0.9 | 24 | 0.4 | 0.7 | 0.000003 |
| Attention Focus | 28 | 1.5 | 1.1 | 25 | 0.3 | 0.9 | 0.00006 |
| Stools/GI Issues | 24 | 0.9 | 1.5 | 19 | −0.1 | 0.6 | 0.003 |
| Sleep | 22 | 0.9 | 1.2 | 16 | −0.2 | 1.2 | 0.01 |
| Sociability | 28 | 1.4 | 1.0 | 25 | 0.1 | 0.8 | 0.000009 |
| Hyperactivity | 23 | 0.9 | 1.0 | 16 | −0.3 | 0.6 | 0.00008 |
| Tantruming | 23 | 1.2 | 1.3 | 19 | −0.1 | 1.3 | 0.003 |
| Eye Contact | 27 | 1.4 | 0.9 | 25 | 0.2 | 0.8 | 0.000003 |
| Mood/Happines | 24 | 1.6 | 1.0 | 23 | 0.1 | 0.9 | 0.000003 |
| Anxiety | 27 | 0.9 | 1.3 | 25 | −0.2 | 1.0 | 0.002 |
| Stimming/Preservation | 28 | 1.1 | 1.0 | 22 | −0.1 | 0.8 | 0.00001 |
| Sound Sensitivity | 26 | 1.0 | 1.0 | 23 | 0.1 | 0.5 | 0.0002 |
| Aggression | 21 | 0.9 | 1.2 | 16 | −0.3 | 1.3 | 0.01 |
| Self-Abusive | 16 | 0.8 | 1.4 | 12 | −0.2 | 1.5 | 0.089 |
| Overall | 28 | 1.68 | 0.77 | 26 | 0.27 | 0.92 | 0.0000002 |
| Average | 28 | 1.2 | 0.7 | 27 | 0.1 | 0.5 | 0.00000003 |
| Treatment Group (n = 22) | Non-Treatment Group (n = 20) | t-Test | |||||||||
|---|---|---|---|---|---|---|---|---|---|---|---|
| Initial | S.D. | Final | S.D. | % Change | Initial | S.D. | Final | S.D. | % Change | ||
| Constipation | 0.6 | 0.8 | 0.4 | 0.5 | −43% | 1.1 | 0.8 | 1.0 | 0.7 | −14% | n.s. |
| Diarrhea | 0.3 | 0.6 | 0.1 | 0.3 | −67% | 0.1 | 0.2 | 0.0 | 0.0 | −100% | n.s. |
| Average Stool Consistency | 0.4 | 0.5 | 0.3 | 0.5 | −13% | 0.3 | 0.5 | 0.2 | 0.4 | −50% | n.s. |
| Stool Smell | 0.7 | 0.8 | 0.4 | 0.6 | −44% | 0.8 | 0.9 | 0.9 | 1.0 | +20% | 0.020 |
| Flatulence | 1.0 | 0.8 | 0.9 | 0.8 | −13% | 1.1 | 0.8 | 1.0 | 0.9 | −10% | n.s. |
| Abdominal Pain | 0.3 | 0.6 | 0.3 | 0.6 | −14% | 0.4 | 0.5 | 0.4 | 0.6 | −13% | n.s. |
| Total Severity Score | 3.4 | 1.8 | 2.4 | 1.8 | −30% | 3.7 | 1.8 | 3.3 | 2.2 | −10% | 0.050 |
| Treatment Group (n = 28) | Non-Treatment Group (n = 25) | t-Test | |||||||||
|---|---|---|---|---|---|---|---|---|---|---|---|
| Initial | S.D. | Final | S.D. | % Change | Initial | S.D. | Final | S.D. | % Change | ||
| Handgrip Strength | 40.3 | 26.6 | 41.8 | 21.5 | +4% | 44.8 | 24.9 | 46.7 | 22.5 | +4% | n.s. |
| Treatment Group (n = 25) | Non-Treatment Group (n = 21) | t-Test | |||||||||
|---|---|---|---|---|---|---|---|---|---|---|---|
| Initial | S.D. | Final | S.D. | % Change | Initial | S.D. | Final | S.D. | % Change | ||
| WBC (×103/uL) | 6.86 | 2.02 | 6.88 | 2.41 | 0% | 6.08 | 1.57 | 5.79 | 1.57 | −5% | n.s. |
| RBC (×106/uL) | 4.98 | 0.50 | 4.89 | 0.52 | −2% | 4.92 | 0.31 | 4.93 | 0.28 | 0% | 0.04 |
| Hemogoblin (g/dL) | 14.2 | 1.44 | 14.1 | 1.55 | −1% | 14.1 | 1.12 | 14.2 | 1.10 | +1% | n.s. |
| Hematocrit (%) | 41.4 | 3.91 | 41.2 | 4.26 | −1% | 41.3 | 2.92 | 41.4 | 2.73 | 0% | n.s. |
| MCV (fL) | 83.4 | 5.70 | 84.4 | 5.96 | +1% | 84.0 | 2.78 | 84.0 | 2.94 | 0% | 0.02 |
| MCH (pg) | 28.5 | 2.09 | 28.8 | 2.23 | +1% | 28.6 | 1.33 | 28.7 | 1.33 | 0% | n.s. |
| MCHC (g/dL) | 34.2 | 0.71 | 34.1 | 0.76 | −0% | 34.1 | 0.81 | 34.2 | 0.96 | 0% | n.s. |
| RDW (%) | 13.7 | 0.68 | 13.5 | 0.71 | −1% | 13.6 | 0.77 | 13.5 | 0.69 | −1% | n.s. |
| Platelets (×103/uL) | 319 | 75.5 | 311 | 87.3 | −3% | 285 | 59.7 | 296 | 72.9 | 4% | n.s. |
| Neutrophils (Absolute) (×103/uL) | 3.34 | 1.46 | 3.58 | 1.88 | +7% | 2.86 | 1.05 | 2.70 | 0.93 | −6% | n.s. |
| Lymphs (Absolute) (×103/uL) | 2.65 | 0.94 | 2.47 | 1.03 | −7% | 2.46 | 0.93 | 2.40 | 0.85 | −3% | n.s. |
| Monocytes (Absolute) (×103/uL) | 0.56 | 0.16 | 0.58 | 0.19 | +4% | 0.50 | 0.16 | 0.45 | 0.14 | −11% | 0.08 |
| Eos (Absolute) (×103/uL) | 0.27 | 0.30 | 0.21 | 0.21 | −24% | 0.24 | 0.17 | 0.21 | 0.16 | −12% | n.s. |
| Baso (Absolute) (×103/uL) | 0.04 | 0.05 | 0.02 | 0.04 | −33% | 0.01 | 0.04 | 0.01 | 0.04 | 0% | n.s. |
| Immature Granulocytes (%) | 0.00 | 0.00 | 0.00 | 0.00 | 0.00 | 0.00 | 0.00 | 0.00 | |||
| Immature Grans (Absolute) (×103/uL) | 0.00 | 0.00 | 0.00 | 0.00 | 0.00 | 0.00 | 0.00 | 0.00 | |||
| Treatment Group (n = 25) | Non-Treatment Group (n = 21) | t-Test | |||||||||
|---|---|---|---|---|---|---|---|---|---|---|---|
| Initial | S.D. | Final | S.D. | % Change | Initial | S.D. | Final | S.D. | % Change | ||
| Glucose, Serum (mg/dL) | 87.6 | 5.63 | 90.0 | 8.98 | +3% | 92.7 | 28.1 | 95.6 | 21.9 | +3% | n.s. |
| BUN (mg/dL) | 13.5 | 3.77 | 11.3 | 3.77 | −16% | 13.3 | 3.29 | 14.0 | 3.56 | +5% | 0.01 |
| Creatinine, Serum (mg/dL) | 0.61 | 0.22 | 0.62 | 0.21 | 0% | 0.61 | 0.18 | 0.65 | 0.21 | +6% | n.s. |
| BUN/Creatinine Ratio | 25.0 | 11.8 | 20.3 | 8.53 | −19% | 23.4 | 9.83 | 24.0 | 12.1 | +3% | 0.04 |
| Sodium, Serum (mmol/L) | 139 | 2.39 | 140 | 2.64 | +1% | 139 | 4.04 | 139 | 2.19 | 0% | n.s. |
| Potassium, Serum (mmol/L) | 4.28 | 0.28 | 4.01 | 0.25 | −6% | 4.09 | 0.32 | 4.05 | 0.30 | −1% | 0.02 |
| Chloride, Serum (mmol/L) | 101 | 2.60 | 101 | 2.64 | 0% | 102 | 2.75 | 103 | 2.68 | +1% | n.s. |
| Carbon Dioxide, Serum (mmol/L) | 19.7 | 2.04 | 20.7 | 2.36 | +5% | 20.5 | 1.82 | 20.4 | 2.72 | −0% | n.s. |
| Calcium, Serum (mmol/L) | 10.1 | 0.43 | 9.96 | 0.41 | −2% | 10.1 | 0.49 | 9.8 | 0.62 | −4% | n.s. |
| Protein, Total, Serum (g/dL) | 7.07 | 0.47 | 7.22 | 0.49 | +2% | 7.04 | 0.47 | 7.08 | 0.51 | +1% | n.s. |
| Albunim spp., Serum (g/dL) | 4.49 | 0.40 | 4.58 | 0.31 | +2% | 4.33 | 0.38 | 4.54 | 0.21 | +5% | n.s. |
| Globulin, Total (g/dL) | 2.58 | 0.36 | 2.64 | 0.37 | +2% | 2.71 | 0.58 | 2.55 | 0.41 | −6% | 0.02 |
| A/G Ratio | 1.78 | 0.33 | 1.77 | 0.27 | −1% | 1.70 | 0.47 | 1.83 | 0.28 | +7% | n.s. |
| Bilirubin, Total (mg/dL) | 0.36 | 0.23 | 0.46 | 0.35 | +29% | 0.34 | 0.12 | 0.34 | 0.12 | 0% | 0.08 |
| Alkaline Phosphatase, S (IU/L) | 204 | 90.0 | 184 | 87.1 | −10% | 221 | 111 | 200 | 92.2 | −9% | n.s. |
| AST (SGOT) (IU/L) | 26.2 | 6.74 | 28.4 | 12.8 | +8% | 24.7 | 6.38 | 23.4 | 7.43 | −6% | n.s. |
| ALT (SGPT) (IU/L) | 22.1 | 10.5 | 26.1 | 21.2 | +18% | 18.9 | 9.58 | 20.5 | 11.9 | +9% | n.s. |
| Ammonia, Plasma (ug/dL) | 79.3 | 39.57 | 76.70 | 26.06 | −3% | 64.1 | 29.5 | 76.0 | 23.4 | +19% | n.s. |
| Creatine Kinase, Total, Serum (U/L) | 117 | 49.7 | 111 | 55.0 | −6% | 102 | 38.3 | 113 | 56.3 | +11% | n.s. |
| Lactic Acid, Plasma (mg/dL) | 16.9 | 10.1 | 16.7 | 12.5 | −1% | 13.0 | 6.22 | 13.3 | 11.4 | +2% | n.s. |
| TSH (uIU/mL) | 2.30 | 0.99 | 2.55 | 1.30 | +11% | 2.11 | 1.07 | 2.16 | 0.94 | +2% | n.s. |
| Triiodothyronine, Free, Serum (pg/mL) | 4.07 | 0.50 | 4.12 | 0.66 | +1% | 3.95 | 0.58 | 4.05 | 0.63 | +3% | n.s. |
| T4, Free (Direct) (ng/dL) | 1.33 | 0.15 | 1.32 | 0.14 | −1% | 1.27 | 0.19 | 1.21 | 0.20 | −5% | n.s. |
| Average—Treatment (n = 25) | Average—Non-Treatment (n = 24) | t-Test | |||||||||
|---|---|---|---|---|---|---|---|---|---|---|---|
| Initial | SD | Final | SD | % Change | Initial | SD | Final | SD | % Change | ||
| Arachidonic Acid (μmol/L) | 910 | 89 | 727 | 99 | −20% | 911 | 66 | 899 | 99 | −1% | 0.0000001 |
| Dihomo-g-linolenic (μmol/L) | 95 | 22 | 84 | 16 | −12% | 95 | 22 | 97 | 17 | +2% | 0.003 |
| Docosahexaenoic acid (μmol/L) | 175 | 58 | 320 | 78 | +83% | 183 | 54 | 207 | 54 | +13% | 0.000000001 |
| Eicosapentaenoic (μmol/L) | 21 | 13 | 130 | 60 | +525% | 17 | 7.4 | 20 | 8.0 | +22% | 0.000000001 |
| Elaidic (μmol/L) | 8.7 | 1.8 | 6.4 | 1.7 | −26% | 8.3 | 2.3 | 7.3 | 1.7 | −12% | 0.03 |
| Linoleic (μmol/L) | 670 | 93 | 568 | 90 | −15% | 622 | 98 | 617 | 77 | −1% | 0.0001 |
| Oleic (μmol/L) | 650 | 77 | 725 | 75 | +11% | 619 | 35 | 670 | 44 | +8% | n.s. |
| Palmitelaidic (μmol/L) | 0.92 | 0.23 | 0.76 | 0.17 | −17% | 0.89 | 0.23 | 0.74 | 0.20 | −17% | n.s. |
| Palmitic (μmol/L) | 1194 | 108 | 1197 | 75 | 0% | 1136 | 101 | 1153 | 65 | +1% | n.s. |
| Palmitoleic (μmol/L) | 10.9 | 3.9 | 9.6 | 4.4 | −13% | 11.2 | 4.2 | 12.4 | 5.4 | +11% | 0.01 |
| Stearic (μmol/L) | 885 | 82 | 833 | 40 | −6% | 872 | 55 | 862 | 55 | −1% | 0.08 |
| Average—Treatment (n = 27) | Average—Non-Treatment (n = 26) | t-Test | |||||||||
|---|---|---|---|---|---|---|---|---|---|---|---|
| Initial | S.D. | Final | S.D. | % Change | Initial | S.D. | Final | S.D. | % Change | ||
| Vit B2 (riboflavin) | 0.69 | 0.22 | 2.53 | 1.36 | +268% | 1.18 | 0.68 | 0.98 | 0.67 | −17% | 0.00000001 |
| Vit B3 (niacinamide) | 1.31 | 0.85 | 1.34 | 0.87 | +2% | 0.99 | 0.43 | 1.14 | 0.47 | +14% | n.s. |
| Vit B5 (pantothenic acid) | 1.01 | 1.28 | 4.54 | 3.21 | +351% | 0.86 | 0.65 | 1.63 | 1.34 | +90% | 0.0002 |
| Vit B6 (4-pyridoxic acid) | 1.21 | 1.30 | 6.45 | 3.85 | +435% | 1.21 | 1.29 | 1.29 | 1.07 | +6% | 0.000001 |
| Vit B6 (pyridoxine) | 1.21 | 0.55 | 1.51 | 0.73 | +25% | 1.26 | 0.75 | 0.85 | 0.42 | −33% | 0.008 |
| Folic acid | 0.65 | 0.61 | 1.42 | 1.07 | +119% | 1.10 | 1.25 | 0.73 | 1.86 | −34% | 0.02 |
| B12-(cyanocobalamin) | 0.86 | 0.49 | 1.24 | 0.54 | +44% | 0.94 | 0.41 | 0.90 | 0.26 | −5% | 0.006 |
| B12-(methylcobalamin) | 0.98 | 0.49 | 1.08 | 0.57 | +9% | 0.96 | 0.34 | 0.99 | 0.44 | +3% | n.s. |
| Vit C (ascorbic acid) | 0.79 | 0.32 | 1.18 | 0.56 | +48% | 0.81 | 0.49 | 1.01 | 0.50 | +24% | n.s. |
| Vit D3 | 1.03 | 0.63 | 1.12 | 0.44 | +9% | 0.85 | 0.29 | 1.00 | 0.37 | +18% | n.s. |
| Vit K2 | 0.97 | 0.55 | 1.22 | 0.47 | +26% | 0.83 | 0.54 | 1.09 | 0.44 | +32% | n.s. |
| Choline | 1.08 | 0.41 | 0.99 | 0.30 | −8% | 1.01 | 0.27 | 0.88 | 0.24 | −12% | n.s. |
| Myoinositol | 1.25 | 0.46 | 1.48 | 0.74 | +19% | 0.98 | 0.27 | 1.05 | 0.40 | +7% | n.s. |
| CoQ10 (oxidized) | 1.35 | 0.86 | 1.18 | 0.64 | −13% | 1.30 | 0.65 | 1.49 | 0.97 | +15% | n.s. |
| CoQ10 (reduced form, CoQ10H2) | 0.94 | 0.62 | 1.63 | 0.79 | +72% | 1.31 | 0.85 | 1.05 | 0.66 | −20% | 0.001 |
| Treatment Group (n = 26) | Non-Treatment Group (n = 24) | t-Test | |||||||||
|---|---|---|---|---|---|---|---|---|---|---|---|
| Initial | S.D. | Final | S.D. | % Change | Initial | S.D. | Final | S.D. | % Change | ||
| Ca (μg/g) | 18.0 | 4.0 | 17.0 | 3.0 | −5% | 17.0 | 4.0 | 17.0 | 5.0 | +3% | n.s. |
| Mg (μg/g) | 46.0 | 4.0 | 46.0 | 5.0 | 0% | 46.0 | 4.0 | 48.0 | 4.0 | +3% | n.s. |
| K (mEq/L) | 78.0 | 4.0 | 78.0 | 4.0 | 0% | 78.0 | 5.0 | 77.0 | 3.0 | −1% | n.s. |
| P (μg/g) | 599 | 36.0 | 580 | 43.0 | −3% | 597 | 50.0 | 581 | 44.0 | −3% | n.s. |
| Cu (μg/g) | 0.7 | 0.1 | 0.7 | 0.1 | +7% | 0.7 | 0.1 | 0.7 | 0.1 | +4% | n.s. |
| Zn (μg/g) | 9.6 | 1.5 | 9.6 | 1.5 | 0% | 9.5 | 1.1 | 9.5 | 1.2 | −1% | n.s. |
| Fe (μg/g) | 865 | 47.0 | 858 | 30.0 | −1% | 865 | 47.0 | 853 | 37.0 | −1% | n.s. |
| Mn (μg/g) | 0.02 | 0.01 | 0.02 | 0.01 | +2% | 0.02 | 0.01 | 0.02 | 0.01 | +5% | n.s. |
| Cr (μg/g) | 0.0005 | 0.0003 | 0.0006 | 0.0003 | +12% | 0.0005 | 0.0003 | 0.0004 | 0.0001 | −15% | 0.05 |
| Se (μg/g) | 0.3 | 0.03 | 0.3 | 0.04 | +5% | 0.3 | 0.04 | 0.2 | 0.03 | −8% | 0.001 |
| Treatment Group (n = 26) | Non-Treatment Group (n = 22) | t-Test | |||||||||
|---|---|---|---|---|---|---|---|---|---|---|---|
| Initial | S.D. | Final | S.D. | % Change | Initial | S.D. | Final | S.D. | % Change | ||
| Cysteine (μM/dL) | 24.5 | 4.1 | 24.1 | 3.8 | −2% | 24.4 | 2.7 | 24.2 | 3.1 | −1% | n.s. |
| Homocysteine (μM/L) | 7.1 | 2.7 | 5.0 | 1.4 | −29% | 6.1 | 1.7 | 5.7 | 1.4 | −7% | 0.00002 |
| Methionine (μM/dL) | 2.4 | 0.5 | 2.4 | 0.8 | 0% | 2.2 | 0.5 | 2.6 | 0.6 | +17% | 0.09 |
| Treatment Group (n = 27) | Non-Treatment Group (n = 26) | t-Test | |||||||||
|---|---|---|---|---|---|---|---|---|---|---|---|
| Initial | S.D. | Final | S.D. | % Change | Initial | S.D. | Final | S.D. | % Change | ||
| l-carnitine | 1.10 | 0.32 | 1.32 | 0.41 | +20% | 1.12 | 0.31 | 1.07 | 0.29 | −5% | 0.03 |
| Acetyl-l-carnitine | 1.05 | 0.42 | 1.39 | 0.47 | +32% | 0.96 | 0.53 | 1.01 | 0.39 | +4% | n.s. |
© 2018 by the authors. Licensee MDPI, Basel, Switzerland. This article is an open access article distributed under the terms and conditions of the Creative Commons Attribution (CC BY) license (http://creativecommons.org/licenses/by/4.0/).
Share and Cite
Adams, J.B.; Audhya, T.; Geis, E.; Gehn, E.; Fimbres, V.; Pollard, E.L.; Mitchell, J.; Ingram, J.; Hellmers, R.; Laake, D.; et al. Comprehensive Nutritional and Dietary Intervention for Autism Spectrum Disorder—A Randomized, Controlled 12-Month Trial. Nutrients 2018, 10, 369. https://doi.org/10.3390/nu10030369
Adams JB, Audhya T, Geis E, Gehn E, Fimbres V, Pollard EL, Mitchell J, Ingram J, Hellmers R, Laake D, et al. Comprehensive Nutritional and Dietary Intervention for Autism Spectrum Disorder—A Randomized, Controlled 12-Month Trial. Nutrients. 2018; 10(3):369. https://doi.org/10.3390/nu10030369
Chicago/Turabian StyleAdams, James B., Tapan Audhya, Elizabeth Geis, Eva Gehn, Valeria Fimbres, Elena L. Pollard, Jessica Mitchell, Julie Ingram, Robert Hellmers, Dana Laake, and et al. 2018. "Comprehensive Nutritional and Dietary Intervention for Autism Spectrum Disorder—A Randomized, Controlled 12-Month Trial" Nutrients 10, no. 3: 369. https://doi.org/10.3390/nu10030369
APA StyleAdams, J. B., Audhya, T., Geis, E., Gehn, E., Fimbres, V., Pollard, E. L., Mitchell, J., Ingram, J., Hellmers, R., Laake, D., Matthews, J. S., Li, K., Naviaux, J. C., Naviaux, R. K., Adams, R. L., Coleman, D. M., & Quig, D. W. (2018). Comprehensive Nutritional and Dietary Intervention for Autism Spectrum Disorder—A Randomized, Controlled 12-Month Trial. Nutrients, 10(3), 369. https://doi.org/10.3390/nu10030369

