Poor Dietary Guidelines Compliance among Low-Income Women Eligible for Supplemental Nutrition Assistance Program-Education (SNAP-Ed)

 , , ,
, , , 
Abstract
1. Introduction
2. Materials and Methods
2.1. NHANES Participants and Data Collection
2.2. Indiana SNAP-Ed Participants and Data Collection
2.3. Data Analysis
3. Results
4. Discussion
Acknowledgments
Author Contributions
Conflicts of Interest
References
- U.S. Department of Agriculture. Food and Nutrition Service. Supplemental Nutrition Assistance Program Education Plan Guidance FY 2018. Available online: https://snaped.fns.usda.gov/snap/Guidance/FY2018SNAP-EdPlanGuidance.pdf (accessed on 20 November 2017).
- Savoie, M.R.; Mispireta, M.; Rankin, L.L.; Neill, K.; LeBlanc, H.; Christofferson, D. Intention to change nutrition-related behaviors in adult participants of a Supplemental Nutrition Assistance Program-Education. J. Nutr. Educ. Behav. 2015, 47, 81–85. [Google Scholar] [CrossRef] [PubMed]
- Williams, P.A.; Cates, S.C.; Blitstein, J.L.; Hersey, J.C.; Kosa, K.M.; Long, V.A.; Singh, A.; Berman, D. Evaluating the Impact of Six Supplemental Nutrition Assistance Program Education Interventions on Children’s At-Home Diets. Health Educ. Behav. 2015, 42, 329–338. [Google Scholar] [CrossRef] [PubMed]
- U.S. Department of Agriculture. Dietary Guidelines for Americans 2015–2020. Available online: https://health.gov/dietaryguidelines/2015/resources/2015-2020_Dietary_Guidelines.pdf (accessed on 20 November 2017).
- McGill, C.R.; Fulgoni, V.L., III; Devareddy, L. Ten-year trends in fiber and whole grain intakes and food sources for the United States population: National Health and Nutrition Examination Survey 2001–2010. Nutrients 2015, 7, 1119–1130. [Google Scholar] [CrossRef] [PubMed]
- The Secretary of Health and Human Services and te Secretary of Agriculture. Scientific Report of the 2015 Dietary Guidelines Advisory Committee. Available online: https://health.gov/dietaryguidelines/2015-scientific-report/PDFs/Scientific-Report-of-the-2015-Dietary-Guidelines-Advisory-Committee.pdf (accessed on 25 November 2017).
- McAnulty, J.T.; Akabas, S.R.; Thuppal, S.V.; Paxson, E.E.; Saklani, S.; Tucker, K.L.; Bailey, R.L. Fiber Intake Varies by Poverty-Income Ratio and Race/Ethnicity in the US Adults. Nutr. Today 2017, 52, 73–79. [Google Scholar] [CrossRef]
- Storey, M.; Anderson, P. Income and race/ethnicity influence dietary fiber intake and vegetable consumption. Nutr. Res. 2014, 34, 844–850. [Google Scholar] [CrossRef] [PubMed]
- National Center for Health Statistic. National Health and Nutrition Examination Survey: Plan and Operations, 1999–2010; US Department of Health and Human Services; Centers for Disease Control and Prevention: Hyattsville, MD, USA, 2013. [Google Scholar]
- U.S. Department of Health and Human Services. Poverty Guidelines. Available online: https://aspe.hhs.gov/poverty-guidelines (accessed on 28 November 2017).
- US Department of Agriculture. Food Patterns Equivalents Database (FPED). Available online: https://www.ars.usda.gov/northeast-area/beltsville-md-bhnrc/beltsville-human-nutrition-research-center/food-surveys-research-group/docs/fped-databases (accessed on 12 July 2017).
- Riederer, A.M.; Pearson, M.A.; Lu, C. Comparison of food consumption frequencies among NHANES and CPES children: Implications for dietary pesticide exposure and risk assessment. J. Expo. Anal. Environ. Epidemiol. 2010, 20, 602–614. [Google Scholar] [CrossRef] [PubMed][Green Version]
- Krebs-Smith, S.M.; Guenther, P.M.; Subar, A.F.; Kirkpatrick, S.I.; Dodd, K.W. Americans do not meet federal dietary recommendations. J. Nutr. 2010, 140, 1832–1838. [Google Scholar] [CrossRef] [PubMed]
- Drewnowski, A.; Rehm, C.D. Socioeconomic gradient in consumption of whole fruit and 100% fruit juice among US children and adults. Nutr. J. 2015, 14, 3. [Google Scholar] [CrossRef] [PubMed]
- Bailey, R.L.; Akabas, S.R.; Paxson, E.E.; Thuppal, S.V.; Saklani, S.; Tucker, K.L. Total Usual Intake of Shortfall Nutrients Varies With Poverty Among US Adults. J. Nutr. Educ. Behav. 2017, 49, 639–646. [Google Scholar] [CrossRef] [PubMed]
- Kirkpatrick, S.I.; Dodd, K.W.; Reedy, J.; Krebs-Smith, S.M. Income and race/ethnicity are associated with adherence to food-based dietary guidance among US adults and children. J. Acad. Nutr. Diet. 2012, 112, 624–635. [Google Scholar] [CrossRef] [PubMed]
- Hiza, H.A.; Casavale, K.O.; Guenther, P.M.; Davis, C.A. Diet quality of Americans differs by age, sex, race/ethnicity, income, and education level. J. Acad. Nutr. Diet. 2013, 113, 297–306. [Google Scholar] [CrossRef] [PubMed]
- United States Department of Agriculture. Agricultural Research Service. Food Patterns Equivalent Intakes from Food, 2013–2014. Available online: https://www.ars.usda.gov/ARSUserFiles/80400530/pdf/FPED/tables_1-4_FPED_1314.pdf (accessed on 28 November 2017).
- Liu, R.H. Health-promoting components of fruits and vegetables in the diet. Adv. Nutr. 2013, 4, S384–S392. [Google Scholar] [CrossRef] [PubMed]
- Park, Y.; Subar, A.F.; Hollenbeck, A.; Schatzkin, A. Dietary fiber intake and mortality in the NIH-AARP Diet and Health Study. Arch. Intern. Med. 2011, 171, 1061–1068. [Google Scholar] [CrossRef] [PubMed]
- Slavin, J.L.; Savarino, V.; Paredes-Diaz, A.; Fotopoulos, G. A review of the role of soluble fiber in health with specific reference to wheat dextrin. J. Int. Med. Res. 2009, 37, 1–17. [Google Scholar] [CrossRef] [PubMed]
- Papathanasopoulos, A.; Camilleri, M. Dietary Fiber Supplements: Effects in Obesity and Metabolic Syndrome and Relationship to Gastrointestinal Functions. Gastroenterology 2010, 138, 65–72. [Google Scholar] [CrossRef] [PubMed]
- Riccioni, G.; Sblendorio, V.; Gemello, E.; Di Bello, B.; Scotti, L.; Cusenza, S.; D’Orazio, N. Dietary fibers and cardiometabolic diseases. Int. J. Mol. Sci. 2012, 13, 1524–1540. [Google Scholar] [CrossRef] [PubMed]
- Threapleton, D.E.; Greenwood, D.C.; Evans, C.E.L.; Cleghorn, C.L.; Nykjaer, C.; Woodhead, C.; Cade, J.E.; Gale, C.P.; Burley, V.J. Dietary fibre intake and risk of cardiovascular disease: Systematic review and meta-analysis. BMJ 2013, 347. [Google Scholar] [CrossRef] [PubMed]
- Wannamethee, S.G.; Whincup, P.H.; Thomas, M.C.; Sattar, N. Associations between dietary fiber and inflammation, hepatic function, and risk of type 2 diabetes in older men: Potential mechanisms for the benefits of fiber on diabetes risk. Diabetes Care 2009, 32, 1823–1825. [Google Scholar] [CrossRef] [PubMed]
- Yao, B.; Fang, H.; Xu, W.; Yan, Y.; Xu, H.; Liu, Y.; Mo, M.; Zhang, H.; Zhao, Y. Dietary fiber intake and risk of type 2 diabetes: A dose-response analysis of prospective studies. Eur. J. Epidemiol. 2014, 29, 79–88. [Google Scholar] [CrossRef] [PubMed]
- Moore, L.V.; Thompson, F.E. Adults Meeting Fruit and Vegetable Intake Recommendations—United States, 2013. Morb. Mortal. Wkly. Rep. 2015, 64, 709–713. [Google Scholar]
- Centers for Disease Control and Prevention (CDC). State-specific trends in fruit and vegetable consumption among adults—United States, 2000–2009. Morb. Mortal. Wkly. Rep. 2010, 59, 1125–1130. [Google Scholar]
- Di Noia, J.; Monica, D.; Gray, H.L.; Cullen, K.W. The Special Supplemental Nutrition Program for Women, Infants, and Children Fresh Start Randomized Controlled Trial: Baseline Participant Characteristics and Reliability of Measures. J. Acad. Nutr. Diet. 2016, 116, 1899–1913. [Google Scholar] [CrossRef] [PubMed]
- Yaroch, A.L.; Tooze, J.; Thompson, F.E.; Blanck, H.M.; Thompson, O.M.; Colon-Ramos, U.; Shaikh, A.R.; McNutt, S.; Nebeling, L.C. Evaluation of three short dietary instruments to assess fruit and vegetable intake: The National Cancer Institute’s food attitudes and behaviors survey. J. Acad. Nutr. Diet. 2012, 112, 1570–1577. [Google Scholar] [CrossRef] [PubMed]
- U.S. Census Bureau. 2008–2012 American Community Survey. Available online: https://www.census.gov/acs/www/data/data-tables-and-tools/data-profiles/2012/ (accessed on 25 November 2017).
- Haynes-Maslow, L.; Parsons, S.E.; Wheeler, S.B.; Leone, L.A. A qualitative study of perceived barriers to fruit and vegetable consumption among low-income populations, North Carolina, 2011. Prev. Chronic Dis. 2013, 10, E34. [Google Scholar] [CrossRef] [PubMed]
- Eicher-Miller, H.A.; Mason, A.C.; Abbott, A.R.; McCabe, G.P.; Boushey, C.J. The effect of Food Stamp Nutrition Education on the food insecurity of low-income women participants. J. Nutr. Educ. Behav. 2009, 41, 161–168. [Google Scholar] [CrossRef] [PubMed]
- Rivera, R.L.; Maulding, M.K.; Abbott, A.R.; Craig, B.A.; Eicher-Miller, H.A. SNAP-Ed (Supplemental Nutrition Assistance Program-Education) Increases Long-Term Food Security among Indiana Households with Children in a Randomized Controlled Study. J. Nutr. 2016, 146, 2375–2382. [Google Scholar] [CrossRef] [PubMed]
- Hanson, K.L.; Connor, L.M. Food insecurity and dietary quality in US adults and children: A systematic review. Am. J. Clin. Nutr. 2014, 100, 684–692. [Google Scholar] [CrossRef] [PubMed]
- Eicher-Miller, H.A.; Mason, A.C.; Weaver, C.M.; McCabe, G.P.; Boushey, C.J. Food insecurity is associated with diet and bone mass disparities in early adolescent males but not females in the United States. J. Nutr. 2011, 141, 1738–1745. [Google Scholar] [CrossRef] [PubMed]
- Park, C.Y.; Eicher-Miller, H.A. Iron deficiency is associated with food insecurity in pregnant females in the United States: National Health and Nutrition Examination Survey 1999–2010. J. Acad. Nutr. Diet. 2014, 114, 1967–1973. [Google Scholar] [CrossRef] [PubMed]
- Leung, C.W.; Epel, E.S.; Willett, W.C.; Rimm, E.B.; Laraia, B.A. Household food insecurity is positively associated with depression among low-income supplemental nutrition assistance program participants and income-eligible nonparticipants. J. Nutr. 2015, 145, 622–627. [Google Scholar] [CrossRef] [PubMed]
- Laraia, B.A. Food Insecurity and Chronic Disease. Adv. Nutr. 2013, 4, 203–212. [Google Scholar] [CrossRef] [PubMed]
- Molitor, F.; Sugerman, S.B.; Sciortino, S. Fruit and Vegetable, Fat, and Sugar-Sweetened Beverage Intake Among Low-Income Mothers Living in Neighborhoods With Supplemental Nutrition Assistance Program-Education. J. Nutr. Educ. Behav. 2016, 48, 683–690. [Google Scholar] [CrossRef] [PubMed]
- Molitor, F.; Sugerman, S.; Yu, H.; Biehl, M.; Aydin, M.; Levy, M.; Ponce, N.A. Reach of Supplemental Nutrition Assistance Program-Education (SNAP-Ed) interventions and nutrition and physical activity-related outcomes, California, 2011–2012. Prev. Chronic Dis. 2015, 12, E33. [Google Scholar] [CrossRef] [PubMed]
- Guenther, P.M.; Luick, B.R. Improved Overall Quality of Diets Reported by Expanded Food and Nutrition Education Program Participants in the Mountain Region. J. Nutr. Educ. Behav. 2015, 47, 421–426. [Google Scholar] [CrossRef] [PubMed]
- Gans, K.M.; Risica, P.M.; Strolla, L.O.; Fournier, L.; Kirtania, U.; Upegui, D.; Zhao, J.; George, T.; Acharyya, S. Effectiveness of different methods for delivering tailored nutrition education to low income, ethnically diverse adults. Int. J. Behav. Nutr. Phys. Act. 2009, 6, 24. [Google Scholar] [CrossRef] [PubMed]


| Indiana SNAP-Ed (n = 2623) % | SNAP-Ed Eligible Nationwide 1 (n = 3142) % | SNAP-Ed Ineligible Nationwide 1 (n = 3168) % | |
|---|---|---|---|
| Age, years | |||
| 19–30 | 46.2 | 34.1 | 18.4 |
| 31–50 | 35.9 | 39.4 | 42.0 |
| 51–70 | 17.9 | 26.5 | 39.6 |
| Race/ethnicity 2 | |||
| Non-Hispanic White | 79.2 | 51.8 | 76.9 |
| Non-Hispanic Black | 7.2 | 19.3 | 8.7 |
| Hispanic and Mexican American | 9.8 | 22.2 | 8.1 |
| Education | |||
| Less than high school | 25.2 | 31.3 | 7.5 |
| High school diploma or GED | 36.8 | 25.8 | 17.5 |
| Some college or associate degree | 33.3 | 31.7 | 34.4 |
| Bachelor’s degree or above | 4.9 | 11.2 | 40.6 |
| Physical Activity 3 | |||
| Less than 10 min | 31.3 | 41.6 | 31.9 |
| 10–29 min | 31.2 | 9.6 | 6.7 |
| 30–60 min | 23.4 | 13.4 | 20.6 |
| More than 60 min | 14.1 | 35.4 | 40.7 |
| Indiana SNAP-Ed % | SNAP-Ed Eligible Nationwide 2 % | |
|---|---|---|
| All | ||
| n | 2623 | 3142 |
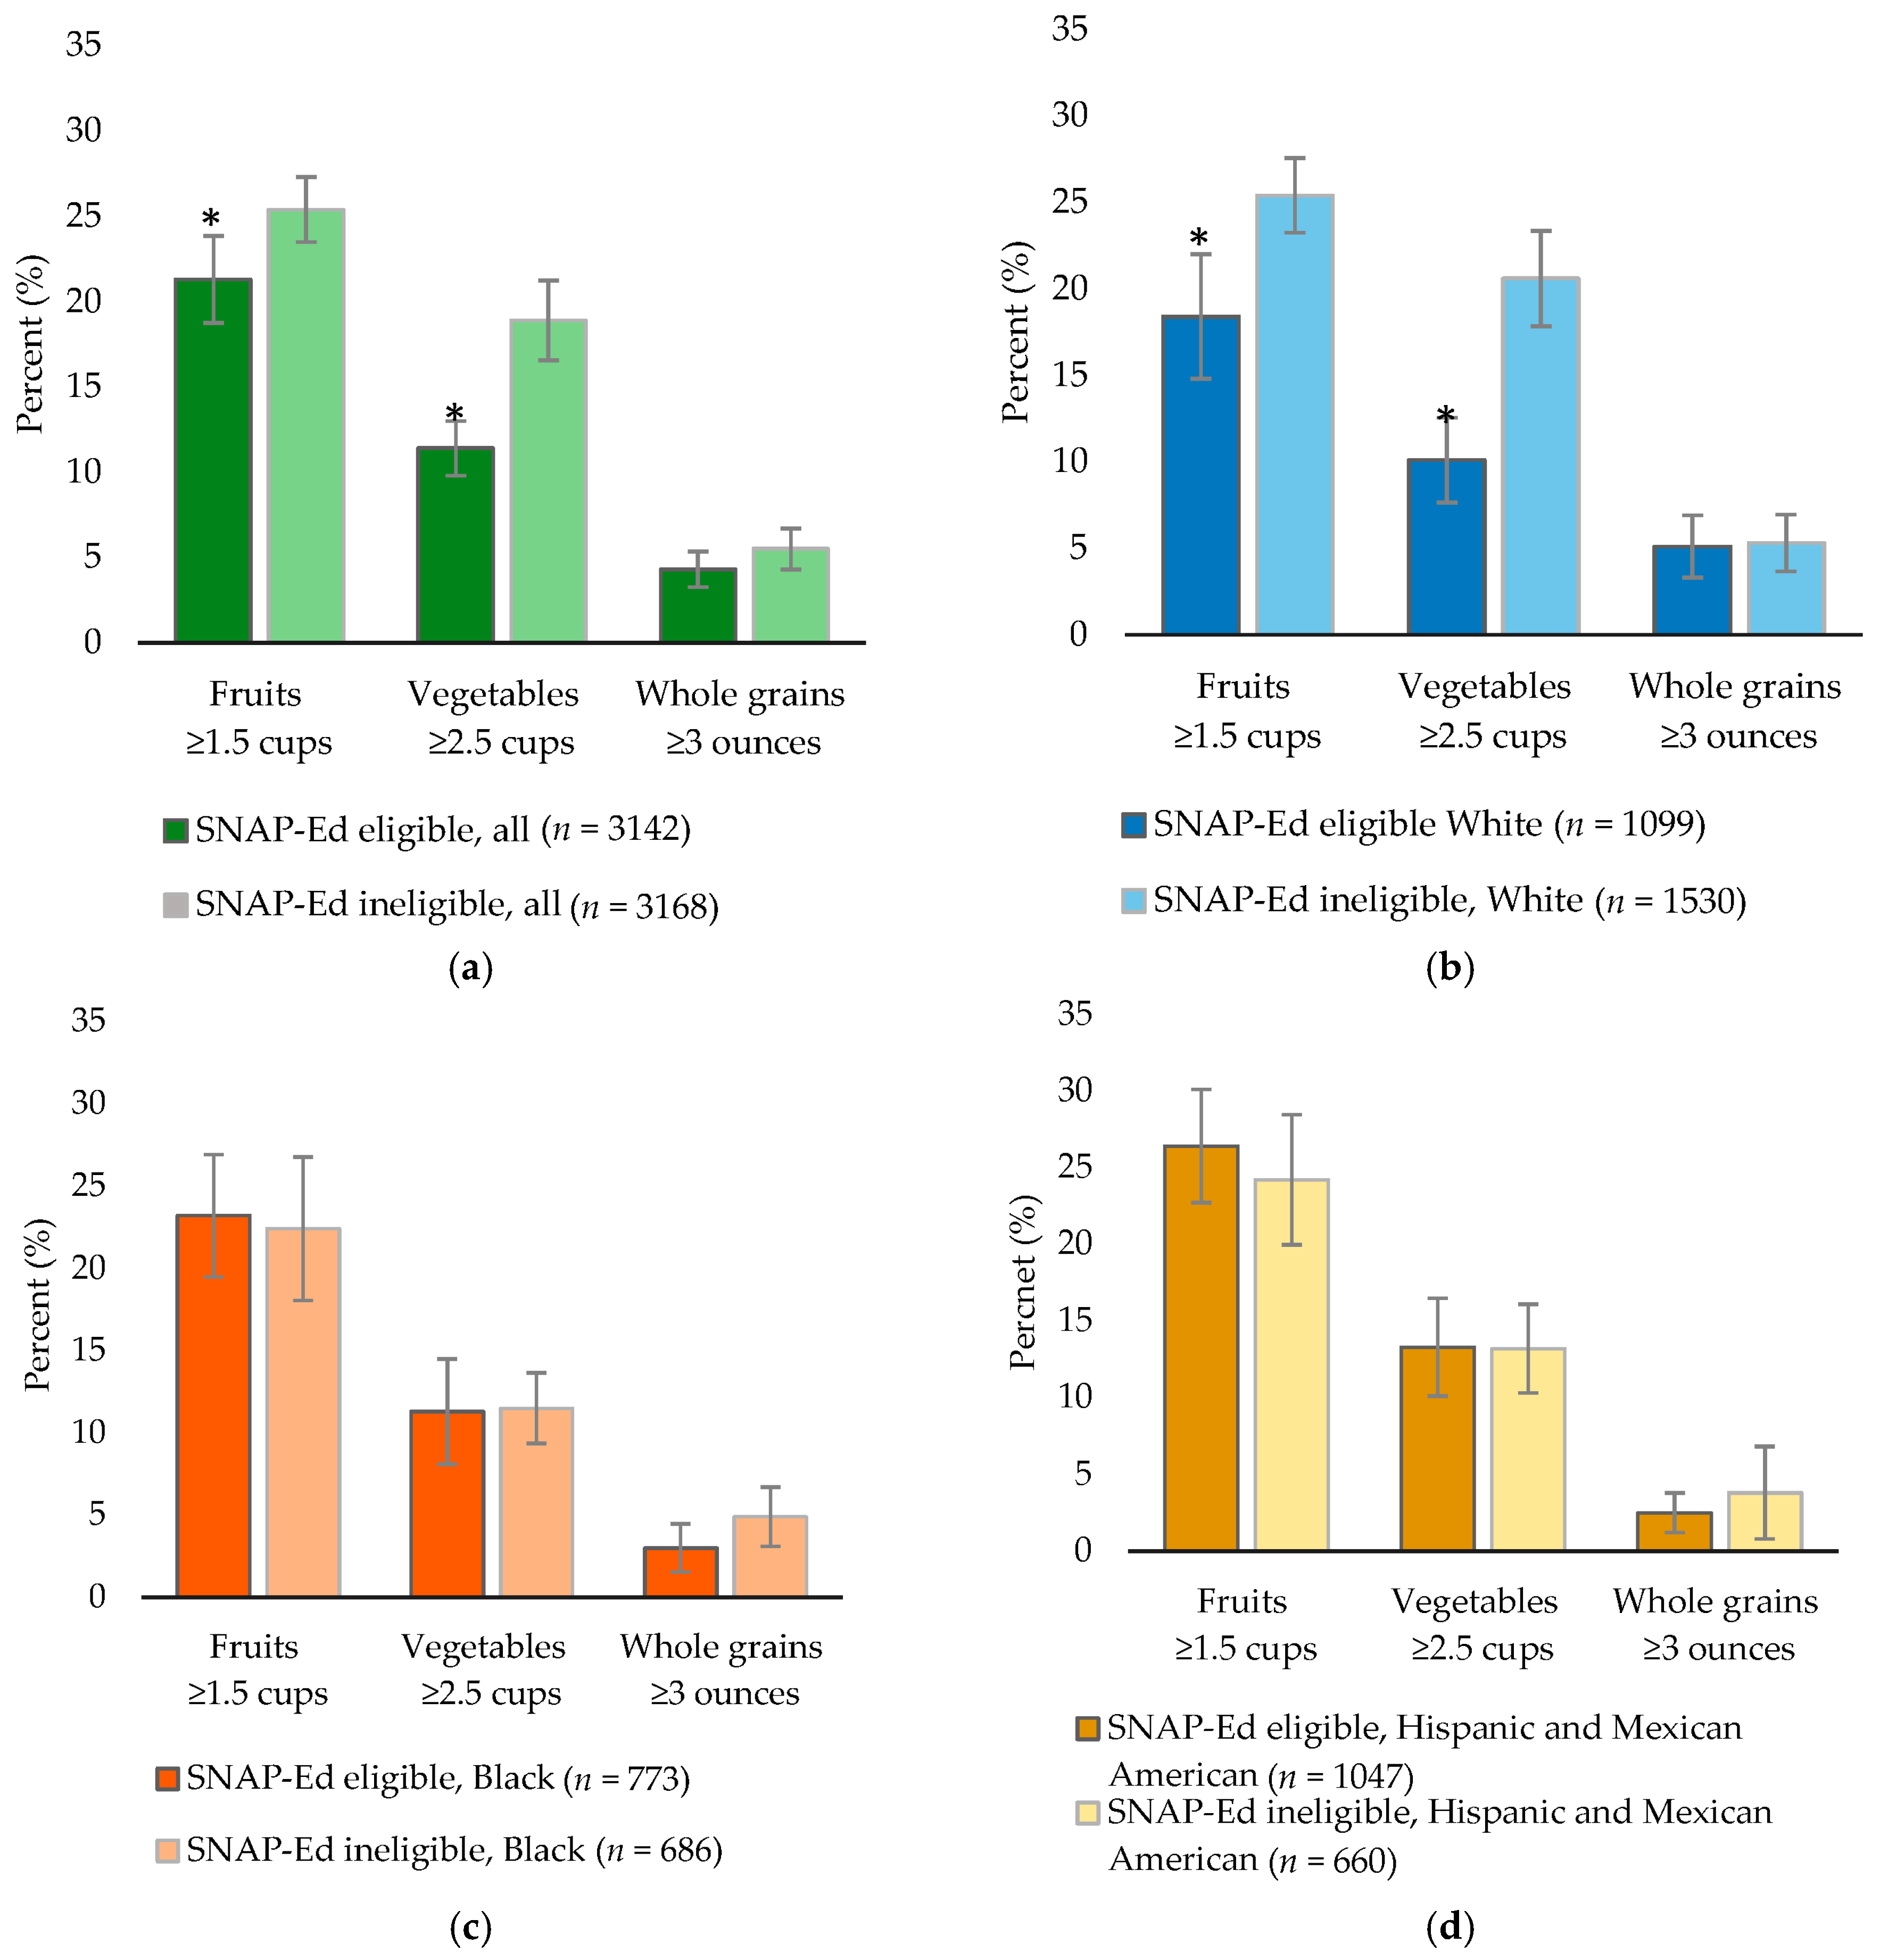
| Fruits ≥ 1.5 cups | 55.0 (53.1–56.9) | 21.3 (18.7–23.8) * |
| Vegetables ≥ 2.5 cups | 9.2 (8.2–10.4) | 11.4 (9.8–13.0) |
| Whole grains ≥ 3 ounces | 17.7 (16.3–19.2) | 4.3 (3.2–5.3) * |
| Non-Hispanic White | ||
| n | 2043 | 1099 |
| Fruits ≥ 1.5 cups | 53.1 (50.9–55.2) a | 18.4 (14.8–22.0) a,* |
| Vegetables ≥ 2.5 cups | 9.4 (8.2–10.8) | 10.1 (7.6–12.5) |
| Whole grains ≥ 3 ounces | 16.5 (14.9–18.2) a | 5.1 (3.3–6.9) a,* |
| Non-Hispanic Black | ||
| n | 186 | 773 |
| Fruits ≥ 1.5 cups | 66.7 (59.4–73.4) b | 23.2 (19.5–26.9) b,* |
| Vegetables ≥ 2.5 cups | 10.8 (6.7–16.1) | 11.3 (8.1–14.5) |
| Whole grains ≥ 3 ounces | 11.8 (7.6–17.4) b | 3.0 (1.6–4.5) a,b,* |
| Hispanic and Mexican American | ||
| n | 252 | 1047 |
| Fruits ≥ 1.5 cups | 60.3 (54.0–66.4) a | 26.4 (22.7–30.1) b,* |
| Vegetables ≥ 2.5 cups | 5.6 (3.1–9.2) | 13.3 (10.1–16.5) * |
| Whole grains ≥ 3 ounces | 32.5 (26.8–38.7) a | 2.5 (1.2–3.8) b,* |
| Currently in SNAP 3 | ||
| n | 1411 | 433 |
| Fruits ≥ 1.5 cups | 54.1 (51.5–56.7) | 18.1 (12.8–23.5) * |
| Vegetables ≥ 2.5 cups | 9.5 (8.0–11.1) | 10.4 (5.2–15.5) |
| Whole grains ≥ 3 ounces | 16.3 (14.4–18.3) | 6.8 (3.1–10.6) * |
© 2018 by the authors. Licensee MDPI, Basel, Switzerland. This article is an open access article distributed under the terms and conditions of the Creative Commons Attribution (CC BY) license (http://creativecommons.org/licenses/by/4.0/).
Share and Cite
Jun, S.; Thuppal, S.V.; Maulding, M.K.; Eicher-Miller, H.A.; Savaiano, D.A.; Bailey, R.L. Poor Dietary Guidelines Compliance among Low-Income Women Eligible for Supplemental Nutrition Assistance Program-Education (SNAP-Ed). Nutrients 2018, 10, 327. https://doi.org/10.3390/nu10030327
Jun S, Thuppal SV, Maulding MK, Eicher-Miller HA, Savaiano DA, Bailey RL. Poor Dietary Guidelines Compliance among Low-Income Women Eligible for Supplemental Nutrition Assistance Program-Education (SNAP-Ed). Nutrients. 2018; 10(3):327. https://doi.org/10.3390/nu10030327
Chicago/Turabian StyleJun, Shinyoung, Sowmyanarayanan V. Thuppal, Melissa K. Maulding, Heather A. Eicher-Miller, Dennis A. Savaiano, and Regan L. Bailey. 2018. "Poor Dietary Guidelines Compliance among Low-Income Women Eligible for Supplemental Nutrition Assistance Program-Education (SNAP-Ed)" Nutrients 10, no. 3: 327. https://doi.org/10.3390/nu10030327
APA StyleJun, S., Thuppal, S. V., Maulding, M. K., Eicher-Miller, H. A., Savaiano, D. A., & Bailey, R. L. (2018). Poor Dietary Guidelines Compliance among Low-Income Women Eligible for Supplemental Nutrition Assistance Program-Education (SNAP-Ed). Nutrients, 10(3), 327. https://doi.org/10.3390/nu10030327