Impact of Genetic Variants on the Individual Potential for Body Fat Loss

 , , ,
, , ,
Abstract
1. Introduction
2. Methods
2.1. Data Source
2.2. Ethics Statement
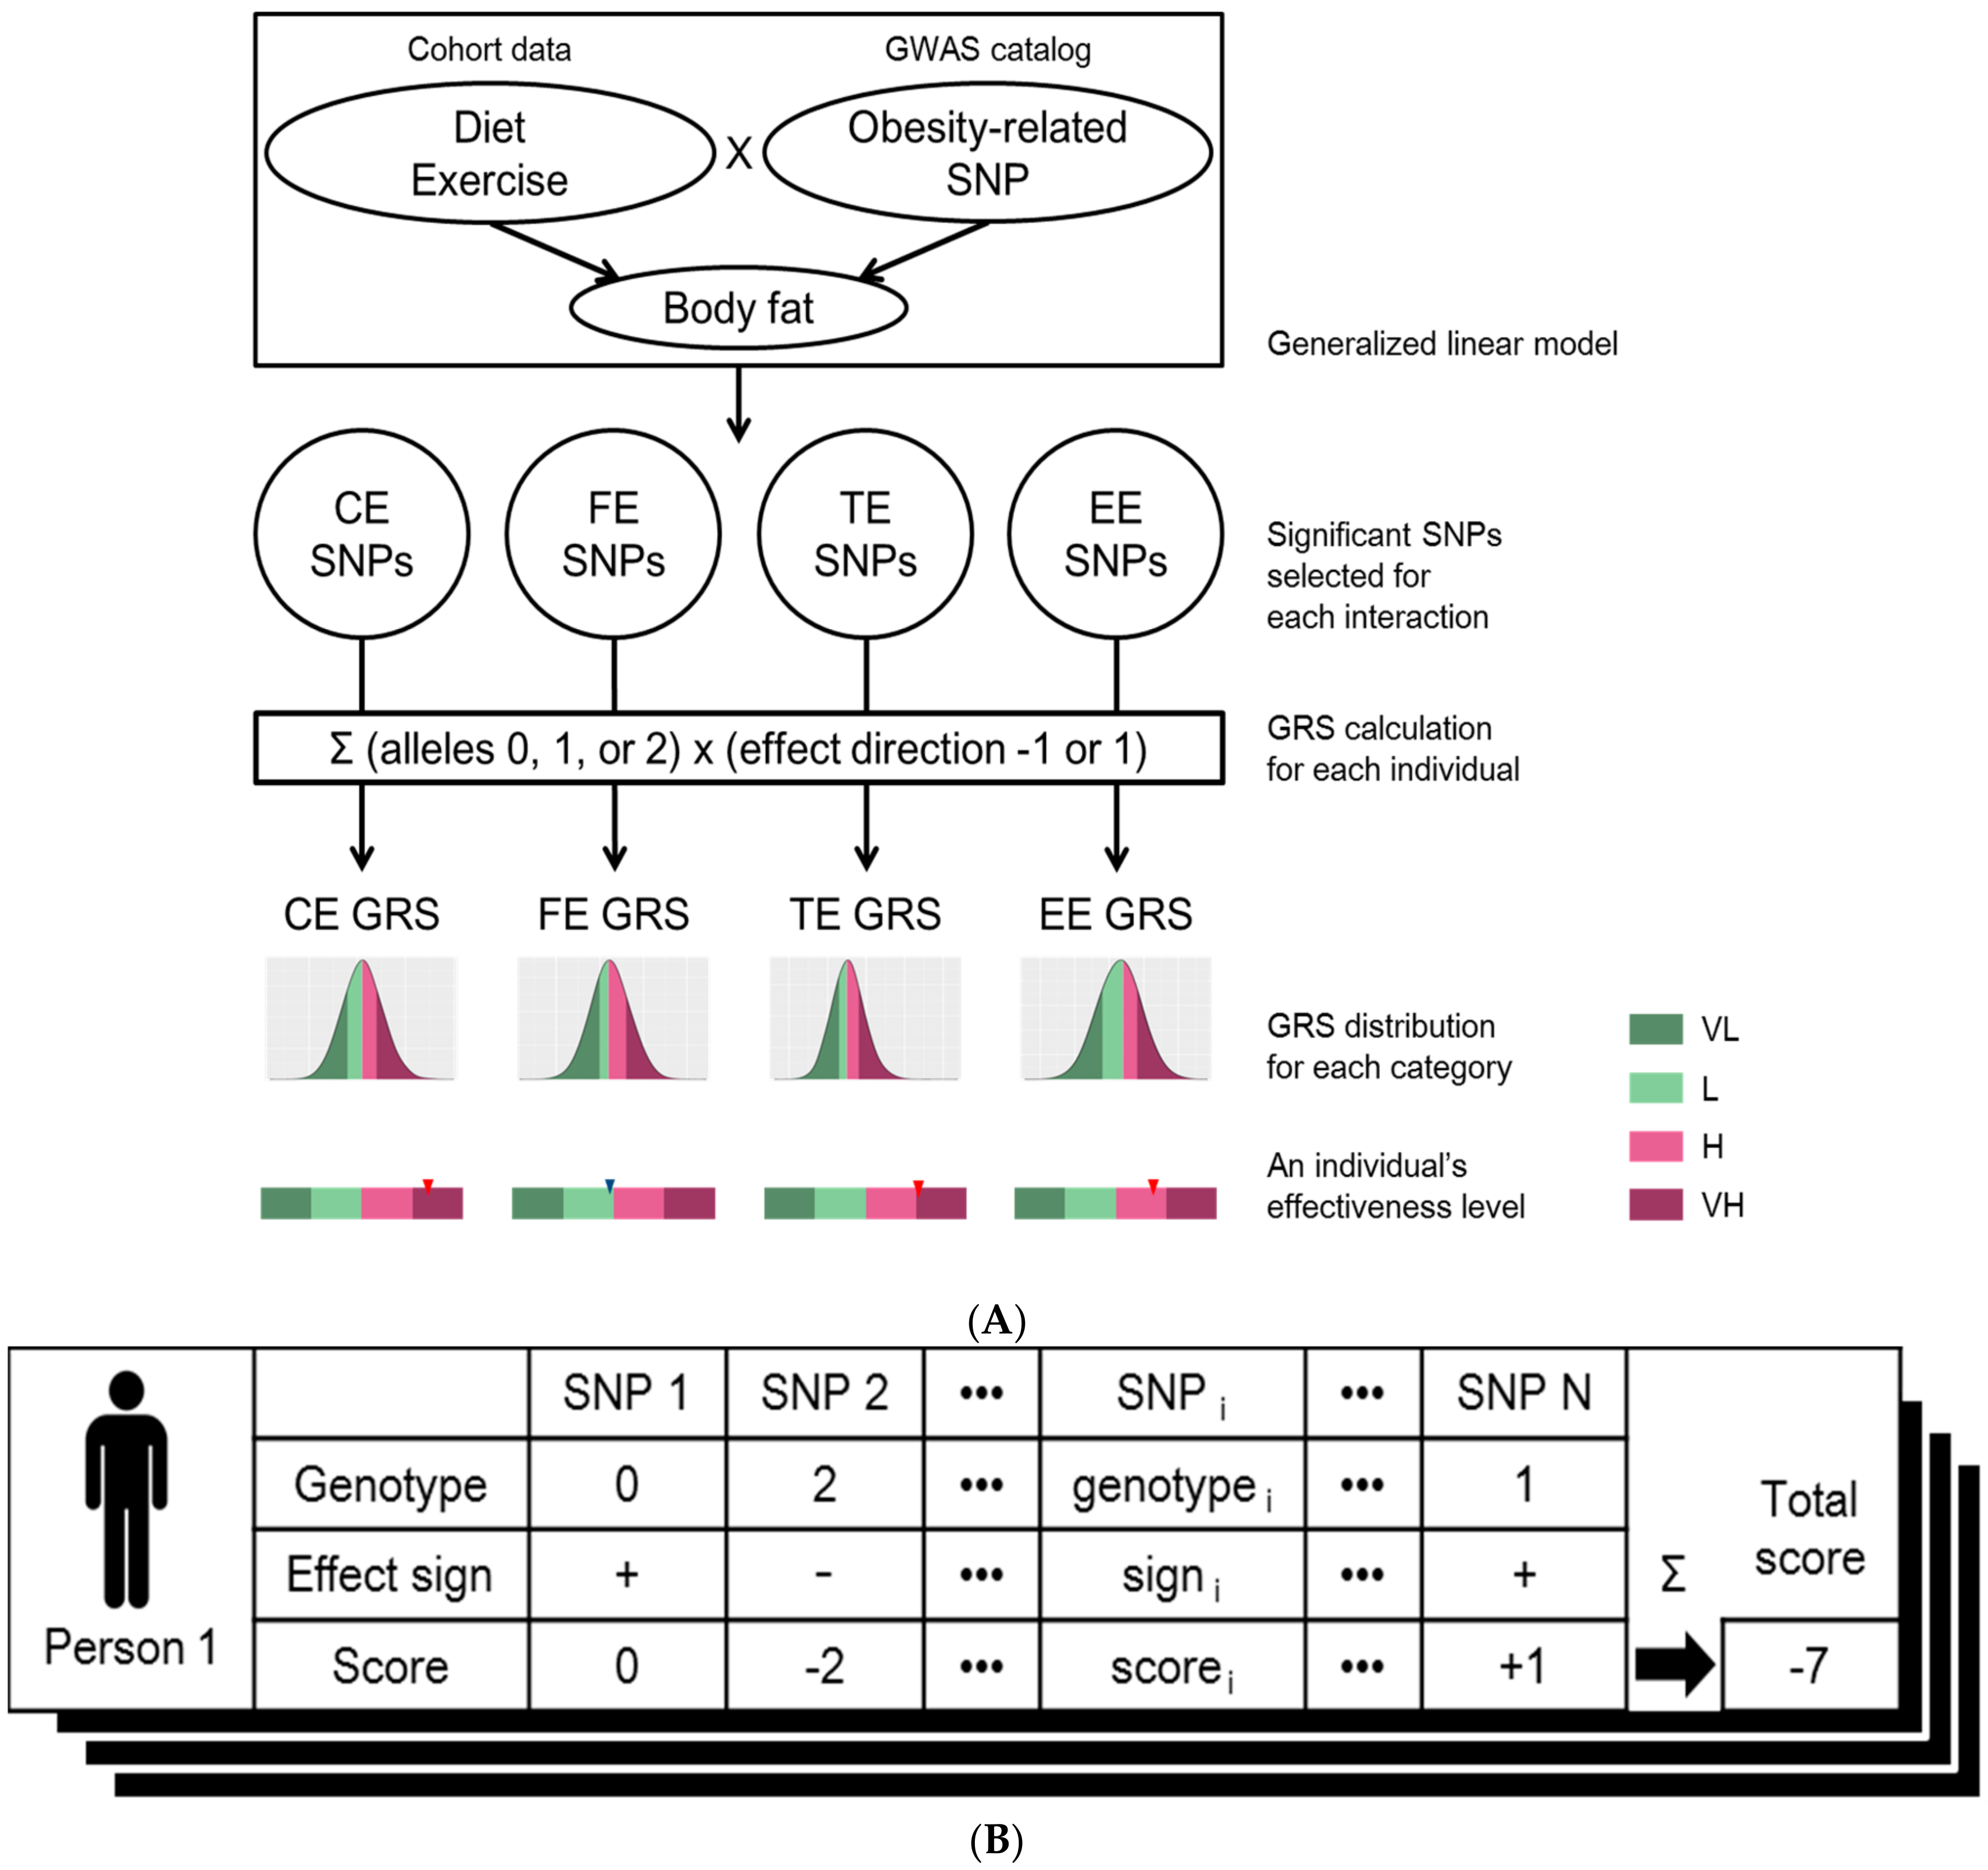
2.3. Linear Regression Model and Genetic Risk Score
3. Results
3.1. Characteristics of the Cohort
3.2. SNP Selection by Generalized Linear Model
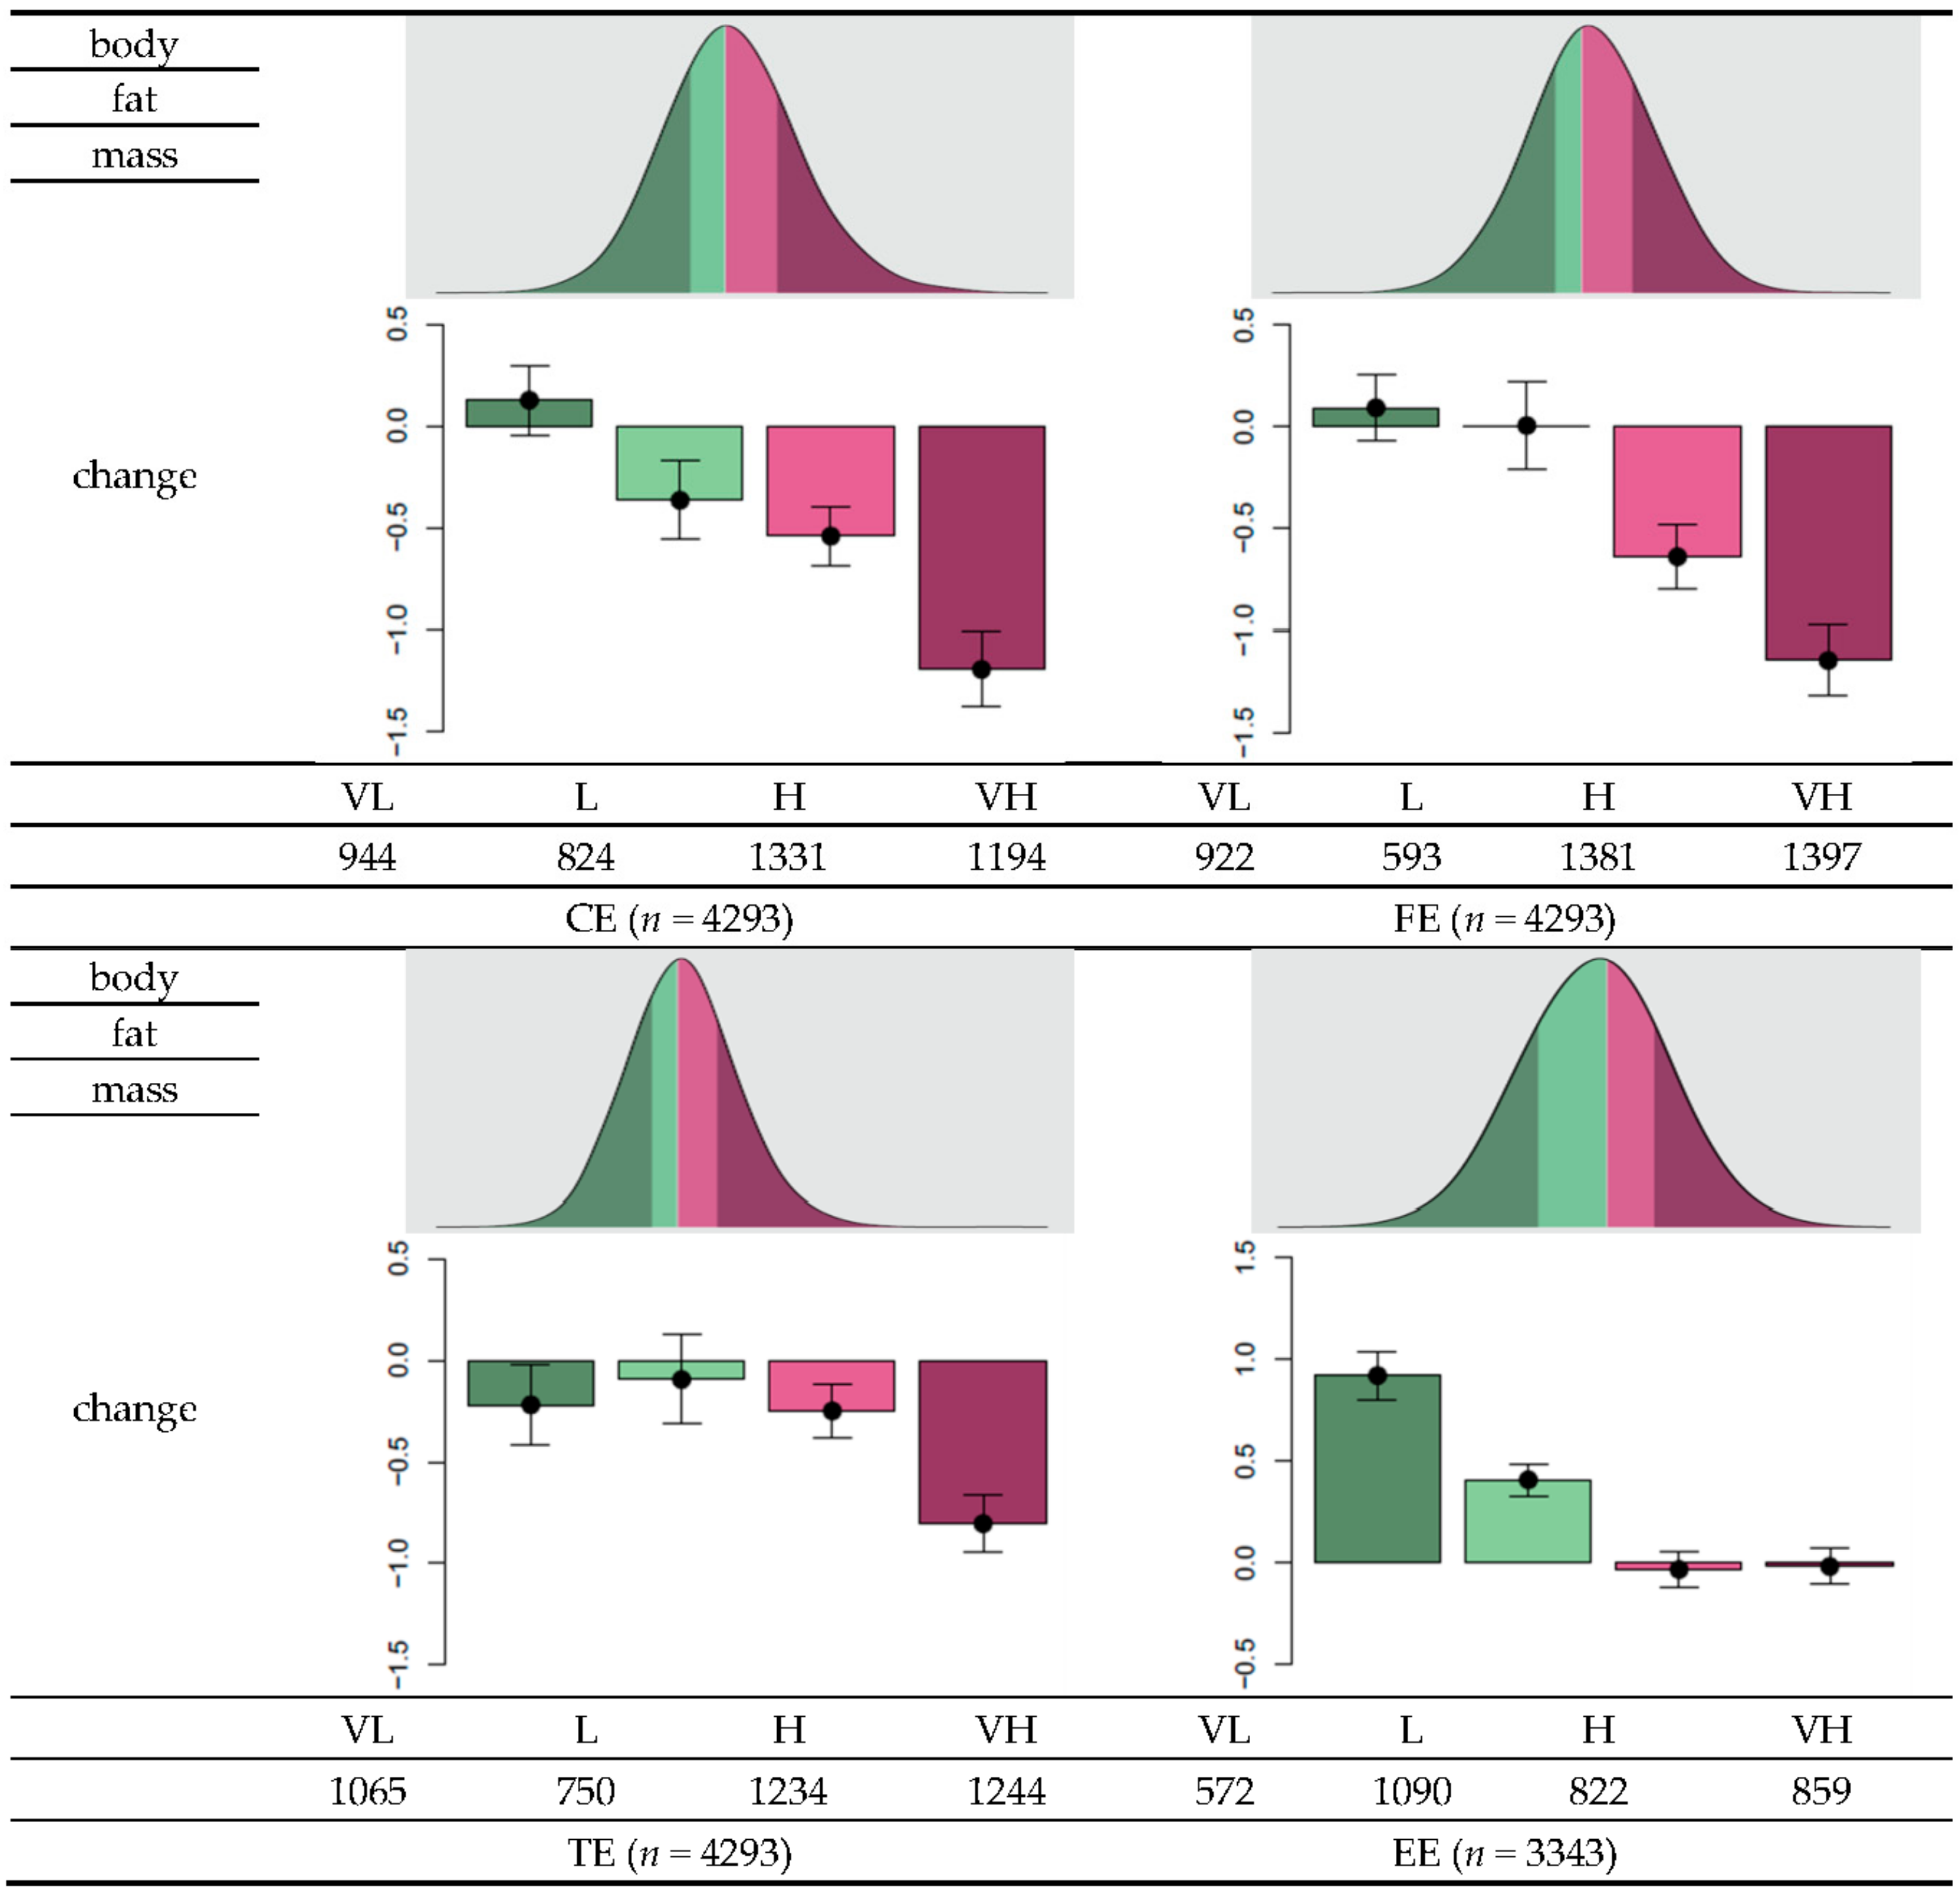
3.3. GRS Classification and Effectiveness of Dietary Regime
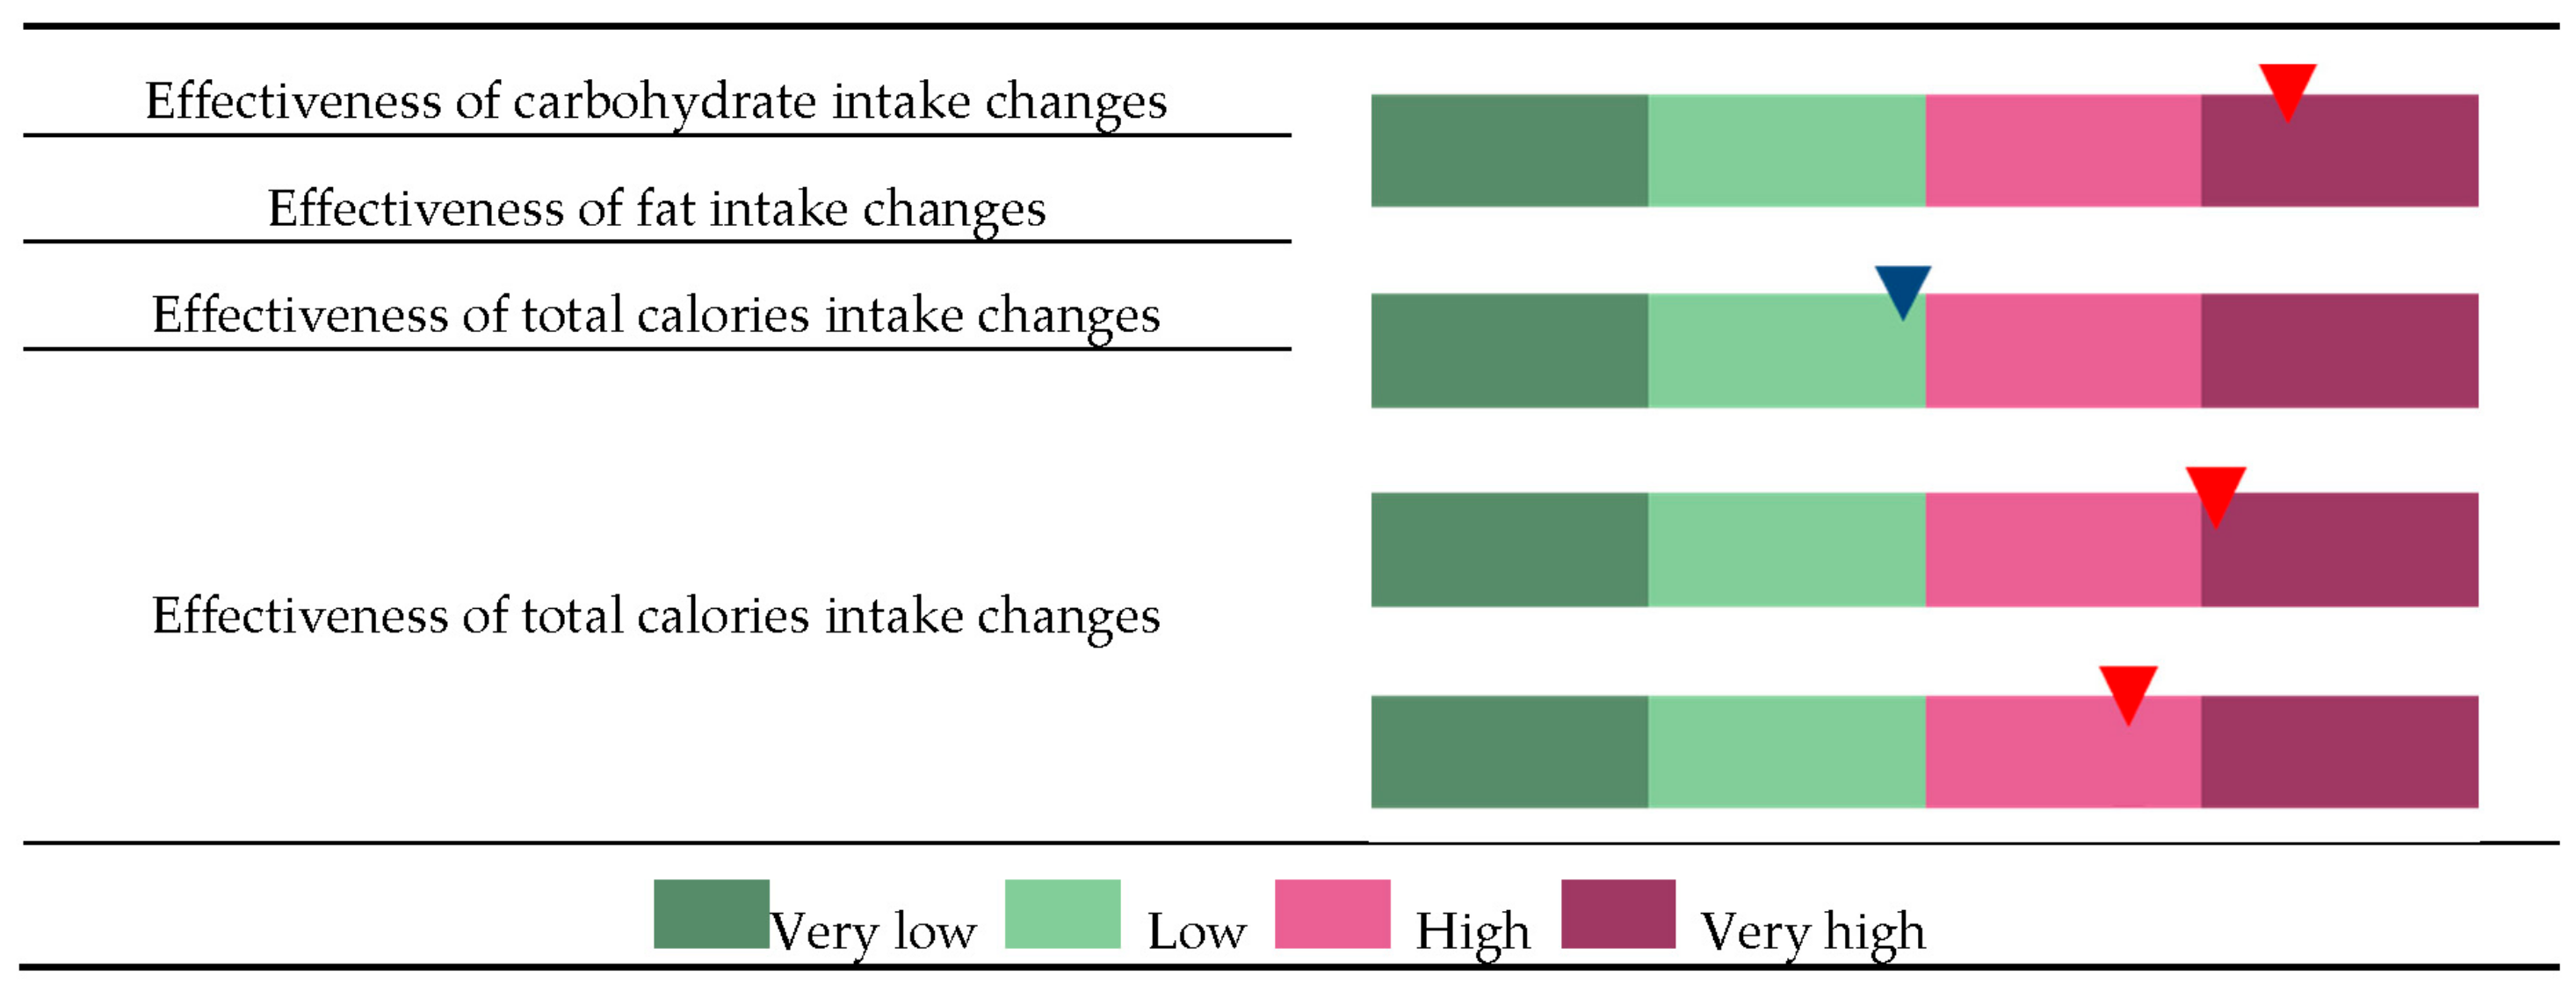
3.4. Personalized Genome-Based Health Care
4. Discussion
5. Conclusions
Supplementary Materials
Acknowledgments
Author Contributions
Conflicts of Interest
Data Availability
References
- Chan, I.S.; Ginsburg, G.S. Personalized medicine: Progress and promise. Annu. Rev. Genom. Hum. Genet. 2011, 12, 217–244. [Google Scholar] [CrossRef] [PubMed]
- Wray, N.R.; Goddard, M.E.; Visscher, P.M. Prediction of individual genetic risk to disease from genome-wide association studies. Genome Res. 2004, 17, 1520–1528. [Google Scholar] [CrossRef] [PubMed]
- Fall, T.; Ingelsson, E. Genome-wide association studies of obesity and metabolic syndrome. Mol. Cell. Endocrinol. 2014, 382, 740–757. [Google Scholar] [CrossRef] [PubMed]
- Kalf, R.R.; Mihaescu, R.; Kundu, S.; de Knijff, P.; Green, R.C.; Janssens, A.C.J.W. Variations in predicted risks in personal genome testing for common complex diseases. Genet. Med. 2014, 16, 85–91. [Google Scholar] [CrossRef] [PubMed]
- Frayling, T.M.; Timpson, N.J.; Weedon, M.N.; Zeggini, E.; Freathy, R.M.; Lindgren, C.M.; Perry, J.R.B.; Elliott, K.S.; Lango, H.; Rayner, N.W.; et al. A common variant in the FTO gene is associated with body mass index and predisposes to childhood and adult obesity. Science 2007, 316, 889–894. [Google Scholar] [CrossRef] [PubMed]
- Scuteri, A.; Sanna, S.; Chen, W.M.; Uda, M.; Albai, G.; Strait, J.; Najjar, S.; Nagaraja, R.; Orrú, M.; Usala, G.; et al. Genome-wide association scan shows genetic variants in the FTO gene are associated with obesity-related traits. PLoS Genet. 2007, 3, e115. [Google Scholar] [CrossRef] [PubMed]
- Fawcett, K.A.; Barroso, I. The genetics of obesity: FTO leads the way. Trends Genet. 2010, 26, 266–274. [Google Scholar] [CrossRef] [PubMed]
- Loos, R.J.; Yeo, G.S. The bigger picture of FTO: The first GWAS-identified obesity gene. Nat. Rev. Endocrinol. 2014, 10, 51–61. [Google Scholar] [CrossRef] [PubMed]
- Chesi, A.; Grant, S.F. The Genetics of Pediatric Obesity. Trends Endocrinol. Metab. 2015, 26, 711–721. [Google Scholar] [CrossRef] [PubMed]
- Huang, T.; Hu, F.B. Gene-environment interactions and obesity: Recent developments and future directions. BMC Med. Genom. 2015, 8, S2. [Google Scholar] [CrossRef] [PubMed]
- Manning, A.K.; LaValley, M.; Liu, C.T.; Rice, K.; An, P.; Liu, Y.M.; Miljkovic, I.; Rasmussen-Torvik, L.; Harris, T.B.; Province, M.A.; et al. Meta-analysis of gene-environment interaction: Joint estimation of SNP and SNP x environment regression coefficients. Genet. Epidemiol. 2011, 35, 11–18. [Google Scholar] [CrossRef] [PubMed]
- Lindstrom, S.; Schumacher, F.; Siddiq, A.; Travis, R.C.; Campa, D.; Berndt, S.I.; Diver, W.R.; Severi, S.G.; Allen, N.; Andriole, G.; et al. Characterizing associations and SNP-environment interactions for GWAS-identified prostate cancer risk markers—Results from BPC3. PLoS ONE 2011, 6, e17142. [Google Scholar] [CrossRef] [PubMed]
- Albuquerque, D.; Stice, E.; Rodríguez-López, R.; Manco, L.; Nóbrega, C. Current review of genetics of human obesity: From molecular mechanisms to an evolutionary perspective. Mol. Genet. Genom. 2015, 290, 1191–1221. [Google Scholar] [CrossRef] [PubMed]
- Zeevi, D.; Korem, T.; Zmora, N.; Israeli, D.; Rothschild, D.; Weinberger, A.; Ben-Yacov, O.; Lador, D.; Avnit-Sagi, T.; Lotan-Pompan, M.; et al. Personalized Nutrition by Prediction of Glycemic Responses. Cell 2015, 163, 1079–1094. [Google Scholar] [CrossRef] [PubMed]
- Caulfield, T.; Borry, P.; Toews, M.; Elger, B.S.; Greely, H.T.; McGuire, A. Marginally scientific? Genetic testing of children and adolescents for lifestyle and health promotion. J. Law Biosci. 2015, 2, 627–644. [Google Scholar] [CrossRef] [PubMed]
- Reddon, H.; Gerstein, H.C.; Engert, J.C.; Mohan, V.; Bosch, J.; Desai, D.; Bailey, S.D.; Diaz, R.; Yusuf, S.; Anand, S.S.; et al. Physical activity and genetic predisposition to obesity in a multiethnic longitudinal study. Sci. Rep. 2016, 6, 18672. [Google Scholar] [CrossRef] [PubMed]
- Bloss, C.S.; Darst, B.F.; Topol, E.J.; Schork, N.J. Direct-to-consumer personalized genomic testing. Hum. Mol. Genet. 2011, 20, R132–R141. [Google Scholar] [CrossRef] [PubMed]
- Roberts, J.S.; Ostergren, J. Direct-to-Consumer Genetic Testing and Personal Genomics Services: A Review of Recent Empirical Studies. Curr. Genet. Med. Rep. 2013, 1, 182–200. [Google Scholar] [CrossRef] [PubMed]
- Dansinger, M.L.; Gleason, J.A.; Griffith, J.L.; Selker, H.P.; Schaefer, E.J. Comparison of the Atkins, Ornish, Weight Watchers, and Zone diets for weight loss and heart disease risk reduction: A randomized trial. JAMA 2005, 293, 43–53. [Google Scholar] [CrossRef] [PubMed]
- McTiernan, A.; Sorensen, B.; Irwin, M.L.; Morgan, A.; Yasui, Y.; Rudolph, R.E.; Surawicz, C.; Lampe, J.W.; Lampe, P.D.; Ayub, K.; et al. Exercise effect on weight and body fat in men and women. Obesity (Silver Spring) 2007, 15, 1496–1512. [Google Scholar] [CrossRef] [PubMed]
- Shai, I.; Schwarzfuchs, D.; Henkin, Y.; Shahar, D.R.; Witkow, S.; Greenberg, I.; Golan, R.; Fraser, D.; Bolotin, A.; Vardi, H.; et al. Weight loss with a low-carbohydrate, Mediterranean, or low-fat diet. N. Engl. J. Med. 2008, 359, 229–241. [Google Scholar] [CrossRef] [PubMed]
- Hu, T.; Mills, K.T.; Yao, L.; Demanelis, K.; Eloustaz, M.; Yancy, W.S., Jr.; Kelly, T.N.; He, J.; Bazzano, L.A. Effects of low-carbohydrate diets versus low-fat diets on metabolic risk factors: A meta-analysis of randomized controlled clinical trials. Am. J. Epidemiol. 2012, 176 (Suppl. 7), S44–S54. [Google Scholar] [CrossRef] [PubMed]
- Williams, R.L.; Wood, L.G.; Collins, C.E.; Callister, R. Effectiveness of weight loss interventions—Is there a difference between men and women: A systematic review. Obes. Rev. 2015, 16, 171–186. [Google Scholar] [CrossRef] [PubMed]
- Rouillier, M.A.; David-Riel, S.; Brazeau, A.S.; St-Pierre, D.H.; Karelis, A.D. Effect of an Acute High Carbohydrate Diet on Body Composition Using DXA in Young Men. Ann. Nutr. Metab. 2015, 66, 233–236. [Google Scholar] [CrossRef] [PubMed]
- Cho, Y.S.; Go, M.J.; Kim, Y.J.; Heo, J.Y.; Oh, J.H.; Ban, H.J.; Yoon, D.; Lee, M.H.; Kim, D.J.; Park, M.; et al. A large-scale genome-wide association study of Asian populations uncovers genetic factors influencing eight quantitative traits. Nat. Genet. 2009, 41, 527–534. [Google Scholar] [CrossRef] [PubMed]
- Purcell, S.; Neale, B.; Todd-Brown, K.; Thomas, L.; Ferreira, M.A.R.; Bender, D.; Maller, J.; Sklar, P.; de Bakker, P.I.W.; Daly, M.J.; et al. PLINK: A tool set for whole-genome association and population-based linkage analyses. Am. J. Hum. Genet. 2007, 81, 559–575. [Google Scholar] [CrossRef] [PubMed]
- Purcell, S. PLINK 1.07, 2009. Available online: http://pngu.mgh.harvard.edu/purcell/plink/ (accessed on 10 October 2009).
- Johnson, A.D.; Handsaker, R.E.; Pulit, S.L.; Nizzari, M.M.; O'Donnell, C.J.; de Bakker, P.I.W. SNAP: A web-based tool for identification and annotation of proxy SNPs using HapMap. Bioinformatics 2008, 24, 2938–2939. [Google Scholar] [CrossRef] [PubMed]
- Corella, D.; Coltell, O.; Sorlí, J.V.; Estruch, R.; Quiles, L.; Martínez-González, M.A.; Salas-Salvadó, J.; Castañer, O.; Arós, F.; Ortega-Calvo, M.; Serra-Majem, L.; et al. Polymorphism of the Transcription Factor 7-Like 2 Gene (TCF7L2) Interacts with Obesity on Type-2 Diabetes in the PREDIMED Study Emphasizing the Heterogeneity of Genetic Variants in Type-2 Diabetes Risk Prediction: Time for Obesity-Specific Genetic Risk Scores. Nutrients 2016, 8, 793. [Google Scholar]
- Cornelis, M.C.; Rimm, E.B.; Curhan, G.C.; Kraft, P.; Hunter, D.J.; Hu, F.B.; van Dam, R.M. Obesity susceptibility loci and uncontrolled eating, emotional eating and cognitive restraint behaviors in men and women. Obesity 2013, 22, E135–E141. [Google Scholar] [CrossRef] [PubMed]
- Goni, L.; Cuervo, M.; Milagro, F.I.; Martínez, J.A. A genetic risk tool for obesity predisposition assessment and personalized nutrition implementation based on macronutrient intake. Genes Nutr. 2014, 10, 445. [Google Scholar] [CrossRef] [PubMed]
- Guénard, F.; Bouchard-Mercier, A.; Rudkowska, I.; Lemieux, S.; Couture, P.; Vohl, M. Genome-Wide Association Study of Dietary Pattern Scores. Nutrients 2017, 9, 649. [Google Scholar] [CrossRef] [PubMed]
- Hosseini-Esfahani, F.; Koochakpoor, G.; Daneshpour, M.S.; Sedaghati-Khayat, B.; Mirmiran, P.; Azizi, F. Mediterranean Dietary Pattern Adherence Modify the Association between FTO Genetic Variations and Obesity Phenotypes. Nutrients 2017, 9, 1064. [Google Scholar] [CrossRef] [PubMed]
- Nettleton, J.A.; Follis, J.L.; Ngwa, J.S.; Smith, C.E.; Ahmad, S.; Tanaka, T.; Wojczynski, M.K.; Voortman, T.; Lemaitre, R.N.; Kristiansson, K.; et al. Gene × dietary pattern interactions in obesity: Analysis of up to 68 317 adults of European ancestry. Hum. Mol. Genet. 2015, 24, 4728–4738. [Google Scholar] [CrossRef] [PubMed]
- Price, N.D.; Magis, A.T.; Earls, J.C.; Glusman, G.; Levy, R.; Lausted, C.; McDonald, D.T.; Kusebauch, U.; Moss, C.L.; Zhou, Y.; et al. A wellness study of 108 individuals using personal, dense, dynamic data clouds. Nat. Biotechnol. 2017, 35, 747–756. [Google Scholar] [CrossRef] [PubMed]
- Rukh, G.; Sonestedt, E.; Melander, O.; Hedblad, B.; Wirfält, E.; Ericson, U.; Orho-Melander, M. Genetic susceptibility to obesity and diet intakes: Association and interaction analyses in the Malmö Diet and Cancer Study. Genes Nutr. 2013, 8, 535–547. [Google Scholar] [CrossRef] [PubMed]
- Sandholt, C.H.; Allin, K.H.; Toft, U.; Borglykke, A.; Ribel-Madsen, R.; Sparso, T.; Justesen, J.M.; Harder, M.N.; Jørgensen, T.; Hansen, T.; et al. The effect of GWAS identified BMI loci on changes in body weight among middle-aged danes during a five-year period. Obesity 2013, 22, 901–908. [Google Scholar] [CrossRef] [PubMed]
- Forman, B.M.; Tontonoz, P.; Chen, J.; Brun, R.P.; Spiegelman, B.M.; Evans, R.M. 15-Deoxy-delta 12, 14-prostaglandin J2 is a ligand for the adipocyte determination factor PPAR gamma. Cell 1995, 83, 803–812. [Google Scholar] [CrossRef]
- Lehmann, J.M.; Moore, L.B.; Smith-Oliver, T.A.; Wilkison, W.O.; Willson, T.M.; Kliewer, S.A. An antidiabetic thiazolidinedione is a high affinity ligand for peroxisome proliferator-activated receptor gamma (PPAR gamma). J. Biol. Chem. 1995, 270, 12953–12956. [Google Scholar] [CrossRef] [PubMed]
- Kubota, N.; Terauchi, Y.; Miki, H.; Tamemoto, H.; Yamauchi, T.; Komeda, K.; Satoh, S.; Nakano, R.; Ishii, C.; Sugiyama, T.; et al. PPAR gamma mediates high-fat diet-induced adipocyte hypertrophy and insulin resistance. Mol. Cell 1999, 4, 597–609. [Google Scholar] [CrossRef]
- Hegele, R.A.; Cao, H.; Frankowski, C.; Mathews, S.T.; Leff, T. PPARG F388L, a transactivation-deficient mutant, in familial partial lipodystrophy. Diabetes 2002, 51, 3586–3590. [Google Scholar] [CrossRef] [PubMed]
- Savage, D.B.; Tan, G.D.; Acerini, C.L.; Jebb, S.A.; Agostini, M.; Gurnell, M.; Williams, R.L.; Umpleby, A.M.; Thomas, E.L.; Bell, J.D.; et al. Human metabolic syndrome resulting from dominant-negative mutations in the nuclear receptor peroxisome proliferator-activated receptor-gamma. Diabetes 2003, 52, 910–917. [Google Scholar] [CrossRef] [PubMed]
- Black, M.H.; Wu, J.; Takayanagi, M.; Wang, N.; Taylor, K.D.; Haritunians, T.; Trigo, E.; Lawrence, J.M.; Watanabe, R.M.; Buchanan, T.A.; et al. Variation in PPARG is associated with longitudinal change in insulin resistance in Mexican Americans at risk for type 2 diabetes. J. Clin. Endocrinol. Metab. 2015, 100, 1187–1195. [Google Scholar] [CrossRef] [PubMed]
- Shi, H.; Yu, X.; Li, Q.; Ye, X.; Gao, Y.; Ma, J.; Cheng, J.; Lu, Y.; Du, W.; Du, J.; et al. Association between PPAR-gamma and RXR-alpha gene polymorphism and metabolic syndrome risk: A case-control study of a Chinese Han population. Arch. Med. Res. 2012, 43, 233–242. [Google Scholar] [CrossRef] [PubMed]
- Kulzer, J.R.; Stitzel, M.L.; Morken, M.A.; Huyghe, J.R.; Fuchsberger, C.; Kuusisto, J.; Laakso, M.; Boehnke, M.; Collins, F.S.; Mohlke, K.L. A common functional regulatory variant at a type 2 diabetes locus upregulates ARAP1 expression in the pancreatic beta cell. Am. J. Hum. Genet. 2014, 94, 186–197. [Google Scholar] [CrossRef] [PubMed]
- Stefan, N.; Häring, H.U.; Schulze, M.B. Metabolically healthy obesity: The low-hanging fruit in obesity treatment? Lancet Diabetes Endocrinol. 2017. [Google Scholar] [CrossRef]
- Stefan, N.; Schick, F.; Häring, H.U. Causes, Characteristics, and Consequences of Metabolically Unhealthy Normal Weight in Humans. Cell Metab. 2017, 26, 292–300. [Google Scholar] [CrossRef] [PubMed]


| Diet | Exercise | ||||
|---|---|---|---|---|---|
| Male (n) | 2070 | Male (n) | 1516 | ||
| Female (n) | 2223 | Female (n) | 1827 | ||
| Age (years) | 50.84 ± 8.54 | Age (years) | 55 ± 8.29 | ||
| Carbohydrate intake at baseline (g) | 343.3 ± 114.21 | Body fat change according to exercise status change | (3rd to 4th) | Stopped | 0.27 ± 2.16 (653) |
| Carbohydrate intake at 3rd follow-up (g) | 324.89 ± 94.94 | Started | −0.05 ± 2.24 (741) | ||
| Carbohydrate intake change (g) | −18.4 ± 132.38 | (4th to 5th) | Stopped | 0.07 ± 2.22 (650) | |
| Fat intake at baseline (g) | 33.25 ± 21.08 | Started | −0.09 ± 2.28 (675) | ||
| Fat intake at 3rd follow-up (g) | 28.54 ± 18.64 | (5th to 6th) | Stopped | 0.29 ± 2.15 (773) | |
| Fat intake change (g) | −4.71 ± 22.1 | Started | 0.06±2.12 (616) | ||
| Total calories intake at baseline (g) | 1960.19 ± 688.77 | (6th to 7th) | Stopped | 1.29 ± 2.37 (569) | |
| Total calories intake at 3rd follow-up (g) | 1813.06 ± 581.05 | Started | 1.3 ± 2.43 (662) | ||
| Total calories intake change (g) | −147.12 ± 758.94 | Averaged body fat change over times | Exercise status change between any two consecutive time points irregardless of time directionality | −0.08 ± 2.11 (3343) | |
| BMI at baseline (kg/m2) | 24.48 ± 3 | ||||
| BMI at 3rd follow-up (kg/m2) | 24.35 ± 2.95 | ||||
| BMI change (kg/m2) | −0.14 ± 1.2 | ||||
| Body fat mass at baseline (kg) | 16.86 ± 5.29 | ||||
| Body fat mass at 3rd follow-up (kg) | 16.44 ± 5.26 | ||||
| Body fat mass change (kg) | −0.42 ± 2.57 | ||||
| CE | FE | TC | EE | |
|---|---|---|---|---|
| −1 | 18 | 7 | 14 | 12 |
| 1 | 19 | 12 | 30 | 13 |
| Category | SNP | Estimate | p-Value | Gene Name |
|---|---|---|---|---|
| CE | rs13077495 | 0.006 | 1.90 × 10⁻⁵ | PPARG |
| CE | rs206936 | −0.0018 | 0.00016 | RPS10-NUDT3 |
| CE | rs17793951 | 0.0036 | 0.00064 | PPARG |
| CE | rs189428681 | 0.0066 | 0.0015 | PPARG |
| CE | rs7578465 | −0.0016 | 0.0019 | ALK |
| CE | rs191018871 | 0.0062 | 0.0021 | PPARG |
| CE | rs7920888 | −0.0015 | 0.0043 | intergenic |
| CE | rs13041126 | −0.0015 | 0.0052 | intergenic |
| CE | rs6782178 | 0.0023 | 0.0056 | PPARG |
| CE | rs6810295 | 0.0014 | 0.006 | OSBPL10 |
| FE | rs2237892 | −0.01 | 0.00067 | KCNQ1 |
| FE | rs1413020 | 0.012 | 0.0062 | intergenic |
| FE | rs2972165 | 0.029 | 0.0072 | PPARG |
| FE | rs2389438 | 0.017 | 0.011 | intergenic |
| FE | rs2938398 | 0.0091 | 0.013 | PPARG |
| FE | rs11122577 | −0.0077 | 0.014 | AGT |
| FE | rs11142387 | 0.0074 | 0.019 | intergenic |
| FE | rs7551318 | −0.027 | 0.02 | intergenic |
| FE | rs4243830 | −0.008 | 0.022 | PLEKHG5 |
| FE | rs4144743 | −0.0066 | 0.023 | intergenic |
| TE | rs2972164 | 0.00056 | 2.50 × 10⁻⁵ | PPARG |
| TE | rs11142387 | 0.00032 | 4.10 × 10⁻⁵ | intergenic |
| TE | rs13077495 | 0.0009 | 5.70 × 10⁻⁵ | PPARG |
| TE | rs206936 | −0.00029 | 0.0001 | RPS10-NUDT3 |
| TE | rs67216730 | 0.00062 | 0.00044 | PPARG |
| TE | rs2920502 | 0.00026 | 0.00059 | PPARG |
| TE | rs7578465 | −0.00025 | 0.0014 | ALK |
| TE | rs13041126 | −0.00022 | 0.0032 | intergenic |
| TE | rs12150665 | 0.00021 | 0.0047 | GGNBP2 |
| TE | rs4327120 | 0.00024 | 0.0048 | intergenic |
| EE | rs4432245 | −0.14 | 0.0065 | EIF2AK4 |
| EE | rs10929925 | −0.14 | 0.0065 | intergenic |
| EE | rs4762 | −0.21 | 0.013 | AGT |
| EE | rs7164727 | 0.15 | 0.013 | intergenic |
| EE | rs2770102 | −0.18 | 0.014 | LINC00340 |
| EE | rs11583200 | 0.19 | 0.015 | ELAVL4 |
| EE | rs2228213 | −0.13 | 0.021 | HIVEP1 |
| EE | rs1205 | 0.12 | 0.021 | CRP |
| EE | rs2845885 | 0.12 | 0.028 | MACROD1 |
| EE | rs3093059 | 0.16 | 0.03 | CRP |
| CE | FE | TC | EE | |
|---|---|---|---|---|
| Mean (SD) | 0.43 (3.8) | 1.4 (2.5) | 5.4 (4.2) | 1.5 (3.1) |
| Median | 0 | 1 | 5 | 2 |
| Minimum | −13 | −9 | −10 | −9 |
| Maximum | 15 | 11 | 30 | 11 |
| p-value for normality test | <2.2 × 10⁻¹⁶ | <2.2 × 10⁻¹⁶ | 6.874 × 10⁻¹⁵ | 7.203 × 10⁻¹⁴ |
© 2018 by the authors. Licensee MDPI, Basel, Switzerland. This article is an open access article distributed under the terms and conditions of the Creative Commons Attribution (CC BY) license (http://creativecommons.org/licenses/by/4.0/).
Share and Cite
Cha, S.; Kang, J.H.; Lee, J.-H.; Kim, J.; Kim, H.; Yang, Y.J.; Park, W.-Y.; Kim, J. Impact of Genetic Variants on the Individual Potential for Body Fat Loss. Nutrients 2018, 10, 266. https://doi.org/10.3390/nu10030266
Cha S, Kang JH, Lee J-H, Kim J, Kim H, Yang YJ, Park W-Y, Kim J. Impact of Genetic Variants on the Individual Potential for Body Fat Loss. Nutrients. 2018; 10(3):266. https://doi.org/10.3390/nu10030266
Chicago/Turabian StyleCha, Soyeon, Joon Ho Kang, Jae-Hak Lee, Jinki Kim, Heewon Kim, Yoon Jung Yang, Woong-Yang Park, and Jinho Kim. 2018. "Impact of Genetic Variants on the Individual Potential for Body Fat Loss" Nutrients 10, no. 3: 266. https://doi.org/10.3390/nu10030266
APA StyleCha, S., Kang, J. H., Lee, J.-H., Kim, J., Kim, H., Yang, Y. J., Park, W.-Y., & Kim, J. (2018). Impact of Genetic Variants on the Individual Potential for Body Fat Loss. Nutrients, 10(3), 266. https://doi.org/10.3390/nu10030266