Erythrocyte n-6 Fatty Acids and Risk for Cardiovascular Outcomes and Total Mortality in the Framingham Heart Study


Abstract
1. Introduction
2. Materials and Methods
2.1. Methods
2.2. Covariates and Mortality Outcomes
2.3. RBC Fatty Acid Analysis
2.4. Statistical Analysis
3. Results
3.1. Cohort Description
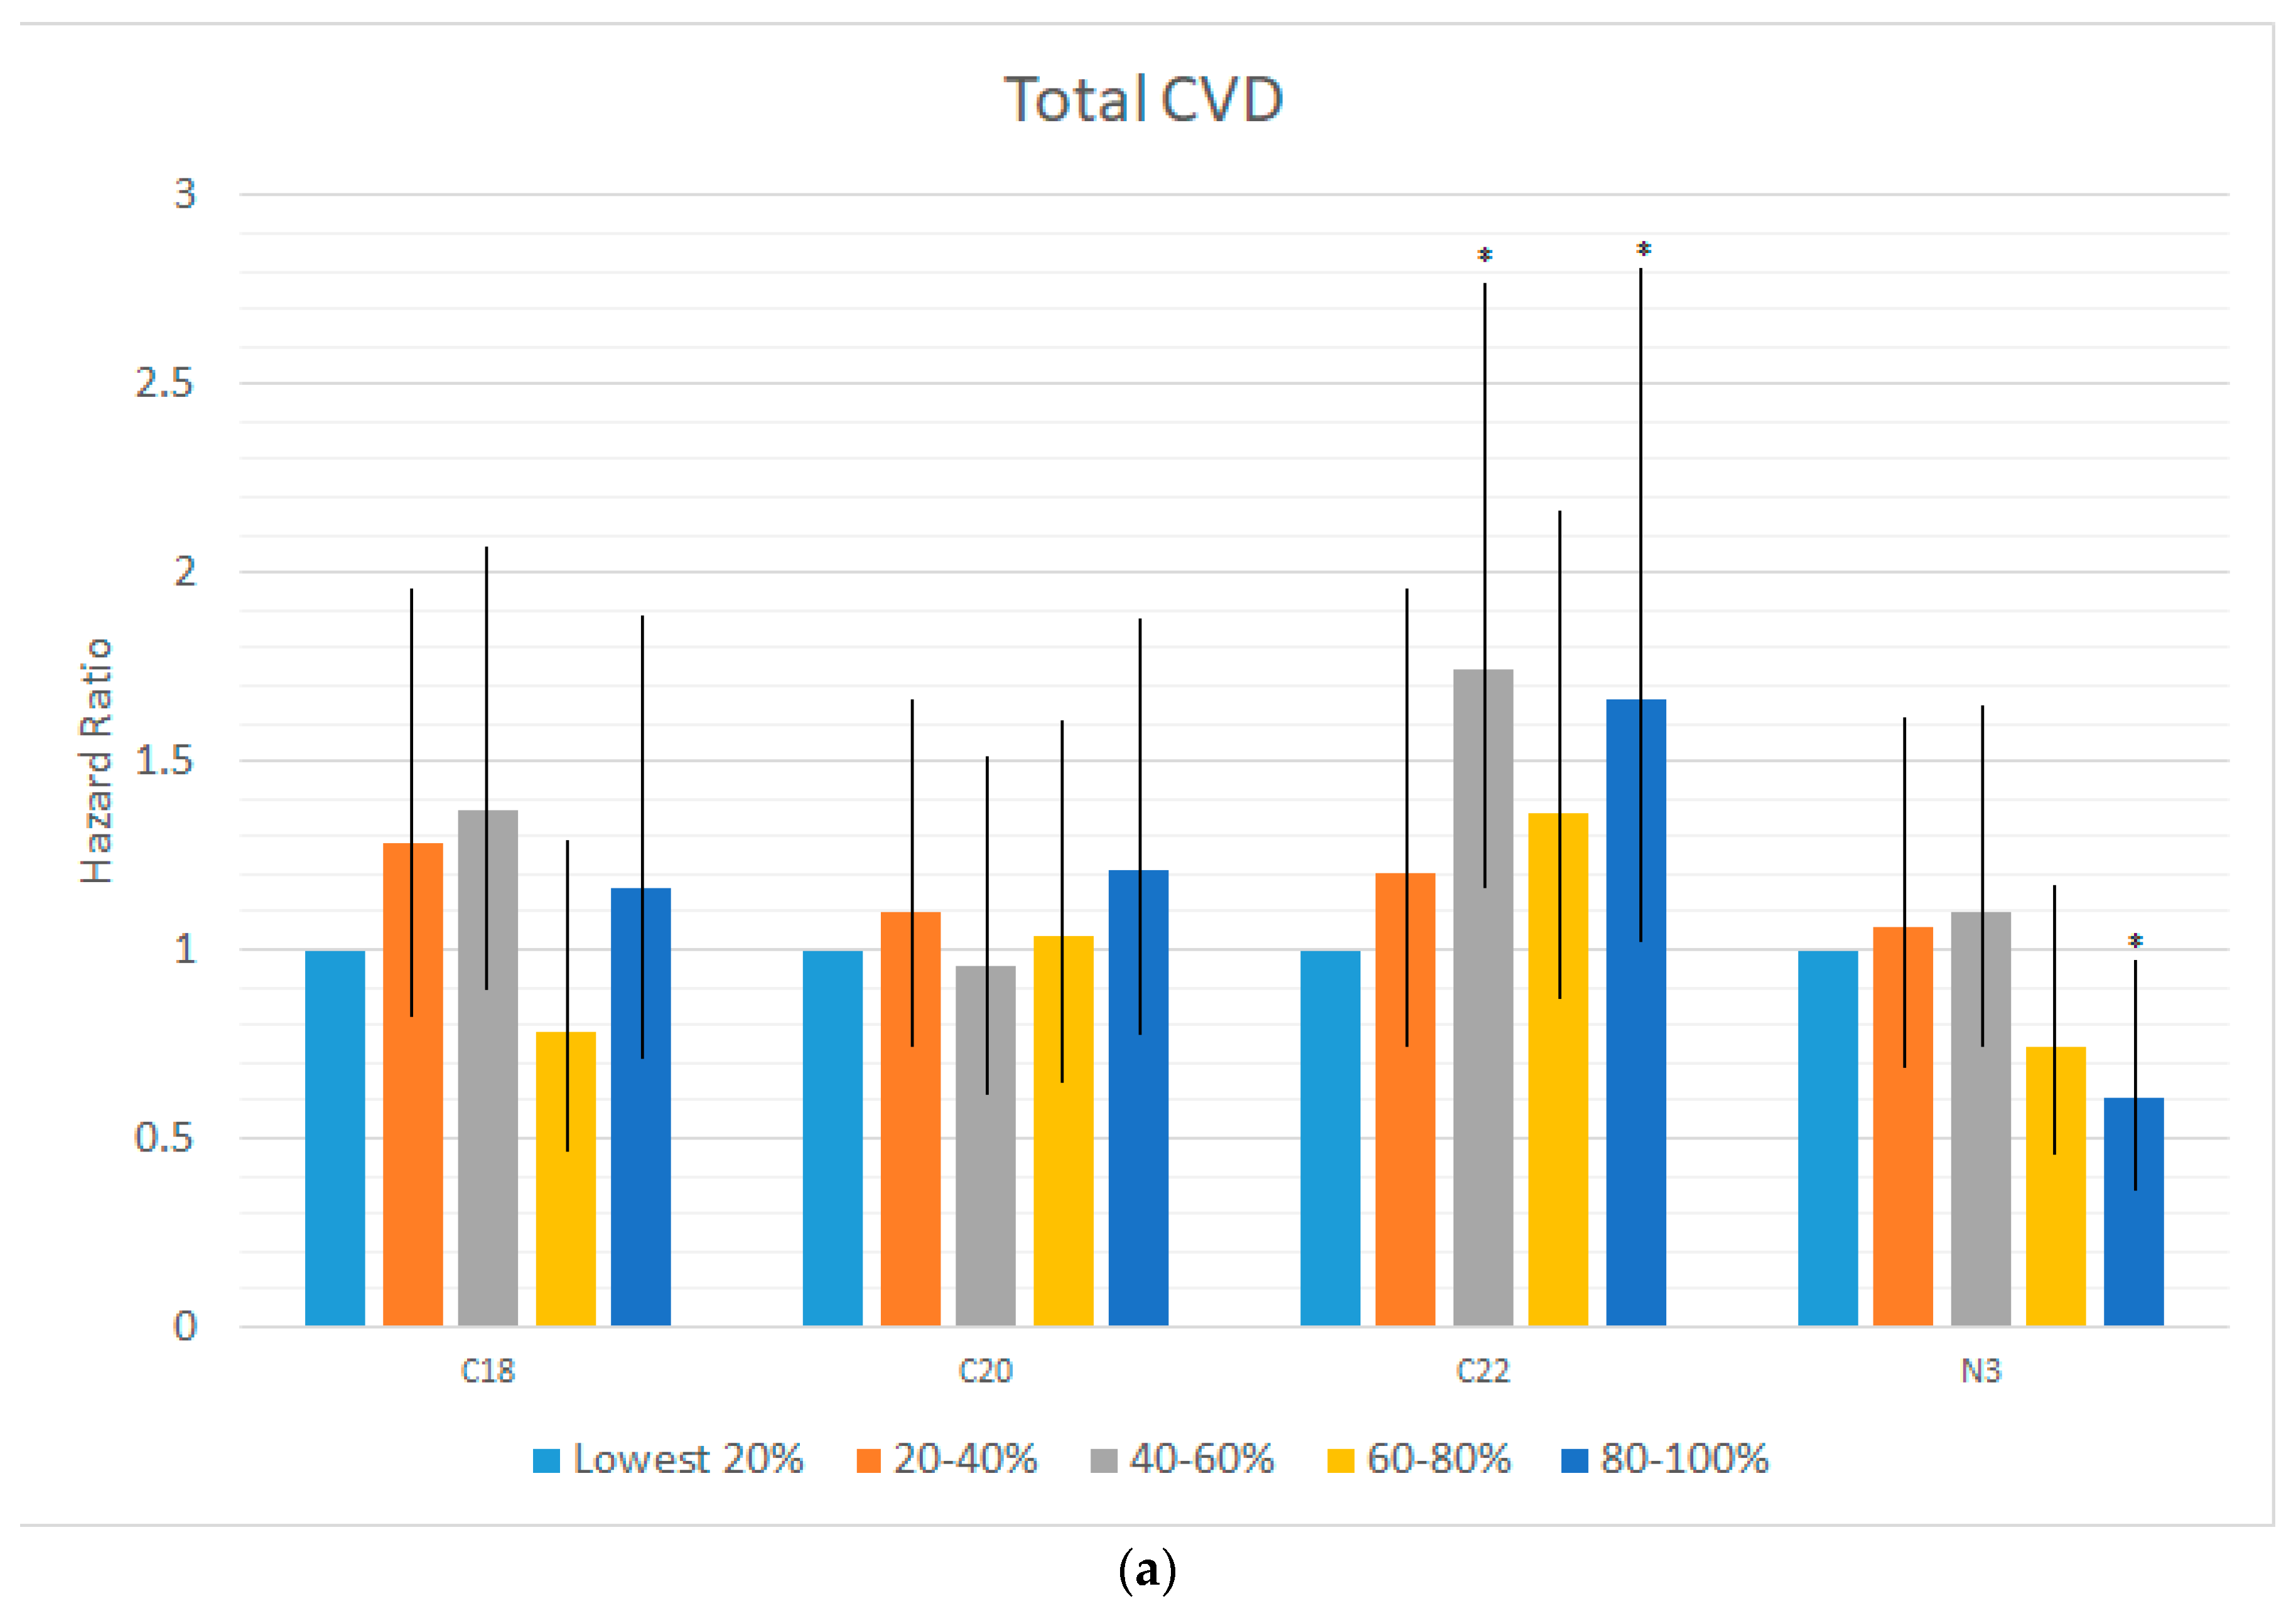
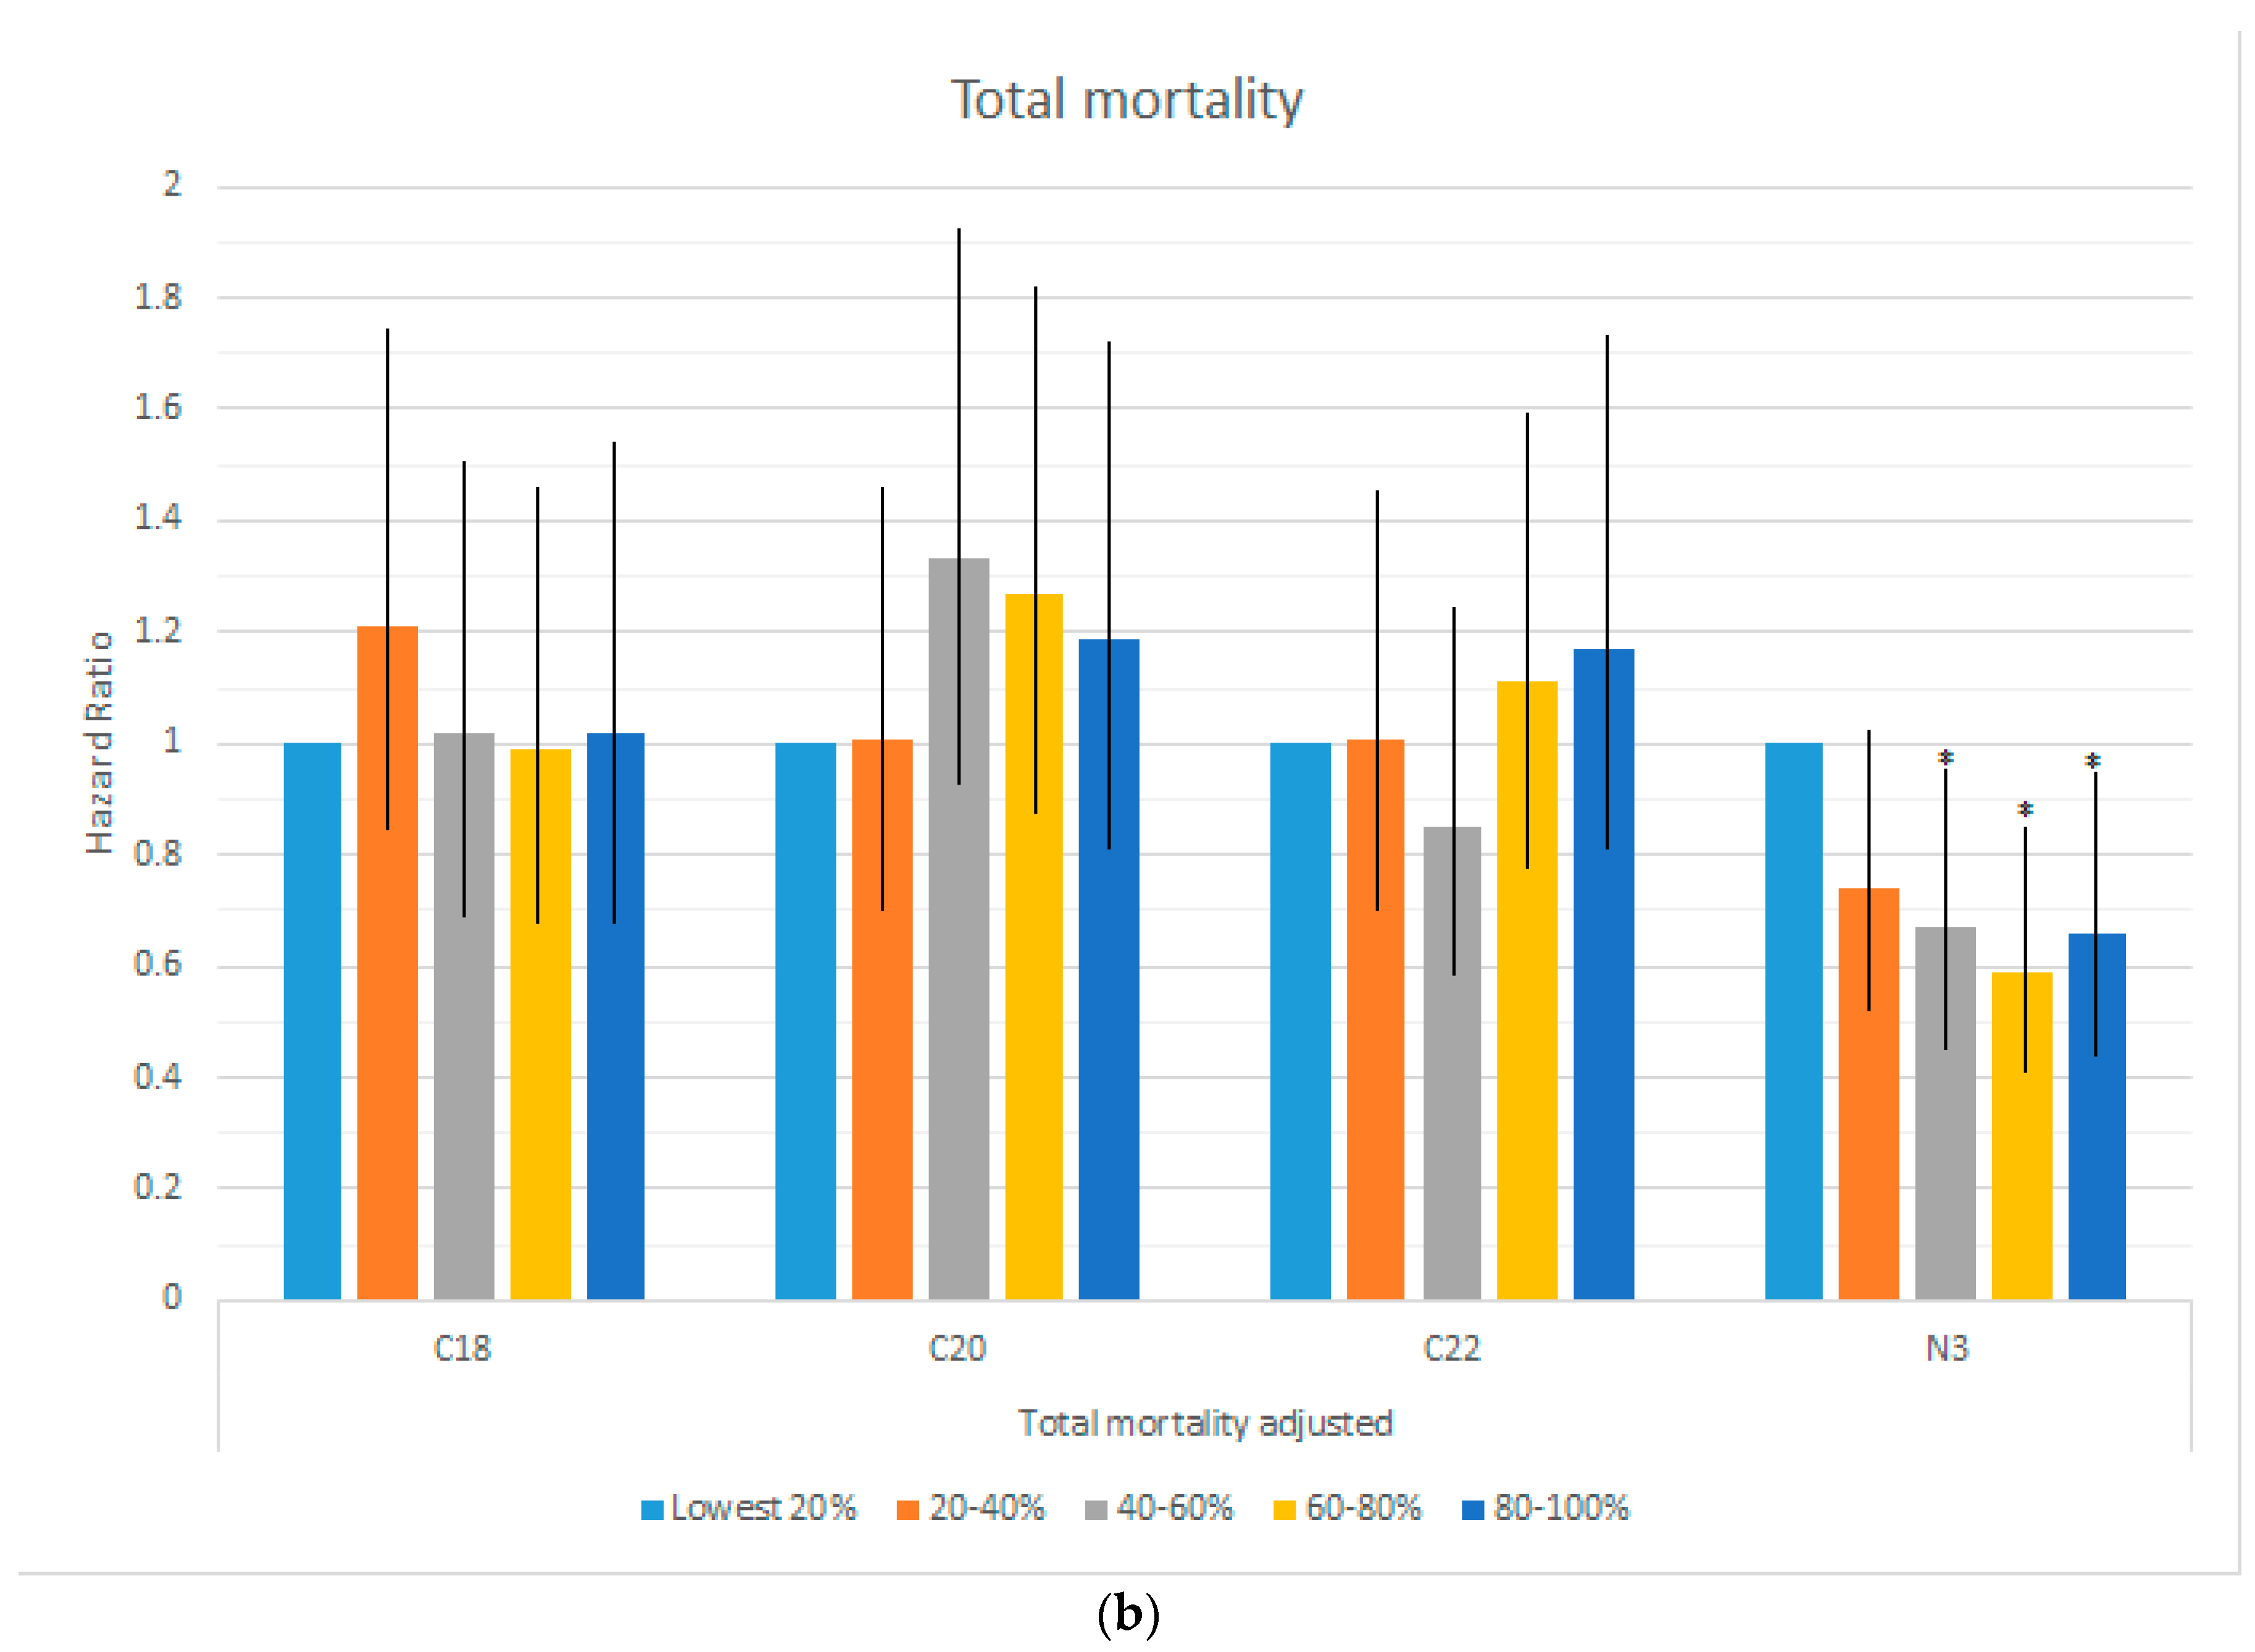
3.2. Omega-6 Fatty Acids and Mortality and Cardiovascular Disease Risk
3.3. Additional Fatty Acid Analyses
4. Discussion
Strengths and Limitations
5. Conclusions
Supplementary Materials
Author Contributions
Funding
Conflicts of Interest
Abbreviations
| ADA | adrenic acid |
| AA | arachidonic acid |
| CVD | cardiovascular disease |
| DGLA | dihomo-gamma linolenic acid |
| DHA | docosahexaenoic acid |
| DPA n-6 | docosapentaenoic acid |
| EDA | eicosadienoic acid |
| EPA | eicosapentaenoic acid |
| FA | fatty acid |
| GLA | gamma-linolenic acid |
| HR | hazard ratio |
| LA | linoleic acid |
| MI | myocardial infarction |
| Omega-3 Index | erythrocyte EPA + DHA |
| PUFA | polyunsaturated FA |
| RBC | red blood cell |
| SD | standard deviation |
References
- Chowdhury, R.; Warnakula, S.; Kunutsor, S.; Crowe, F.; Ward, H.A.; Johnson, L.; Franco, O.H.; Butterworth, A.S.; Forouhi, N.G.; Thompson, S.G.; et al. Association of dietary, circulating, and supplement fatty acids with coronary risk: A systematic review and meta-analysis. Ann. Int. Med. 2014, 160, 398–406. [Google Scholar] [CrossRef]
- Farvid, M.S.; Ding, M.; Pan, A.; Sun, Q.; Chiuve, S.E.; Steffen, L.M.; Willett, W.C.; Hu, F.B. Dietary linoleic acid and risk of coronary heart disease: A systematic review and meta-analysis of prospective cohort studies. Circulation 2014, 130, 1568–1578. [Google Scholar] [CrossRef] [PubMed]
- Wu, J.H.Y.; Marklund, M.; Imamura, F.; Tintle, N.; Korat, A.V.A.; De Goede, J.; Zhou, X.; Yang, W.S.; de Oliveira Otto, M.C.; Kröger, J.; et al. Omega-6 fatty acid biomarkers and incident type 2 diabetes: Pooled analysis of individual-level data for 39 740 adults from 20 prospective cohort studies. Lancet Diabetes Endocrinol. 2017, 5, 965–974. [Google Scholar] [CrossRef]
- Ramsden, C.E.; Zamora, D.; Leelarthaepin, B.; Majchrzak-Hong, S.F.; Faurot, K.R.; Suchindran, C.M.; Ringel, A.; Davis, J.M.; Hibbein, J.R. Use of dietary linoleic acid for secondary prevention of coronary heart disease and death: Evaluation of recovered data from the Sydney Diet Heart Study and updated meta-analysis. BMJ 2013, 346, e8707. [Google Scholar] [CrossRef] [PubMed]
- Blasbalg, T.L.; Hibbeln, J.R.; Ramsden, C.E.; Majchrzak, S.F.; Rawlings, R.R. Changes in consumption of omega-3 and omega-6 fatty acids in the United States during the 20th century. Am. J. Clin. Nutr. 2011, 93, 950–962. [Google Scholar] [CrossRef]
- Lands, B. A critique of paradoxes in current advice on dietary lipids. Prog. Lipid. Res. 2008, 47, 77–106. [Google Scholar] [CrossRef] [PubMed]
- Simopoulos, A.P. The importance of the omega-6/omega-3 fatty acid ratio in cardiovascular disease and other chronic diseases. Exp. Biol. Med. 2008, 233, 674–688. [Google Scholar] [CrossRef]
- Yagi, S.; Aihara, K.I.; Fukuda, D.; Takashima, A.; Bando, M.; Hara, T.; Nishimoto, S.; Ise, T.; Kusunose, K.; Yamaguchi, K.; et al. Reduced ratio of eicosapentaenoic acid and docosahexaenoic acid to arachidonic acid is associated with early onset of acute coronary syndrome. Nutr. J. 2015, 14, 111. [Google Scholar] [CrossRef]
- Harris, W.S. The omega-6/omega-3 ratio and cardiovascular disease risk: Uses and abuses. Curr. Atheroscler. Rep. 2006, 8, 453–459. [Google Scholar] [CrossRef]
- Stanley, J.C.; Elsom, R.L.; Calder, P.C.; Griffin, B.A.; Harris, W.S.; Jebb, S.A.; Lovegrove, J.A.; Moore, C.S.; Riemersma, R.A.; Sanders, T.A.B. UK Food Standards Agency Workshop Report: The effects of the dietary n-6:n-3 fatty acid ratio on cardiovascular health. Br. J. Nutr. 2007, 98, 1305–1310. [Google Scholar] [CrossRef]
- Harris, W.S.; Shearer, G.C. Omega-6 fatty acids and cardiovascular disease: Friend, not foe? Circulation 2014, 130, 1562–1564. [Google Scholar] [CrossRef] [PubMed]
- Harris, W.S. The Omega-6:Omega-3 ratio: A critical appraisal and possible successor. Prostaglandins Leukot. Essent. Fat. Acids 2018, 132, 34–40. [Google Scholar] [CrossRef]
- Mozaffarian, D.; Ascherio, A.; Hu, F.B.; Stampfer, M.J.; Willett, W.C.; Siscovick, D.S.; Rimm, E.B. Interplay Between Different Polyunsaturated Fatty Acids and Risk of Coronary Heart Disease in Men. Circulation 2005, 111, 157–164. [Google Scholar] [CrossRef] [PubMed]
- Johnson, G.H.; Fritsche, K. Effect of dietary linoleic acid on markers of inflammation in healthy persons: A systematic review of randomized controlled trials. J. Acad. Nutr. Diet. 2012, 112, 1029–1041. [Google Scholar] [CrossRef] [PubMed]
- Kakutani, S.; Ishikura, Y.; Tateishi, N.; Horikawa, C.; Tokuda, H.; Kontani, M.; Kawashima, H.; Sakakibara, Y.; Kiso, Y.; Shibata, H.; et al. Supplementation of arachidonic acid-enriched oil increases arachidonic acid contents in plasma phospholipids, but does not increase their metabolites and clinical parameters in Japanese healthy elderly individuals: A randomized controlled study. Lipids Health Dis. 2011, 10, 241. [Google Scholar] [CrossRef] [PubMed]
- Harris, W.S.; von Schacky, C. The Omega-3 Index: A new risk factor for death from coronary heart disease? Prev. Med. 2004, 39, 212–220. [Google Scholar] [CrossRef] [PubMed]
- Harris, W.S.; Tintle, N.L.; Etherton, M.R.; Vasan, R.S. Erythrocyte long-chain omega-3 fatty acid levels are inversely associated with mortality and with incident cardiovascular disease: The Framingham Heart Study. J. Clin. Lipidol. 2018, 12, 718–724. [Google Scholar] [CrossRef] [PubMed]
- Kannel, W.B.; Feinleib, M.; McNamara, P.M.; Garrison, R.J.; Castelli, W.P. An investigation of coronary heart disease in families. The Framingham offspring study. Am. J. Epidemiol. 1979, 110, 281–290. [Google Scholar] [CrossRef] [PubMed]
- Splansky, G.L.; Corey, D.; Yang, Q.; Atwood, L.D.; Cupples, L.A.; Benjamin, E.J.; D'Agostino, R.B., Sr.; Fox, S.C.; Larson, M.G.; Murabito, J.M.; et al. The Third Generation Cohort of the National Heart, Lung, and Blood Institute′s Framingham Heart Study: Design, recruitment, and initial examination. Am. J. Epidemiol. 2007, 165, 1328–1335. [Google Scholar] [CrossRef]
- Harris, W.S.; Pottala, J.V.; Vasan, R.S.; Larson, M.G.; Robins, S.J. Changes in erythrocyte membrane trans and marine fatty acids between 1999 and 2006 in older Americans. J. Nutr. 2012, 142, 1297–1303. [Google Scholar] [CrossRef]
- R. Version 3; Software for Statistical Analysis; The R-Project for Statistical Computing. Available online: www.r-project.org (accessed on 19 December 2018).
- Delgado, G.E.; Marz, W.; Lorkowski, S.; von Schacky, C.; Kleber, M.E. Omega-6 fatty acids: Opposing associations with risk-The Ludwigshafen Risk and Cardiovascular Health Study. J. Clin. Lipidol. 2017, 11, 1082–1090. [Google Scholar] [CrossRef]
- Shearer, G.C.; Pottala, J.V.; Spertus, J.A.; Harris, W.S. Red blood cell fatty acid patterns and acute coronary syndrome. PLoS ONE 2009, 4, e5444. [Google Scholar] [CrossRef] [PubMed]
- Harris, W.S.; Kennedy, K.F.; O′Keefe, J.H., Jr.; Spertus, J.A. Red blood cell fatty acid levels improve GRACE score prediction of 2-yr mortality in patients with myocardial infarction. Int. J. Cardiol. 2013, 168, 53–59. [Google Scholar] [CrossRef]
- Sitkin, S.; Pokrotnieks, J. Alterations in Polyunsaturated Fatty Acid Metabolism and Reduced Serum Eicosadienoic Acid Level in Ulcerative Colitis: Is There a Place for Metabolomic Fatty Acid Biomarkers in IBD? Dig. Dis. Sci. 2018, 63, 2480–2481. [Google Scholar] [CrossRef] [PubMed]
- Forouhi, N.G.; Imamura, F.; Sharp, S.J.; Koulman, A.; Schulze, M.B.; Zheng, J.; Ye, Z.; Sluijs, I.; Guevara, M.; Huerta, J.M.; et al. Association of Plasma Phospholipid n-3 and n-6 Polyunsaturated Fatty Acids with Type 2 Diabetes: The EPIC-InterAct Case-Cohort Study. PLoS Med. 2016, 13, e1002094. [Google Scholar] [CrossRef] [PubMed]
- Shearer, G.C.; Walker, R.E. An overview of the biologic effects of omega-6 oxylipins in humans. Prostaglandins. Leukot. Essent. Fat. Acids 2018, 137, 26–38. [Google Scholar] [CrossRef] [PubMed]
- Harris, W.S.; Thomas, R.M. Biological variability of blood omega-3 biomarkers. Clin. Biochem. 2010, 43, 338–340. [Google Scholar] [CrossRef] [PubMed]
- Harris, W.S.; Kennedy, K.F.; Maddox, T.M.; Kutty, S.; Spertus, J.A. Multiple differences between patients who initiate fish oil supplementation post-myocardial infarction and those who do not: The TRIUMPH Study. Nutr. Res. 2016, 36, 65–71. [Google Scholar] [CrossRef]


| Variable | Died (n = 350) | Still Living (n = 2150) | Total | p-Value for Difference (Chi-Squared or t-Test) |
|---|---|---|---|---|
| % (n) or Mean (SD) | % (n) or Mean (SD) | % (n) or Mean (SD) | ||
| Sex | ||||
| Male | 52.9% (185) | 41.5% (893) | 43.1% (1078) | <0.001 |
| Female | 47.1% (165) | 58.5% (1257) | 56.9% (1422) | |
| Age | 72.9 (8.6) | 64.4 (8.2) | 65.56 (8.76) | <0.001 |
| Body Mass Index (BMI) | 27.9 (5.9) | 28.3 (5.4) | 28.2 (5.4) | <0.001 |
| Marital Status | ||||
| Single/Never Married | 4.3% (15) | 6.7% (144) | 6.4% (159) | <0.001 |
| Married | 63.7% (223) | 70.7% (1519) | 69.7% (1742) | |
| Separated/Divorced | 12.0% (42) | 12.7% (273) | 12.6% (315) | |
| Widowed | 18.3% (64) | 9.4% (203) | 10.7% (267) | |
| Education | ||||
| Some High School (HS) or less | 6.0% (21) | 2.4% (51) | 2.9% (72) | <0.001 |
| HS graduate | 33.7% (118) | 24.8% (533) | 26.0% (651) | |
| Some college or vocational | 22.9% (78) | 21.9% (471) | 22.0% (549) | |
| College graduate | 36.6% (128) | 50.5% (1086) | 48.6% (1214) | |
| Employment | ||||
| Employed | 31.1% (109) | 56.3% (1210) | 52.8% (1319) | <0.001 |
| Disabled/unemployed | 3.1% (11) | 2.5% 53) | 2.6% (64) | |
| Retired | 64.3% (225) | 40.8% (877) | 44.1% (1102) | |
| Health insurance status | ||||
| No insurance | 2.3% (8) | 1.9% (40) | 1.9% (48) | 0.053 |
| Insurance, but no prescription | 11.4% (40) | 8.4% (181) | 8.8% (221) | |
| Full insurance | 84.0% (294) | 88.7% (1906) | 88.0% (2200) | |
| Regular aspirin use | 49.7% (174) | 38.6% (830) | 40.2% (1004) | <0.001 |
| Prevalent hypertension | 57.1% (200) | 42.2% (908) | 44.3% (1108) | <0.001 |
| Cholesterol medication | 41.4% (145) | 36.9% (794) | 37.6% (939) | 0.06 |
| Prevalent diabetes | 22.3% (78) | 11.6% (249) | 13.1% (327) | <0.001 |
| Alcohol consumption | ||||
| None | 34.0% (119) | 23.2% (499) | 24.7% (618) | <0.001 |
| <1 drink/day | 36.0% (126) | 50.7% (1089) | 48.6% (1215) | |
| 1–2 drinks/day | 22.6% (79) | 20.2% (434) | 20.5% (513) | |
| >2 drinks/day | 6.9% (24) | 5.7% (123) | 5.9% (147) | |
| Smoking | ||||
| Not current smoker | 89.1% (312) | 90.5% (1946) | 90.3% (2258) | 0.70 |
| Current | 10.6% (37) | 9.3% (200) | 9.5% (237) | |
| METS | 4.7 (15.4) | 3.3 (8.6) | 3.5 (9.9) | <0.001 |
| Total to High-Density Lipoprotein (HDL) cholesterol ratio | 3.5 (1.1) | 3.5 (1.0) | 3.5 (1.1) | <0.001 |
| Systolic Blood Pressure | 133.6 (19.8) | 128.2 (16.9) | 129.0 (17.4) | <0.001 |
| C-reactive protein | 4.9 (12.7) | 3.0 (6.1) | 3.3 (7.4) | <0.001 |
| Omega-3 index | 0.054 (0.017) | 0.056 (0.017) | 0.0554 (0.0168) | <0.001 |
| (a) | |||||||
| Total Events | Mortality | ||||||
| CVD | CHD | Stroke | CVD | Cancer | Other | Total | |
| HR (95% CI) | HR (95% CI) | HR (95% CI) | HR (95% CI) | HR (95% CI) | HR (95% CI) | HR (95% CI) | |
| A. Unadjusted | |||||||
| <9.8% 18-carbon (n = 433) | 1.0 | 1.0 | 1.0 | 1.0 | 1.0 | 1.0 | 1.0 |
| 9.8%–10.7% (n = 488) | 1.07 (0.71, 1.61) | 1.30 (0.72, 2.35) | 1.28 (0.67, 2.43) | 1.14 (0.45, 2.89) | 0.96 (0.58, 1.58) | 0.56 (0.31, 1.02) | 0.92 (0.64, 1.31) |
| 10.7%–11.5% (n = 522) | 1.05 (0.71, 1.57) | 1.08 (0.59, 1.98) | 1.33 (0.72, 2.43) | 0.86 (0.33, 2.19) | 0.81 (0.48, 1.36) | 0.51 (0.29, 0.92) * | 0.77 (0.54, 1.11) |
| 11.5%–12.5% (n = 522) | 0.74 (0.48, 1.13) | 0.80 (0.42, 1.52) | 0.70 (0.35, 1.38) | 1.74 (0.71, 4.25) | 0.56 (0.32, 1.00) | 0.86 (0.53, 1.39) | 0.94 (0.67, 1.31) |
| >12.5% (n = 535) | 0.73 (0.48, 1.13) | 1.01 (0.56, 1.81) | 0.80 (0.39, 1.63) | 0.57 (0.22, 1.53) | 0.74 (0.43, 1.25) | 0.52 (0.29, 0.93) * | 0.74 (0.52, 1.06) |
| p-value for linear trend | 0.032 * | 0.45 | 0.15 | 0.26 | 0.08 | 0.17 | 0.14 |
| B. Adjusted for demos | |||||||
| <9.8% 18-carbon (n = 433) | 1.0 | 1.0 | 1.0 | 1.0 | 1.0 | 1.0 | 1.0 |
| 9.8%–10.7% (n = 488) | 1.28 (0.83, 1.95) | 1.42 (0.76, 2.67) | 1.46 (0.71, 3.00) | 1.19 (0.48, 2.96) | 1.09 (0.63, 1.88) | 0.87 (0.47, 1.60) | 1.21 (0.84, 1.73) |
| 10.7%–11.5% (n = 522) | 1.37 (0.90, 2.08) | 1.38 (0.74, 2.56) | 1.51 (0.77, 2.96) | 1.12 (0.42, 2.97) | 0.89 (0.49, 1.61) | 0.83 (0.45, 1.56) | 1.02 (0.69, 1.50) |
| 11.5%–12.5% (n = 522) | 0.78 (0.48, 1.27) | 0.96 (0.46, 2.02) | 0.72 (0.33, 1.61) | 1.59 (0.67, 3.75) | 0.65 (0.35, 1.20) | 1.02 (0.58, 1.80) | 0.99 (0.68, 1.44) |
| >12.5% (n = 535) | 1.16 (0.72, 1.89) | 1.53 (0.75, 3.13) | 1.12 (0.52, 2.40) | 0.96 (0.33, 2.80) | 0.88 (0.47, 1.65) | 0.62 (0.29, 1.33) | 1.02 (0.68, 1.53) |
| p-value for linear trend | 0.68 | 0.59 | 0.49 | 0.68 | 0.30 | 0.42 | 0.69 |
| C. Adjusted for demos and O3I | |||||||
| <9.8% 18-carbon (n = 433) | 1.0 | 1.0 | 1.0 | 1.0 | 1.0 | 1.0 | 1.0 |
| 9.8%–10.7% (n = 488) | 1.19 (0.78, 1.82) | 1.32 (0.70, 2.49) | 1.29 (0.62, 2.66) | 1.08 (0.43, 2.73) | 1.07 (0.62, 1.87) | 0.74 (0.39, 1.41) | 1.14 (0.79, 1.64) |
| 10.7%–11.5% (n = 522) | 1.28 (0.84, 1.95) | 1.28 (0.69, 2.38) | 1.34 (0.67, 2.65) | 1.04 (0.38, 2.78) | 0.87 (0.47, 1.61) | 0.71 (0.38, 1.34) | 0.95 (0.64, 1.41) |
| 11.5%–12.5% (n = 522) | 0.71 (0.44, 1.16) | 0.86 (0.41, 1.79) | 0.62 (0.28, 1.39) | 1.49 (0.65, 3.44) | 0.64 (0.34, 1.19) | 0.83 (0.46, 1.50) | 0.92 (0.63, 1.34) |
| >12.5% (n = 535) | 1.03 (0.63, 1.67) | 1.32 (0.64, 2.73) | 0.93 (0.43, 2.03) | 0.78 (0.26, 2.34) | 0.86 (0.45, 1.63) | 0.52 (0.24, 1.11) | 0.92 (0.61, 1.40) |
| p-value for linear trend | 0.34 | 0.92 | 0.23 | 0.87 | 0.28 | 0.18 | 0.38 |
| p-value for omega-3 | 0.005 ** | 0.034 * | 0.004 ** | 0.10 | 0.70 | 0.004 ** | 0.011 |
| (b) | |||||||
| Total Events | Mortality | ||||||
| CVD | CHD | Stroke | CVD | Cancer | Other | Total | |
| HR (95% CI) | HR (95% CI) | HR (95% CI) | HR (95% CI) | HR (95% CI) | HR (95% CI) | HR (95% CI) | |
| A. Unadjusted | |||||||
| <17.5% 20-carbon (n = 508) | 1.0 | 1.0 | 1.0 | 1.0 | 1.0 | 1.0 | 1.0 |
| 17.5%–18.4% (n = 509) | 1.03 (0.71, 1.50) | 0.95 (0.53, 1.70) | 0.96 (0.54, 1.70) | 1.19 (0.54, 2.62) | 0.80 (0.48, 1.32) | 0.84 (0.49, 1.46) | 0.89 (0.65, 1.22) |
| 18.4%–19.1% (n = 502) | 0.92 (0.61, 1.39) | 0.95 (0.52, 1.71) | 0.78 (0.41, 1.49) | 0.83 (0.31, 2.20) | 0.90 (0.53, 1.53) | 1.59 (0.94, 2.67) | 1.16 (0.83, 1.63) |
| 19.1%–19.9% (n = 502) | 0.88 (0.58, 1.33) | 1.22 (0.71, 2.09) | 0.63 (0.32, 1.24) | 1.24 (0.55, 2.80) | 0.87 (0.52, 1.46) | 1.19 (0.67, 2.09) | 1.02 (0.73, 1.42) |
| >19.9% (n = 479) | 1.03 (0.70, 1.52) | 0.99)0.55, 1.77) | 1.04 (0.59, 1.82) | 0.77 (0.37, 1.60) | 0.92 (0.55, 1.53) | 1.14 (0.65, 2.01) | 0.95 (0.69, 1.33) |
| p-value for linear trend | 0.82 | 0.71 | 0.68 | 0.54 | 0.83 | 0.32 | 0.90 |
| B. Adjusted for demos | |||||||
| <17.5% 20-carbon (n = 508) | 1.0 | 1.0 | 1.0 | 1.0 | 1.0 | 1.0 | 1.0 |
| 17.5%–18.4% (n = 509) | 1.10 (0.74, 1.65) | 0.96 (0.52, 1.75) | 1.19 (0.62, 2.30) | 1.58 (0.61, 4.11) | 0.84 (0.49, 1.42) | 0.86 (0.45, 1.67) | 1.01 (0.71, 1.44) |
| 18.4%–19.1% (n = 502) | 0.96 (0.61, 1.51) | 0.93 (0.49, 1.79) | 1.09 (0.54, 2.21) | 1.23 (0.38, 4.02) | 0.98 (0.53, 1.81) | 1.91 (1.08, 3.36) * | 1.33 (0.92, 1.92) |
| 19.1%–19.9% (n = 502) | 1.04 (0.67, 1.61) | 1.29 (0.71, 2.36) | 0.88 (0.43, 1.80) | 1.98 (0.75, 5.19) | 1.02 (0.58 1.78) | 1.45 (0.77, 2.70) | 1.27 (0.88, 1.81) |
| >19.9% (n = 479) | 1.21 (0.78, 1.88) | 1.06 (0.56, 2.02) | 1.48 (0.75, 2.92) | 1.19 (0.44, 3.21) | 1.21 (0.69, 2.13) | 1.40 (0.75, 2.61) | 1.19 (0.82, 1.73) |
| p-value for linear trend | 0.52 | 0.52 | 0.53 | 0.55 | 0.42 | 0.11 | 0.16 |
| C. Adjusted for demos and O3I | |||||||
| <17.5% 20-carbon (n = 508) | 1.0 | 1.0 | 1.0 | 1.0 | 1.0 | 1.0 | 1.0 |
| 17.5%–18.4% (n = 509) | 0.97 (0.65, 1.46) | 0.84 (0.46, 1.51) | 0.96 (0.50, 1.86) | 1.30 (0.47, 3.61) | 0.84 (0.49, 1.44) | 0.77 (0.40, 1.51) | 0.94 (0.65, 1.36) |
| 18.4%–19.1% (n = 502) | 0.81 (0.51, 1.30) | 0.77 (0.39, 1.51) | 0.82 (0.39, 1.72) | 0.99 (0.28, 3.55) | 0.99 (0.52, 1.88) | 1.62 (0.92, 2.86) | 1.19 (0.81, 1.75) |
| 19.1%–19.9% (n = 502) | 0.85 (0.53, 1.34) | 1.03 (0.55, 1.91) | 0.61 (0.28, 1.33) | 1.55 (0.56, 4.30) | 1.03 (0.57, 1.86) | 1.17 (0.60, 2.27) | 1.12 (0.76, 1.65) |
| >19.9% (n = 479) | 0.97 (0.60, 1.56) | 0.82 (0.41, 1.65) | 1.03 (0.49, 2.15) | 0.85 (0.27, 2.72) | 1.23 (0.67, 2.26) | 1.12 (0.58, 2.16) | 1.04 (0.70, 1.56) |
| p-value for linear trend | 0.72 | 0.87 | 0.91 | 0.89 | 0.42 | 0.44 | 0.58 |
| p-value for omega-3 | 0.011 * | 0.039 * | 0.009 ** | 0.13 | 0.87 | 0.03 * | 0.04 * |
| (c) | |||||||
| Total Events | Mortality | ||||||
| CVD | CHD | Stroke | CVD | Cancer | Other | Total | |
| HR (95% CI) | HR (95% CI) | HR (95% CI) | HR (95% CI) | HR (95% CI) | HR (95% CI) | HR (95% CI) | |
| A. Unadjusted | |||||||
| <3.6% 22-carbon (n = 508) | 1.0 | 1.0 | 1.0 | 1.0 | 1.0 | 1.0 | 1.0 |
| 3.6%–4.3% (n = 508) | 1.37 (0.88, 2.12) | 1.24 (0.63, 2.43) | 1.25 (0.62, 2.53) | 0.93 (0.42, 2.03) | 0.86 (0.52, 1.42) | 1.11 (0.64, 1.93) | 0.96 (0.69, 1.31) |
| 4.3%–4.7% (n = 500) | 1.73 (1.14, 2.62) ** | 2.43 (1.34, 4.42) ** | 1.36 (0.71, 2.61) | 0.81 (0.35, 1.83) | 0.65 (0.38, 1.13) | 0.96 (0.53, 1.73) | 0.80 (0.57, 1.13) |
| 4.7%–5.3% (n = 509) | 1.46 (0.96, 2.22) | 1.61 (0.86, 3.03) | 1.58 (0.83, 2.98) | 1.16 (0.54, 2.49) | 0.78 (0.46, 1.31) | 1.27 (0.72, 2.26) | 1.04 (0.75, 1.45) |
| >5.3% (n = 469) | 1.73 (1.12, 2.68) * | 2.25 (1.22, 4.16) ** | 1.48 (0.74, 2.98) | 0.63 (0.24, 1.67) | 1.18 (0.71, 1.95) | 1.43 (0.82, 2.50) | 1.10 (0.77, 1.56) |
| p-value for linear trend | 0.02 * | 0.006 ** | 0.18 | 0.57 | 0.74 | 0.17 | 0.48 |
| B. Adjusted for demos | |||||||
| <3.6% 22-carbon (n = 508) | 1.0 | 1.0 | 1.0 | 1.0 | 1.0 | 1.0 | 1.0 |
| 3.6%–4.3% (n = 508) | 1.20 (0.75, 1.93) | 1.05 (0.50, 2.20) | 1.39 (0.62, 3.13) | 0.83 (0.28, 2.41) | 0.94 (0.56, 1.60) | 1.06 (0.60, 1.88) | 1.01 (0.71, 1.44) |
| 4.3%–4.7% (n = 500) | 1.74 (1.13, 2.67) * | 2.38 (1.26,4.48) ** | 1.73 (0.85, 3.55) | 0.65 (0.26, 1.62) | 0.74 (0.41, 1.32) | 0.85 (0.41, 1.76) | 0.85 (0.58, 1.25) |
| 4.7%–5.3% (n = 509) | 1.36 (0.87, 2.13) | 1.51 (0.76, 2.99) | 1.89 (0.92, 3.87) | 1.28 (0.62, 2.62) | 0.74 (0.41, 1.31) | 1.31 (0.68, 2.51) | 1.11 (0.78, 1.59) |
| >5.3% (n = 469) | 1.66 (1.02, 2.69) * | 1.91 (0.95, 3.83) | 2.01 (0.92, 4.42) | 0.60 (0.18, 2.01) | 1.21 (0.71, 2.07) | 1.53 (0.85, 2.74) | 1.17 (0.81, 1.71) |
| p-value for linear trend | 0.031 * | 0.04 * | 0.04 * | 0.80 | 0.91 | 0.10 | 0.32 |
| C. Adjusted for demos and O3I | |||||||
| <3.6% 22-carbon (n = 508) | 1.0 | 1.0 | 1.0 | 1.0 | 1.0 | 1.0 | 1.0 |
| 3.6%–4.3% (n = 508) | 1.11 (0.69, 1.79) | 0.99 (0.48, 2.05) | 1.20 (0.53, 2.69) | 0.62 (0.20, 1.95) | 0.93 (0.54, 1.60) | 0.89 (0.48, 1.63) | 0.89 (0.62, 1.29) |
| 4.3%–4.7% (n = 500) | 1.52 (0.96, 2.39) | 2.09 (1.07, 4.06) * | 1.35 (0.65, 2.80) | 0.42 (0.17, 1.06) | 0.72 (0.38, 1.36) | 0.67 (0.32, 1.42) | 0.69 (0.45, 1.05) |
| 4.7%–5.3% (n = 509) | 1.14 (0.70, 1.86) | 1.25 (0.60, 2.62) | 1.37 (0.64, 2.97) | 0.69 (0.27, 1.76) | 0.71 (0.38, 1.34) | 0.97 (0.48, 1.94) | 0.87 (0.58, 1.30) |
| >5.3% (n = 469) | 1.33 (0.77, 2.28) | 1.51 (0.69, 3.30) | 1.38 (0.60, 3.18) | 0.30 (0.07, 1.26) | 1.15 (0.57, 2.33) | 0.98 (0.48, 1.98) | 0.85 (0.54, 1.34) |
| p-value for linear trend | 0.42 | 0.34 | 0.44 | 0.14 | 0.97 | 0.88 | 0.57 |
| p-value for omega-3 | 0.09 | 0.22 | 0.049 * | 0.034 * | 0.92 | 0.03 * | 0.021 * |
© 2018 by the authors. Licensee MDPI, Basel, Switzerland. This article is an open access article distributed under the terms and conditions of the Creative Commons Attribution (CC BY) license (http://creativecommons.org/licenses/by/4.0/).
Share and Cite
Harris, W.S.; Tintle, N.L.; Ramachandran, V.S. Erythrocyte n-6 Fatty Acids and Risk for Cardiovascular Outcomes and Total Mortality in the Framingham Heart Study. Nutrients 2018, 10, 2012. https://doi.org/10.3390/nu10122012
Harris WS, Tintle NL, Ramachandran VS. Erythrocyte n-6 Fatty Acids and Risk for Cardiovascular Outcomes and Total Mortality in the Framingham Heart Study. Nutrients. 2018; 10(12):2012. https://doi.org/10.3390/nu10122012
Chicago/Turabian StyleHarris, William S., Nathan L. Tintle, and Vasan S. Ramachandran. 2018. "Erythrocyte n-6 Fatty Acids and Risk for Cardiovascular Outcomes and Total Mortality in the Framingham Heart Study" Nutrients 10, no. 12: 2012. https://doi.org/10.3390/nu10122012
APA StyleHarris, W. S., Tintle, N. L., & Ramachandran, V. S. (2018). Erythrocyte n-6 Fatty Acids and Risk for Cardiovascular Outcomes and Total Mortality in the Framingham Heart Study. Nutrients, 10(12), 2012. https://doi.org/10.3390/nu10122012