Effects of Meal Timing on Postprandial Glucose Metabolism and Blood Metabolites in Healthy Adults

Abstract
1. Introduction
2. Materials and Methods
2.1. Participants
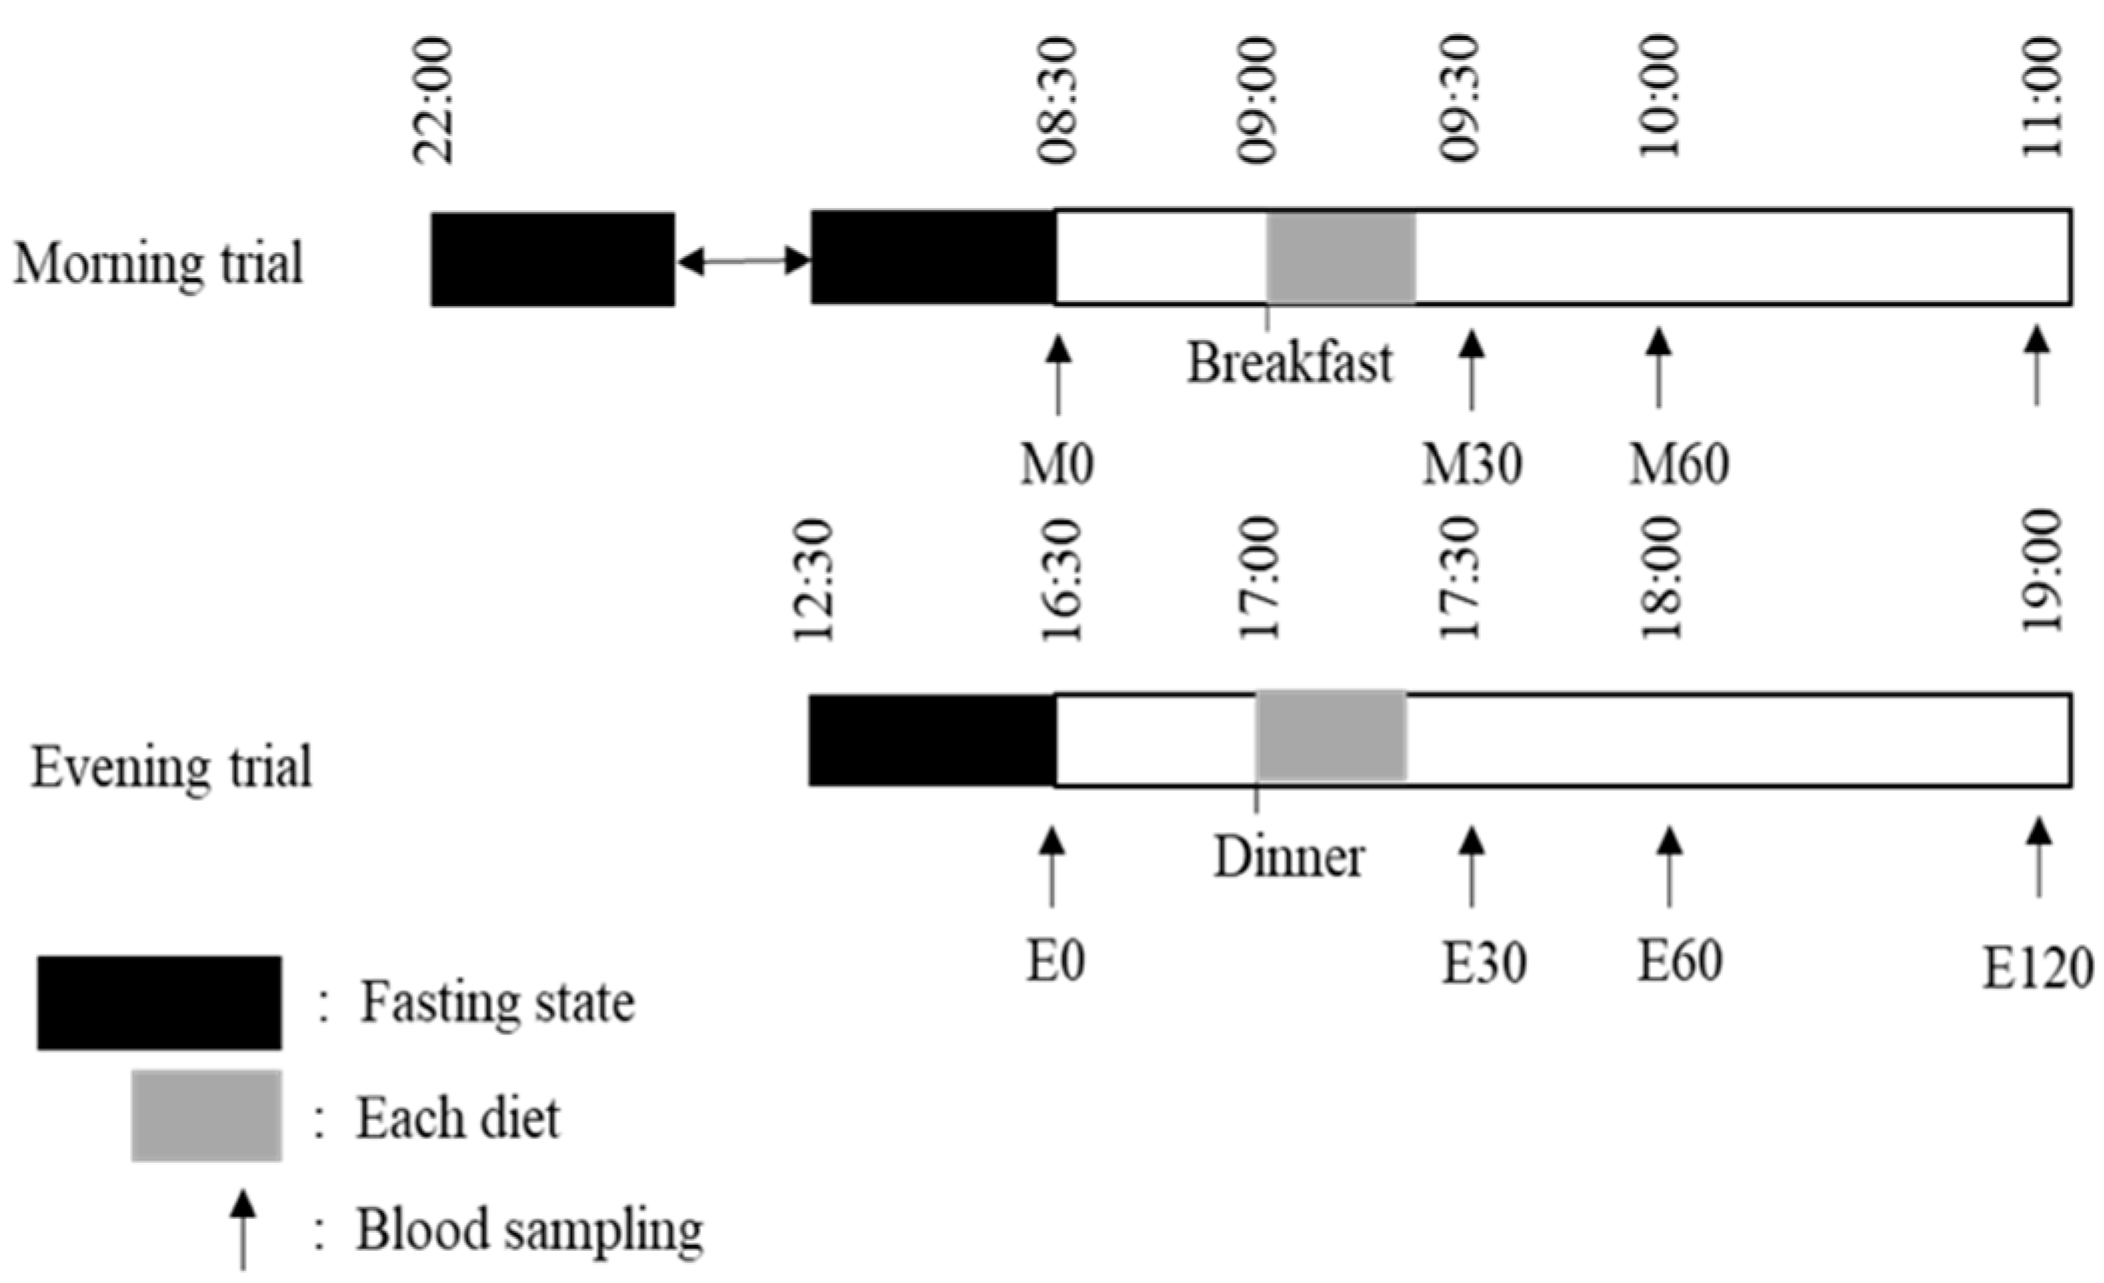
2.2. Main Trials
2.3. Test Meals
2.4. Standardization of the Meal and Physical Activity
2.5. Blood Collection and Analysis
2.6. Blood Metabolome Analysis
2.7. Assessment of Blood Parameters and Insulin Sensitivity
2.8. Statistical Analysis
3. Results
3.1. Fasting Physical Characteristics and Blood Glucose, Insulin, GIP and GLP-1 Levels
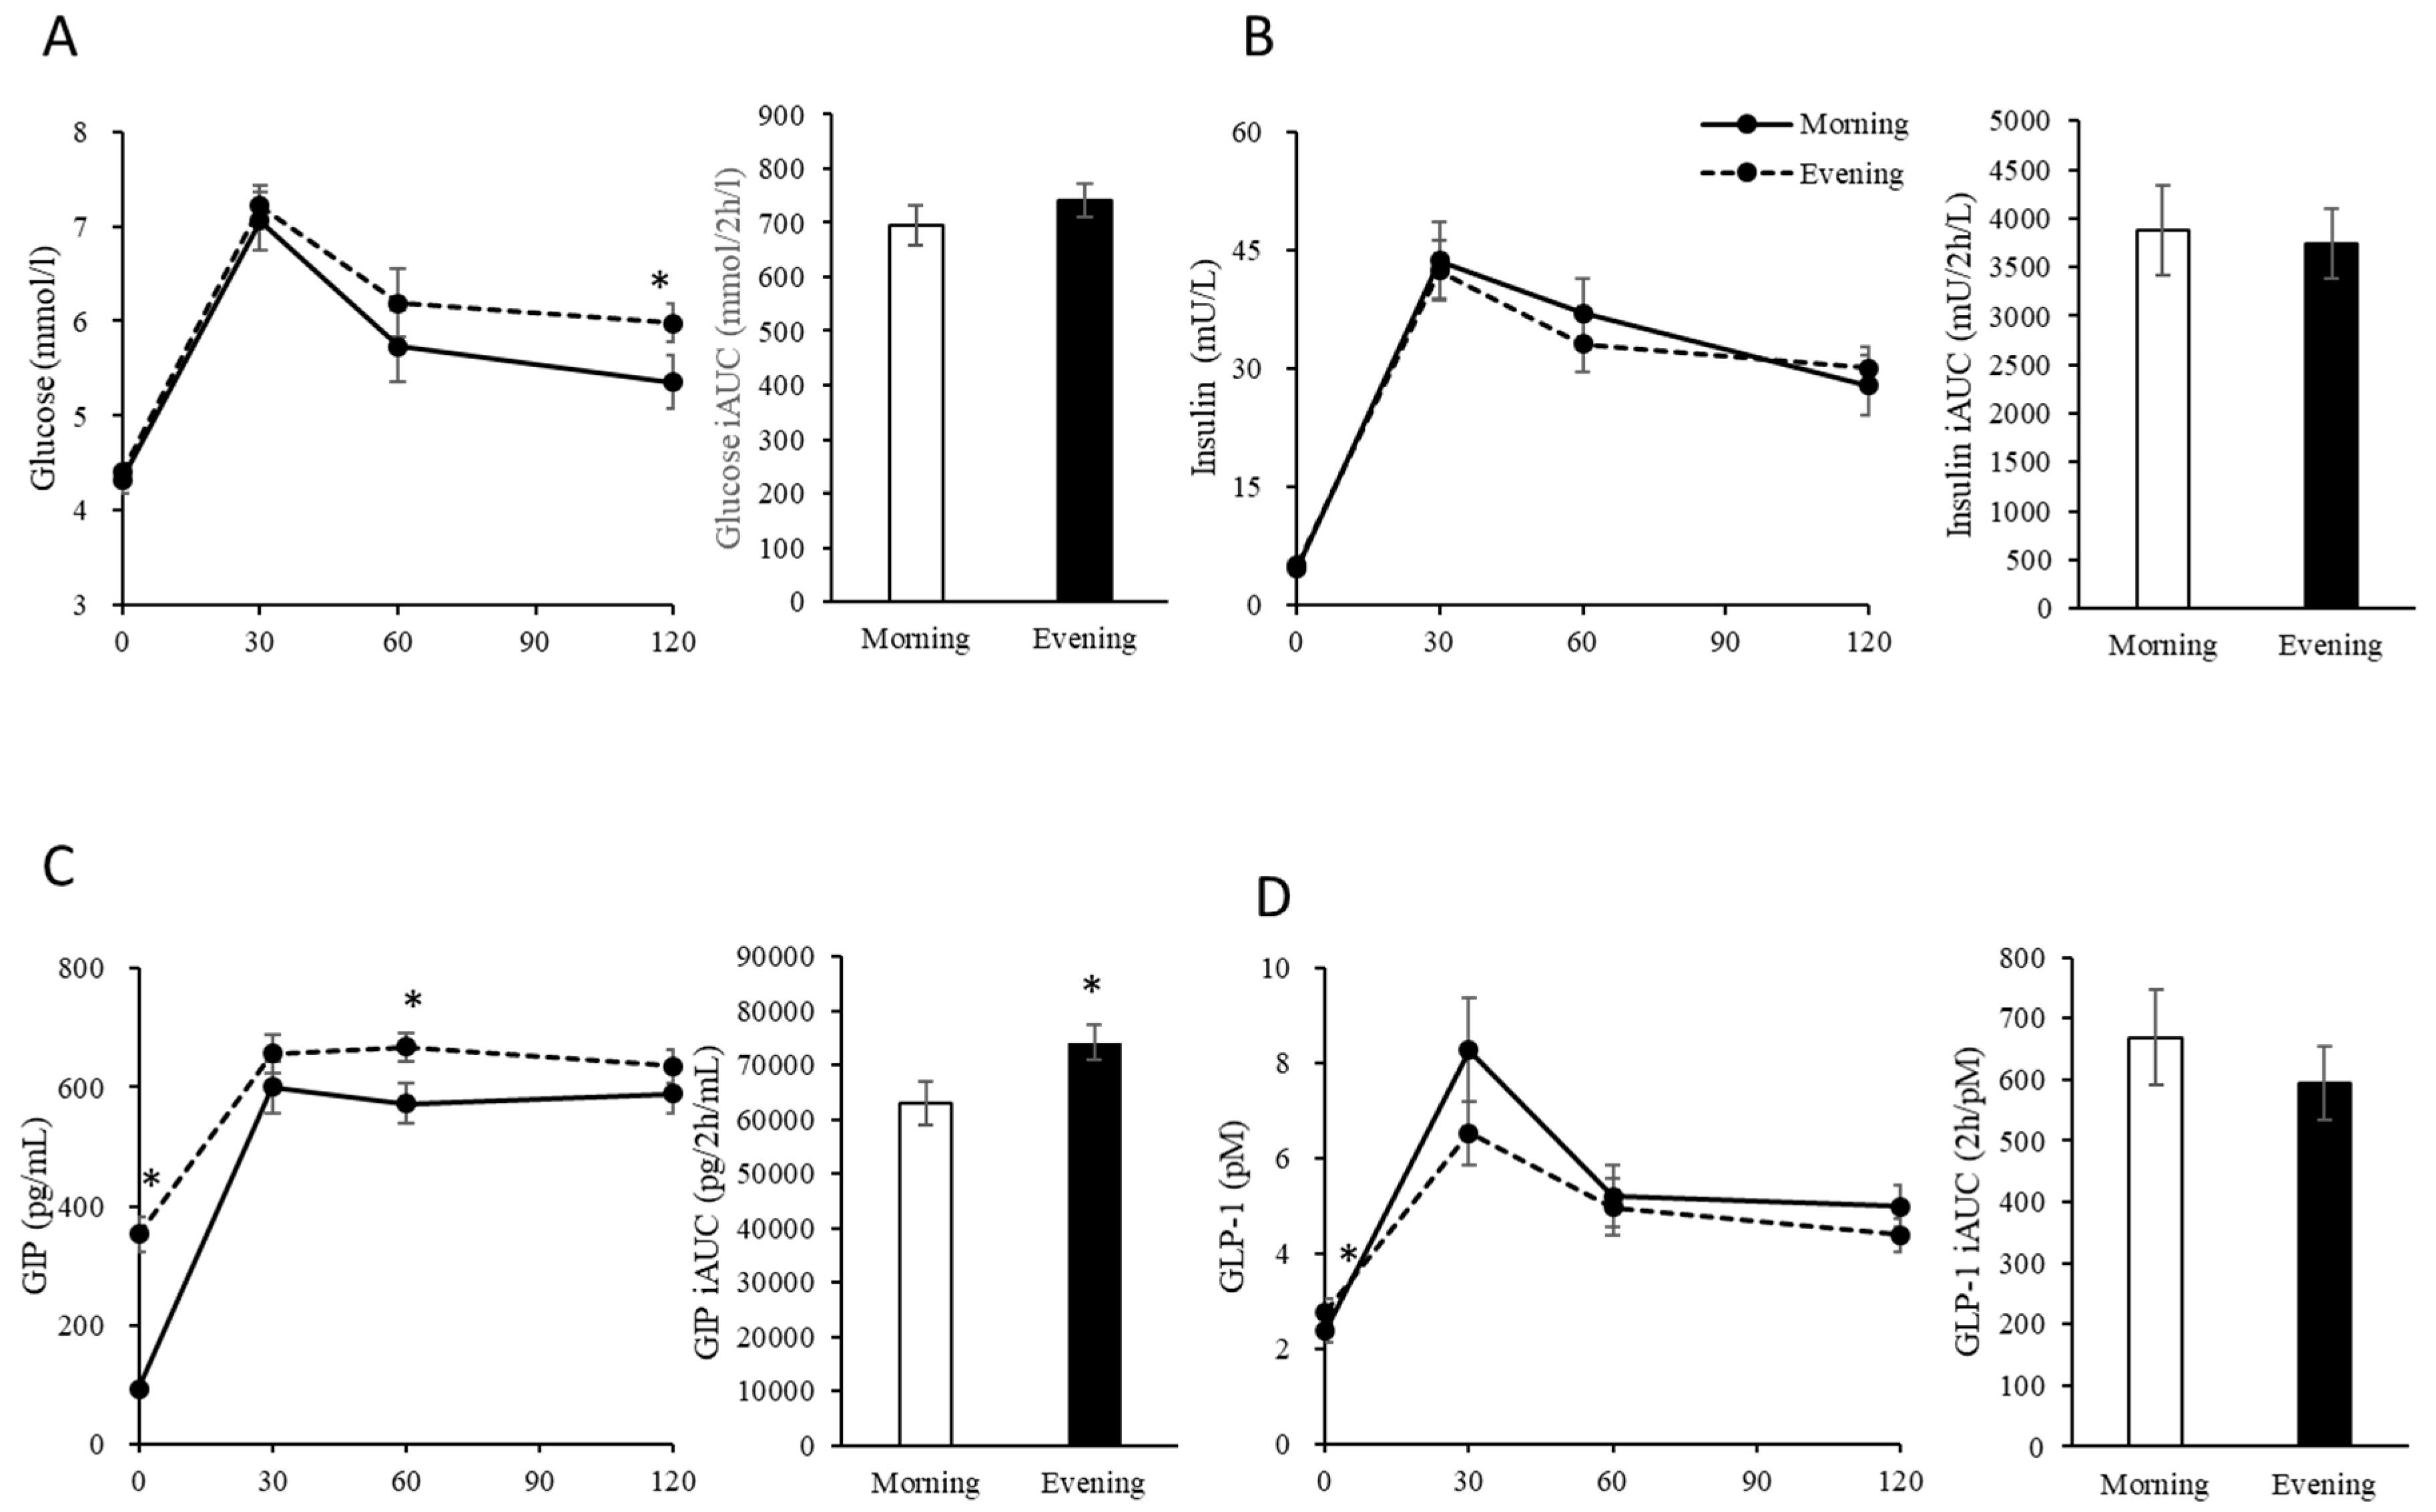
3.2. Postprandial Blood Glucose, Insulin, GIP and GLP-1 Levels
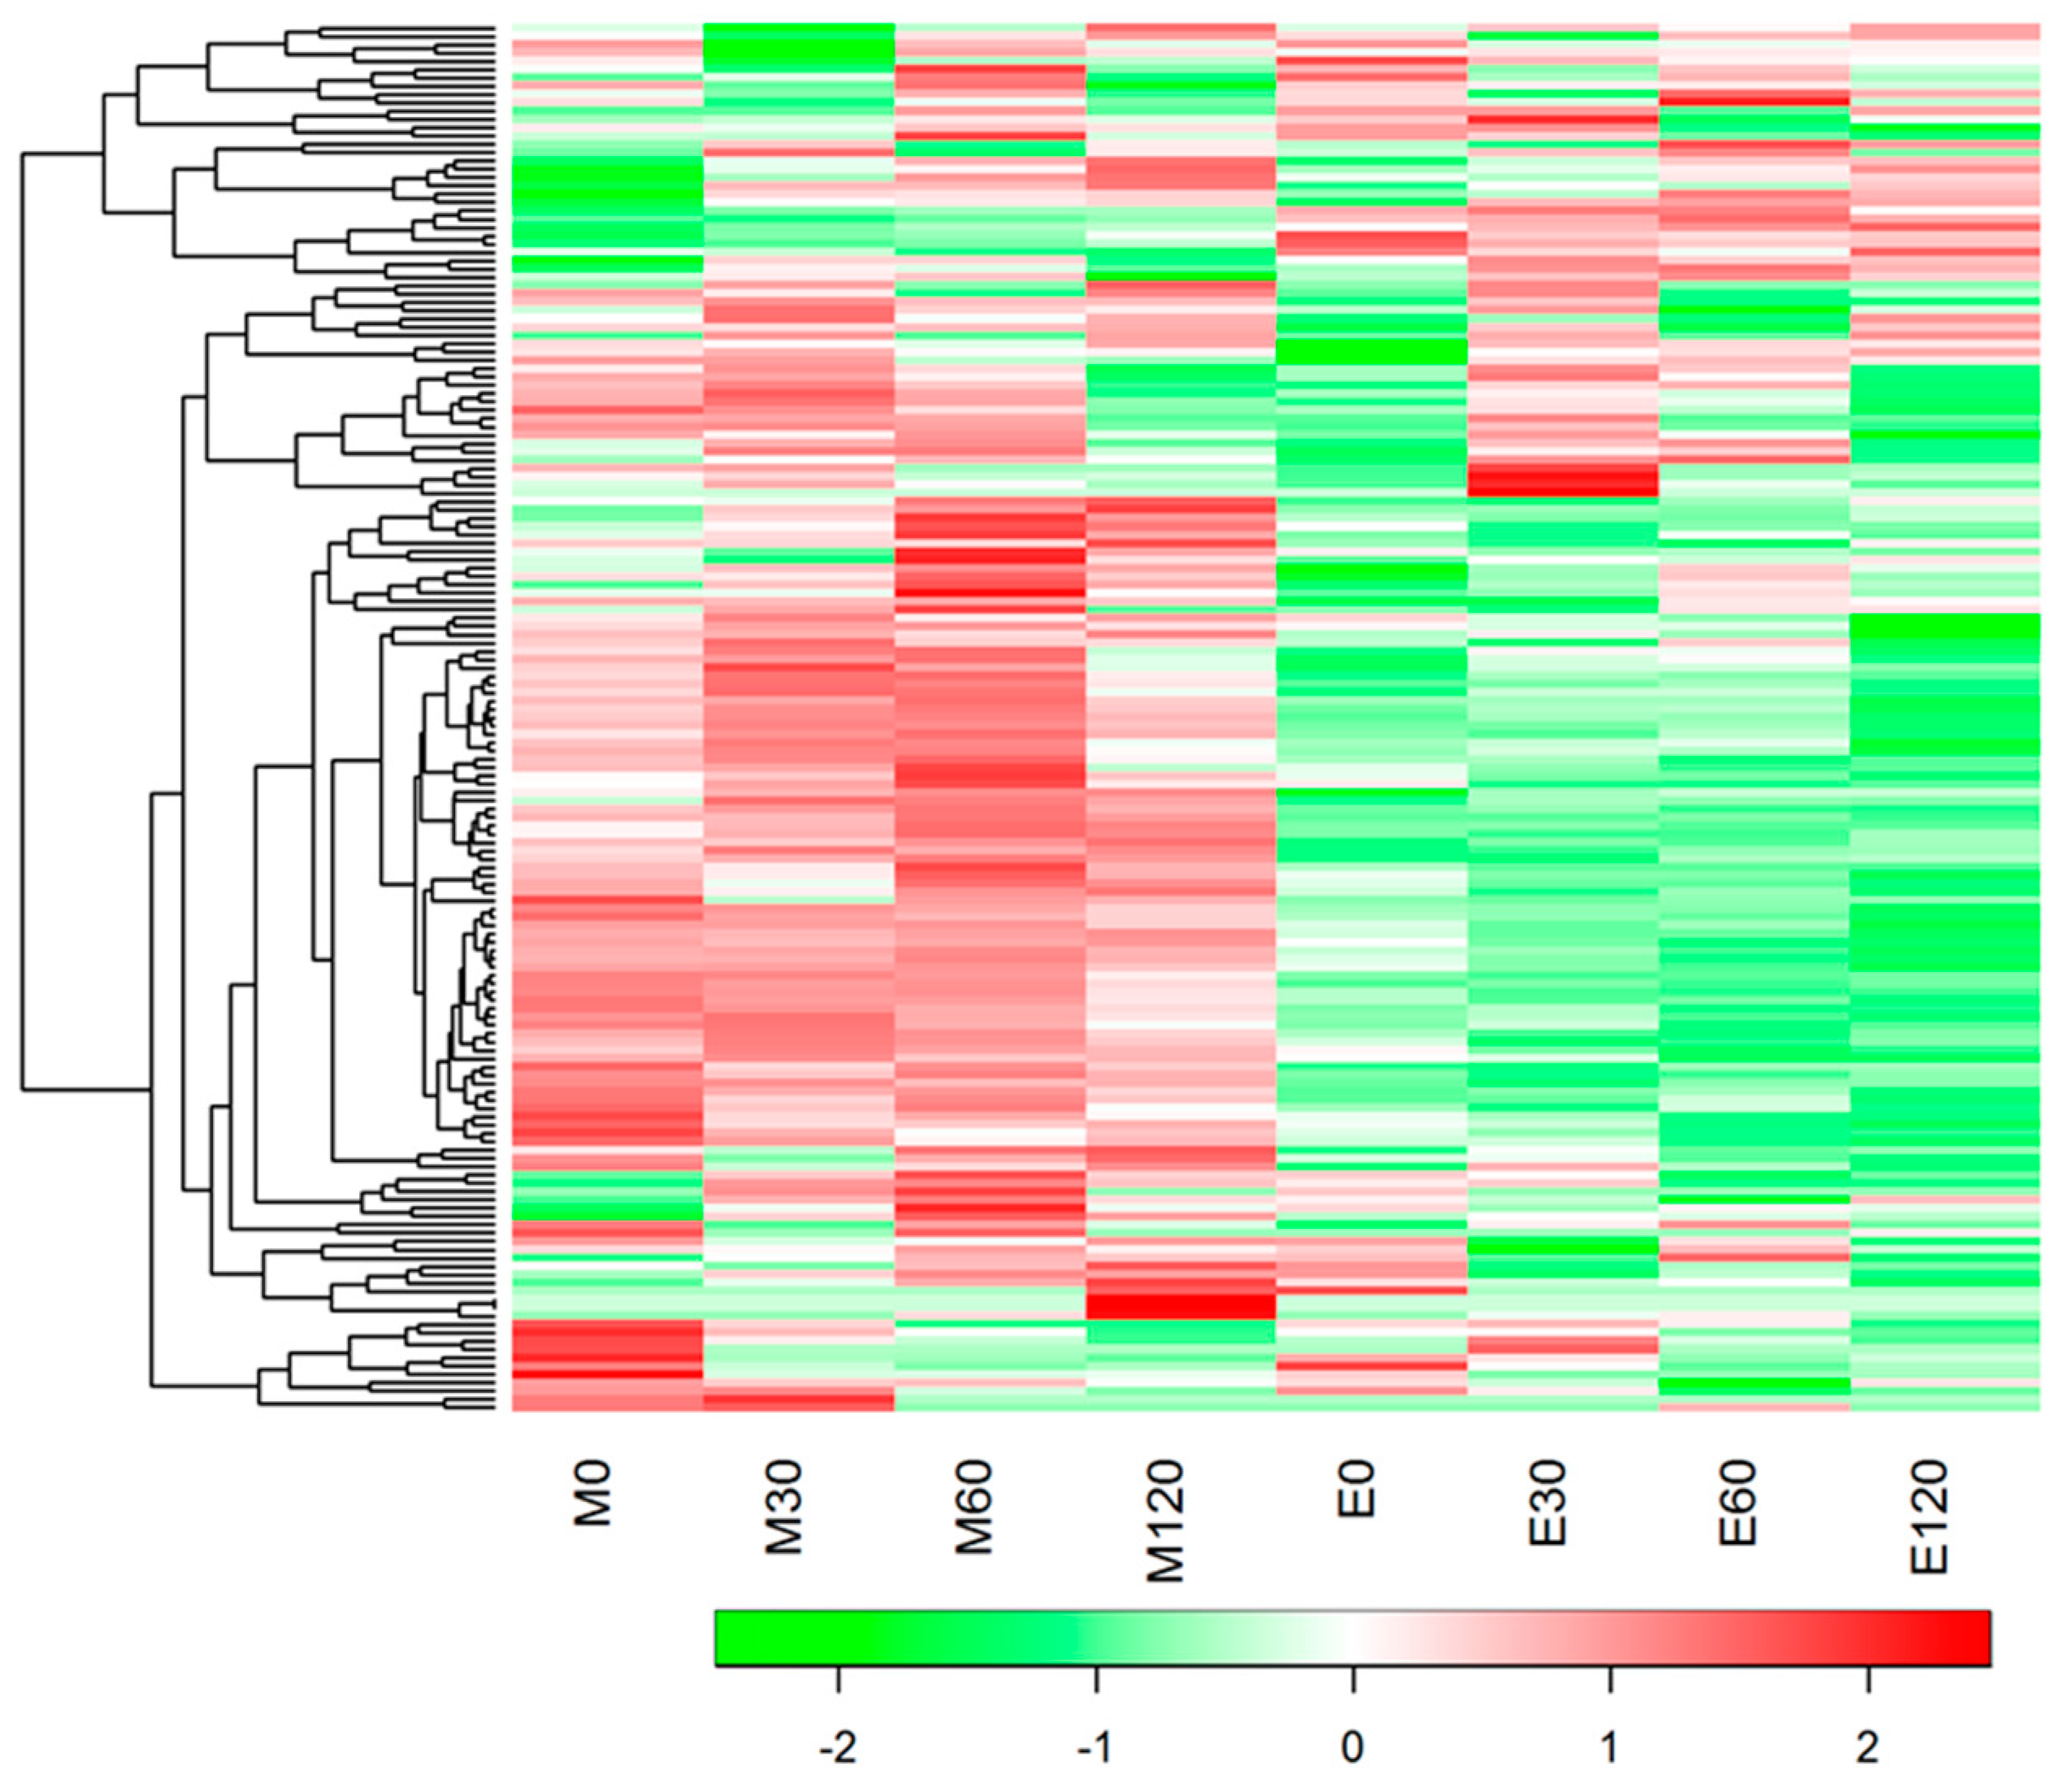
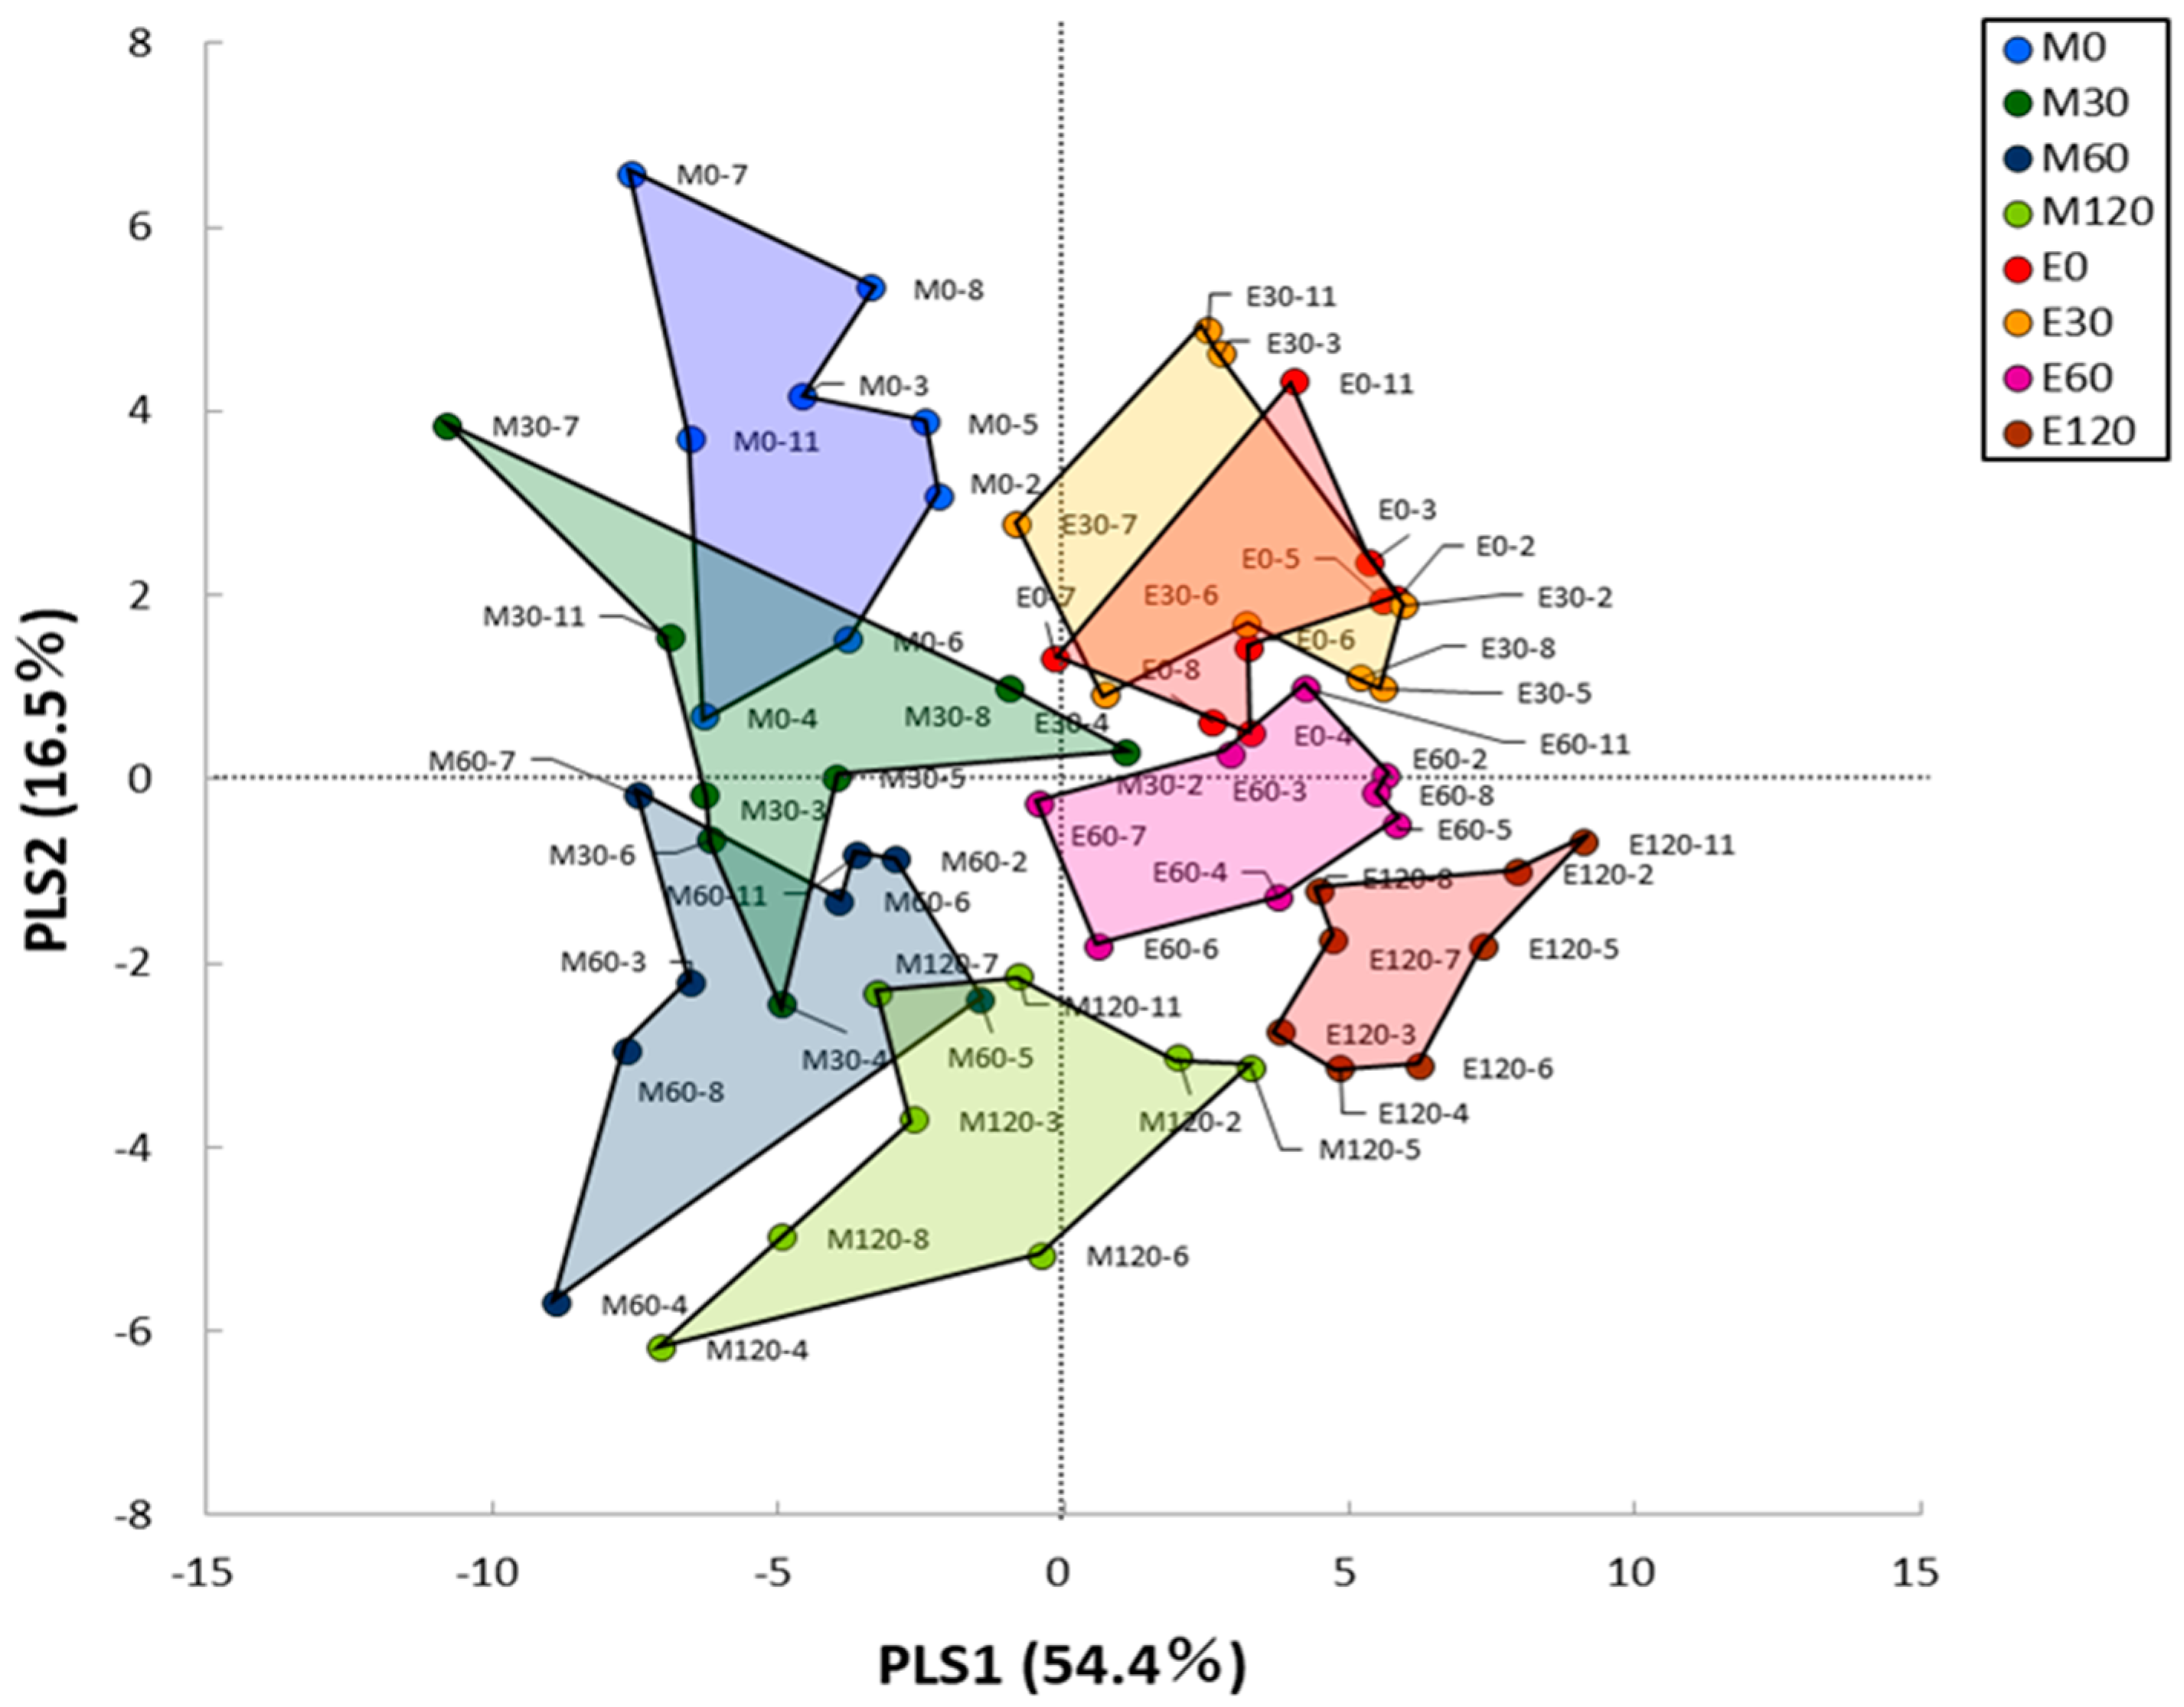
3.3. HCA and PLS Analysis of Blood Metabolome Data
3.4. Fasting Blood Metabolome Data
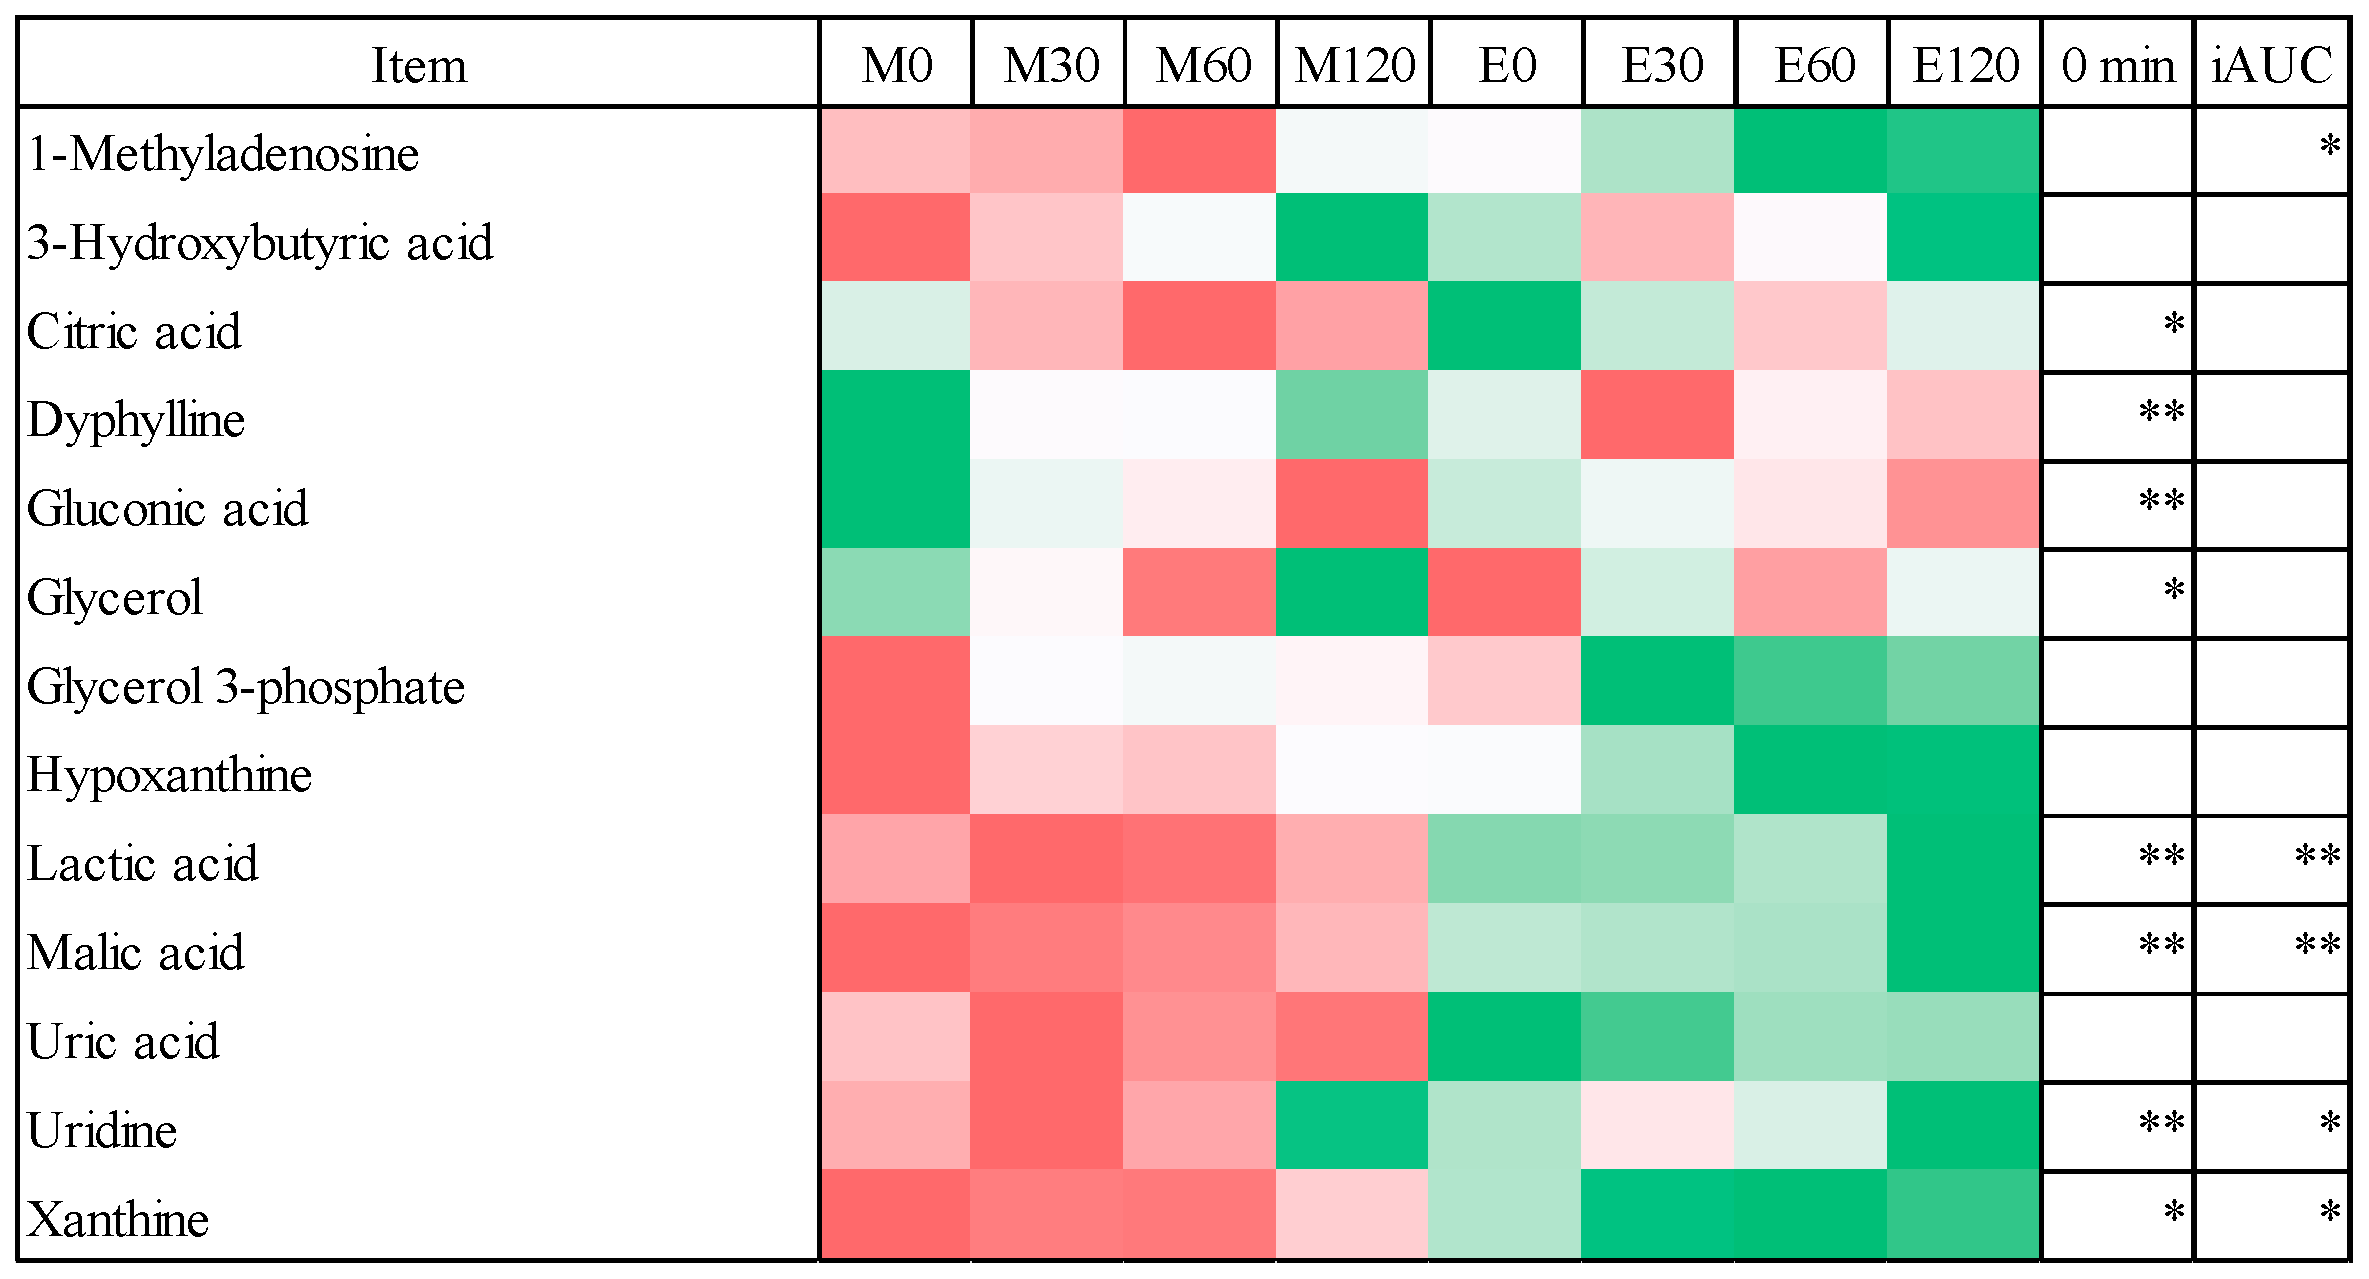
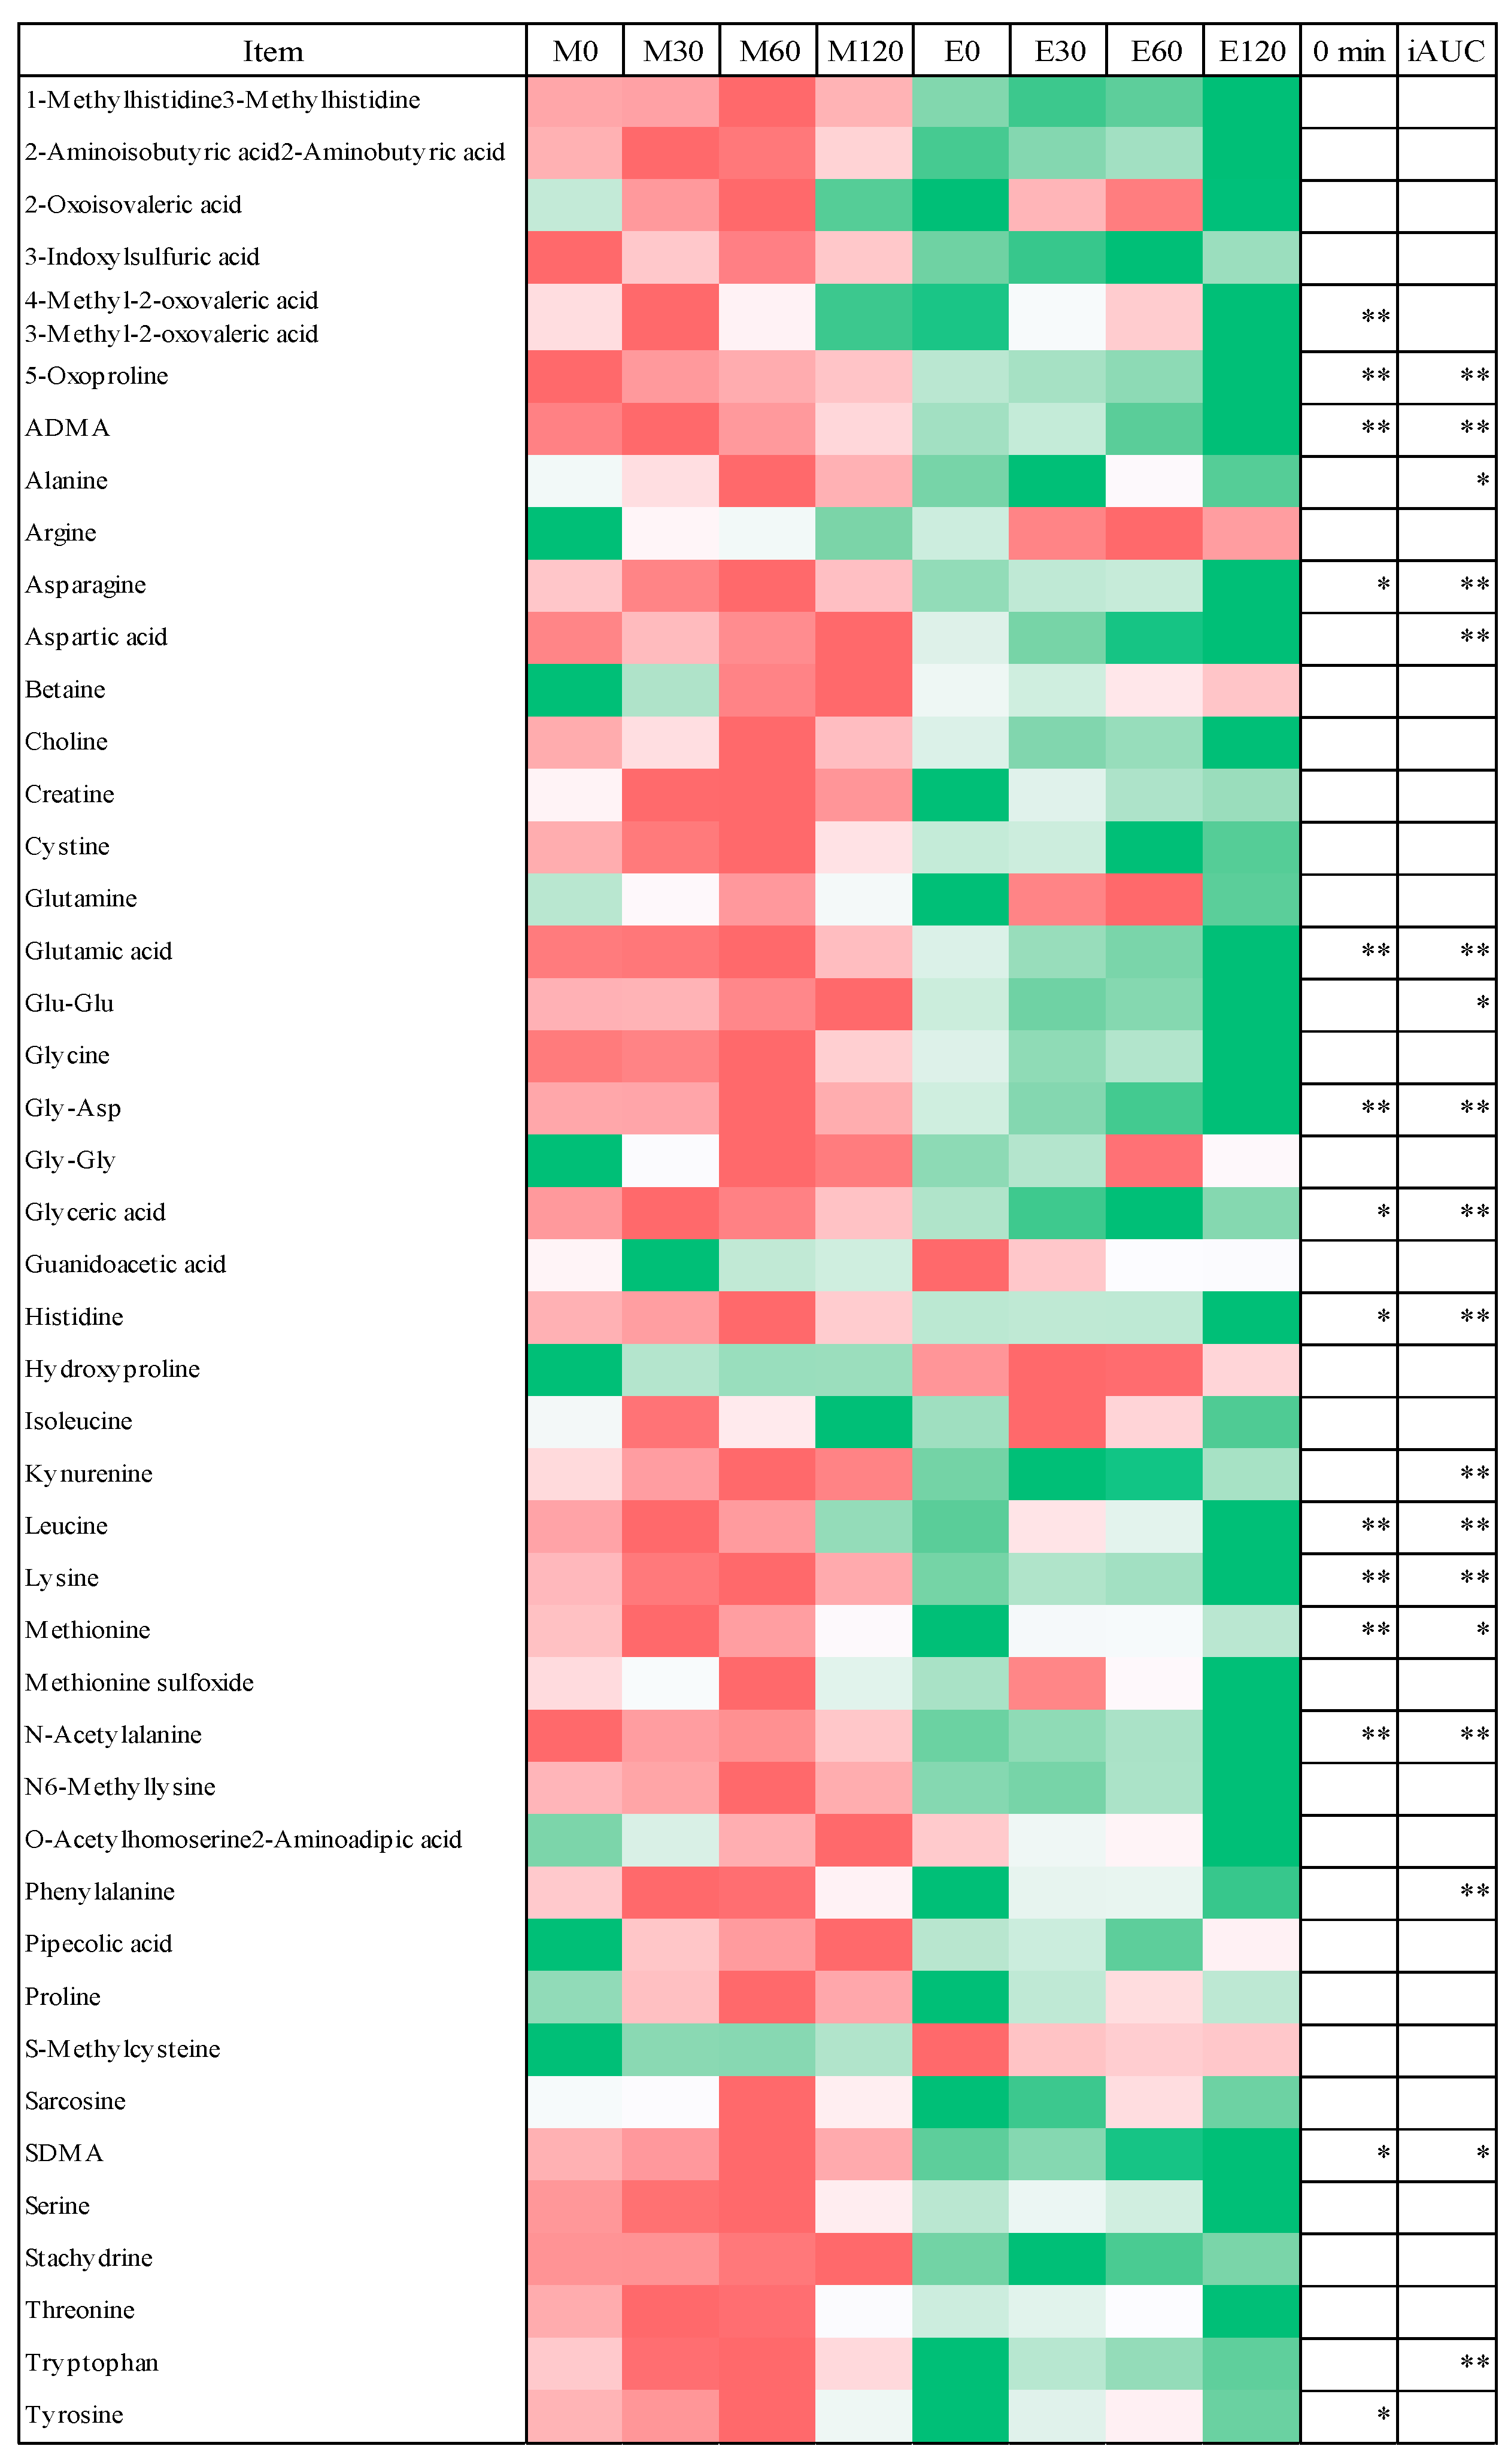
3.5. Postprandial Blood Metabolome Data
4. Discussion
5. Conclusions
Supplementary Materials
Author Contributions
Funding
Acknowledgments
Conflicts of Interest
References
- European Diabetes Epidemiology Group. Diabetes Epidemiology: Collaborative analysis of diagnostic criteria in Europe. Lancet 1999, 354, 617–621. [Google Scholar]
- Decode Study Group. Glucose tolerance and cardiovascular mortality: Comparison of fasting and 2-hour diagnostic criteria. Arch. Intern. Med. 2001, 161, 397–405. [Google Scholar] [CrossRef]
- Nakagami, T.; Group, D.S. Hyperglycaemia and mortality from all causes and from cardiovascular disease in five populations of Asian origin. Diabetologia 2004, 47, 385–394. [Google Scholar] [CrossRef] [PubMed]
- Morris, C.J.; Yang, J.N.; Garcia, J.I.; Myers, S.; Bozzi, I.; Wang, W.; Buxton, O.M.; Shea, S.A.; Scheer, F.A. Endogenous circadian system and circadian misalignment impact glucose tolerance via separate mechanisms in humans. Proc. Natl. Acad. Sci. USA 2015, 112, E2225–E2234. [Google Scholar] [CrossRef] [PubMed]
- Bo, S.; Fadda, M.; Castiglione, A.; Ciccone, G.; De Francesco, A.; Fedele, D.; Guggino, A.; Parasiliti Caprino, M.; Ferrara, S.; Vezio Boggio, M.; et al. Is the timing of caloric intake associated with variation in diet-induced thermogenesis and in the metabolic pattern? A randomized cross-over study. Int. J. Obes. 2015, 39, 1689–1695. [Google Scholar] [CrossRef] [PubMed]
- Bandin, C.; Scheer, F.A.; Luque, A.J.; Avila-Gandia, V.; Zamora, S.; Madrid, J.A.; Gomez-Abellan, P.; Garaulet, M. Meal timing affects glucose tolerance, substrate oxidation and circadian-related variables: A randomized, crossover trial. Int. J. Obes. 2015, 39, 828–833. [Google Scholar] [CrossRef] [PubMed]
- Arora, T.; Taheri, S. Associations among late chronotype, body mass index and dietary behaviors in young adolescents. Int. J. Obes. 2015, 39, 39–44. [Google Scholar] [CrossRef] [PubMed]
- Yu, J.H.; Yun, C.H.; Ahn, J.H.; Suh, S.; Cho, H.J.; Lee, S.K.; Yoo, H.J.; Seo, J.A.; Kim, S.G.; Choi, K.M.; et al. Evening chronotype is associated with metabolic disorders and body composition in middle-aged adults. J. Clin. Endocrinol. Metab. 2015, 100, 1494–1502. [Google Scholar] [CrossRef] [PubMed]
- Reutrakul, S.; Hood, M.M.; Crowley, S.J.; Morgan, M.K.; Teodori, M.; Knutson, K.L.; Van Cauter, E. Chronotype is independently associated with glycemic control in type 2 diabetes. Diabetes Care 2013, 36, 2523–2529. [Google Scholar] [CrossRef] [PubMed]
- Lindgren, O.; Mari, A.; Deacon, C.F.; Carr, R.D.; Winzell, M.S.; Vikman, J.; Ahren, B. Differential islet and incretin hormone responses in morning versus afternoon after standardized meal in healthy men. J. Clin. Endocrinol. Metab. 2009, 94, 2887–2892. [Google Scholar] [CrossRef] [PubMed]
- Van Cauter, E.; Desir, D.; Decoster, C.; Fery, F.; Balasse, E.O. Nocturnal decrease in glucose tolerance during constant glucose infusion. J. Clin. Endocrinol. Metab. 1989, 69, 604–611. [Google Scholar] [CrossRef] [PubMed]
- Scheer, F.A.; Hilton, M.F.; Mantzoros, C.S.; Shea, S.A. Adverse metabolic and cardiovascular consequences of circadian misalignment. Proc. Natl. Acad. Sci. USA 2009, 106, 4453–4458. [Google Scholar] [CrossRef] [PubMed]
- Saad, A.; Dalla Man, C.; Nandy, D.K.; Levine, J.A.; Bharucha, A.E.; Rizza, R.A.; Basu, R.; Carter, R.E.; Cobelli, C.; Kudva, Y.C.; et al. Diurnal pattern to insulin secretion and insulin action in healthy individuals. Diabetes 2012, 61, 2691–2700. [Google Scholar] [CrossRef] [PubMed]
- Kessler, K.; Hornemann, S.; Petzke, K.J.; Kemper, M.; Kramer, A.; Pfeiffer, A.F.; Pivovarova, O.; Rudovich, N. The effect of diurnal distribution of carbohydrates and fat on glycaemic control in humans: A randomized controlled trial. Sci. Rep. 2017, 7, 44170. [Google Scholar] [CrossRef] [PubMed]
- Drucker, D.J.; Nauck, M.A. The incretin system: Glucagon-like peptide-1 receptor agonists and dipeptidyl peptidase-4 inhibitors in type 2 diabetes. Lancet 2006, 368, 1696–1705. [Google Scholar] [CrossRef]
- Numao, S.; Kawano, H.; Endo, N.; Yamada, Y.; Konishi, M.; Takahashi, M.; Sakamoto, S. Effects of a single bout of aerobic exercise on short-term low-carbohydrate/high-fat intake-induced postprandial glucose metabolism during an oral glucose tolerance test. Metabolism 2013, 62, 1406–1415. [Google Scholar] [CrossRef] [PubMed]
- Salera, M.; Giacomoni, P.; Pironi, L.; Ustra, C.; Capelli, M.; Giorgi, A.; Miglioli, M.; Barbara, L. Circadian rhythm of gastric inhibitory polypeptide (GIP) in man. Metabolism 1983, 32, 21–24. [Google Scholar] [CrossRef]
- Mingrone, G.; Nolfe, G.; Gissey, G.C.; Iaconelli, A.; Leccesi, L.; Guidone, C.; Nanni, G.; Holst, J.J. Circadian rhythms of GIP and GLP1 in glucose-tolerant and in type 2 diabetic patients after biliopancreatic diversion. Diabetologia 2009, 52, 873–881. [Google Scholar] [CrossRef] [PubMed]
- Gil-Lozano, M.; Hunter, P.M.; Behan, L.A.; Gladanac, B.; Casper, R.F.; Brubaker, P.L. Short-term sleep deprivation with nocturnal light exposure alters time-dependent glucagon-like peptide-1 and insulin secretion in male volunteers. Am. J. Physiol. Endocrinol. Metab. 2016, 310, E41–E50. [Google Scholar] [CrossRef] [PubMed]
- Tavakkolizadeh, A.; Ramsanahie, A.; Levitsky, L.L.; Zinner, M.J.; Whang, E.E.; Ashley, S.W.; Rhoads, D.B. Differential role of vagus nerve in maintaining diurnal gene expression rhythms in the proximal small intestine. J. Surg. Res. 2005, 129, 73–78. [Google Scholar] [CrossRef] [PubMed]
- Pan, X.; Hussain, M.M. Clock is important for food and circadian regulation of macronutrient absorption in mice. J. Lipid Res. 2009, 50, 1800–1813. [Google Scholar] [CrossRef] [PubMed]
- Davies, S.K.; Ang, J.E.; Revell, V.L.; Holmes, B.; Mann, A.; Robertson, F.P.; Cui, N.; Middleton, B.; Ackermann, K.; Kayser, M.; et al. Effect of sleep deprivation on the human metabolome. Proc. Natl. Acad. Sci. USA 2014, 111, 10761–10766. [Google Scholar] [CrossRef] [PubMed]
- Dallmann, R.; Viola, A.U.; Tarokh, L.; Cajochen, C.; Brown, S.A. The human circadian metabolome. Proc. Natl. Acad. Sci. USA 2012, 109, 2625–2629. [Google Scholar] [CrossRef] [PubMed]
- Liu, R.; Hong, J.; Xu, X.; Feng, Q.; Zhang, D.; Gu, Y.; Shi, J.; Zhao, S.; Liu, W.; Wang, X.; et al. Gut microbiome and serum metabolome alterations in obesity and after weight-loss intervention. Nat. Med. 2017, 23, 859–868. [Google Scholar] [CrossRef] [PubMed]
- Krug, S.; Kastenmuller, G.; Stuckler, F.; Rist, M.J.; Skurk, T.; Sailer, M.; Raffler, J.; Romisch-Margl, W.; Adamski, J.; Prehn, C.; et al. The dynamic range of the human metabolome revealed by challenges. FASEB J. 2012, 26, 2607–2619. [Google Scholar] [CrossRef] [PubMed]
- Minami, Y.; Kasukawa, T.; Kakazu, Y.; Iigo, M.; Sugimoto, M.; Ikeda, S.; Yasui, A.; van der Horst, G.T.; Soga, T.; Ueda, H.R.; et al. Measurement of internal body time by blood metabolomics. Proc. Natl. Acad. Sci. USA 2009, 106, 9890–9895. [Google Scholar] [CrossRef] [PubMed]
- Kasukawa, T.; Sugimoto, M.; Hida, A.; Minami, Y.; Mori, M.; Honma, S.; Honma, K.; Mishima, K.; Soga, T.; Ueda, H.R. Human blood metabolite timetable indicates internal body time. Proc. Natl. Acad. Sci. USA 2012, 109, 15036–15041. [Google Scholar] [CrossRef] [PubMed]
- Giskeodegard, G.F.; Davies, S.K.; Revell, V.L.; Keun, H.; Skene, D.J. Diurnal rhythms in the human urine metabolome during sleep and total sleep deprivation. Sci. Rep. 2015, 5, 14843. [Google Scholar] [CrossRef] [PubMed]
- Ho, J.E.; Larson, M.G.; Vasan, R.S.; Ghorbani, A.; Cheng, S.; Rhee, E.P.; Florez, J.C.; Clish, C.B.; Gerszten, R.E.; Wang, T.J. Metabolite profiles during oral glucose challenge. Diabetes 2013, 62, 2689–2698. [Google Scholar] [CrossRef] [PubMed]
- Shrestha, A.; Mullner, E.; Poutanen, K.; Mykkanen, H.; Moazzami, A.A. Metabolic changes in serum metabolome in response to a meal. Eur. J. Nutr. 2017, 56, 671–681. [Google Scholar] [CrossRef] [PubMed]
- Moazzami, A.A.; Shrestha, A.; Morrison, D.A.; Poutanen, K.; Mykkanen, H. Metabolomics reveals differences in postprandial responses to breads and fasting metabolic characteristics associated with postprandial insulin demand in postmenopausal women. J. Nutr. 2014, 144, 807–814. [Google Scholar] [CrossRef] [PubMed]
- Bondia-Pons, I.; Nordlund, E.; Mattila, I.; Katina, K.; Aura, A.M.; Kolehmainen, M.; Oresic, M.; Mykkanen, H.; Poutanen, K. Postprandial differences in the plasma metabolome of healthy Finnish subjects after intake of a sourdough fermented endosperm rye bread versus white wheat bread. Nutr. J. 2011, 10, 116. [Google Scholar] [CrossRef] [PubMed]
- Horne, J.A.; Ostberg, O. A self-assessment questionnaire to determine morningness-eveningness in human circadian rhythms. Int. J. Chronobiol. 1976, 4, 97–110. [Google Scholar] [PubMed]
- Murakami, I.; Sakuragi, T.; Uemura, H.; Menda, H.; Shindo, M.; Tanaka, H. Significant effect of a pre-exercise high-fat meal after a 3-day high-carbohydrate diet on endurance performance. Nutrients 2012, 4, 625–637. [Google Scholar] [CrossRef] [PubMed]
- Turner, R.C.; Holman, R.R.; Matthews, D.; Hockaday, T.D.; Peto, J. Insulin deficiency and insulin resistance interaction in diabetes: Estimation of their relative contribution by feedback analysis from basal plasma insulin and glucose concentrations. Metabolism 1979, 28, 1086–1096. [Google Scholar] [CrossRef]
- Matthews, D.R.; Hosker, J.P.; Rudenski, A.S.; Naylor, B.A.; Treacher, D.F.; Turner, R.C. Homeostasis model assessment: Insulin resistance and beta-cell function from fasting plasma glucose and insulin concentrations in man. Diabetologia 1985, 28, 412–419. [Google Scholar] [CrossRef] [PubMed]
- Numao, S.; Kawano, H.; Endo, N.; Yamada, Y.; Takahashi, M.; Konishi, M.; Sakamoto, S. Short-term high-fat diet alters postprandial glucose metabolism and circulating vascular cell adhesion molecule-1 in healthy males. Appl. Physiol. Nutr. Metab. 2016, 41, 895–902. [Google Scholar] [CrossRef] [PubMed]
- Yeung, E.H.; Zhang, C.; Mumford, S.L.; Ye, A.; Trevisan, M.; Chen, L.; Browne, R.W.; Wactawski-Wende, J.; Schisterman, E.F. Longitudinal study of insulin resistance and sex hormones over the menstrual cycle: The BioCycle Study. J. Clin. Endocrinol. Metab. 2010, 95, 5435–5442. [Google Scholar] [CrossRef] [PubMed]
- Escalante Pulido, J.M.; Alpizar Salazar, M. Changes in insulin sensitivity, secretion and glucose effectiveness during menstrual cycle. Arch. Med. Res. 1999, 30, 19–22. [Google Scholar] [CrossRef]
- Valdes, C.T.; Elkind-Hirsch, K.E. Intravenous glucose tolerance test-derived insulin sensitivity changes during the menstrual cycle. J. Clin. Endocrinol. Metab. 1991, 72, 642–646. [Google Scholar] [CrossRef] [PubMed]
- Fukushima, M.; Suzuki, H.; Seino, Y. Insulin secretion capacity in the development from normal glucose tolerance to type 2 diabetes. Diabetes Res. Clin. Pract. 2004, 66, S37–S43. [Google Scholar] [CrossRef] [PubMed]
- Van Cauter, E.; Shapiro, E.T.; Tillil, H.; Polonsky, K.S. Circadian modulation of glucose and insulin responses to meals: Relationship to cortisol rhythm. Am. J. Physiol. 1992, 262, E467–E475. [Google Scholar] [CrossRef] [PubMed]
- Patton, D.F.; Mistlberger, R.E. Circadian adaptations to meal timing: Neuroendocrine mechanisms. Front. Neurosci. 2013, 7, 185. [Google Scholar] [CrossRef] [PubMed]
- Deacon, C.F. What do we know about the secretion and degradation of incretin hormones? Regul. Pept. 2005, 128, 117–124. [Google Scholar] [CrossRef] [PubMed]
- Nater, U.M.; Rohleder, N.; Schlotz, W.; Ehlert, U.; Kirschbaum, C. Determinants of the diurnal course of salivary alpha-amylase. Psychoneuroendocrinology 2007, 32, 392–401. [Google Scholar] [CrossRef] [PubMed]
- Wolf, J.M.; Nicholls, E.; Chen, E. Chronic stress, salivary cortisol and alpha-amylase in children with asthma and healthy children. Biol. Psychol. 2008, 78, 20–28. [Google Scholar] [CrossRef] [PubMed]
- Shaham, O.; Wei, R.; Wang, T.J.; Ricciardi, C.; Lewis, G.D.; Vasan, R.S.; Carr, S.A.; Thadhani, R.; Gerszten, R.E.; Mootha, V.K. Metabolic profiling of the human response to a glucose challenge reveals distinct axes of insulin sensitivity. Mol. Syst. Biol. 2008, 4, 214. [Google Scholar] [CrossRef] [PubMed]
- Bertram, H.C.; Eggers, N.; Eller, N. Potential of human saliva for nuclear magnetic resonance-based metabolomics and for health-related biomarker identification. Anal. Chem. 2009, 81, 9188–9193. [Google Scholar] [CrossRef] [PubMed]
- Slupsky, C.M.; Rankin, K.N.; Wagner, J.; Fu, H.; Chang, D.; Weljie, A.M.; Saude, E.J.; Lix, B.; Adamko, D.J.; Shah, S.; et al. Investigations of the effects of gender, diurnal variation and age in human urinary metabolomic profiles. Anal. Chem. 2007, 79, 6995–7004. [Google Scholar] [CrossRef] [PubMed]


| Morning Trial | Evening Trial | |
|---|---|---|
| (n = 19) | (n = 19) | |
| Age (years) | 23.3 ± 0.6 | 23.1 ± 0.6 |
| Height (m) | 1.7 ± 0.1 | 1.7 ± 0.1 |
| Body mass (kg) | 64.6 ± 1.6 | 65.0 ± 2.1 |
| BMI | 22.0 ± 0.6 | 22.1 ± 0.5 |
| Systolic blood pressure (mmHg) | 120 ± 3 | 118 ± 3 |
| Diastolic blood pressure (mmHg) | 72 ± 2 | 71 ± 2 |
| MEQ score | 48 ± 2 | |
© 2018 by the authors. Licensee MDPI, Basel, Switzerland. This article is an open access article distributed under the terms and conditions of the Creative Commons Attribution (CC BY) license (http://creativecommons.org/licenses/by/4.0/).
Share and Cite
Takahashi, M.; Ozaki, M.; Kang, M.-I.; Sasaki, H.; Fukazawa, M.; Iwakami, T.; Lim, P.J.; Kim, H.-K.; Aoyama, S.; Shibata, S. Effects of Meal Timing on Postprandial Glucose Metabolism and Blood Metabolites in Healthy Adults. Nutrients 2018, 10, 1763. https://doi.org/10.3390/nu10111763
Takahashi M, Ozaki M, Kang M-I, Sasaki H, Fukazawa M, Iwakami T, Lim PJ, Kim H-K, Aoyama S, Shibata S. Effects of Meal Timing on Postprandial Glucose Metabolism and Blood Metabolites in Healthy Adults. Nutrients. 2018; 10(11):1763. https://doi.org/10.3390/nu10111763
Chicago/Turabian StyleTakahashi, Masaki, Mamiho Ozaki, Moon-Il Kang, Hiroyuki Sasaki, Mayuko Fukazawa, Tamao Iwakami, Pei Jean Lim, Hyeon-Ki Kim, Shinya Aoyama, and Shigenobu Shibata. 2018. "Effects of Meal Timing on Postprandial Glucose Metabolism and Blood Metabolites in Healthy Adults" Nutrients 10, no. 11: 1763. https://doi.org/10.3390/nu10111763
APA StyleTakahashi, M., Ozaki, M., Kang, M.-I., Sasaki, H., Fukazawa, M., Iwakami, T., Lim, P. J., Kim, H.-K., Aoyama, S., & Shibata, S. (2018). Effects of Meal Timing on Postprandial Glucose Metabolism and Blood Metabolites in Healthy Adults. Nutrients, 10(11), 1763. https://doi.org/10.3390/nu10111763