Article

Longitudinal Association between n-3 Long-Chain Polyunsaturated Fatty Acid Intake and Depressive Symptoms: A Population-Based Cohort Study in Japan

1
Section of the NILS-LSA, National Center for Geriatrics and Gerontology, 7-430 Morioka-cho, Obu-City, Aichi 474-8511, Japan
2
Institute for Health Care Science, Suntory Wellness Limited, 8-1-1 Seikadai, Seika-cho, Soraku-gun, Kyoto 619-0284, Japan
3
Faculty of Health and Medical Sciences, Aichi Shukutoku University, 2-9 Katahira, Nagakute-city, Aichi 480-1197, Japan
4
Graduate School of Nutritional Sciences, Nagoya University of Arts and Sciences, 57 Takenoyama, Iwasaki-cho, Nisshin-city, Aichi 470-0196, Japan
*
Author to whom correspondence should be addressed.
Nutrients 2018, 10(11), 1655; https://doi.org/10.3390/nu10111655
Submission received: 1 October 2018 / Revised: 18 October 2018 / Accepted: 29 October 2018 / Published: 3 November 2018
(This article belongs to the Special Issue DHA and Neurocognitive Function)

Abstract

:
It remains unclear whether n-3 long-chain polyunsaturated fatty acids (LCPUFA) have a preventive effect on depression in the general population. This study investigated the longitudinal association between n-3 LCPUFA intake and depressive symptoms in community-dwelling Japanese participants. The participants were aged 40–79 years at baseline in the cohort study, wherein examinations, including the assessment of depressive symptoms and nutritional status, were biennially conducted from 1997 to 2012. The subjects (n = 2335) who had a Center for Epidemiologic Studies Depression Scale (CES-D) score < 16 at the first examination and who participated in the follow-up study at least once were included in the analysis. The follow-up end point was the first onset (CES-D ≥ 16) or the last examination participation. Hazard ratios (95% CIs) for CES-D ≥ 16 were estimated using the adjusted Cox proportional hazards model. Overall, 22.1% participants showed depressive symptoms during follow-up (average; 8.1 years). Compared with the lowest tertile, the highest HR for EPA was 0.74 (0.60–0.93), and highest and middle HRs for DHA were 0.79 (0.63–0.98) and 0.80 (0.65–0.99) (P for trend = 0.009 and 0.032), respectively. Among populations with high fish consumption, higher n-3 LCPUFA intake may be associated with a low risk of depressive symptoms.

1. Introduction

Depression is a serious public health problem worldwide. The World Health Organization estimates that approximately 322 million people worldwide suffer from depression [1]. The illness is predicted to become one of the top three causes of disability-adjusted life years lost by 2030 [2].
In the approximately 20 years since 1996, the incidence of mood disorders, including depression and bipolar affective disorder, has doubled in Japan, and the number continues to rise [3]. In Europe and the United States, young people are at a higher risk of developing depression than old people [4]. However, recent Japanese surveys have reported that depression occurs frequently among middle-aged and elderly people [5]. People in these age groups may have suffer from functional impairments that occur with age in addition to depression. Dementia is particularly worrisome among such people. Depressive symptoms often present in people with multiple chronic conditions and age-related cognitive impairment [6], as well as in people with early dementia with prodromal signs of cognitive decline [7,8]. Depression has attracted attention as a potential risk factor for dementia. The impact of depression and methods of preventing or treating depression need to be addressed in developed countries with aging societies.
Diet is a well-known factor associated with depression [9,10,11]. This has been particularly reported in studies associated with fish intake [12,13]. Ecologic studies have shown that people living in countries with high fish consumption, such as Japan, have lower rates of age-standardized disability-adjusted life years for depressive disorders [14]. Eicosapentaenoic acid (EPA) and docosahexaenoic acid (DHA) are the two major n-3 long-chain polyunsaturated fatty acids (n-3 LCPUFA) derived from fish and shellfish; they are essential for maintaining cellular membrane function and affect neurotransmitter release and modify receptor binding [15]. We should pay attention to the potential mechanisms that originate from models for depression with limitation when it comes to the comparability with human depression/depressive symptoms [16,17]; however, experimental studies have shown that these fatty acids have anti-inflammatory [18], antioxidative [19], neuroprotective [20], and neurogenesis effects [21]. These factors may also be important in protecting against depression and inflammation-related diseases [22]. Therefore, we hypothesized that EPA and DHA may be effective against the pathophysiology of depressive symptoms.
According to a recent meta-analysis, the intake of n-3 LCPUFA showed favorable effects in patients with major depressive disorder (MDD) [23,24]. Conversely, another review indicated the presence of insufficient evidence for the efficacy of n-3 LCPUFA as a treatment for MDD [25]. Thus, findings regarding the effect of n-3 LCPUFA intake in patients with MDD are not consistent. Certainly, it is important to be able to treat MDD; however, it is even more important to understand daily nutrition for preventing the risk of depression as the need for prevention has recently increased to become higher than the need for therapeutic management of disease. The meta-analysis of observational studies showed a significant association between n-3 LCPUFA and the risk of depression [26]. However, most studies on populations from countries with low fish intake did not indicate a significant linear dose-response association between n-3 LCPUFA intake and the risk of depression. Recently, one Japanese cohort study reported that a high intake of fish or n-3 LCPUFA protected a Japanese population from MDD [27]. However, these results showed a reverse J-shaped curve as opposed to a simple linear association. Thus, it remains unclear whether the risk of depressive symptoms decreases with higher intake of n-3 LCPUFA in the Japanese general population.
In this study, we aimed to investigate the longitudinal association between n-3 LCPUFA intake and depressive symptoms in community-dwelling Japanese subjects whose habitual intake of n-3 LCPUFA was higher than that in other countries. We particularly focused on middle-aged and elderly people who are at higher risk for depression. The intake of fatty acids other than n-3 LCPUFA was also examined because it was necessary to ascertain whether findings regarding any association were specific to n-3 LCPUFA.

2. Materials and Methods

2.1. Study Design

The data for the present study was obtained from the National Institute for Longevity Sciences-Longitudinal Study of Aging (NILS-LSA). The NILS-LSA is a Japanese population-based prospective cohort study of normal aging and age-related diseases. The normal aging process was assessed using detailed questionnaires and medical checkups, anthropometric measurements, physical fitness tests and nutritional assessments. The participants in the NILS-LSA of the first wave included approximately 2300 males and females aged 40–79 years [28]. The first wave of the examination began in November 1997 and ended in April 2000. Following the first wave of the examination, participants were followed up every 2 years. The seventh wave of the examination was completed in July 2012, and a postal survey for follow-up is ongoing. Participants in the NILS-LSA included randomly selected, age- and sex-stratified individuals from the noninstitutionalized residents in the National Center for Geriatrics and Gerontology neighborhood areas of Obu City and Higashiura Town in Aichi Prefecture. When participants could not attend the follow-up investigations (because of moving away, death, or other personal reasons), the same number of age- and sex-matched random samples were recruited, excluding individuals aged >79 years. Male and female participants aged 40 years were also newly recruited from the same residential area. Details of the NILS-LSA study have been reported elsewhere [28]. This research is not a clinical trial and is therefore not registered.

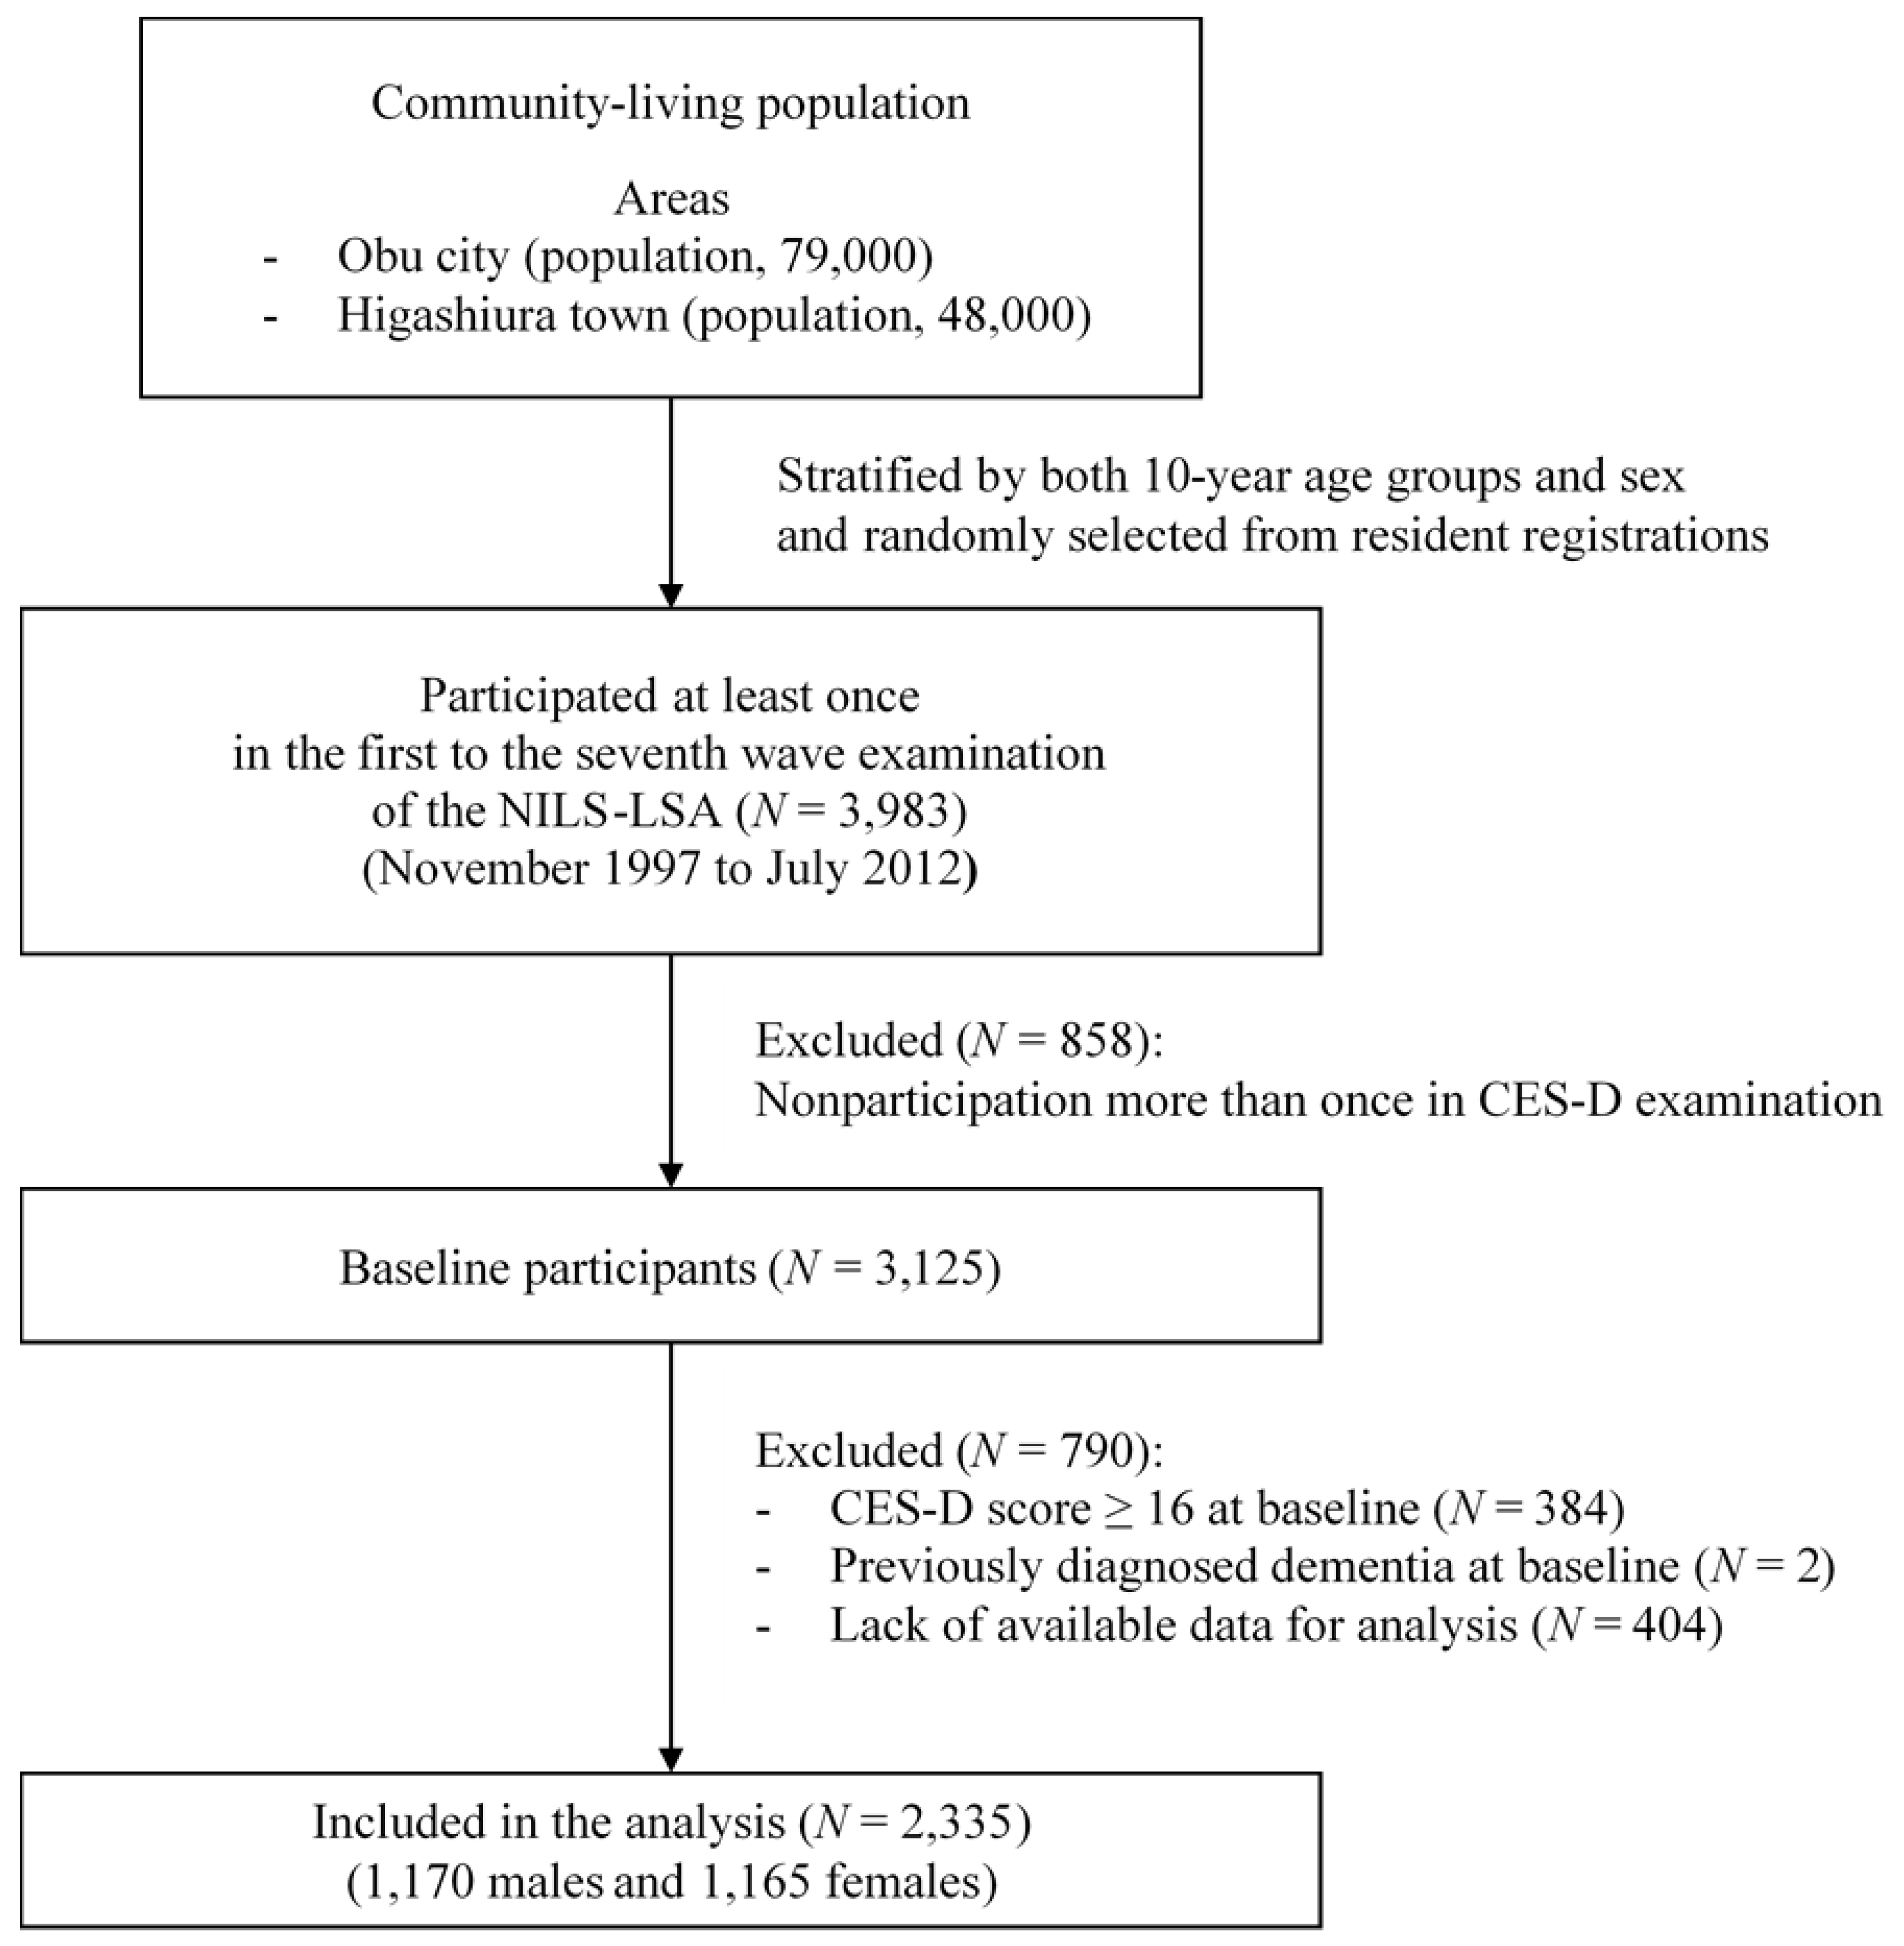
2.2. Study Population

The NILS-LSA included 3983 males and females aged 40 years or older who participated in at least one examination from the first to the seventh wave of examinations (from 1997 to 2012). The baseline for each individual was at the first assessment time point by the Center for Epidemiologic Studies Depression Scale (CES-D). The follow-up time was the period from each baseline (the time of each individual’s first CES-D assessment) to the first onset of depressive symptoms or the censored date (the last examination day). We excluded the following individuals: Those who failed to participate more than once in the CES-D assessment; those with CES-D scores ≥ 16 at each baseline; those with a self-reported history of previously diagnosed dementia at each baseline and those with missing data at each baseline for adjusted variables in the statistical analysis. Lastly, on the basis of the exclusion criteria, 2335 subjects (1170 males and 1165 females) were included in the analysis (Figure 1). The study was approved by the Committee for Ethics of Human Research of the National Center for Geriatrics and Gerontology (No. 899-2) and was conducted in accordance with the Declaration of Helsinki. Written informed consent was obtained from all subjects.

2.3. Depressive Symptoms

Depressive symptoms were assessed using the Japanese version [29] questionnaire of the CES-D [30]. The participants completed the self-completed questionnaire CES-D at home for assessing their depressed state in the previous week and brought it with them on the examination day. The CES-D questionnaire comprises 20 questions in the following four subscales: Somatic and retarded activity, depressed affect, positive affect and interpersonal relations. Scores range from 0 to 60, with lower scores indicating fewer depressive symptoms. This scale is reportedly a valid and reliable measure of depressive symptoms in the elderly [31]. A cut-off score of ≥16 is used for identifying subjects with relevant depressive symptoms [30]. We defined a CES-D score ≥16 as representative of depressive symptoms. We regarded the first time point at which the CES-D score was ≥16 during the follow-up period as the onset of depressive symptoms.

2.4. Nutritional Assessment

Nutritional intakes, such as mean energy intake per day (kcal/day) and fatty acid intake per day (g or mg/day), were assessed using a 3-day dietary record after participation in all waves. The dietary record was completed over three continuous days (two weekdays and one weekend day) [32]. Most subjects completed it at home and returned the records within 1 month. Either the food was separately weighed on a 1-kg kitchen scale (Sekisui Jushi, Tokyo, Japan) before being cooked, or portion sizes were estimated. The subjects used a disposable camera with 27 shots (167 Fuji Film, Tokyo, Japan) for taking photographs of their meals before and after eating. Dieticians used these photographs to complete missing data, and they then telephoned the subjects to resolve any discrepancies or to obtain further information when necessary. Average 3-day food and nutrient intakes were calculated according to the Standard Tables of Foods Composition in Japan 2010 [33]. Alcohol intake in the previous year was assessed using a food frequency questionnaire; trained dieticians interviewed the subjects using this questionnaire.

2.5. Other Measurements

A self-completed questionnaire, provided approximately 2 weeks prior to the examination day, was used for collecting information on the history of hypertension, hyperlipidemia, ischemic heart disease, stroke and diabetes (yes/no); education (≤9, 10–12, or ≥13 years of school); employment status (no occupation or household labor/nonregular employment/regular employment); marital status (yes/no) and smoking status (yes/no). The questionnaires were collected on the examination day. Both weight and height were measured on the examination day, and BMI was calculated as the weight in kilograms divided by the square of the height in meters (kg/m2). Trained interviewers used a questionnaire for assessing physical activity using questions regarding the intensity and frequency of activity over the preceding year [34]. The mean amount of leisure-time physical activity per day was calculated (metabolic equivalents [MET], MET × min/day).

2.6. Statistical Analysis

All statistical analyses were conducted using Statistical Analysis System version 9.3 (SAS Institute, Cary, NC, USA). The confounding variables were sex, age, BMI, educational level, marital status, smoking status, alcohol consumption, energy intake, physical activity, employment status, CES-D score and history of hypertension, hyperlipidemia, ischemic heart disease, stroke, and diabetes at baseline. Differences in characteristics and fatty acid intake between subjects with and without new onset of depressive symptoms were assessed using the χ2-test for categorical variables or Student’s t-test for continuous variables. To analyze the association between fatty acid intake and risk of depressive symptoms, we performed Cox proportional hazards regression and estimated the hazard ratios (HRs) and 95% CIs of depressive symptoms for tertiles of fatty acid intake using the lowest tertile category as the reference. Trend associations were assessed by entering dummy variables assigned to the tertile of fatty acid intake. In model I, we adjusted for age, sex and energy intake. Model II was further adjusted for the confounding variables, including BMI, educational level, marital status, smoking status, alcohol consumption, physical activity, employment status, CES-D score and previous medical history at baseline. Two-sided p values < 0.05 were regarded as indicating statistical significance.

3. Results

3.1. Characteristics of the Study Population

The subjects for analysis consisted of 1170 males (50.1%) and 1165 females (49.9%). The mean age at baseline was 56.1 (SD 11.9) years, and 515 subjects (22.1%) were identified as having depressive symptoms (CES-D score ≥ 16) during the follow-up period. The average follow-up time was 8.1 (SD 3.8) years. The characteristics of subjects with and without the onset of depressive symptoms are shown in Table 1. Compared with subjects who presented without new onset of depressive symptoms, subjects who presented with new onset of depressive symptoms were significantly more likely to be female, had fewer years of education, and had a higher CES-D score at baseline. Marginally significant differences were observed for marital status and history of diabetes.

3.2. Differences between Fatty Acid Intake with and without the Onset of Depressive Symptoms

Table 2 shows the fatty acid intake level at baseline according to the presence or absence of new onset of depressive symptoms during the follow-up period. The fatty acid intake level at baseline, including EPA (p = 0.049), DHA (p = 0.020), and n-3 PUFA (p = 0.040), was significantly different in subjects with and without onset of depressive symptoms. Subjects with the onset of depressive symptoms had significantly lower fatty acid intake than those without depressive symptoms. However, the intake of α-linolenic acid (ALA) among n-3 PUFAs and n-6 PUFA did not significantly differ between groups.

3.3. Risk of Depressive Symptoms with Increased Intake of Fatty Acids

Table 3 and Table 4 present the HRs and 95% CIs of depressive symptoms for tertiles of fatty acid intake, using the low tertile category as the reference. The risk of depressive symptoms was inversely associated with the increased intake of n-3 PUFAs, with a significant association in the high tertile compared with the low tertile (Table 3). No associations were noted between intake levels of any fatty acid other than n-3 PUFAs and the onset of depressive symptoms. No significant associations were observed with n-6 PUFA levels, but the n-6:n-3 ratio showed a significant trend of association with the onset of depressive symptoms.
Table 4 shows the risk of depressive symptoms according to the tertile of individual fatty acid intake. In the crude model, the increased intake of EPA and DHA showed an inverse association with the onset of depressive symptoms (p for trend = 0.016 and 0.023, respectively). The crude HRs for EPA and DHA in the highest tertile were significantly lower than those for EPA and DHA in the lowest tertile (EPA: HR 0.77, 95% CI 0.62–0.95; DHA: HR 0.79, 95% CI 0.64–0.97). The HR for DHA was also significant in the middle tertile compared with the lowest tertile. In model I, which was adjusted for sex, age, and energy intake, the result was similar to that in the crude model. Furthermore, these significant associations were maintained even in model II after adjusting for more covariates, including baseline CES-D score, BMI, educational level, marital status, smoking status, alcohol consumption, physical activity, employment status, and history of hypertension, hyperlipidemia, ischemic heart disease, stroke, and diabetes. After adjustment for all covariates, EPA was associated with a lower HR for onset of depressive symptoms (high tertile vs. low tertile: HR 0.74, 95% CI 0.60–0.93). Similarly, higher DHA was associated with a lower HR for onset of depressive symptoms (high tertile vs. low tertile: HR 0.79, 95% CI 0.63–0.98; middle tertile vs. low tertile: HR 0.80, 95% CI 0.65–0.99). Moreover, the HR showed a decreasing trend with level of intake of both EPA (p for trend = 0.009) and DHA (p for trend = 0.032). There were no significant associations for other fatty acids.

4. Discussion

In the present study, higher intakes of EPA and DHA were shown to be effective in reducing the risk of depressive symptoms in Japanese middle-aged and elderly community-dwelling subjects. To the best of our knowledge, this is the first study demonstrating a decreased risk in response to the intake levels of EPA and DHA in a population with a high fish intake. This association was specific to EPA and DHA.
During 8.1 years of follow-up, 22.1% of participants had an onset of depressive symptoms. This rate was higher than that in our previous cross-sectional study (12.5%) and in other reports regarding Japanese middle-aged and elderly subjects [35]. The difference between cross-sectional and longitudinal studies may partially contribute to this discrepancy.
In a cohort study that used CES-D for assessing the depressed state and observed subjects for a similar follow-up period, the incidence of depressive symptoms ranged from 11.3% to 29.2% [6,36,37].
Japanese people consume a large amount of fish and shellfish, which are the main sources of EPA and DHA [38,39], and the subjects in the present study had a high intake of these fatty acids. The median values for EPA and DHA consumption were 243 and 469 mg/day, respectively. The intake of EPA and DHA in Japan are approximately 10 times higher than those in the United States and Australia, where the fish intake is lower [38,40]. Other Japanese studies of middle-aged and elderly subjects also found high intake levels of n-3 LCPUFA (range, 0.8–1.0 g/day) [27,41,42]. In cohort studies similar to the present study, high intakes of n-3 LCPUFA were found in Finland (0.5 g/day) and Spain (0.9 g/day) [43,44], whereas most cohort studies in other Western countries, such as the United States and Australia, have found an intake of approximately 0.1 g/day [36,40,45].
Ecological studies have shown that age-standardized disability-adjusted life years among subjects with depressive disorders are lower in countries in which people consume more fish [12]. However, in cohort studies in countries with higher fish intake, no clear association between n-3 LCPUFA intake levels and depressive symptoms has been observed. We initially considered that the lack of clear evidence for this association may be associated with the saturation effect of n-3 LCPUFA levels on depressive symptoms, but a dose-related association between n-3 LCPUFA levels and depressive symptoms was demonstrated in a cross-sectional study using serum samples from Japanese subjects [35]. EPA and DHA intake levels in regions with low fish intake may be insufficient to impact depressive symptoms.
Our research evaluated EPA and DHA intake levels using a 3-day dietary record, whereas numerous Western cohort studies use Food Frequency Questionnaires (FFQs) [6,44,46] instead of dietary records. Another Japanese cohort study has also used the FFQ [27]. The dietary intake method used in our study reportedly provides more accurate intake levels than the FFQ [47,48]. Differences in accuracy between dietary evaluation methods may influence the results of different studies.
Variations in subject characteristics may also explain discrepancies between study findings. The participants in the present study was from a general, randomly selected, community-dwelling population, whereas most previous reports included participants from cohort-based intervention studies. Intervention studies may be associated with selection bias because of the precise selection criteria. Among the cohort studies of the ingestion of EPA and DHA and the risk of depressive symptoms, only two studies in Spain [44] and Japan [27] were conducted in areas with high fish intake. The findings of these studies were found to be partially significant and not dose-dependent. These results may be because of the insufficient research period. The follow-up period of the Spain cohort study was approximately 2 years, which may be too short a period to observe the occurrence of an event. Conversely, the follow-up period in the Japanese study was 25 years, which may be too long. In addition, these studies either used specific educational levels for study inclusion [44] or did not consider education as a confounding variable [27]. The educational level is associated with the incidence of depressive symptoms [49,50]. Thus, selection bias is more likely to have occurred in these studies. The Spain study also included onset of symptoms of anxiety besides depression, and the rate was 67% in all subjects; thus, the relevance of depressive symptoms may not have been considered. Depression may also be a critical complication of stroke and diabetes [51,52,53]; however, few studies have adjusted for these variables. Future studies should aim to identify all factors associated with depression and the intake of fatty acids.
There were few differences between EPA and DHA in the present study, as the tertiles of both fatty acid concentrations showed an association with a lower HR for depressive symptoms, with significant trends. A recent meta-analysis provided evidence that EPA may be more efficacious than DHA in treating depression [54]. Another meta-analysis suggested that only regimens containing over 60% EPA had a highly significant effect in the treatment of depression [55]. DHA is also a major component of brain neurons [56] and plays an important role in maintaining regular brain function [57]. However, an intervention study indicated the possibility of a better effect of DHA than EPA on depression [58]. In our study, no significant associations were observed with n-6 PUFA levels, but the n-6:n-3 ratio showed a significant trend of association with the onset of depressive symptoms as is the case with numerous other reports. A high dietary n-6:n-3 ratio associated with increased risk of depression has been often reported [59]. But most reports only reflect the results derived from the inverse associations of n-3 LCPUFA with the risk of depression as in our study. Another article concluded that increased intake of oleic acid was associated with reduced risk of severe depressed mood while increased intake of linoleic acid was associated with increased risk [60]. The results of the present study were inconsistent with those of this study because we observed no association with oleic acid and linoleic acid. Higher n-3 LCPUFA intake of Japanese than people of other countries may affect these differences, but the details remain unclear.
This study has several limitations. First, we did not have a diagnosis of clinical depression. Although the CES-D is a valuable assessment scale for studying the association between depressive symptoms and several variables, it is not a clinical diagnostic tool [30]. Second, our nutritional assessment method is more accurate than other methods [47,48], but it still may not be sufficient in this research. Because daily fluctuations in EPA and DHA intake within each subject were large, a 3-day observation period for dietary intake may have been insufficient. However, the fluctuation may have had little influence on the results because the estimated intake was based on the cohort population and not on individuals. Third, there was no control for time-varying covariates. We adjusted only for covariates obtained at the baseline. This may induce systematic bias that yields an underestimate of HR. Fourth, we did not control for multiple comparisons because we particularly focused on n-3 LCPUFA on the basis of our hypothesis. But fatty acids other than n-3 LCPUFA were also examined because it was necessary to ascertain whether findings regarding any association were specific to n-3 LCPUFA. Fifth, the small effect size was not large enough to make definite conclusions. However, systematic review and meta-analysis of results obtained from observational studies support the hypothesis that dietary fish-derived n-3 PUFA intake is associated with a decreased risk of depression [26]. Although the effect size was small, the habitual high fish-derived fatty acid intake may be clinically effective in preventing depressive symptoms.

5. Conclusions

To conclude, the present study suggests that EPA and DHA intake may have a favorable effect on depressive symptoms in Japanese subjects with higher intake levels of n-3 LCPUFA. Lower intake levels may lead to more depressive symptoms in subjects in countries with lower n-3 LCPUFA intake. Daily intake of these fatty acids may be beneficial. Further longitudinal and intervention studies are needed to elucidate any preventive effects of n-3 LCPUFA against depressive symptoms.

Author Contributions

Research designing, C.H., R.O., F.A. and H.S. (Hiroshi Shimokata); study implementation, H.S. (Hiroshi Shimokata), F.A., and R.O.; essential reagent or essential material provision, H.S. (Hiroshi Shimokata), F.A., R.O., Y.K., Y.N., and C.T.; data and statistical analysis, C.H.; manuscript writing, C.H., R.O., Y.K., Y.N., C.T., T.R., H.K., H.S. (Hiroshi Shibata), F.A., and H.S. (Hiroshi Shimokata); final content responsibility, C.H.

Funding

This work was partly funded by Longevity Sciences from the National Center for Geriatrics and Gerontology, Japan, grant number 28-40.

Acknowledgments

The authors express their sincere appreciation to the study participants as well as their colleagues in the NILS-LSA for completing the survey for this study. We would like to thank Yoshinori Kitagawa (Suntory Wellness Ltd.), Saki Kakutani (Suntory Global Innovation Center Ltd.) for scientific advice and encouragement.

Conflicts of Interest

Four of the authors (C.H., T.R., H.K., and H.S. (Hiroshi Shibata)) are salaried employees of Suntory Wellness Limited. All other authors have no conflicts of interest. C.H., T.R., H.K., and H.S. (Hiroshi Shibata) contributed interpretation of the data, revising manuscript, and approval of the manuscript with other authors as well. This study is, however, not related to any particular products of the company and the results do not recommend any particular products.

References

  1. World Health Organization. Depression and Other Common Mental Disorders. Global Health Estimates; World Health Organization: Geneva, Switzerland, 2017; Available online: http://www.who.int/mental_health/management/depression/en/ (accessed on 25 October 2017).
  2. World Health Organization. Health Topics/Depression. Available online: http://www.emro.who.int/health-topics/depression/index.html/ (accessed on 25 October 2017).
  3. Ministry of Health, Labour and Welfare. Patient Survey 2014, Statistical Tables 1–9, Statistical Table 2, Estimated Number of Patients (per Day), by Total/Inpatient/Outpatient, Type of Medical Institution, Year, and Classification of Diseases. Available online: http://www.mhlw.go.jp/english/database/db-hss/sps_2014.html (accessed on 25 October 2017).
  4. Blazer, D.G.; Kessler, R.C.; McGonagle, K.A.; Swartz, M.S. The prevalence and distribution of major depression in a national community sample: The National Comorbidity Survey. Am. J. Psychiatry 1994, 151, 979–986. [Google Scholar] [PubMed]
  5. Kawakami, N.; Takeshima, T.; Ono, Y.; Uda, H.; Hata, Y.; Nakane, Y.; Nakane, H.; Iwata, N.; Furukawa, T.A.; Kikkawa, T. Twelve-month prevalence, severity, and treatment of common mental disorders in communities in Japan: Preliminary findings from the World Mental Health Japan Survey 2002–2003. Psychiatry Clin. Neurosci. 2005, 59, 441–452. [Google Scholar] [CrossRef] [PubMed]
  6. Kesse-Guyot, E.; Touvier, M.; Andreeva, V.A.; Jeandel, C.; Ferry, M.; Hercberg, S.; Galan, P. Cross-sectional but not longitudinal association between n-3 fatty acid intake and depressive symptoms: Results from the SU.VI.MAX 2 study. Am. J. Epidemiol. 2012, 175, 979–987. [Google Scholar] [CrossRef] [PubMed]
  7. Green, R.C.; Cupples, L.A.; Kurz, A.; Auerbach, S.; Go, R.; Sadovnick, D.; Duara, R.; Kukull, W.A.; Chui, H.; Edeki, T.; et al. Depression as a risk factor for Alzheimer disease: The MIRAGE Study. Arch. Neurol. 2003, 60, 753–759. [Google Scholar] [CrossRef] [PubMed]
  8. Ownby, R.L.; Crocco, E.; Acevedo, A.; John, V.; Loewenstein, D. Depression and risk for Alzheimer disease: Systematic review, meta-analysis, and metaregression analysis. Arch. Gen. Psychiatry 2006, 63, 530–538. [Google Scholar] [CrossRef] [PubMed]
  9. Molendijk, M.; Molero, P.; Ortuño Sánchez-Pedreño, F.; Van der Does, W.; Angel Martínez-González, M. Diet quality and depression risk: A systematic review and dose-response meta-analysis of prospective studies. J. Affect Disord. 2018, 226, 346–354. [Google Scholar] [CrossRef] [PubMed]
  10. Li, Y.; Lv, M.R.; Wei, Y.J.; Sun, L.; Zhang, J.X.; Zhang, H.G.; Li, B. Dietary patterns and depression risk: A meta-analysis. Psychiatry Res. 2017, 253, 373–382. [Google Scholar] [CrossRef] [PubMed]
  11. Hernández-Galiot, A.; Goñi, I. Adherence to the Mediterranean diet pattern, cognitive status and depressive symptoms in an elderly non-institutionalized population. Nutr. Hosp. 2017, 34, 338–344. [Google Scholar] [CrossRef] [PubMed]
  12. Yang, Y.; Je, Y. Fish consumption and depression in Korjean adults: The Korea National Health and Nutrition Examination Survey, 2013–2015. Eur. J. Clin. Nutr. 2018, 7, 1142–1149. [Google Scholar] [CrossRef] [PubMed]
  13. Wu, D.; Feng, L.; Gao, Q.; Li, J.L.; Rajendran, K.S.; Wong, J.C.; Kua, E.H.; Ng, T.P. Association between fish intake and depressive symptoms among community-living older Chinese adults in Singapore: A cross-sectional study. J. Nutr. Health Aging 2016, 20, 404–407. [Google Scholar] [CrossRef] [PubMed]
  14. Grosso, G.; Galvano, F.; Marventano, S.; Malaguarnera, M.; Bucolo, C.; Drago, F.; Caraci, F. Omega-3 fatty acids and depression: Scientific evidence and biological mechanisms. Oxid. Med. Cell Longev. 2014, 2014. [Google Scholar] [CrossRef] [PubMed]
  15. Hulbert, A.J.; Turner, N.; Storlien, L.H.; Else, P.L. Dietary fats and membrane function: Implications for metabolism and disease. Biol. Rev. Camb. Philos. Soc. 2005, 80, 155–169. [Google Scholar] [CrossRef] [PubMed]
  16. Molendijk, M.L; De Kloet, E.R. Immobility in the forced swim test is adaptive and does not reflect depression. Psychoneuroendocrinology 2015, 62, 389–391. [Google Scholar] [CrossRef] [PubMed]
  17. de Kloet, E.R.; Molendijk, M.L. Coping with the Forced Swim Stressor: Towards Understanding an Adaptive Mechanism. Neural. Plast. 2016, 2016, 5098591. [Google Scholar] [CrossRef] [PubMed]
  18. Simopoulos, A.P. Omega-3 fatty acids in inflammation and autoimmune diseases. J. Am. Coll. Nutr. 2002, 21, 495–505. [Google Scholar] [CrossRef] [PubMed]
  19. Liu, Q.; Wu, D.; Ni, N.; Ren, H.; Luo, C.; He, C.; Kang, J.X.; Wan, J.B.; Su, H. Omega-3 polyunsaturated fatty acids protect neural progenitor cells against oxidative injury. Mar. Drugs 2014, 12, 2341–2356. [Google Scholar] [CrossRef] [PubMed] [Green Version]
  20. Hong, S.H.; Belayev, L.; Khoutorova, L.; Obenaus, A.; Bazan, N.G. Docosahexaenoic acid confers enduring neuroprotection in experimental stroke. J. Neurol. Sci. 2014, 338, 135–141. [Google Scholar] [CrossRef] [PubMed]
  21. Kang, J.X.; Gleason, E.D. Omega-3 fatty acids and hippocampal neurogenesis in depression. CNS Neurol. Disord. Drug Targets 2013, 12, 460–465. [Google Scholar] [CrossRef] [PubMed]
  22. Stewart, J.C.; Rand, K.L.; Muldoon, M.F.; Kamarck, T.W. A prospective evaluation of the directionality of the depression-inflammation association. Brain Behav. Immun. 2009, 23, 936–944. [Google Scholar] [CrossRef] [PubMed]
  23. Grosso, G.; Pajak, A.; Marventano, S.; Castellano, S.; Galvano, F.; Bucolo, C.; Drago, F.; Caraci, F. Role of omega-3 fatty acids in the treatment of depressive disorders: A comprehensive meta-analysis of randomized clinical trials. PLoS ONE 2014, 9, e96905. [Google Scholar] [CrossRef] [PubMed]
  24. Mocking, R.J.; Harmsen, I.; Assies, J.; Koeter, M.W.; Ruhé, H.G.; Schene, A.H. Meta-analysis and meta-regression of omega-3 polyunsaturated fatty acid supplementation for major depressive disorder. Transl. Psychiatry 2016, 6. [Google Scholar] [CrossRef] [PubMed]
  25. Appleton, K.M.; Sallis, H.M.; Perry, R.; Ness, A.R.; Churchill, R. ω-3 Fatty acids for major depressive disorder in adults: An abridged Cochrane review. BMJ Open 2016, 6. [Google Scholar] [CrossRef] [PubMed]
  26. Grosso, G.; Micek, A.; Marventano, S.; Castellano, S.; Mistretta, A.; Pajak, A.; Galvano, F. Dietary n-3 PUFA, fish consumption and depression: A systematic review and meta-analysis of observational studies. J. Affect Disord. 2016, 205, 269–281. [Google Scholar] [CrossRef] [PubMed]
  27. Matsuoka, Y.J.; Sawada, N.; Mimura, M.; Shikimoto, R.; Nozaki, S.; Hamazaki, K.; Uchitomi, Y.; Tsugane, S. Dietary fish, n-3 polyunsaturated fatty acid consumption, and depression risk in Japan: A population-based prospective cohort study. Transl. Psychiatry 2017, 7. [Google Scholar] [CrossRef] [PubMed]
  28. Shimokata, H.; Ando, F.; Niino, N. A new comprehensive study on aging—The National Institute for Longevity Sciences, Longitudinal Study of Aging (NILS-LSA). J. Epidemiol. 2000, 10, S1–S9. [Google Scholar] [CrossRef] [PubMed]
  29. Shima, S. A new self-rating scale for depression. Clin. Psychiatry 1985, 27, 717–723. (In Japanese) [Google Scholar]
  30. Radloff, L.S. The CES-D scale: A self-report depression scale for research in the general population. Appl. Psychol. Meas. 1977, 1, 385–401. [Google Scholar] [CrossRef]
  31. Berkman, L.F.; Berkman, C.S.; Kasl, S.; Freeman, D.H.; Leo, L.; Ostfeld, A.M.; Cornoni-Huntley, J.; Brody, J.A. Depressive symptoms in relation to physical health and functioning in the elderly. Am. J. Epidemiol. 1986, 124, 372–388. [Google Scholar] [CrossRef] [PubMed]
  32. Imai, T.; Sakai, S.; Mori, K.; Ando, F.; Niino, N.; Shimokata, H. Nutritional assessments of 3-day dietary records in National Institute for Longevity Sciences-Longitudinal Study of Aging (NILS-LSA). J. Epidemiol. 2000, 10, S70–S76. [Google Scholar] [CrossRef] [PubMed]
  33. Office for Resources, Policy Division Science and Technology Policy Bureau, Ministry of Education, Culture, Sports, Science and Technology. Standard Tables of Foods Composition in Japan 2010. Available online: http://www.mext.go.jp/b_menu/shingi/gijyutu/gijyutu3/houkoku/1298713.htm (accessed on 25 October 2017).
  34. Kozakai, R.; Ando, F.; Kim, H.Y.; Rantanen, T.; Shimokata, H. Regular exercise history as a predictor of exercise in community-dwelling older Japanese people. J. Phys. Fit. Sport Med. 2012, 1, 167–174. [Google Scholar] [CrossRef] [Green Version]
  35. Horikawa, C.; Otsuka, R.; Kato, Y.; Nishita, Y.; Tange, C.; Kakutani, S.; Rogi, T.; Kawashima, H.; Shibata, H.; Ando, F.; et al. Cross-sectional association between serum concentrations of n-3 long-chain PUFA and depressive symptoms: Results in Japanese community dwellers. Br. J. Nutr. 2016, 115, 672–680. [Google Scholar] [CrossRef] [PubMed]
  36. Beydoun, M.A.; Fanelli Kuczmarski, M.T.; Beydoun, H.A.; Rostant, O.S.; Evans, M.K.; Zonderman, A.B. Associations of the ratios of n-3 to n-6 dietary fatty acids with longitudinal changes in depressive symptoms among US women. Am. J. Epidemiol. 2015, 181, 691–705. [Google Scholar] [CrossRef] [PubMed]
  37. Colangelo, L.A.; He, K.; Whooley, M.A.; Daviglus, M.L.; Liu, K. Higher dietary intake of long-chain omega-3 polyunsaturated fatty acids is inversely associated with depressive symptoms in women. Nutrition 2009, 25, 1011–1019. [Google Scholar] [CrossRef] [PubMed]
  38. Miyagawa, N.; Miura, K.; Okuda, N. Long-chain n-3 polyunsaturated fatty acids intake and cardiovascular disease mortality risk in Japanese: A 24-year follow-up of NIPPON DATA80. Atherosclerosis 2014, 232, 384–389. [Google Scholar] [CrossRef] [PubMed]
  39. Elmadfa, I.; Kornsteiner, M. Fats and fatty acid requirements for adults. Ann. Nutr. Metab. 2009, 55, 56–75. [Google Scholar] [CrossRef] [PubMed]
  40. Jacka, F.N.; Pasco, J.A.; Henry, M.J.; Kotowicz, M.A.; Nicholson, G.C.; Berk, M. Dietary omega-3 fatty acids and depression in a community sample. Nutr. Neurosci. 2004, 7, 101–635. [Google Scholar] [CrossRef] [PubMed]
  41. Kawabata, T.; Hirota, S.; Hirayama, T.; Adachi, N.; Hagiwara, C.; Iwama, N.; Kamachi, K.; Araki, E.; Kawashima, H.; Kiso, Y. Age-related changes of dietary intake and blood eicosapentaenoic acid, docosahexaenoic acid, and arachidonic acid levels in Japanese men and women. Prostaglandins Leukot. Essent. Fat. Acids 2011, 84, 131–137. [Google Scholar] [CrossRef] [PubMed]
  42. Kuriki, K.; Nagaya, T.; Imaeda, N.; Tokudome, Y.; Fujiwara, N.; Sato, J.; Ikeda, M.; Maki, S.; Tokudome, S. Discrepancies in dietary intakes and plasma concentrations of fatty acids according to age among Japanese female dieticians. Eur. J. Clin. Nutr. 2002, 56, 524–531. [Google Scholar] [CrossRef] [PubMed]
  43. Hakkarainen, R.; Partonen, T.; Haukka, J.; Virtamo, J.; Albanes, D.; Lönnqvist, J. Is low dietary intake of omega-3 fatty acids associated with depression? Am. J. Psychiatry 2004, 161, 567–569. [Google Scholar] [CrossRef] [PubMed]
  44. Sanchez-Villegas, A.; Henríquez, P.; Figueiras, A.; Ortuño, F.; Lahortiga, F.; Martínez-González, M.A. Long chain omega-3 fatty acids intake, fish consumption and mental disorders in the SUN cohort study. Eur. J. Nutr. 2007, 46, 337–346. [Google Scholar] [CrossRef] [PubMed]
  45. Persons, J.E.; Robinson, J.G.; Ammann, E.M.; Coryell, W.H.; Espeland, M.A.; Harris, W.S.; Manson, J.E.; Fiedorowicz, J.G. Omega-3 fatty acid biomarkers and subsequent depressive symptoms. Int. J. Geriatr. Psychiatry 2014, 29, 747–757. [Google Scholar] [CrossRef] [PubMed]
  46. Lucas, M.; Mirzaei, F.; O’Reilly, E.J.; Pan, A.; Willett, W.C.; Kawachi, I.; Koenen, K.; Ascherio, A. Dietary intake of n-3 and n-6 fatty acids and the risk of clinical depression in women: A 10-y prospective follow-up study. Am. J. Clin. Nutr. 2011, 93, 1337–1343. [Google Scholar] [CrossRef] [PubMed]
  47. Kipnis, V.; Subar, A.F.; Midthune, D.; Freedman, L.S.; Ballard-Barbash, R.; Troiano, R.P.; Bingham, S.; Schoeller, D.A.; Schatzkin, A.; Carroll, R.J. Structure of dietary measurement error: Results of the OPEN biomarker study. Am. J. Epidemiol. 2003, 158, 14–21. [Google Scholar] [CrossRef] [PubMed]
  48. Subar, A.F.; Kipnis, V.; Troiano, R.P.; Midthune, D.; Schoeller, D.A.; Bingham, S.; Sharbaugh, C.O.; Trabulsi, J.; Runswick, S.; Ballard-Barbash, R.; et al. Using intake biomarkers to evaluate the extent of dietary misreporting in a large sample of adults: The OPEN study. Am. J. Epidemiol. 2003, 158, 1–13. [Google Scholar] [CrossRef] [PubMed]
  49. Fiske, A.; Wetherell, J.L.; Gatz, M. Depression in older adults. Annu. Rev. Clin. Psychol. 2009, 5, 363–589. [Google Scholar] [CrossRef] [PubMed]
  50. Blazer, D.G. Depression in late life: Review and commentary. J. Gerontol. A Biol. Sci. Med. Sci. 2003, 58, 249–265. [Google Scholar] [CrossRef] [PubMed]
  51. Lindén, T.; Blomstrand, C.; Skoog, I. Depressive disorders after 20 months in elderly stroke patients: A case-control study. Stroke 2007, 38, 1860–1863. [Google Scholar] [CrossRef] [PubMed]
  52. De Jonge, P.; Roy, J.F.; Saz, P.; Marcos, G.; Lobo, A. Prevalent and incident depression in community-dwelling elderly persons with diabetes mellitus: Results from the ZARADEMP project. Diabetologia 2006, 49, 2627–2633. [Google Scholar] [CrossRef] [PubMed]
  53. Maraldi, C.; Volpato, S.; Penninx, B.W.; Yaffe, K.; Simonsick, E.M.; Strotmeyer, E.S.; Cesari, M.; Kritchevsky, S.B.; Perry, S.; Ayonayon, H.N.; et al. Diabetes mellitus, glycemic control, and incident depressive symptoms among 70- to 79-year-old persons: The health, aging, and body composition study. Arch. Intern. Med. 2007, 167, 1137–1144. [Google Scholar] [CrossRef] [PubMed]
  54. Martins, J.G. EPA but not DHA appears to be responsible for the efficacy of omega-3 long chain polyunsaturated fatty acid supplementation in depression: Evidence from a meta-analysis of randomized controlled trials. J. Am. Coll. Nutr. 2009, 28, 525–542. [Google Scholar] [CrossRef] [PubMed]
  55. Bloch, M.H.; Hannestad, J. Omega-3 fatty acids for the treatment of depression: Systematic review and meta-analysis. Mol. Psychiatry 2012, 17, 1272–1282. [Google Scholar] [CrossRef] [PubMed]
  56. Wainwright, P.E. Dietary essential fatty acids and brain function: A developmental perspective on mechanisms. Proc. Nutr. Soc. 2002, 61, 61–69. [Google Scholar] [CrossRef] [PubMed]
  57. Sinclair, A.J.; Begg, D.; Mathai, M.; Weisinger, R.S. Omega 3 fatty acids and the brain: Review of studies in depression. Asia Pac. J. Clin. Nutr. 2007, 1, 391–397. [Google Scholar]
  58. Meyer, B.J.; Grenyer, B.F.; Crowe, T.; Owen, A.J.; Grigonis-Deane, E.M.; Howe, P.R. Improvement of major depression is associated with increased erythrocyte DHA. Lipids 2013, 48, 863–886. [Google Scholar] [CrossRef] [PubMed]
  59. Fernandes, M.F.; Mutch, D.M.; Leri, F. The relationship between fatty acids and different depression-related brain regions, and their potential role as biomarkers of response to antidepressants. Nutrients 2017, 9. [Google Scholar] [CrossRef] [PubMed]
  60. Wolfe, A.R.; Ogbonna, E.M.; Lim, S.; Li, Y.; Zhang, J. Dietary linoleic and oleic fatty acids in relation to severe depressed mood: 10 years follow-up of a national cohort. Prog. Neuropsychopharmacol. Biol. Psychiatry 2009, 2009 33, 972–977. [Google Scholar] [CrossRef]
Figure 1. Subjects included in this study. CES-D, Center for Epidemiologic Studies Depression Scale; N, number; NILS-LSA, National Institute for Longevity Sciences–Longitudinal Study of Aging.
Nutrients 10 01655 g001
Table 1. Baseline characteristics of subjects according to the onset of depressive symptoms in the follow-up study (numbers and percentages, mean values and standard deviations).
CharacteristicsTotalCES-D ≥ 16CES-D < 16p-Value *
Subjects with New Onset of Depressive SymptomsSubjects without New Onset of Depressive Symptoms
MeanSDMeanSDMeanSD
No. of subjects (n)2335 515 1820
Sex (male/female) (n)1170/1165 (50.1/49.9%) 227/288 (44.1/55.9%) 943/877 (51.8/48.2%) 0.002
Age (years)56.111.956.411.656.112.00.62
BMI (kg/m2)22.93.022.83.223.03.00.44
CES-D5.44.28.04.24.73.9< 0.001
Educational level (n)
≤9 years581 (24.9%) 150 (29.1%) 431 (23.7%)
10–12 years950 (40.7%) 204 (39.6%) 746 (41.0%) 0.032
≥13 years804 (34.4%) 161 (31.3%) 643 (35.3%)
Unmarried (n)281 (13.7%) 74 (14.4%) 207 (11.4%) 0.07
Current smoker (n)481 (20.6%) 108 (21.0%) 373 (20.5%) 0.81
Energy intake (kcal/day)2136428212340821404330.44
Alcohol consumption † (mL/day)9.716.18.916.510.016.00.18
Total physical activity2.00.22.00.22.00.20.87
(Mets * min/1000/day)
Employment (n)
Unemployed or household labor877 (37.6%) 198 (38.5%) 679 (37.3%)
Nonregular employment407 (17.4%) 102 (19.8%) 305 (16.8%) 0.15
Regular employment1051 (45.0%) 215 (41.8%) 836 (45.9%)
Medical history ‡ (n)
Stroke47 (2.0%) 12 (2.3%) 35 (1.9%) 0.56
Hypertension511 (21.9%) 123 (23.9%) 388 (21.3%) 0.21
Ischemic heart disease190 (8.1%) 49 (9.5%) 141 (7.8%) 0.20
Hyperlipidemia357 (15.3%) 83 (16.1%) 274 (15.1%) 0.56
Diabetes mellitus155 (6.6%) 25 (4.9%) 130 (7.1%) 0.07
n, number; CES-D, Center for Epidemiologic Studies Depression Scale. * Continuous variables, Student’s t-test; categorical variables, χ2 test. † Alcohol consumption was converted into ethanol content. ‡ Past and present illness.
Table 2. Baseline intake and ratios of fatty acids according to the onset of depressive symptoms in the follow-up study (mean values and standard deviations).
Fatty AcidTotalCES-D ≥ 16CES-D < 16p-Value *
Subjects with New Onset of Depressive SymptomsSubjects without New Onset of Depressive Symptoms
MeanSDMeanSDMeanSD
SFA(g/day)16.65.716.45.316.65.80.50
MUFA(g/day)20.77.020.66.620.77.10.67
PUFA(g/day)13.44.013.23.913.44.00.46
n-3 PUFA(g/day)2.51.02.40.92.51.00.040
DHA(mg/day)552.2377.9519.4356.2561.5383.40.020
EPA(mg/day)301.0240.2282.6229.0306.2243.10.049
ALA(mg/day)14385321425527.21442533.40.53
n-6 PUFA(g/day)10.83.410.83.310.83.40.79
ARA(mg/day)176.865.5174.761.6177.566.60.38
LA(g/day)10.63.410.53.310.63.40.93
n-6:n-3 4.71.64.81.54.74.60.048
ALA, α-linolenic acid; ARA, arachidonic acid; CES-D, Center for Epidemiologic Studies Depression Scale; DHA, docosahexaenoic acid; EPA, eicosapentaenoic acid; LA, linoleic acid; MUFA, monounsaturated fatty acids; SFA, saturated fatty acids; n-3 PUFA, sum of ALA, EPA, docosapentaenoic acid and DHA; n-6 PUFA, sum of LA, γ-linolenic acid, eicosadienoic acid, dihomo-γ-linolenic acid, ARA and docosatetraenoic acid. * Student’s t-test.
Table 3. Prevalence and risk of depressive symptoms according to tertile of intake and ratios of fatty acid types (adjusted hazard ratios (HR) and 95% confidence intervals).
T1 (Low)T2T3 (High)p for Trend *
SFA
Median (range) of intake (g/day) †11.1 (2.31–13.64)16.0 (13.64–18.52)21.8 (18.52–52.80)
N with/without depressive symptoms ‡173/604167/611175/605
Crude HR (95% CI)1.00 (reference)0.89 (0.72–1.10)0.91 (0.73–1.12)0.35
Model I: Multivariate-adjusted HR (95% CI) §0.93 (0.75–1.16)1.00 (0.77–1.28)0.97
Model II: Multivariate-adjusted HR (95% CI)1.00 (0.79–1.25)1.12 (0.86–1.46)0.39
MUFA
Median (range) of intake (g/day) †14.2 (4.15–17.14)20.0 (17.14–22.9)27.2 (22.9–55.19)
N with/without depressive symptoms ‡168/609174/604173/607
Crude HR (95% CI)1.00 (reference)0.94 (0.76–1.16)0.91 (0.74–1.13)0.38
Model I: Multivariate-adjusted HR (95% CI) §1.04 (0.83–1.30)1.08 (0.83–1.41)0.58
Model II: Multivariate-adjusted HR (95% CI)1.05 (0.83–1.33)1.16 (0.88–1.53)0.29
PUFA
Median (range) of intake (g/day) †9.6 (3.79–11.45)13.0 (11.45–14.70)16.9 (14.70–35.19)
N with/without depressive symptoms ‡166/611178/600171/609
Crude HR (95% CI)1.00 (reference)1.00 (0.81–1.23)0.91 (0.74–1.13)0.38
Model I: Multivariate-adjusted HR (95% CI) §1.08 (0.86–1.35)1.04 (0.80–1.35)0.78
Model II: Multivariate-adjusted HR (95% CI)1.18 (0.94–1.47)1.14 (0.88–1.48)0.32
n-3 PUFA
Median (range) of intake (g/day) †1.6 (0.498–1.977)2.3 (1.977–2.726)3.3 (2.727–9.664)
N with/without depressive symptoms ‡186/591177/601152/628
Crude HR (95% CI)1.00 (reference)0.92 (0.75–1.13)0.74 (059–0.91)0.005
Model I: Multivariate-adjusted HR (95% CI) §0.94 (0.76–1.16)0.75 (0.59–0.95)0.018
Model II: Multivariate-adjusted HR (95% CI)1.01 (0.82–1.25)0.78 (0.61–0.99)0.009
n-6 PUFA
Median (range) of intake (g/day) †7.7 (3.12–9.27)10.5 (9.28–11.96)13.8 (11.96–30.00)
N with/without depressive symptoms ‡171/606165/613179/601
Crude HR (95% CI)1.00 (reference)0.89 (0.72–1.10)0.93 (0.76–1.15)0.52
Model I: Multivariate-adjusted HR (95% CI) §0.96 (0.77–1.20)1.08 (0.84–1.39)0.54
Model II: Multivariate-adjusted HR (95% CI)1.01 (0.81–1.27)1.16 (0.90–1.49)0.26
n-6:n-3
Median (range) of ratios †3.2 (0.805–3.961)4.6 (3.962–5.258)6.1 (5.262–16.849)
N with/without depressive symptoms ‡153/624167/611195/585
Crude HR (95% CI)1.00 (reference)1.08 (0.86–1.34)1.28 (1.03–1.58)0.024
Model I: Multivariate-adjusted HR (95% CI) §1.10 (0.88–1.37)1.32 (1.07–1.64)0.011
Model II: Multivariate-adjusted HR (95% CI)1.11 (0.89–1.38)1.36 (1.10–1.69)0.005
CES-D, Center for Epidemiologic Studies Depression Scale; MUFA, monounsaturated fatty acids; N, number; SFA, saturated fatty acids; T, tertile; n-3 PUFA, sum of α-linolenic acid, eicosapentaenoic acid, docosapentaenoic acid, and docosahexaenoic acid; n-6 PUFA, sum of linoleic acid, γ-linolenic acid, eicosadienoic acid, dihomo-γ-linolenic acid, arachidonic acid, and docosatetraenoic acid. N, number; T, tertiles. * Based on Cox proportional hazards analysis according to tertile categories of fatty acid intakes. p for trend estimated by treating tertiles as ordinal variables for fatty acid intakes and ratios. † Values at baseline. ‡ New onset of depressive symptoms in follow-up period. A person with total CES-D score ≥16 is considered to have a significant depressive tendency. § Model I: Adjusted for sex, age, and energy intake. Model II: Adjusted for sex, age, energy intake, BMI, educational level, marital status, smoking status, alcohol consumption, energy intake, physical activity, employment status, CES-D score, and history of hypertension, hyperlipidemia, ischemic heart disease, stroke, and diabetes at baseline.
Table 4. Prevalence and risk of depressive symptoms according to the tertile of individual fatty acid intake (adjusted hazard ratios (HR) and 95% confidence intervals).
T1 (Low)T2T3 (High)p for Trend *
n-3 PUFA
DHAMedian (range) of intake (mg/day) †220.7 (4.2–344.4)468.4 (344.6–627.3)865.0 (627.4–3872.5)
N with/without depressive symptoms ‡195/582159/619161/619
Crude HR (95% CI)1.00 (reference)0.80 (0.65–0.99)0.79 (0.64–0.97)0.023
Model I: Multivariate-adjusted HR (95% CI) §0.80 (0.65–0.99)0.78 (0.63–0.97)0.027
Model II: Multivariate-adjusted HR (95% CI)0.80 (0.65–0.99)0.79 (0.63–0.98)0.032
EPAMedian (range) of intake (mg/day) †95.3 (2.1–164.8)242.3 (165.1–341.8)495.4 (341.9–2466.1)
N with/without depressive symptoms ‡195/582167/611153/627
Crude HR (95% CI)1.00 (reference)0.87 (0.70–1.07)0.77 (0.62–0.95)0.016
Model I: Multivariate-adjusted HR (95% CI) §0.86 (0.70–1.06)0.76 (0.61–0.95)0.014
Model II: Multivariate-adjusted HR (95% CI)0.85 (0.69–1.04)0.74 (0.60–0.93)0.009
ALAMedian (range) of intake (mg/day) †929 (289.1–1176.9)1370.1 (1177.1–1604.8)1919.4 (1604.9–4295.7)
N with/without depressive symptoms ‡169/608182/596164/616
Crude HR (95% CI)1.00 (reference)1.03 (0.84–1.28)0.90 (0.72–1.11)0.31
Model I: Multivariate-adjusted HR (95% CI) §1.08 (0.87–1.34)1.00 (0.78–1.27)0.99
Model II: Multivariate-adjusted HR (95% CI)1.14 (0.92–1.41)1.13 (0.88–1.44)0.33
n-6 PUFA
ARAMedian (range) of intake (mg/day) †117 (13.1–144.6)170.4 (144.6–197.3)235.4 (197.4–612.5)
N with/without depressive symptoms ‡163/614188/590164/616
Crude HR (95% CI)1.00 (reference)1.08 (0.88–1.33)0.91 (0.73–1.12)0.37
Model I: Multivariate-adjusted HR (95% CI) §1.14 (0.92–1.41)0.98 (0.77–1.25)0.87
Model II: Multivariate-adjusted HR (95% CI)1.17 (0.94–1.45)1.04 (0.82–1.32)0.75
LAMedian (range) of intake (g/day) †7.5 (3.0–9.0)10.2 (9.0–11.6)13.6 (11.6–29.9)
N with/without depressive symptoms ‡170/607167/611178/602
Crude HR (95% CI)1.00 (reference)0.92 (0.74–1.14)0.94 (0.76–1.16)0.54
Model I: Multivariate-adjusted HR (95% CI) §0.99 (0.79–1.24)1.08 (0.84–1.39)0.54
Model II: Multivariate-adjusted HR (95% CI)1.08 (0.86–1.35)1.18 (0.92–1.52)0.20
ARA, arachidonic acid; ALA, α-linolenic acid; CES-D, Center for Epidemiologic Studies Depression Scale; DHA, docosahexaenoic acid; EPA, eicosapentaenoic acid; LA, linoleic acid; N, number; T, tertile; * Based on Cox proportional hazards analysis according to tertile categories of fatty acid intakes. p for trend estimated by treating tertiles as ordinal variables for fatty acid intakes. † Values at baseline. ‡ New onset of depressive symptoms for follow-up period. A person with total CES-D score ≥16 is considered to have a significant depressive tendency. § Model I: Adjusted for sex, age, and energy intake. Model II: Adjusted for sex, age, energy intake, BMI, educational level, marital status, smoking status, alcohol consumption, energy intake, physical activity, employment status, CES-D score, and history of hypertension, hyperlipidemia, ischemic heart disease, stroke, and diabetes at baseline.

