The Role of Vitamin D Oral Supplementation in Insulin Resistance in Women with Polycystic Ovary Syndrome: A Systematic Review and Meta-Analysis of Randomized Controlled Trials


Abstract
1. Introduction
2. Methods
2.1. Protocol and Registration
2.2. Eligibility Criteria
2.3. Inclusion Criteria
- Intervention studies (randomized controlled trials (RCTs) and double-blind randomized controlled trials (DB-RCTs)) that compared vitamin D supplementation (alone or in combination with other vitamins and minerals) with a placebo without any limitations on time of supplementation.
- English-language articles.
- Studies that enrolled women with a strict diagnosis of PCOS using the Rotterdam criteria of the European Society of Human Reproduction and Embryology (ESHRE)/American Society of Reproductive Medicine (ASRAM) [29].
- The vitamin D was administered orally as cholecalciferol (vitamin D3), ergocalciferol (vitamin D2), or an active form of vitamin D (1α-hydroxyvitamin D and 1,25-dihydroxyvitamin D (1,25(OH)2D)). Studies in which vitamin D was combined with other vitamins and minerals were also taken into consideration. Finally, we included studies that reported the most often assessed parameters in insulin resistance, such as fasting glucose, fasting insulin, and HOMA-IR.
2.4. Exclusion Criteria
- Studies performed in specific groups of patients (e.g., subjects with hyperparathyroidism, subjects suffering from hepatic disease or kidney disease, those with a history of bariatric surgery, pregnant or breast-feeding women, and studies performed in women with PCOS but without insulin resistance).
- Studies in which vitamin D was combined with metformin.
- Conference papers, and articles only available in abstract form (where the authors could not be contacted) were also excluded.
2.5. Data Extraction and Analysis
2.6. Assessment of the Risk of Bias in Studies
2.7. Statistical Analysis
3. Results
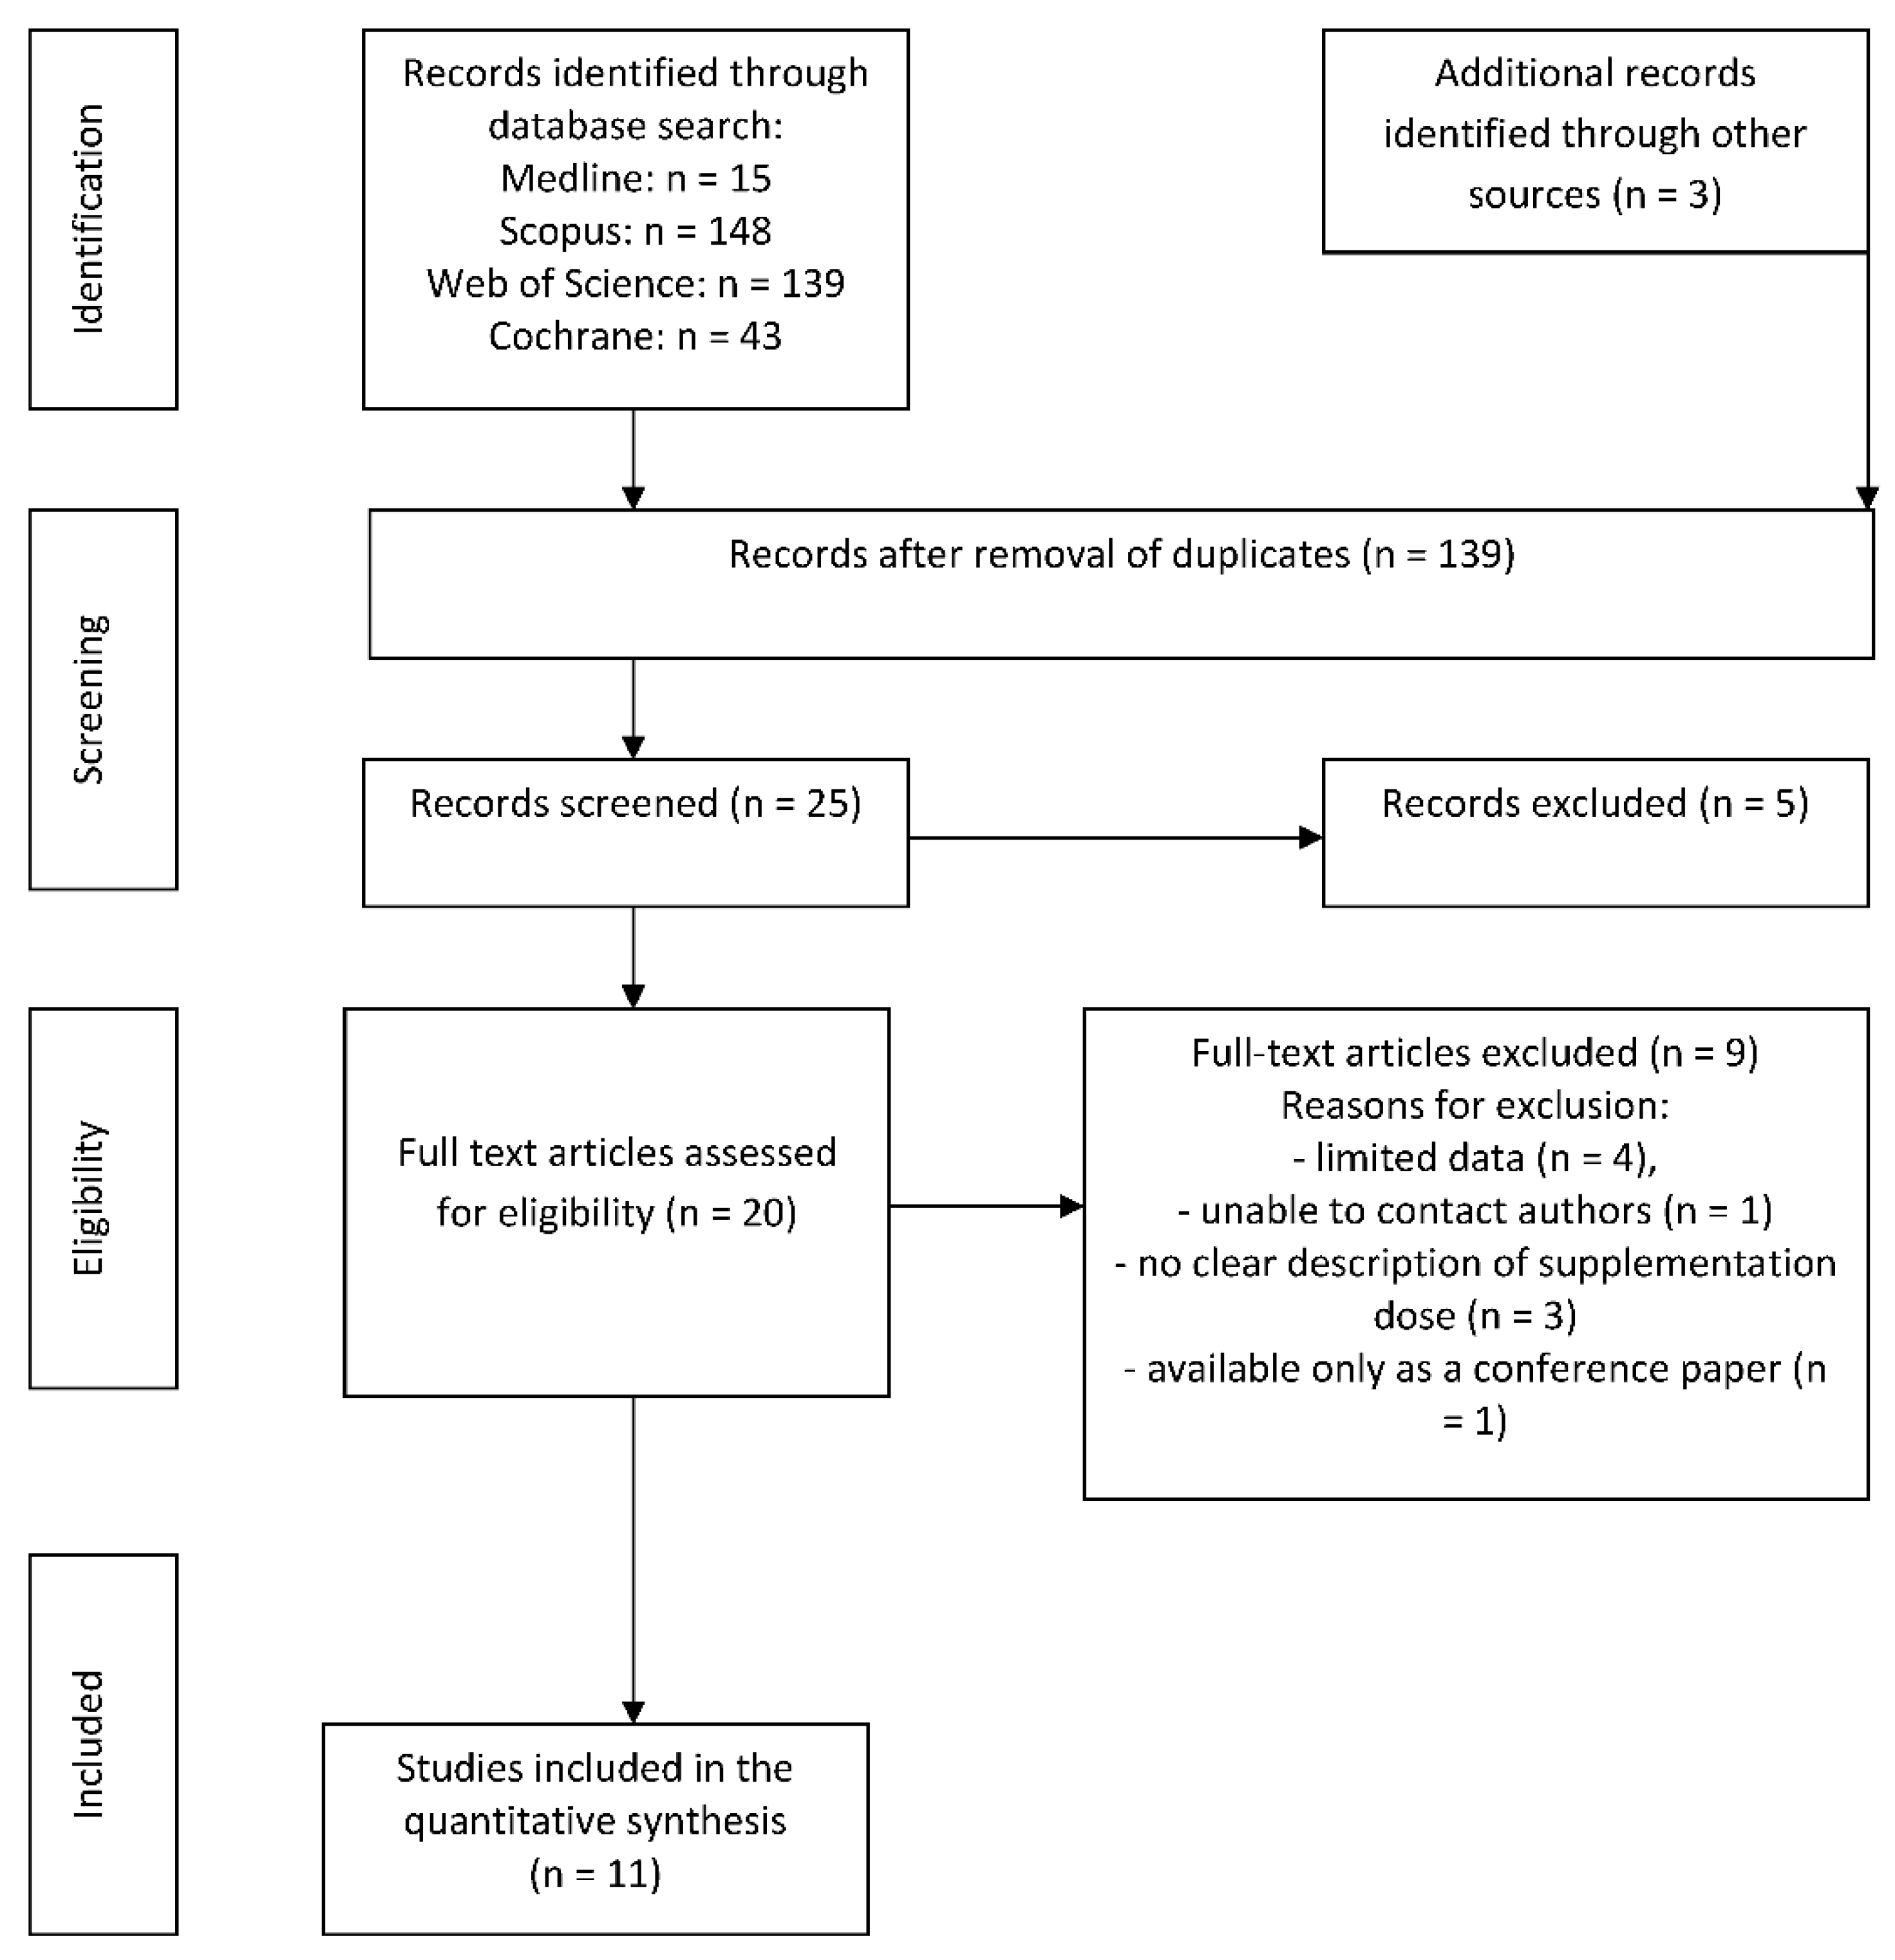
3.1. Search Results
3.2. Population and Study Characteristics
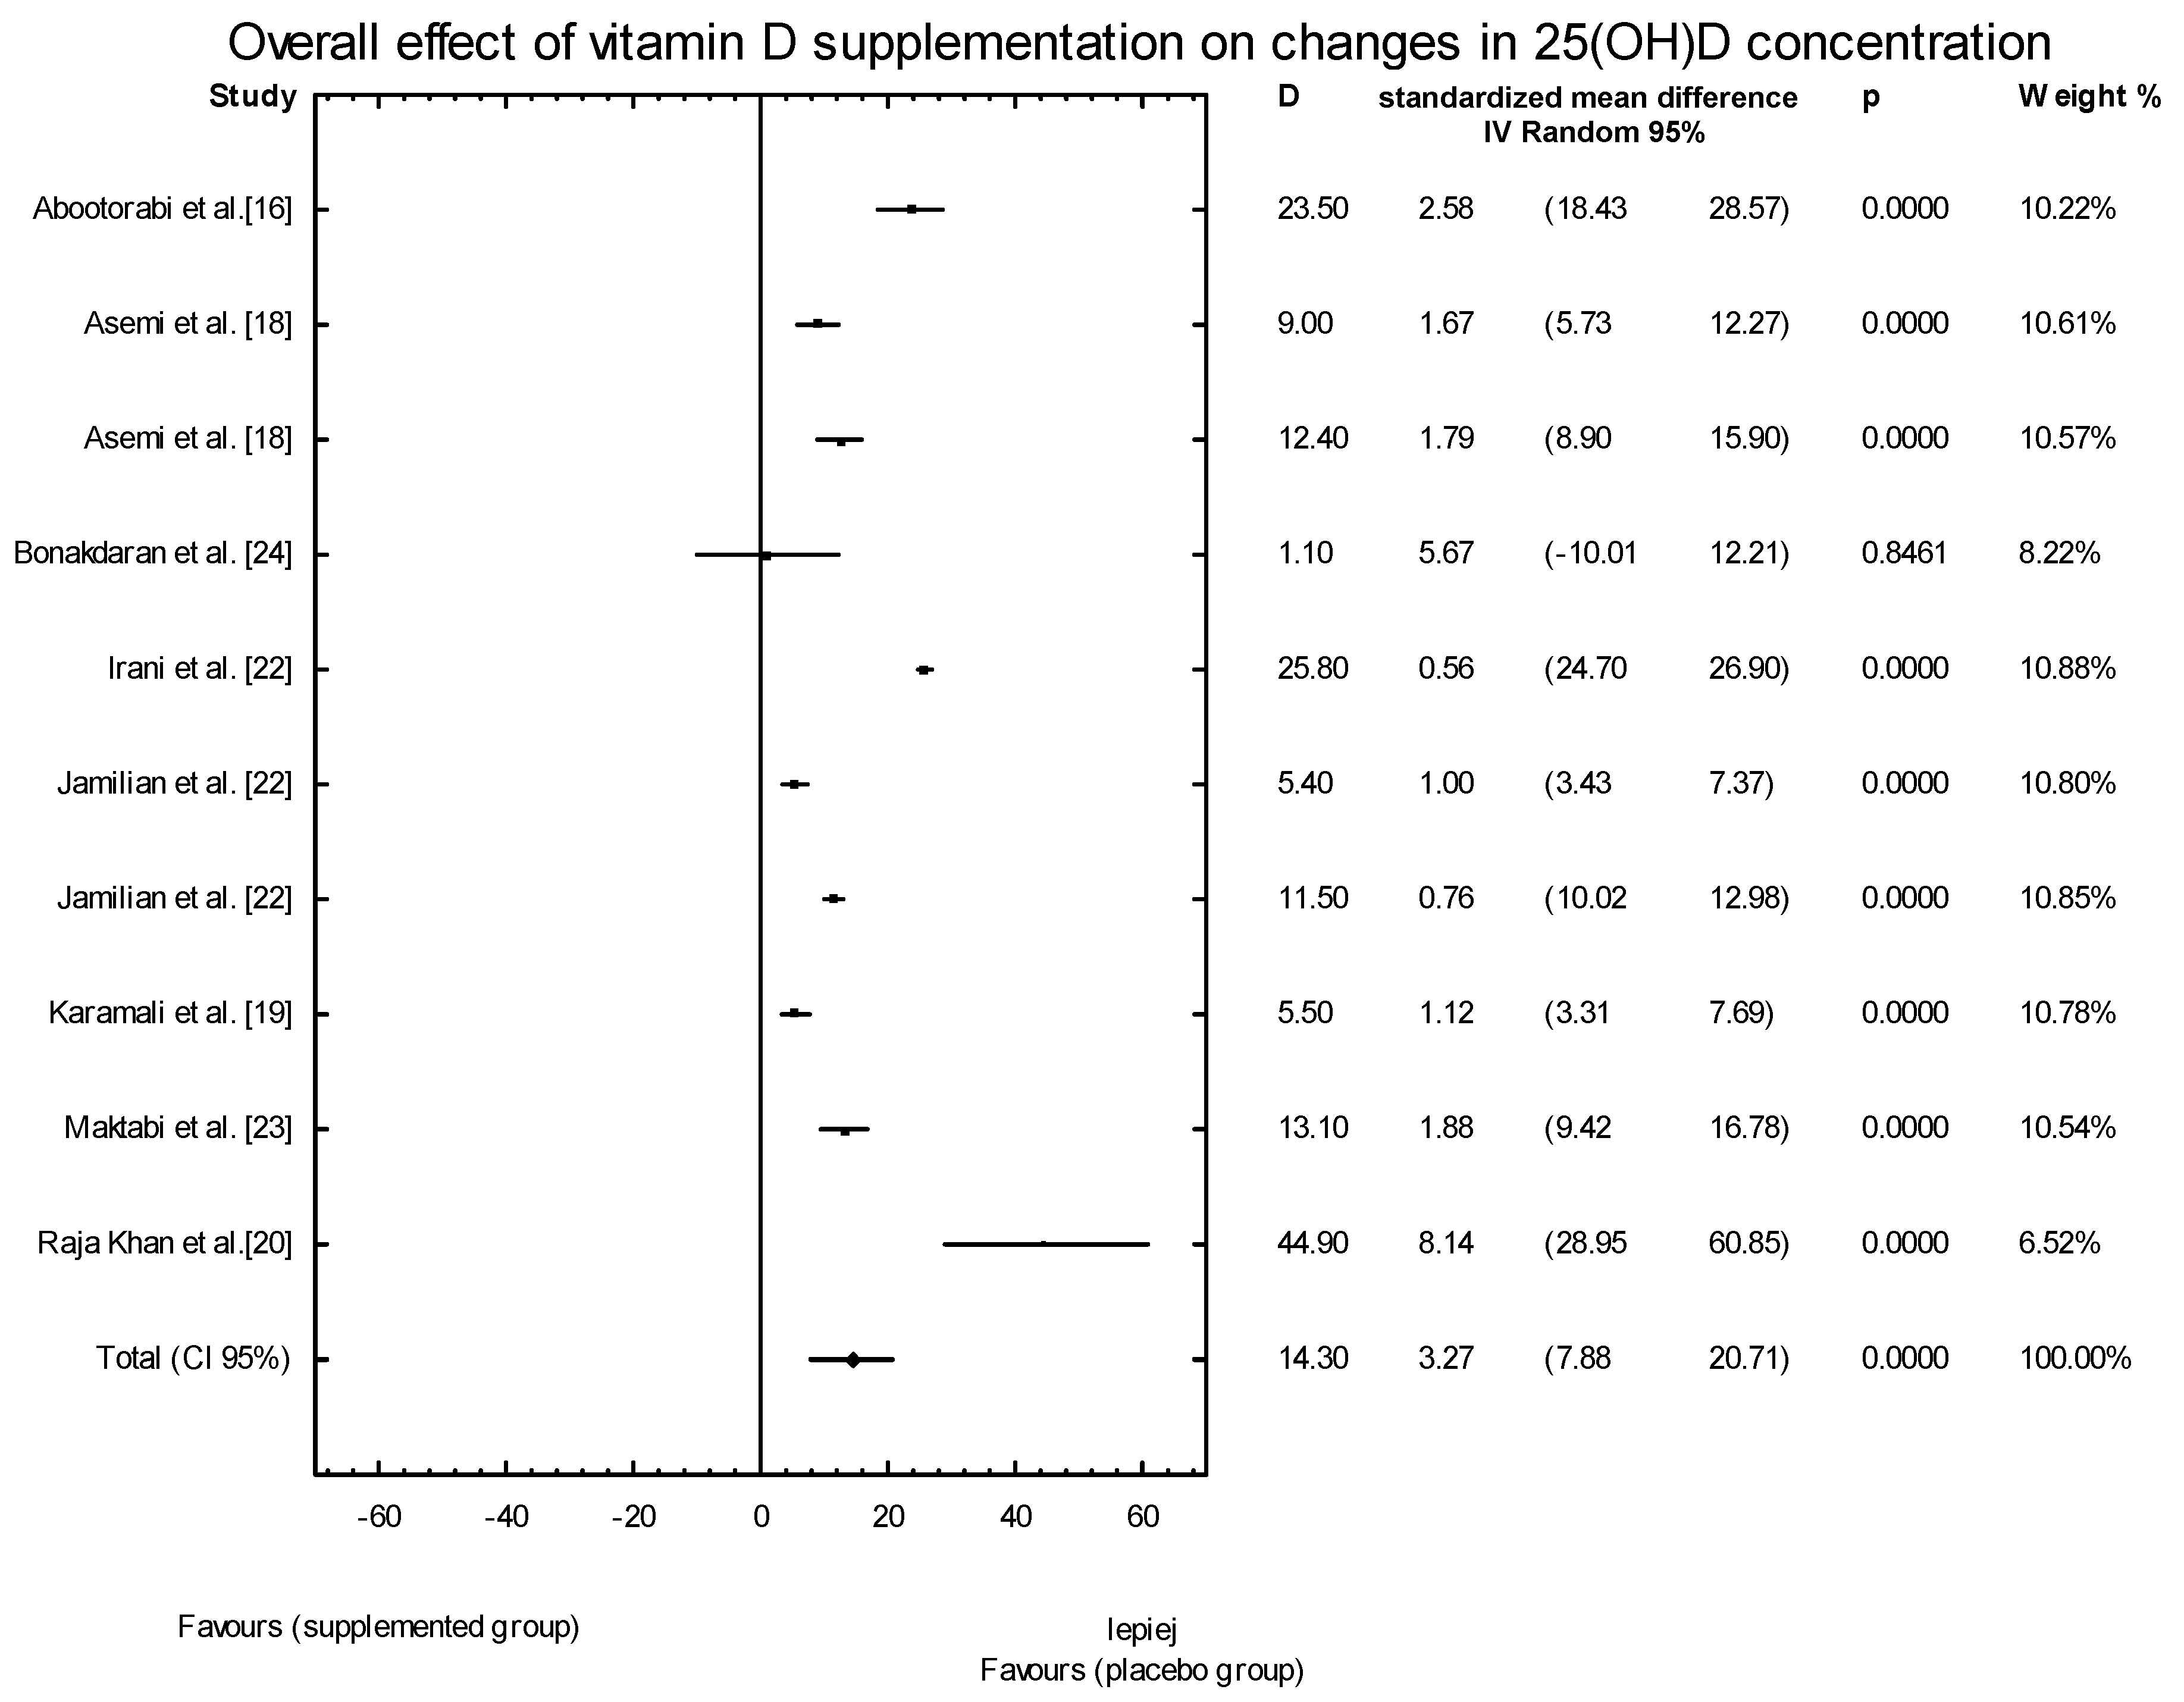
3.3. Effects of Vitamin D Supplementation on 25(OH)D Levels
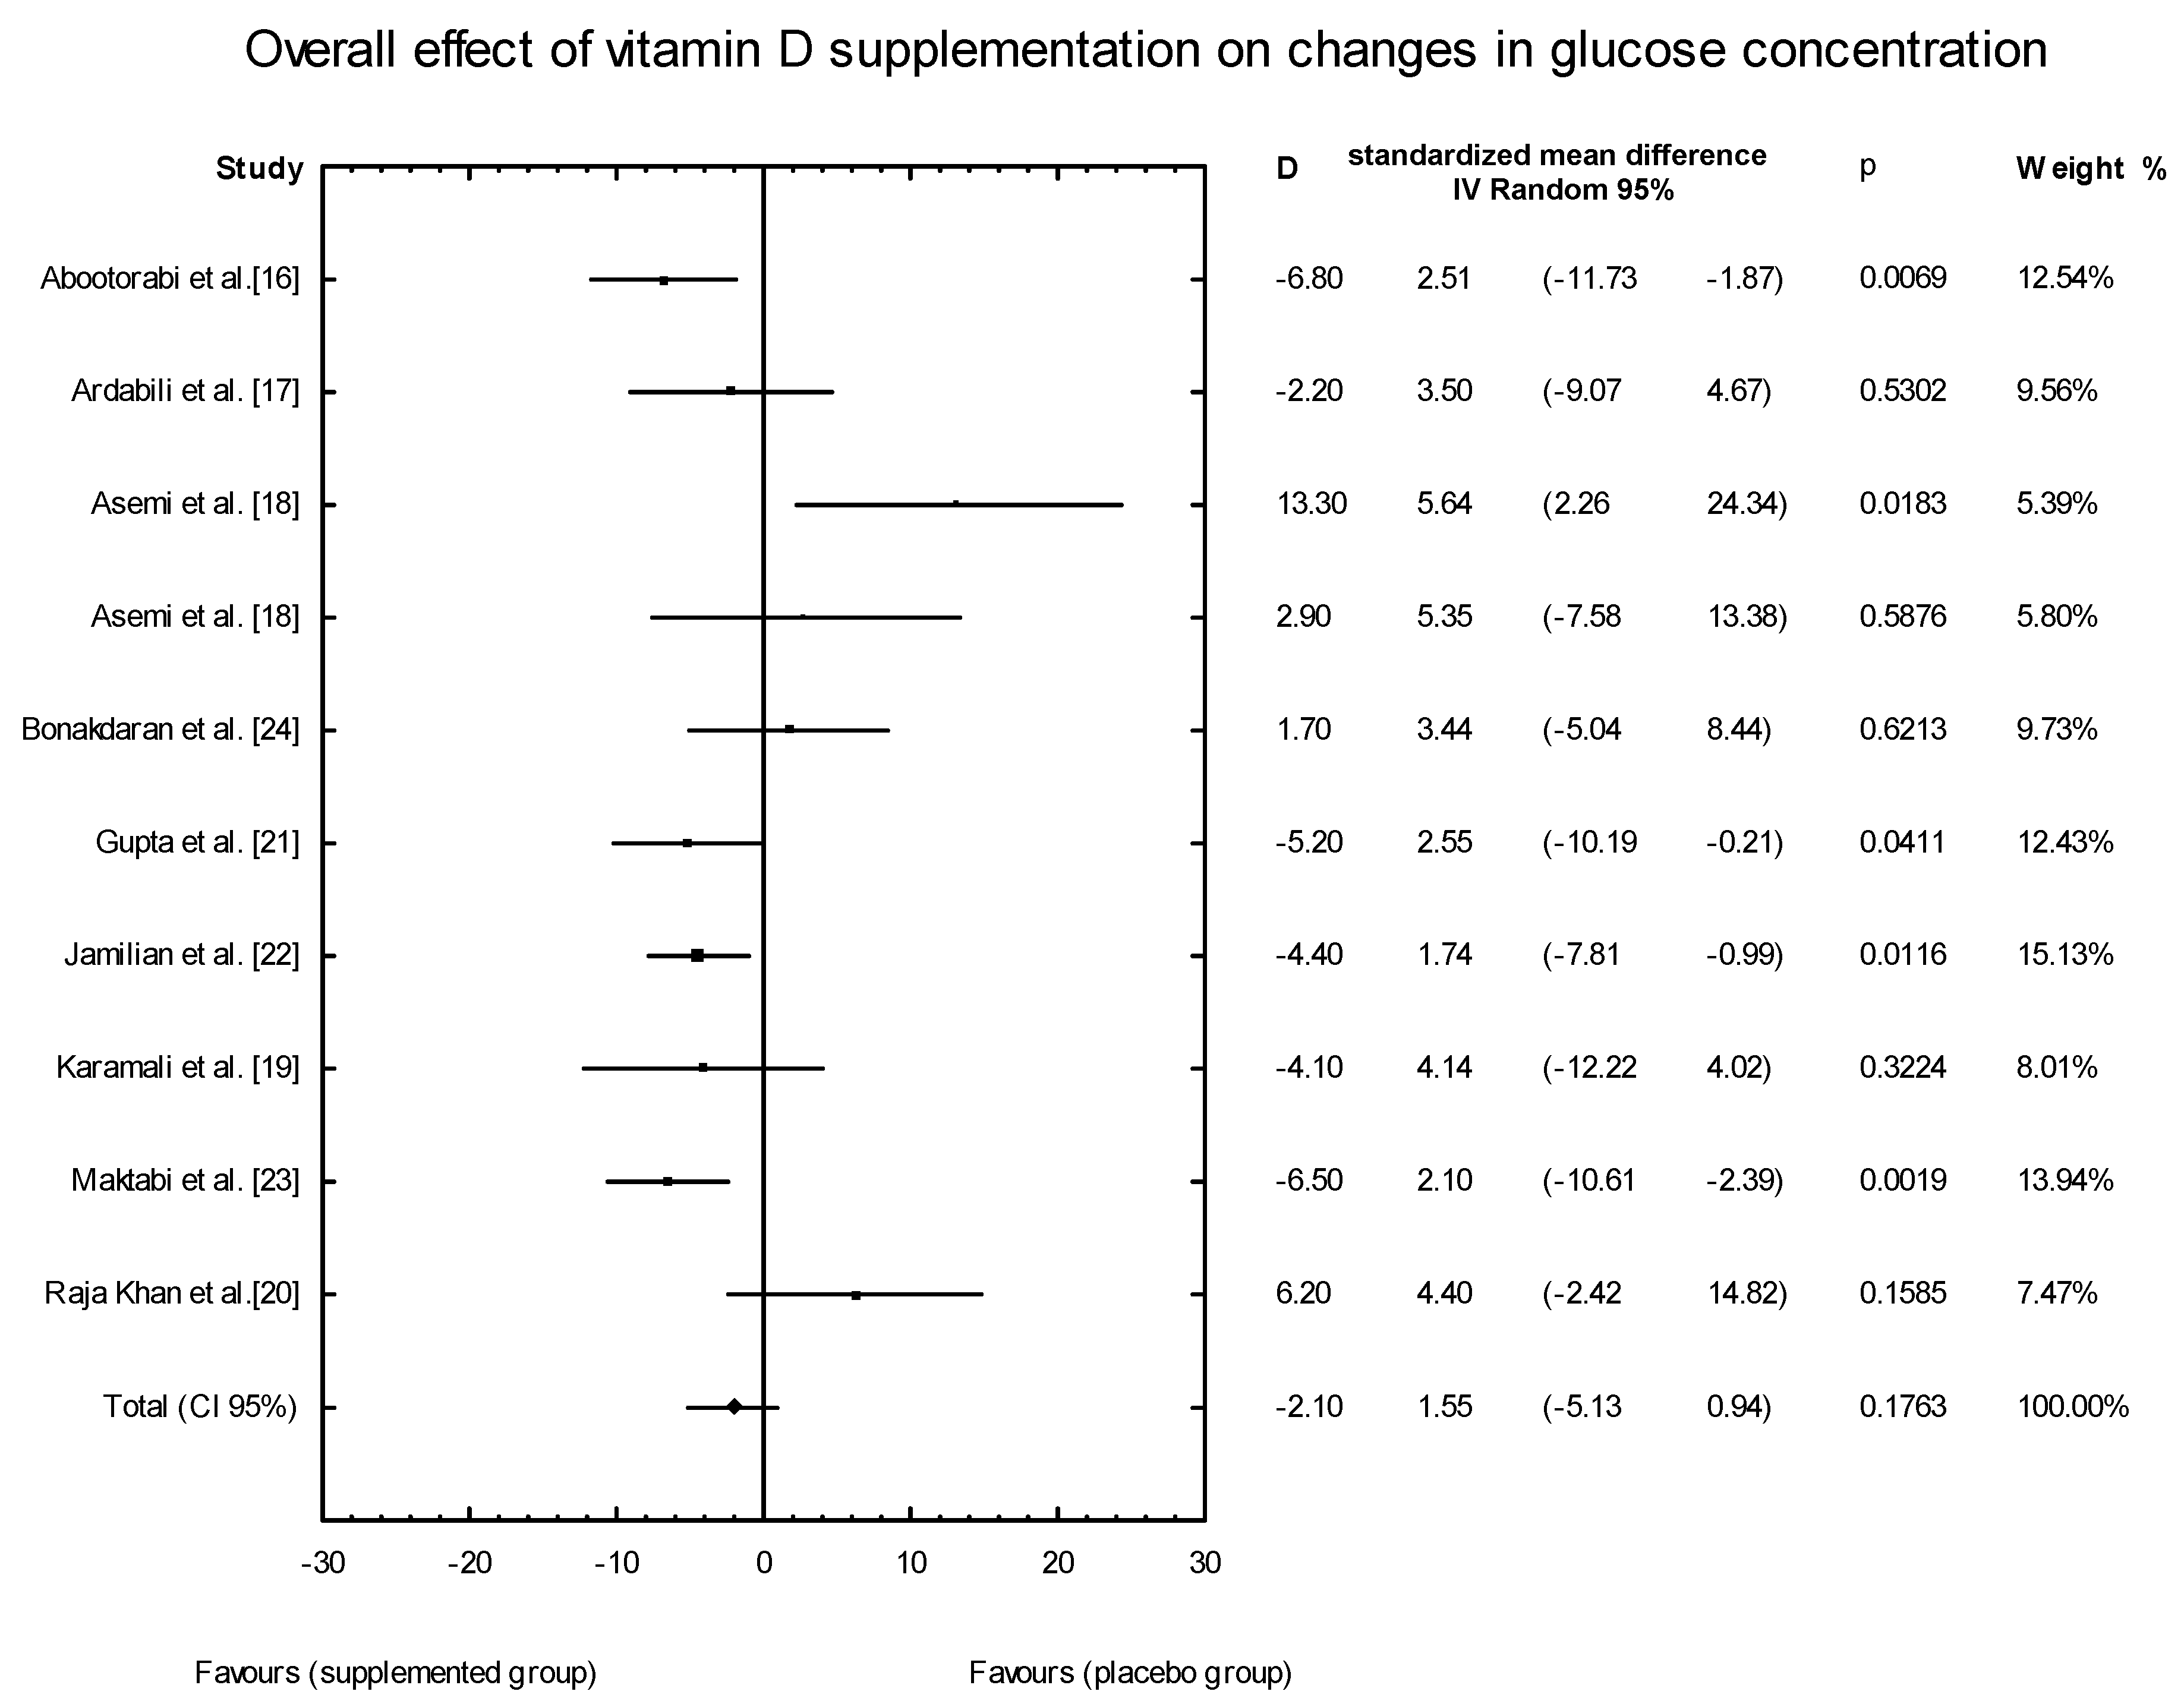
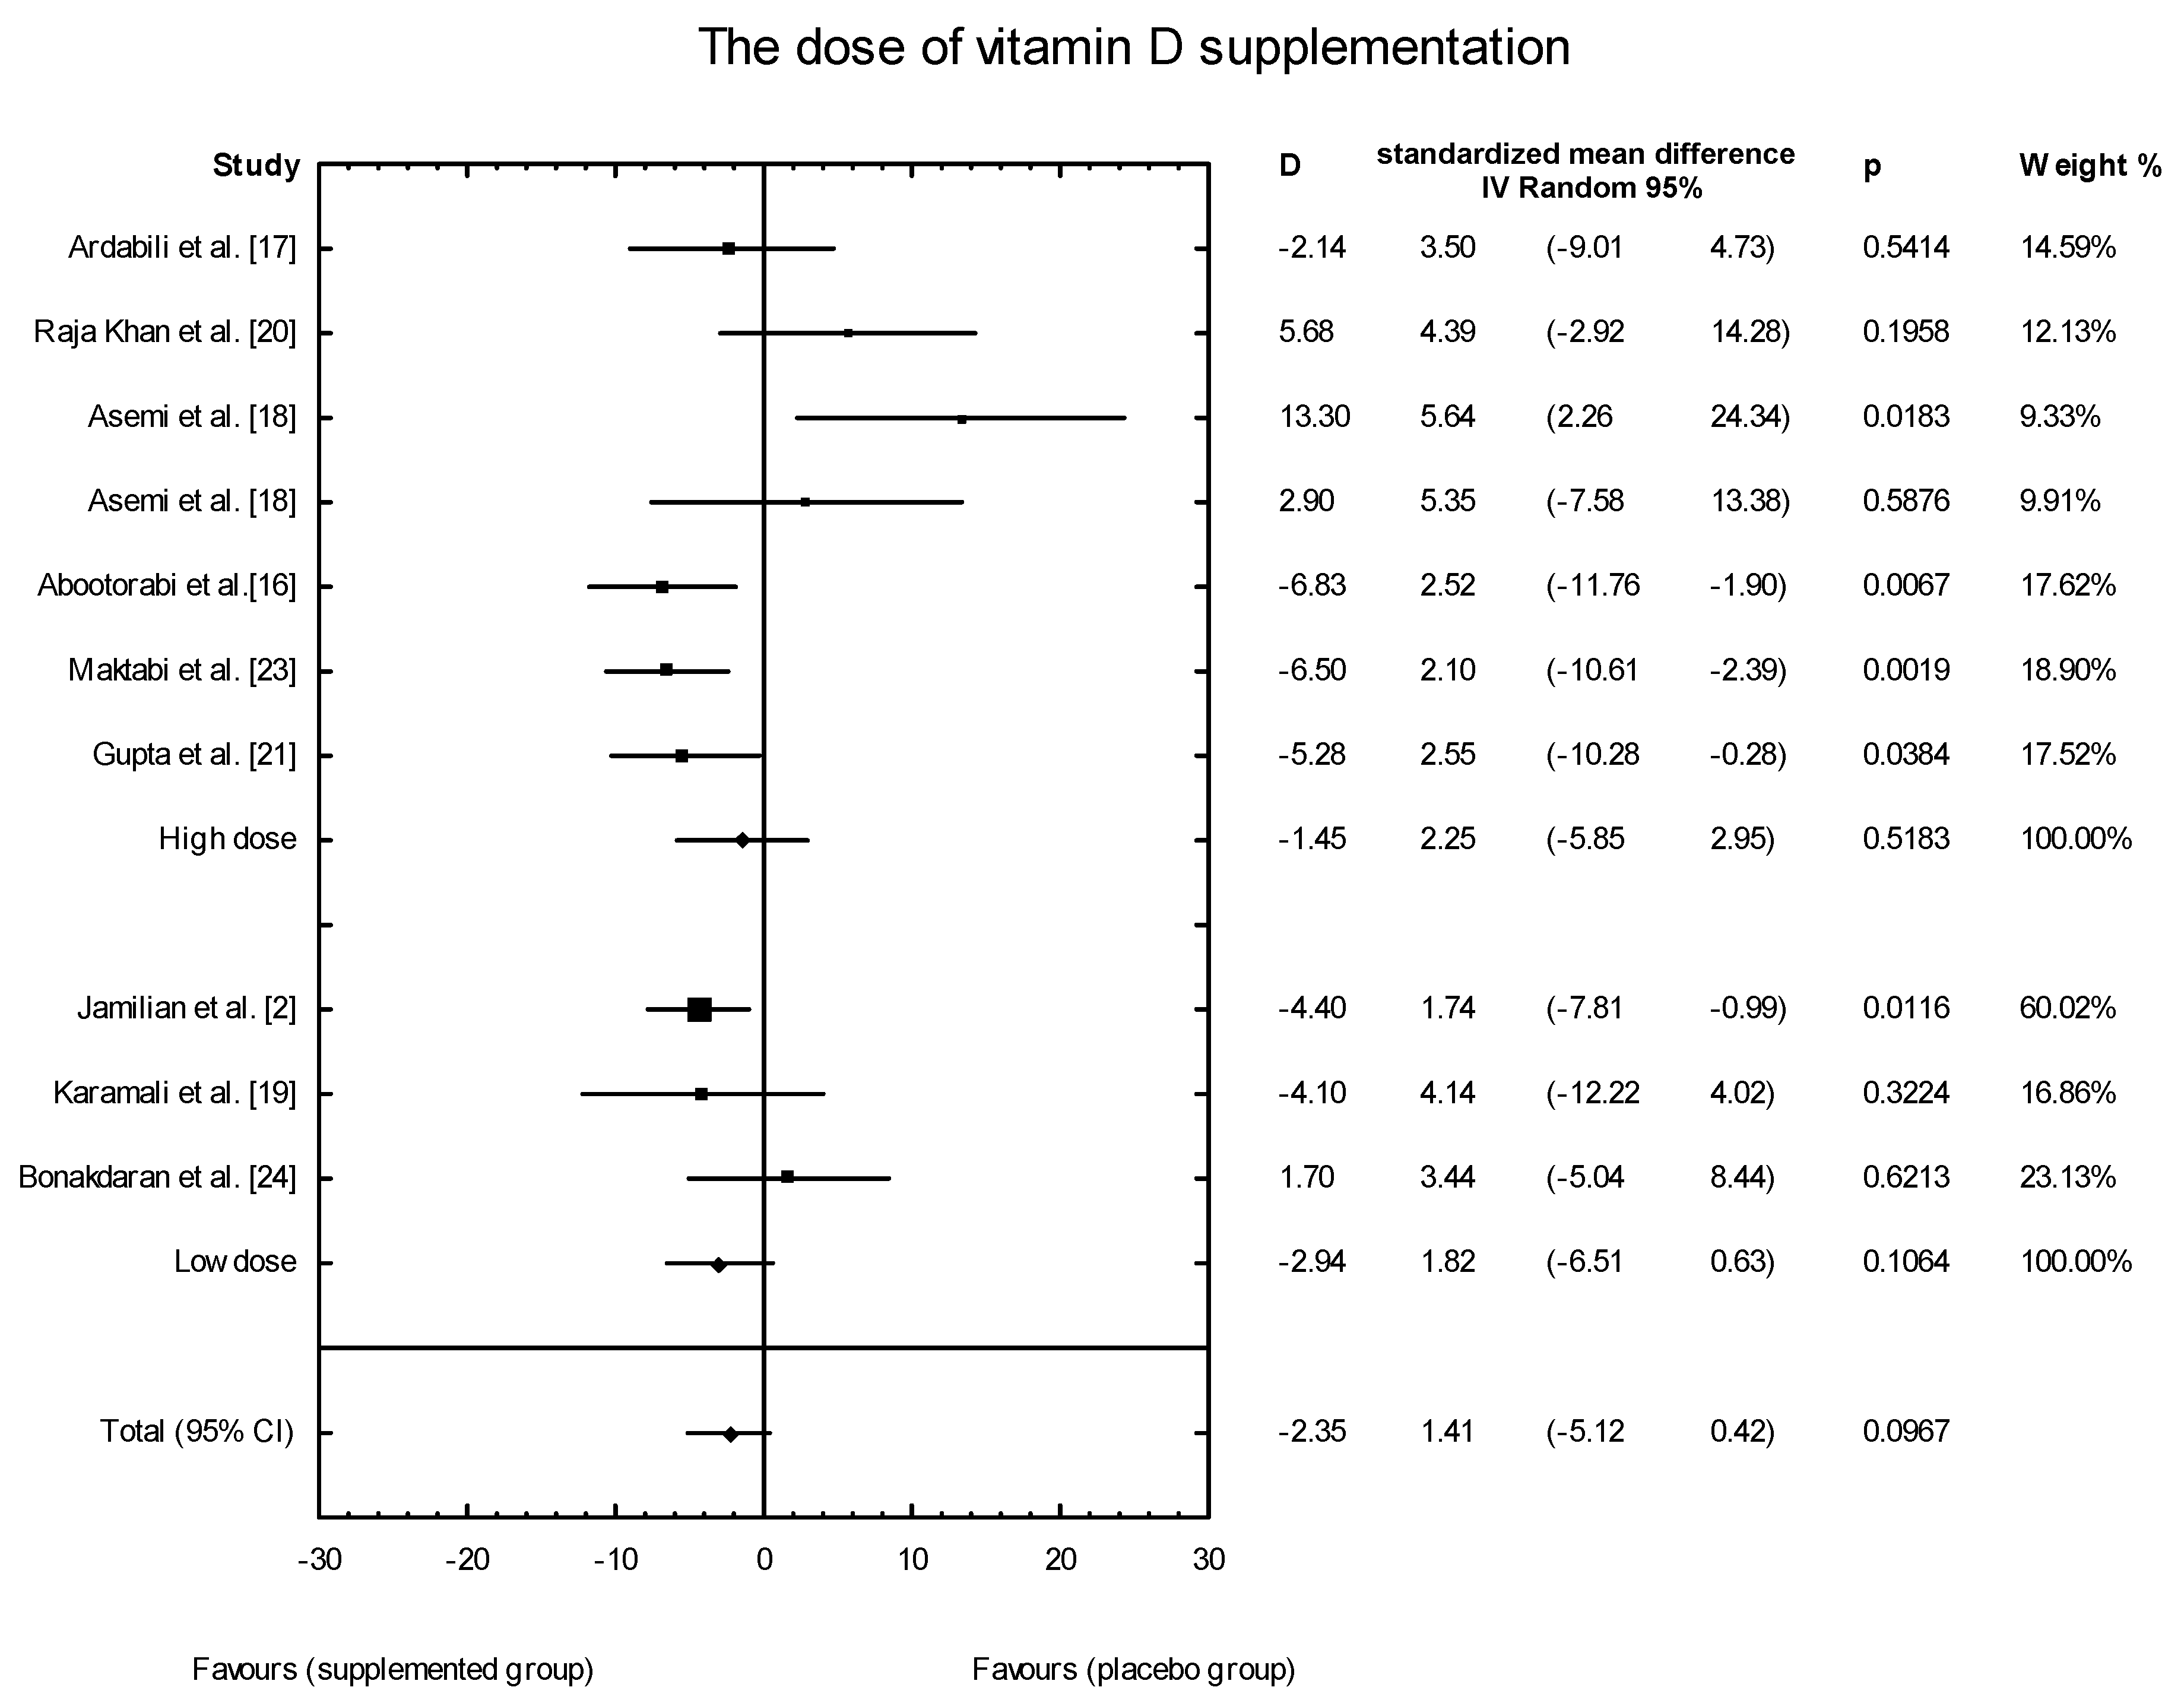
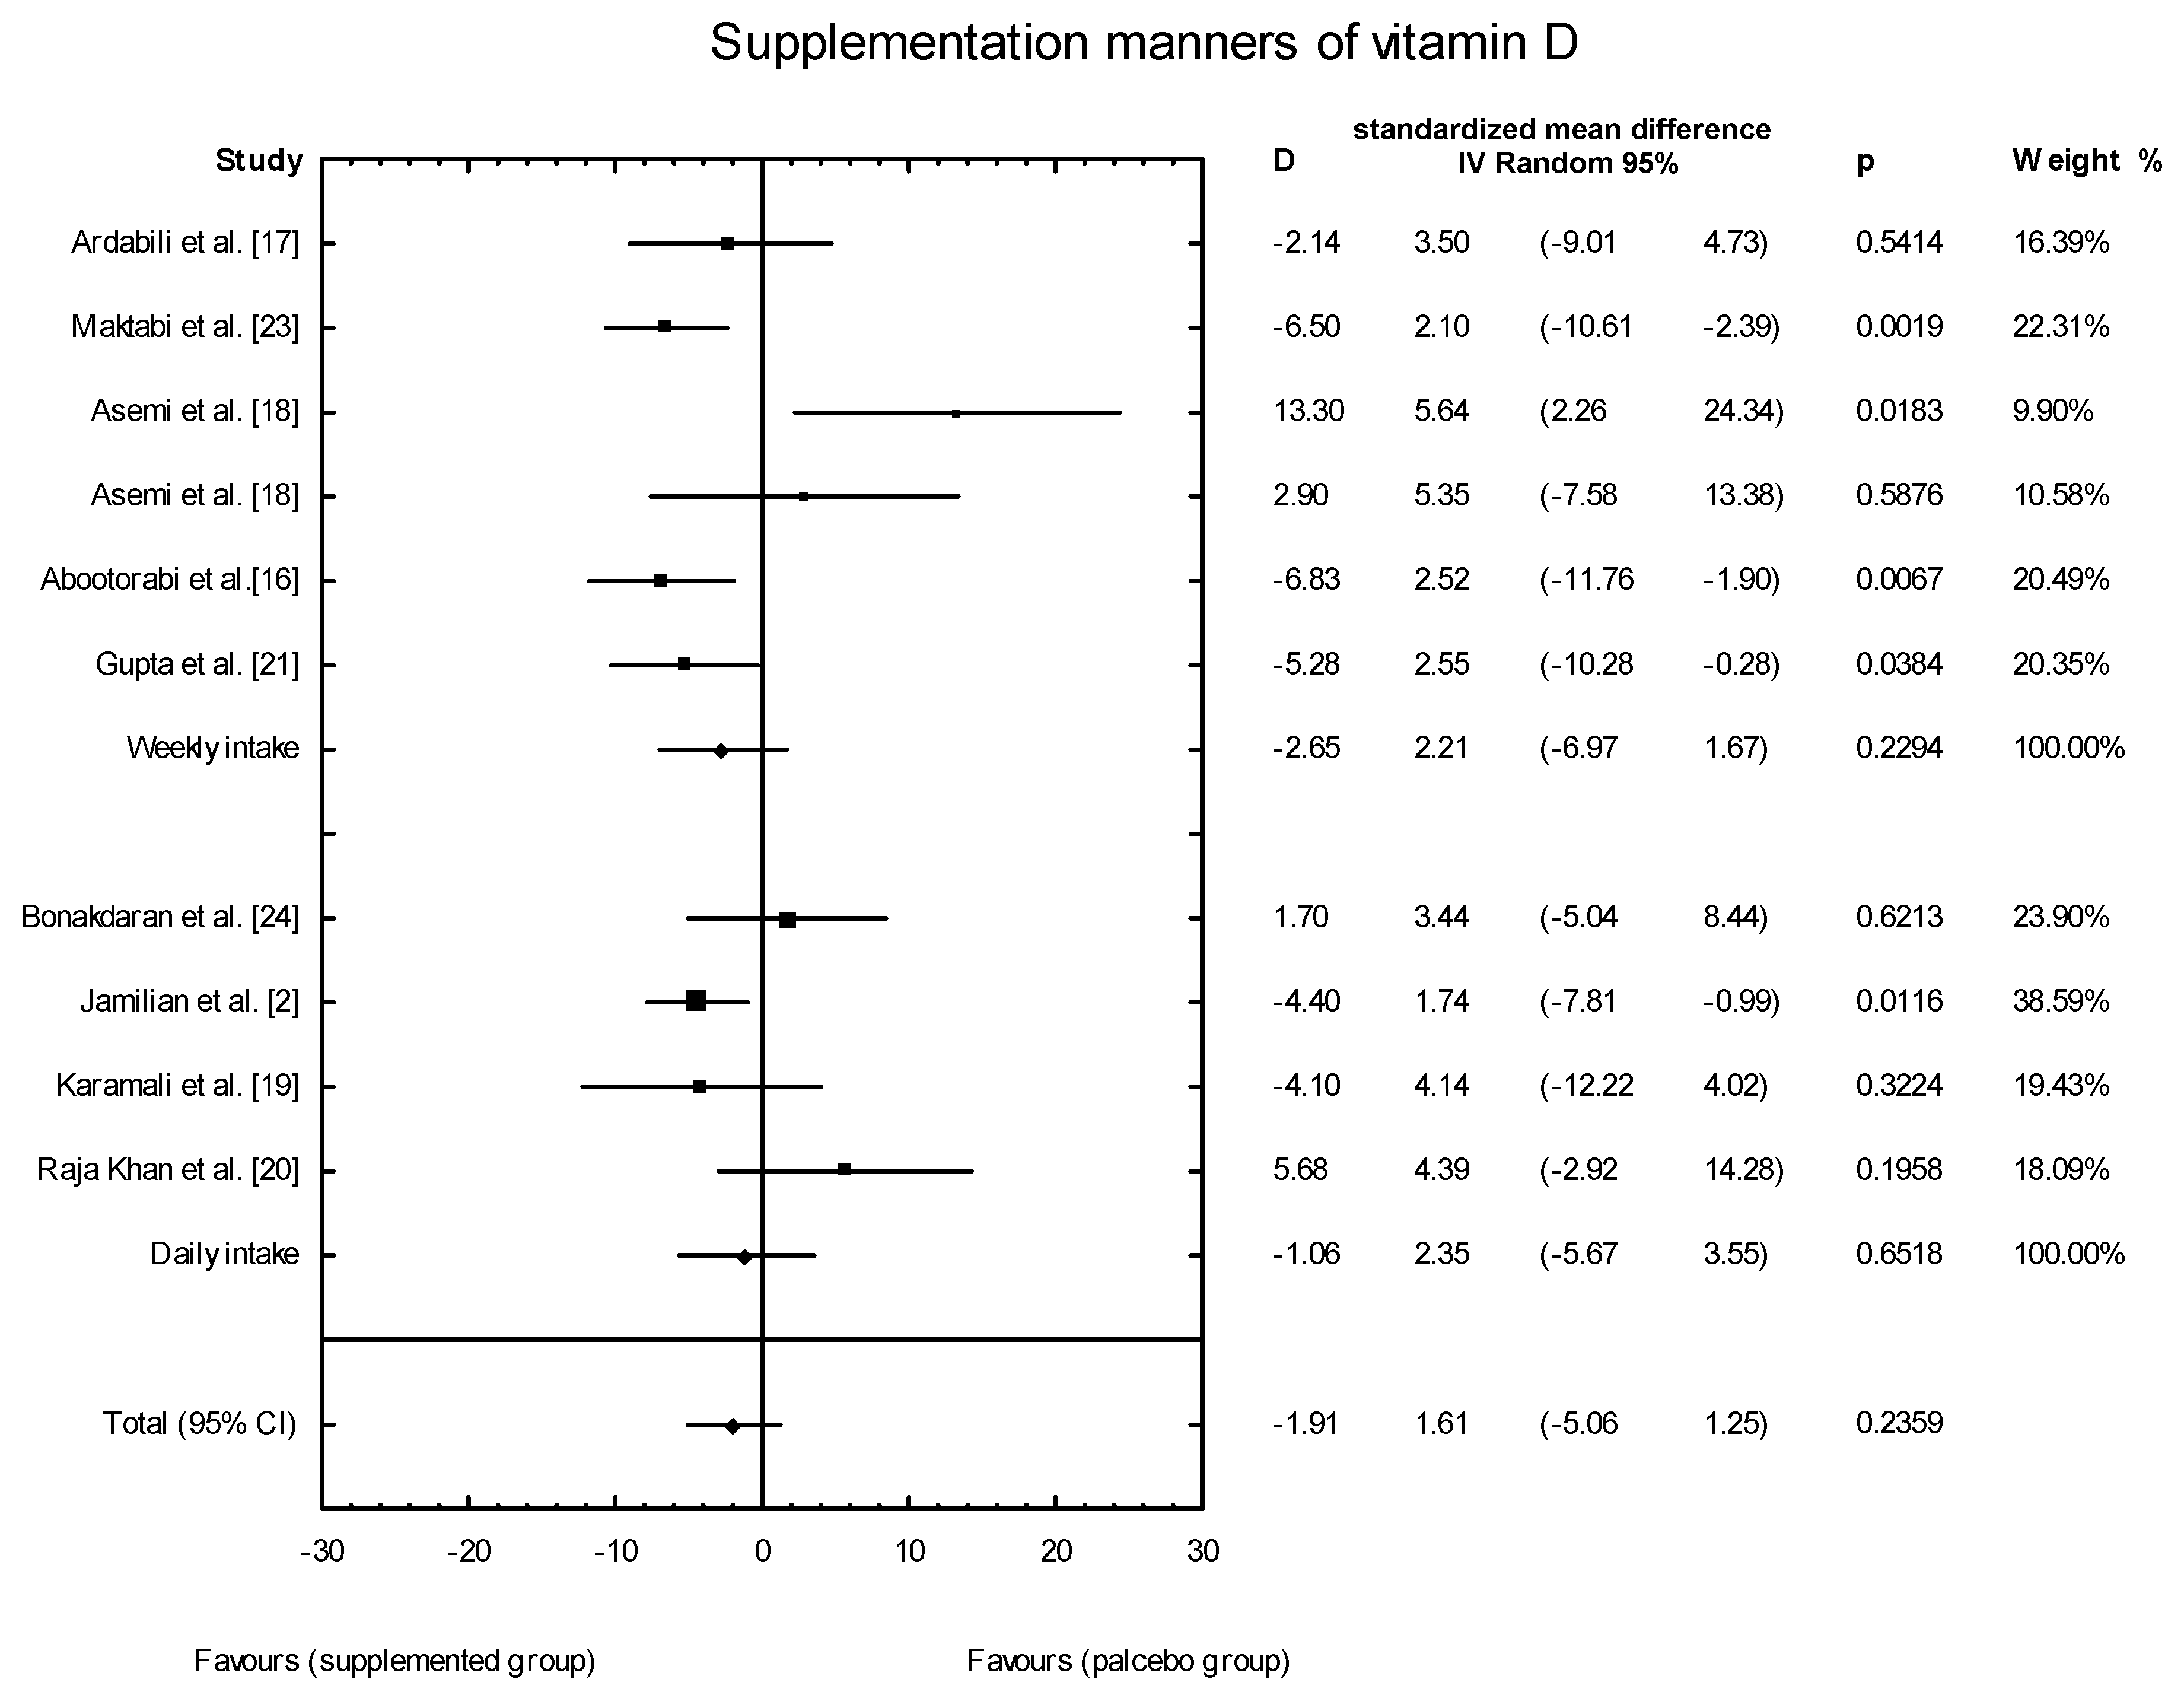
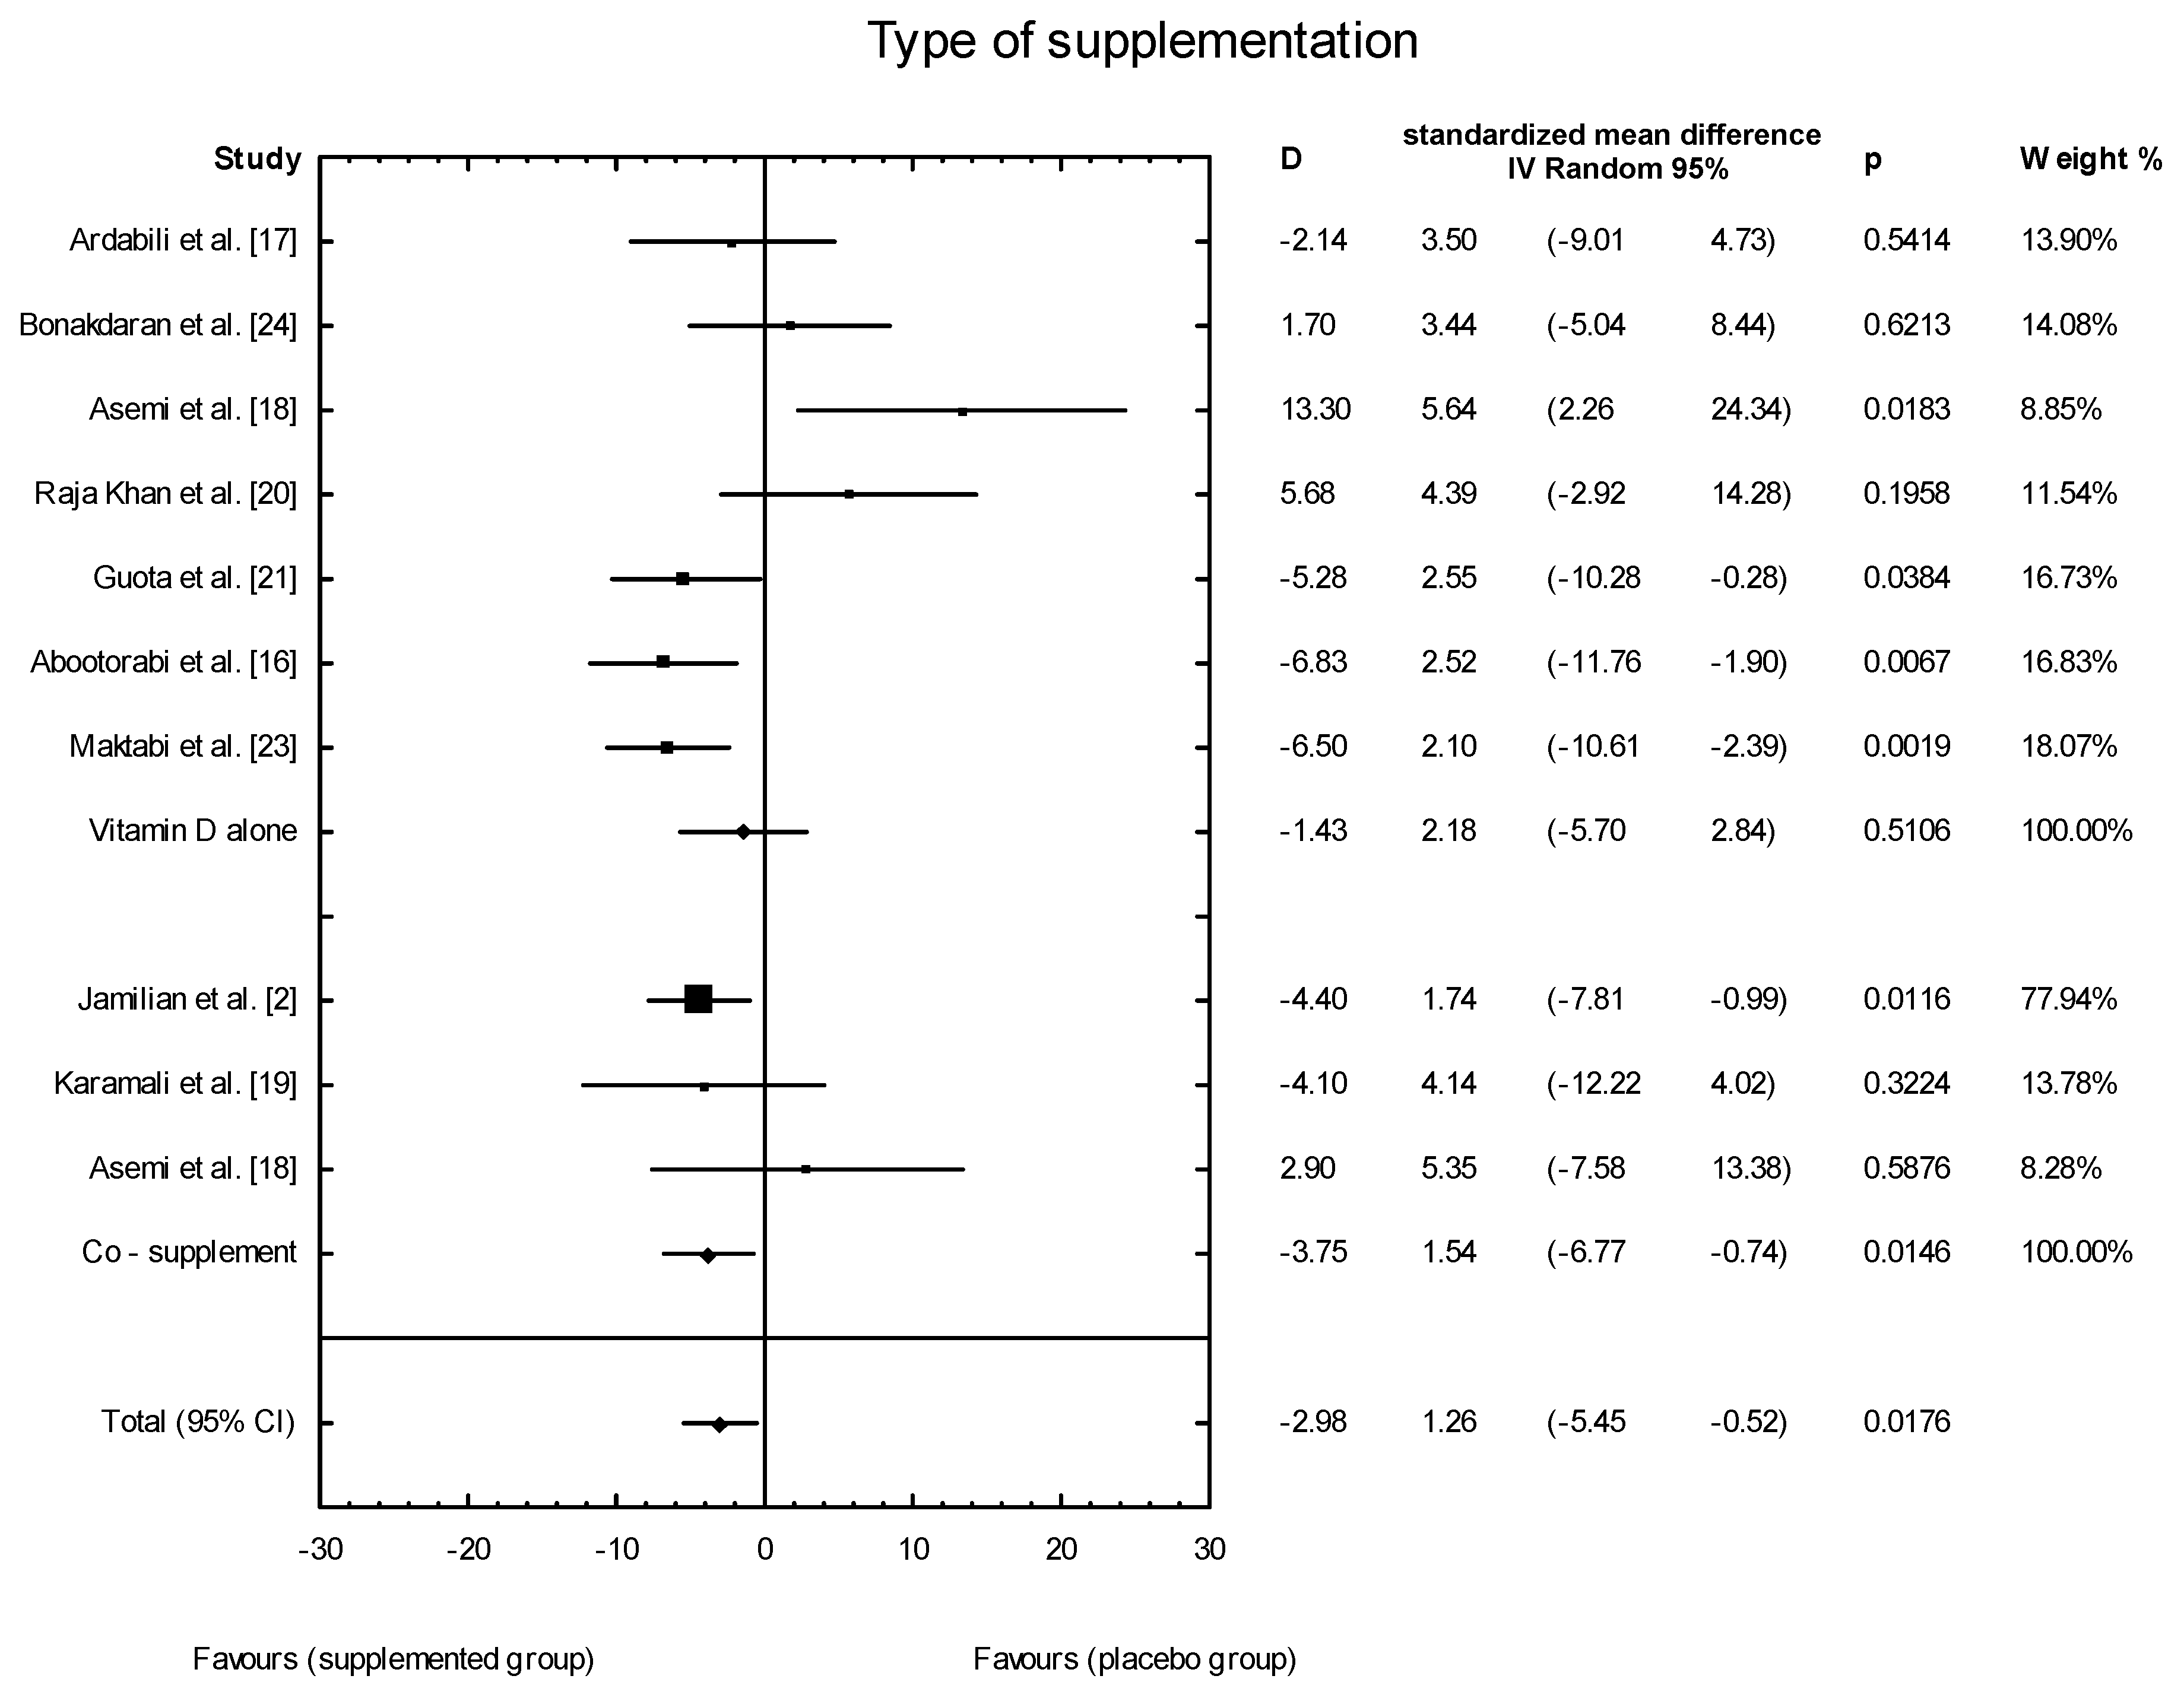
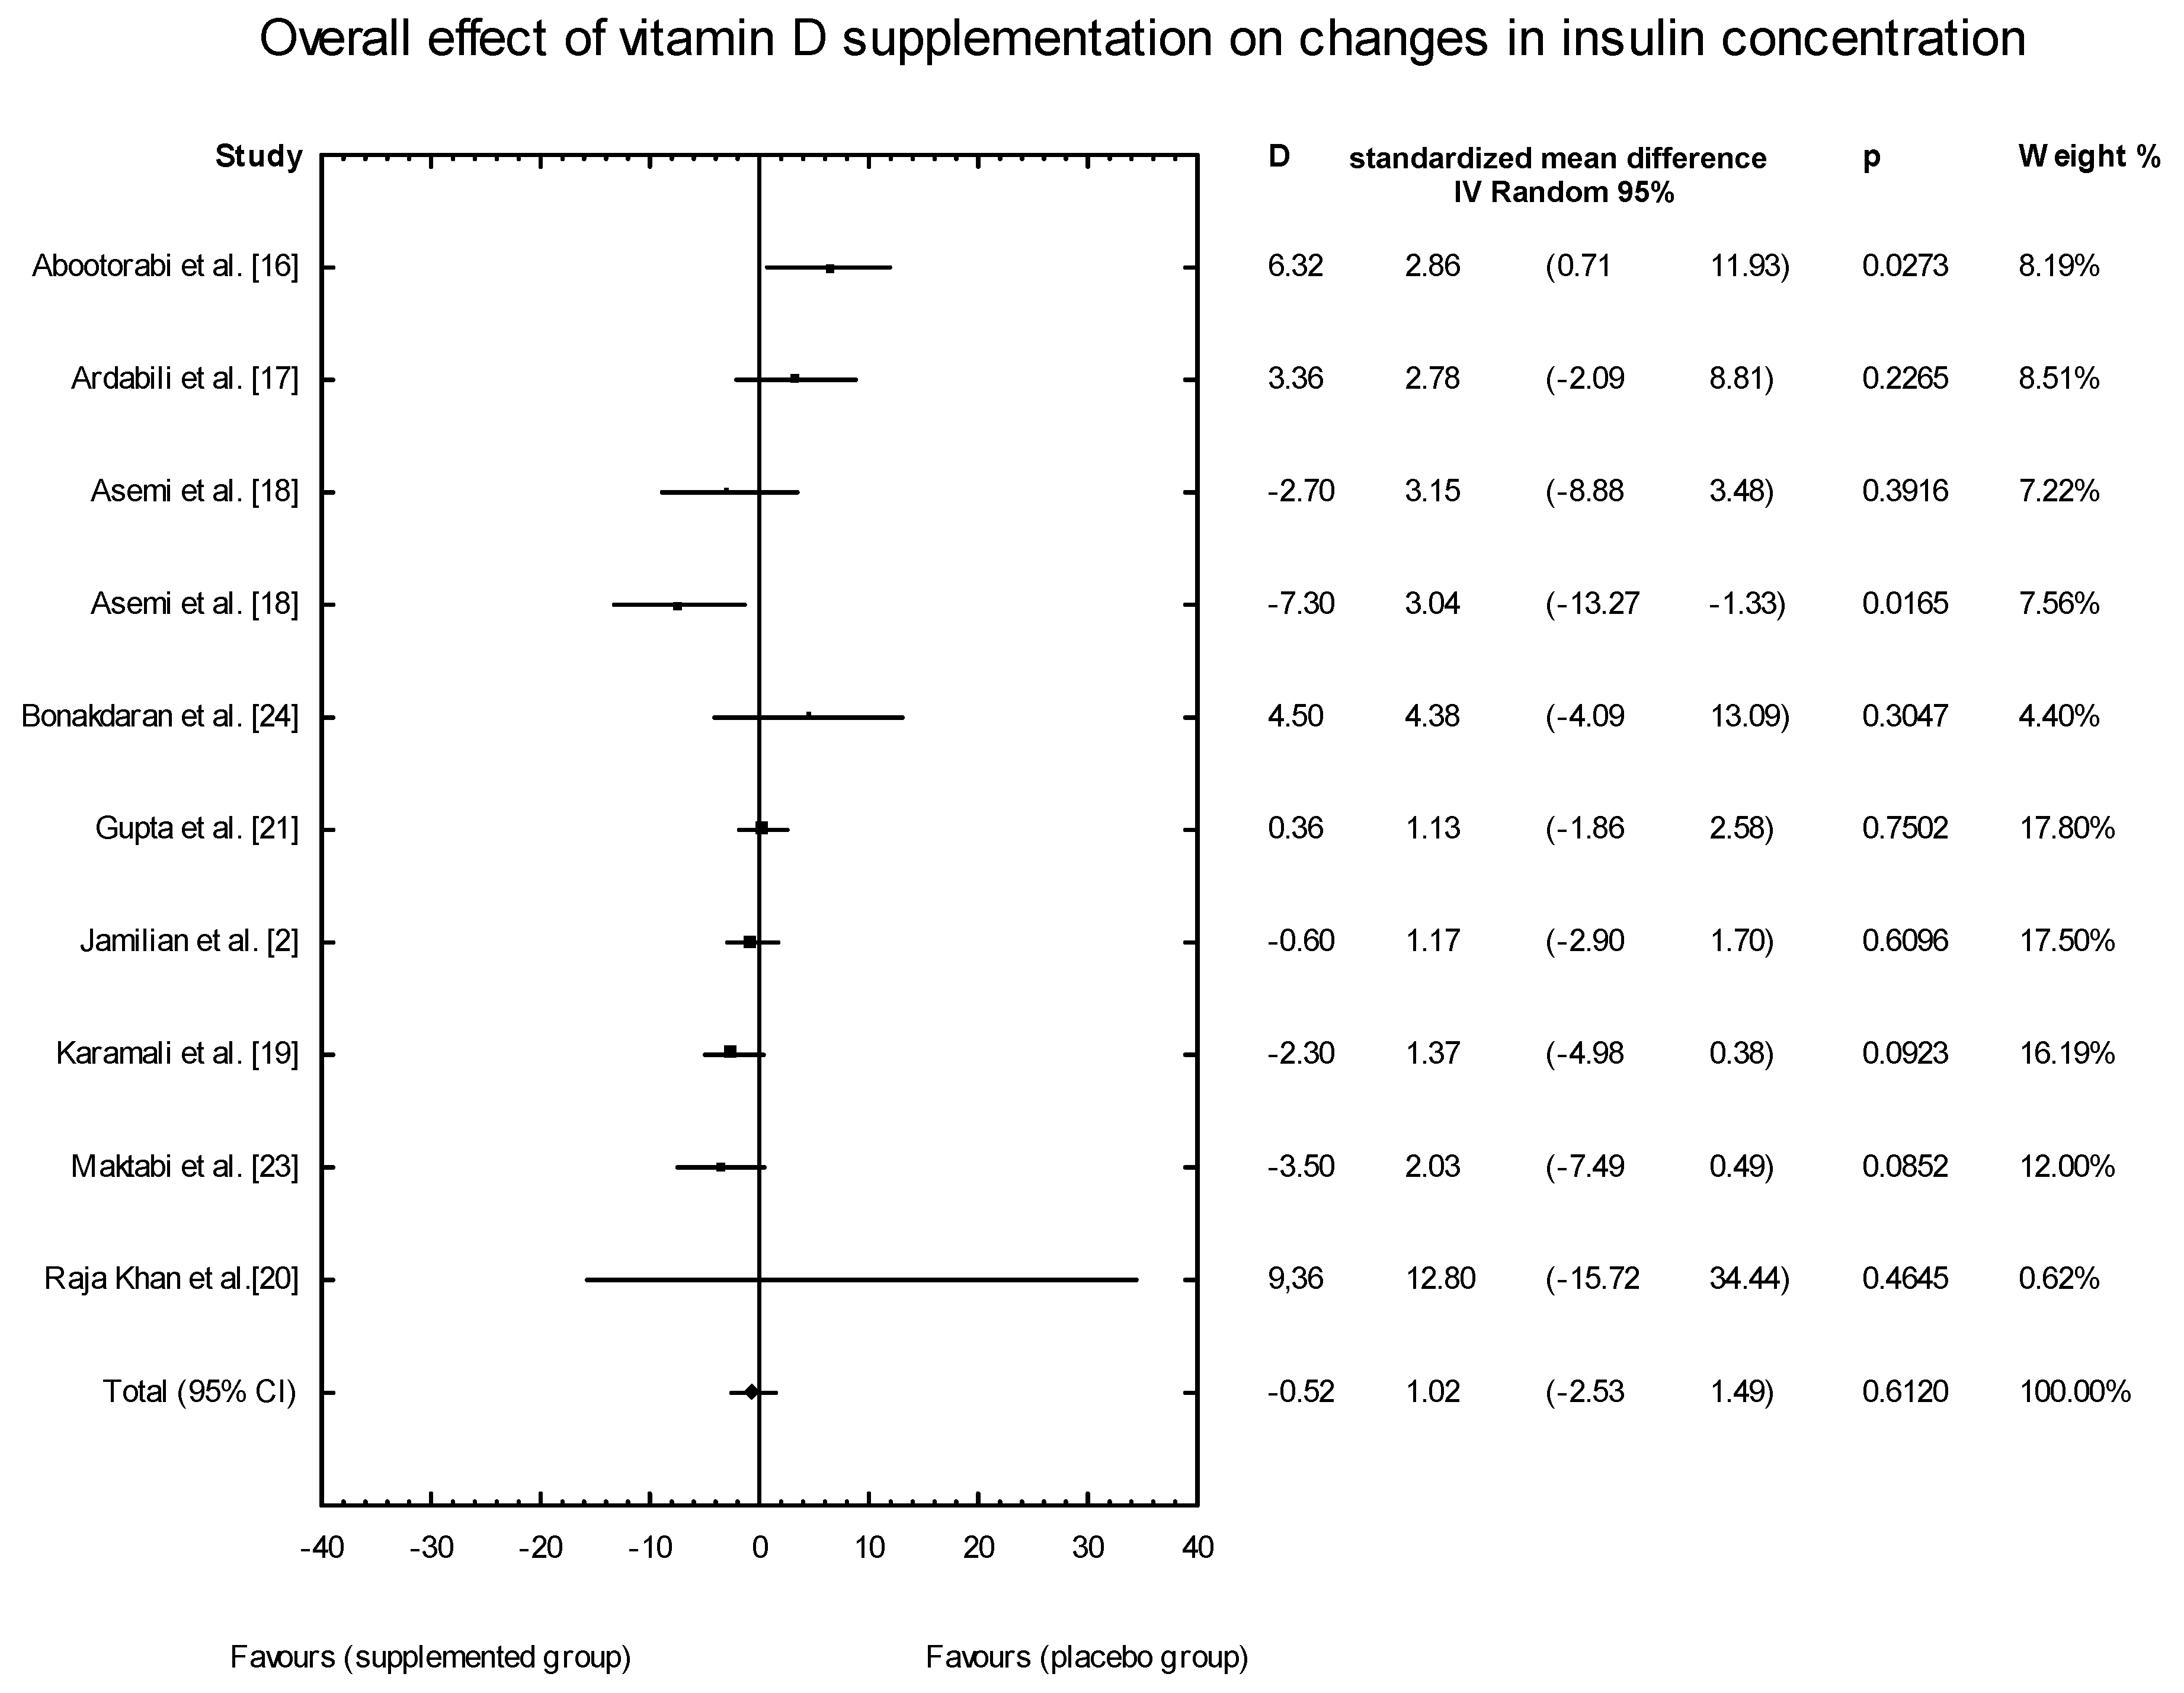
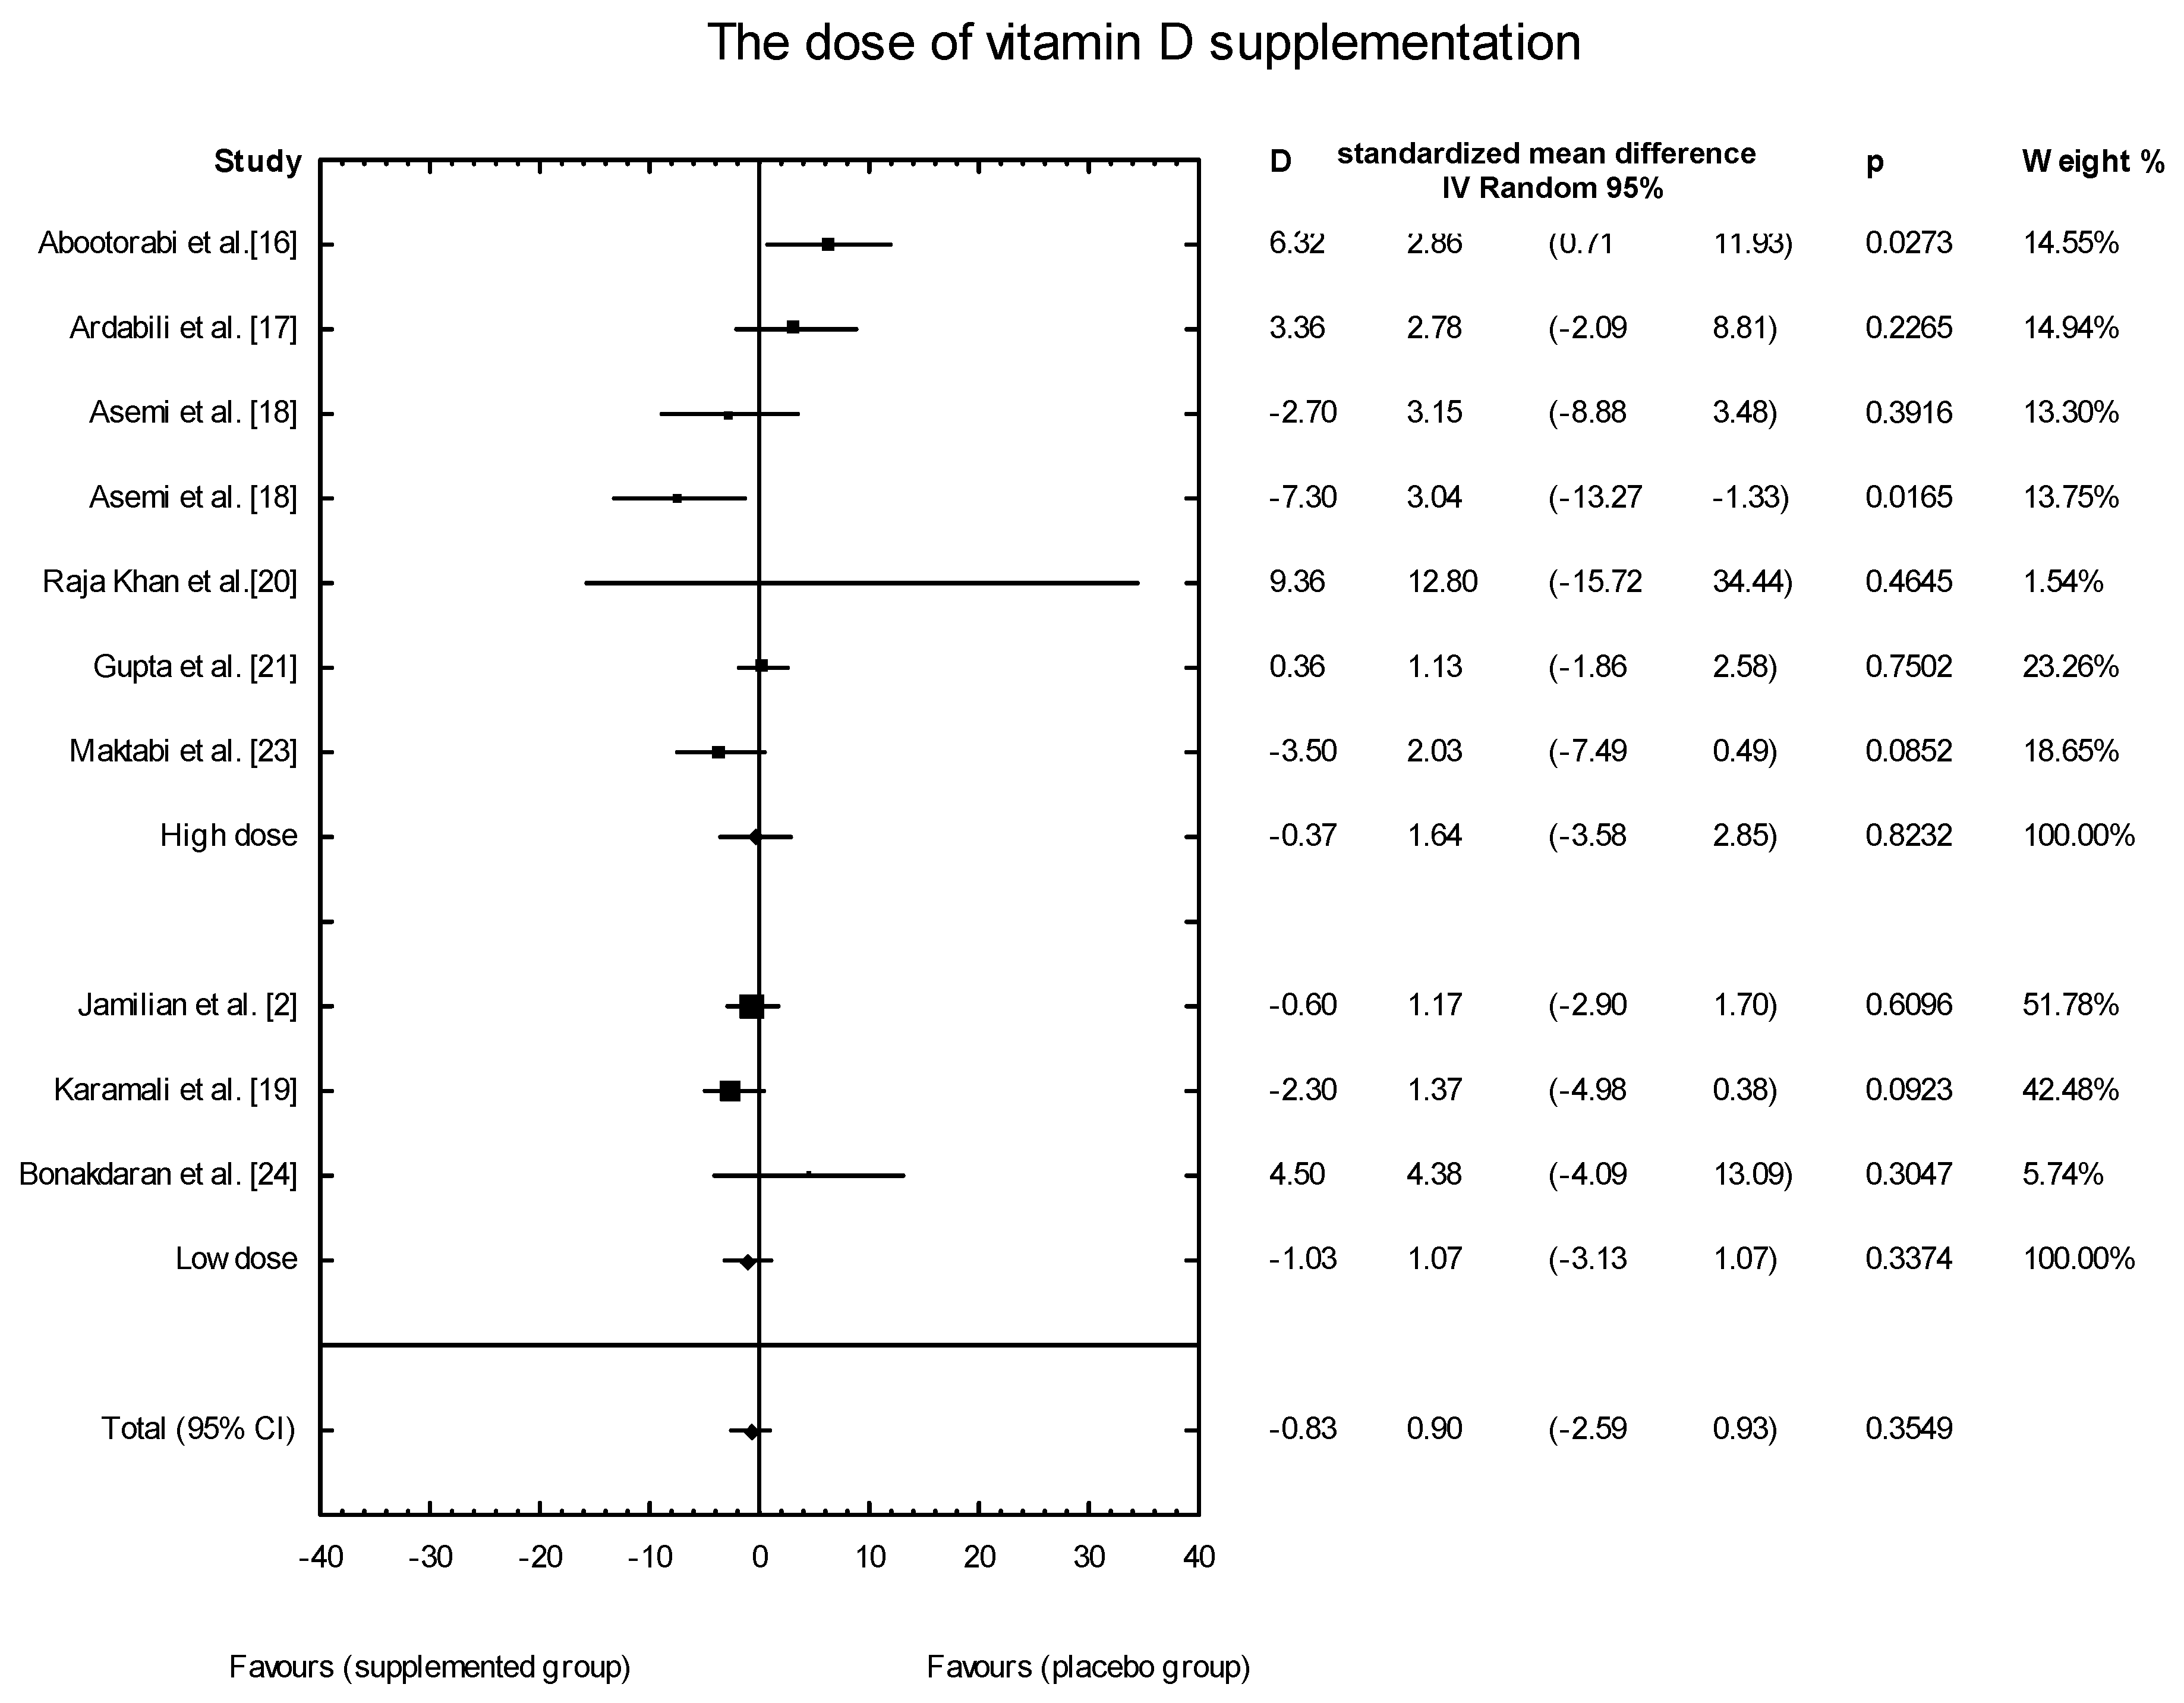
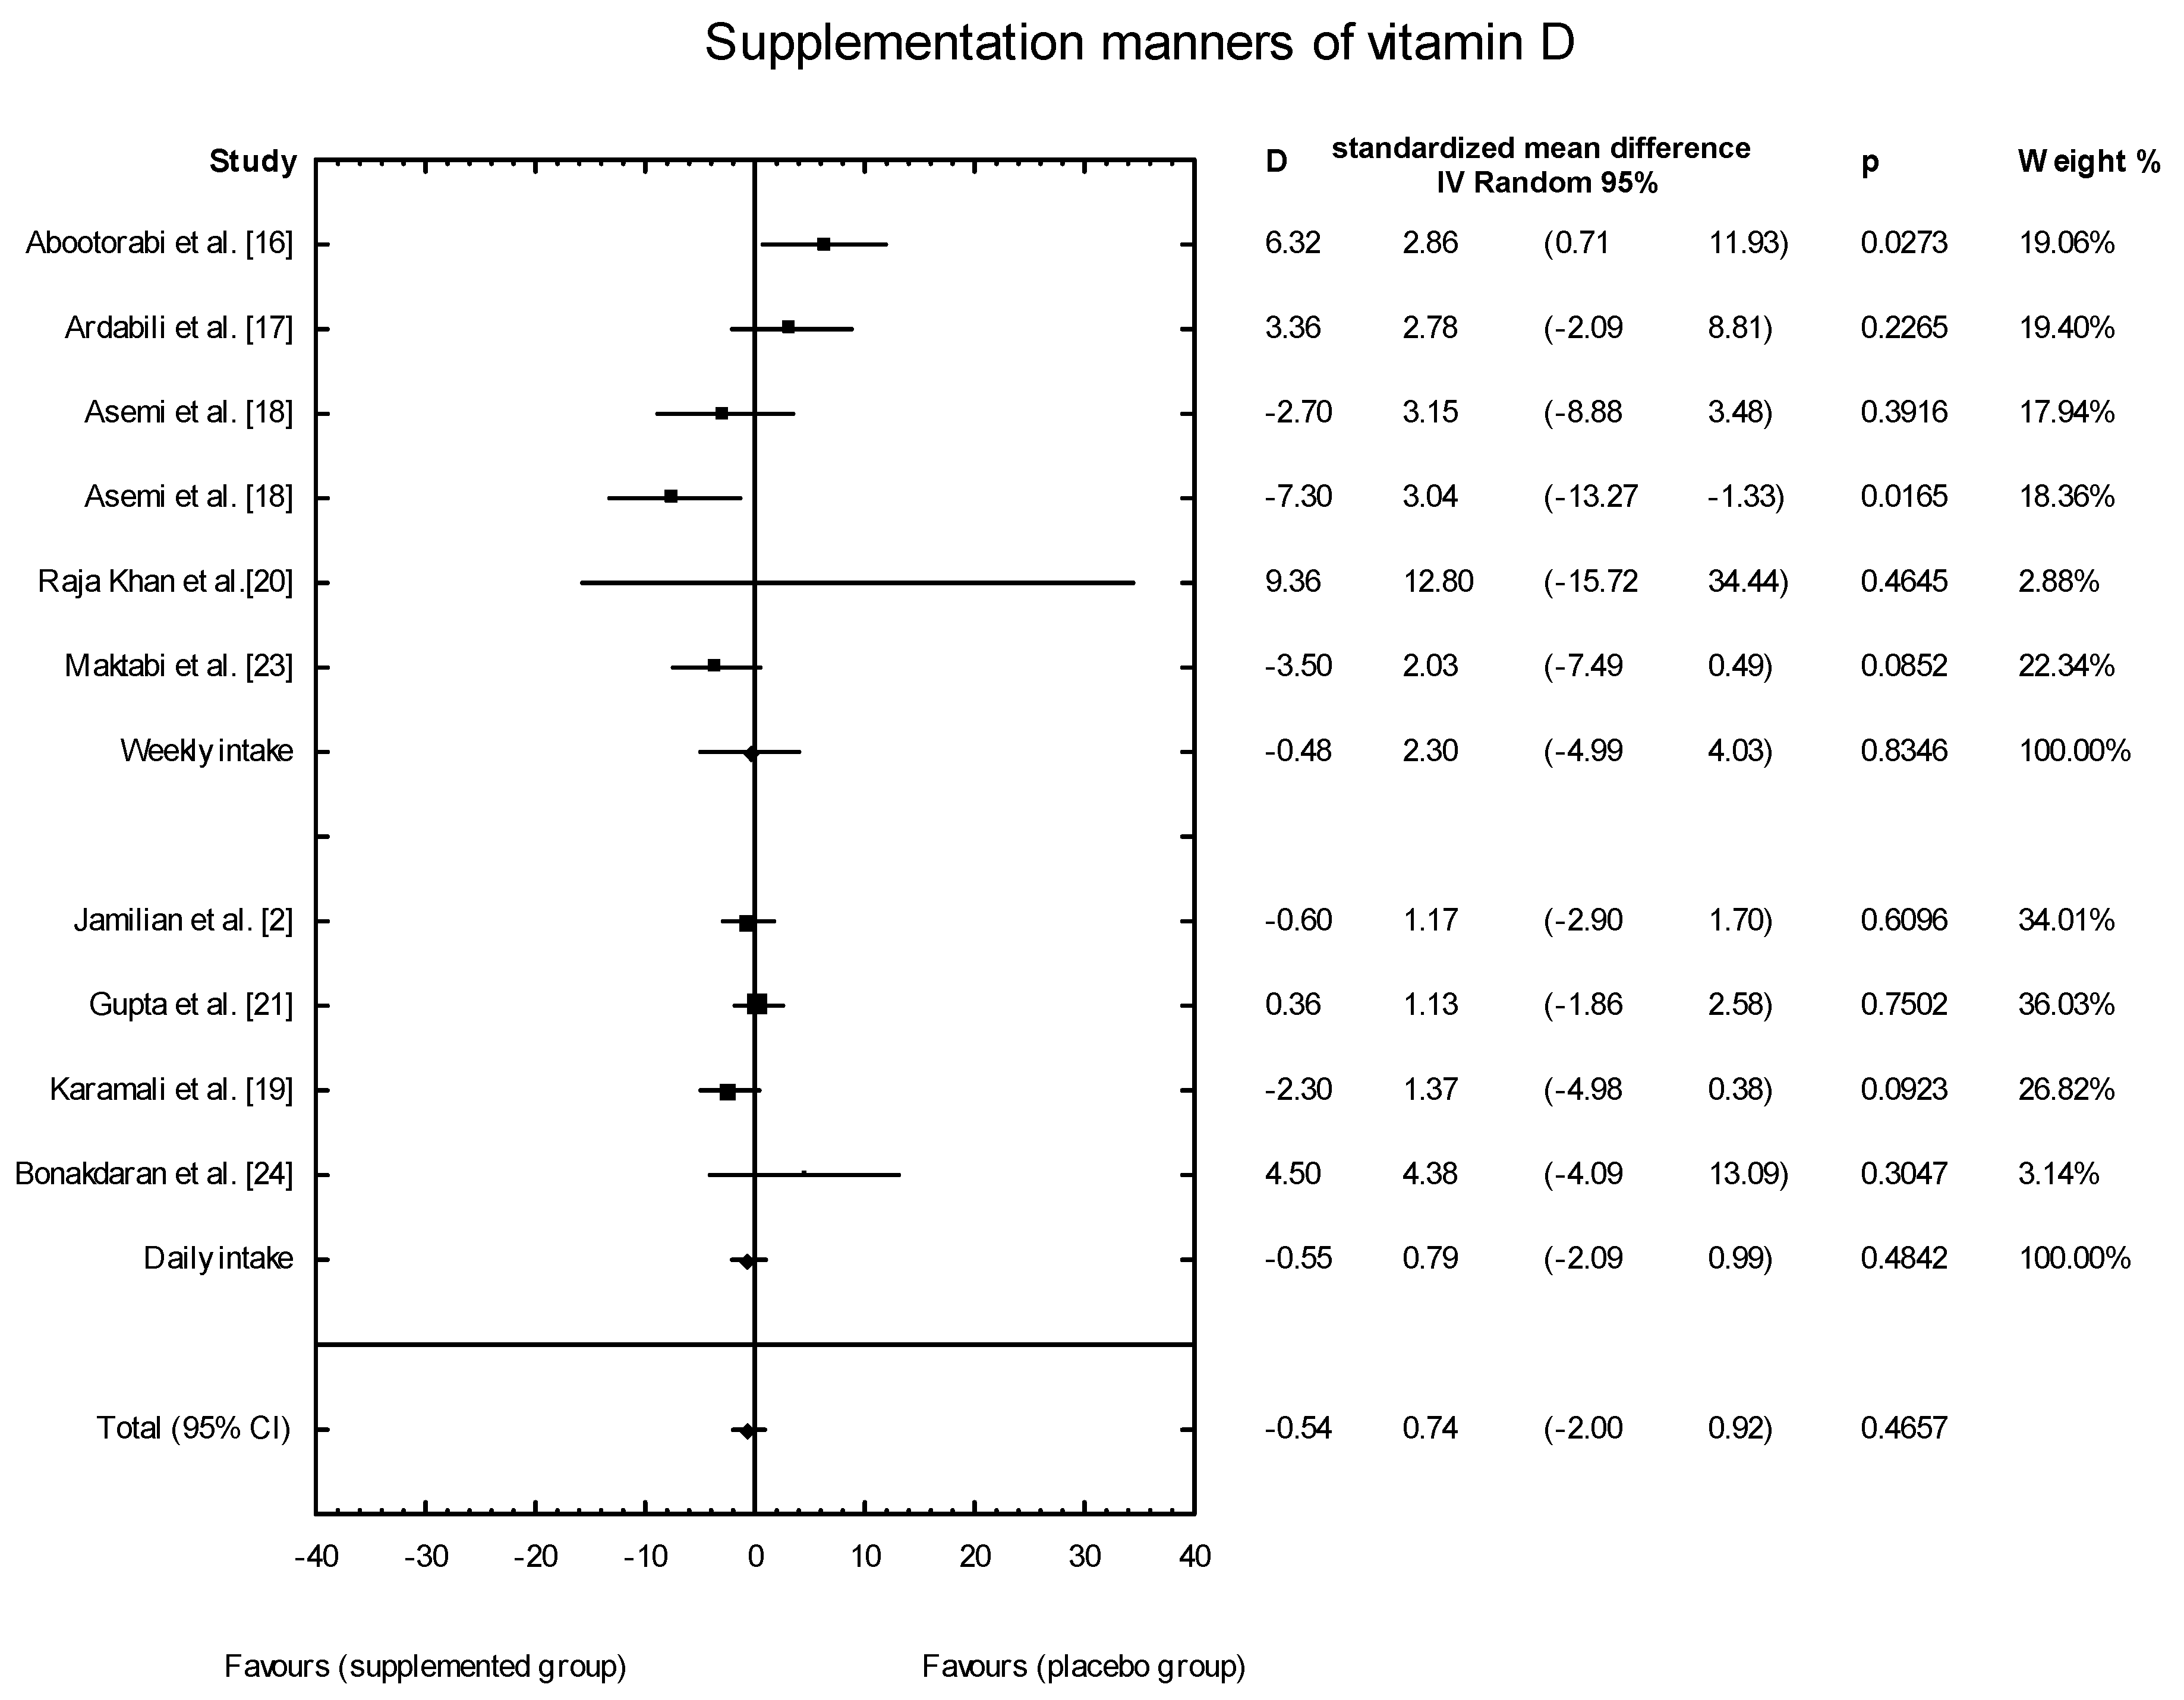
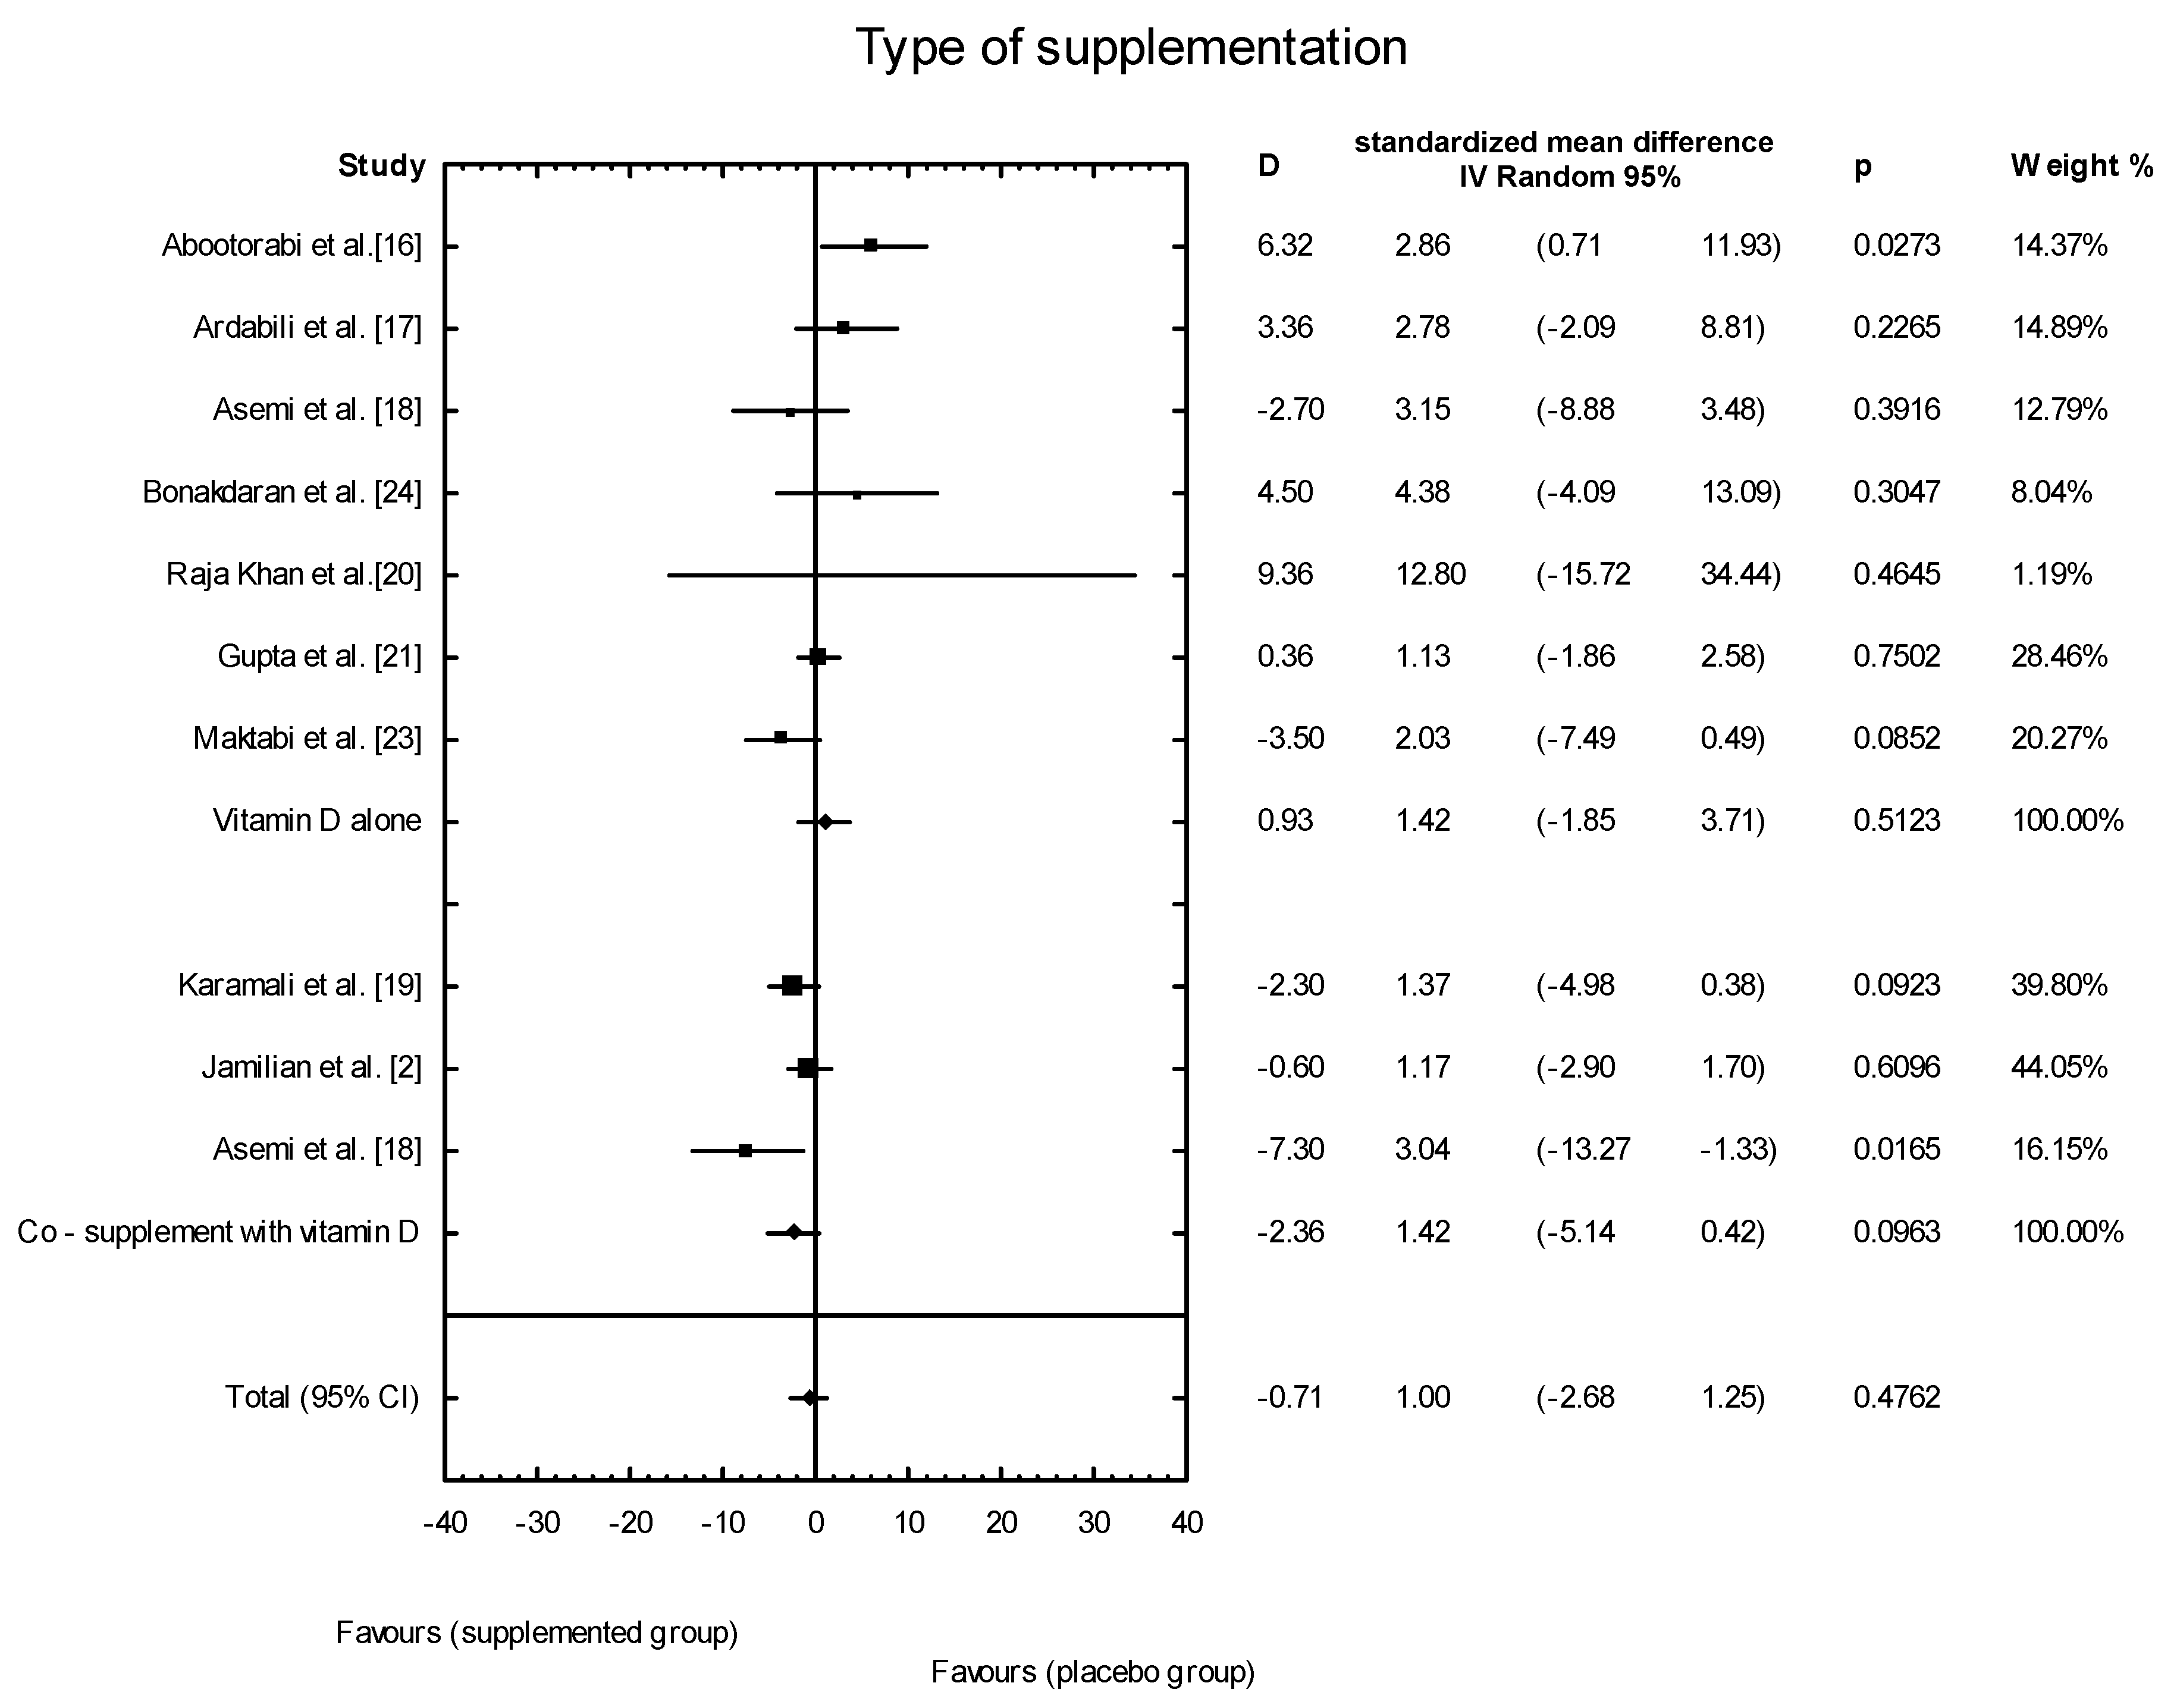
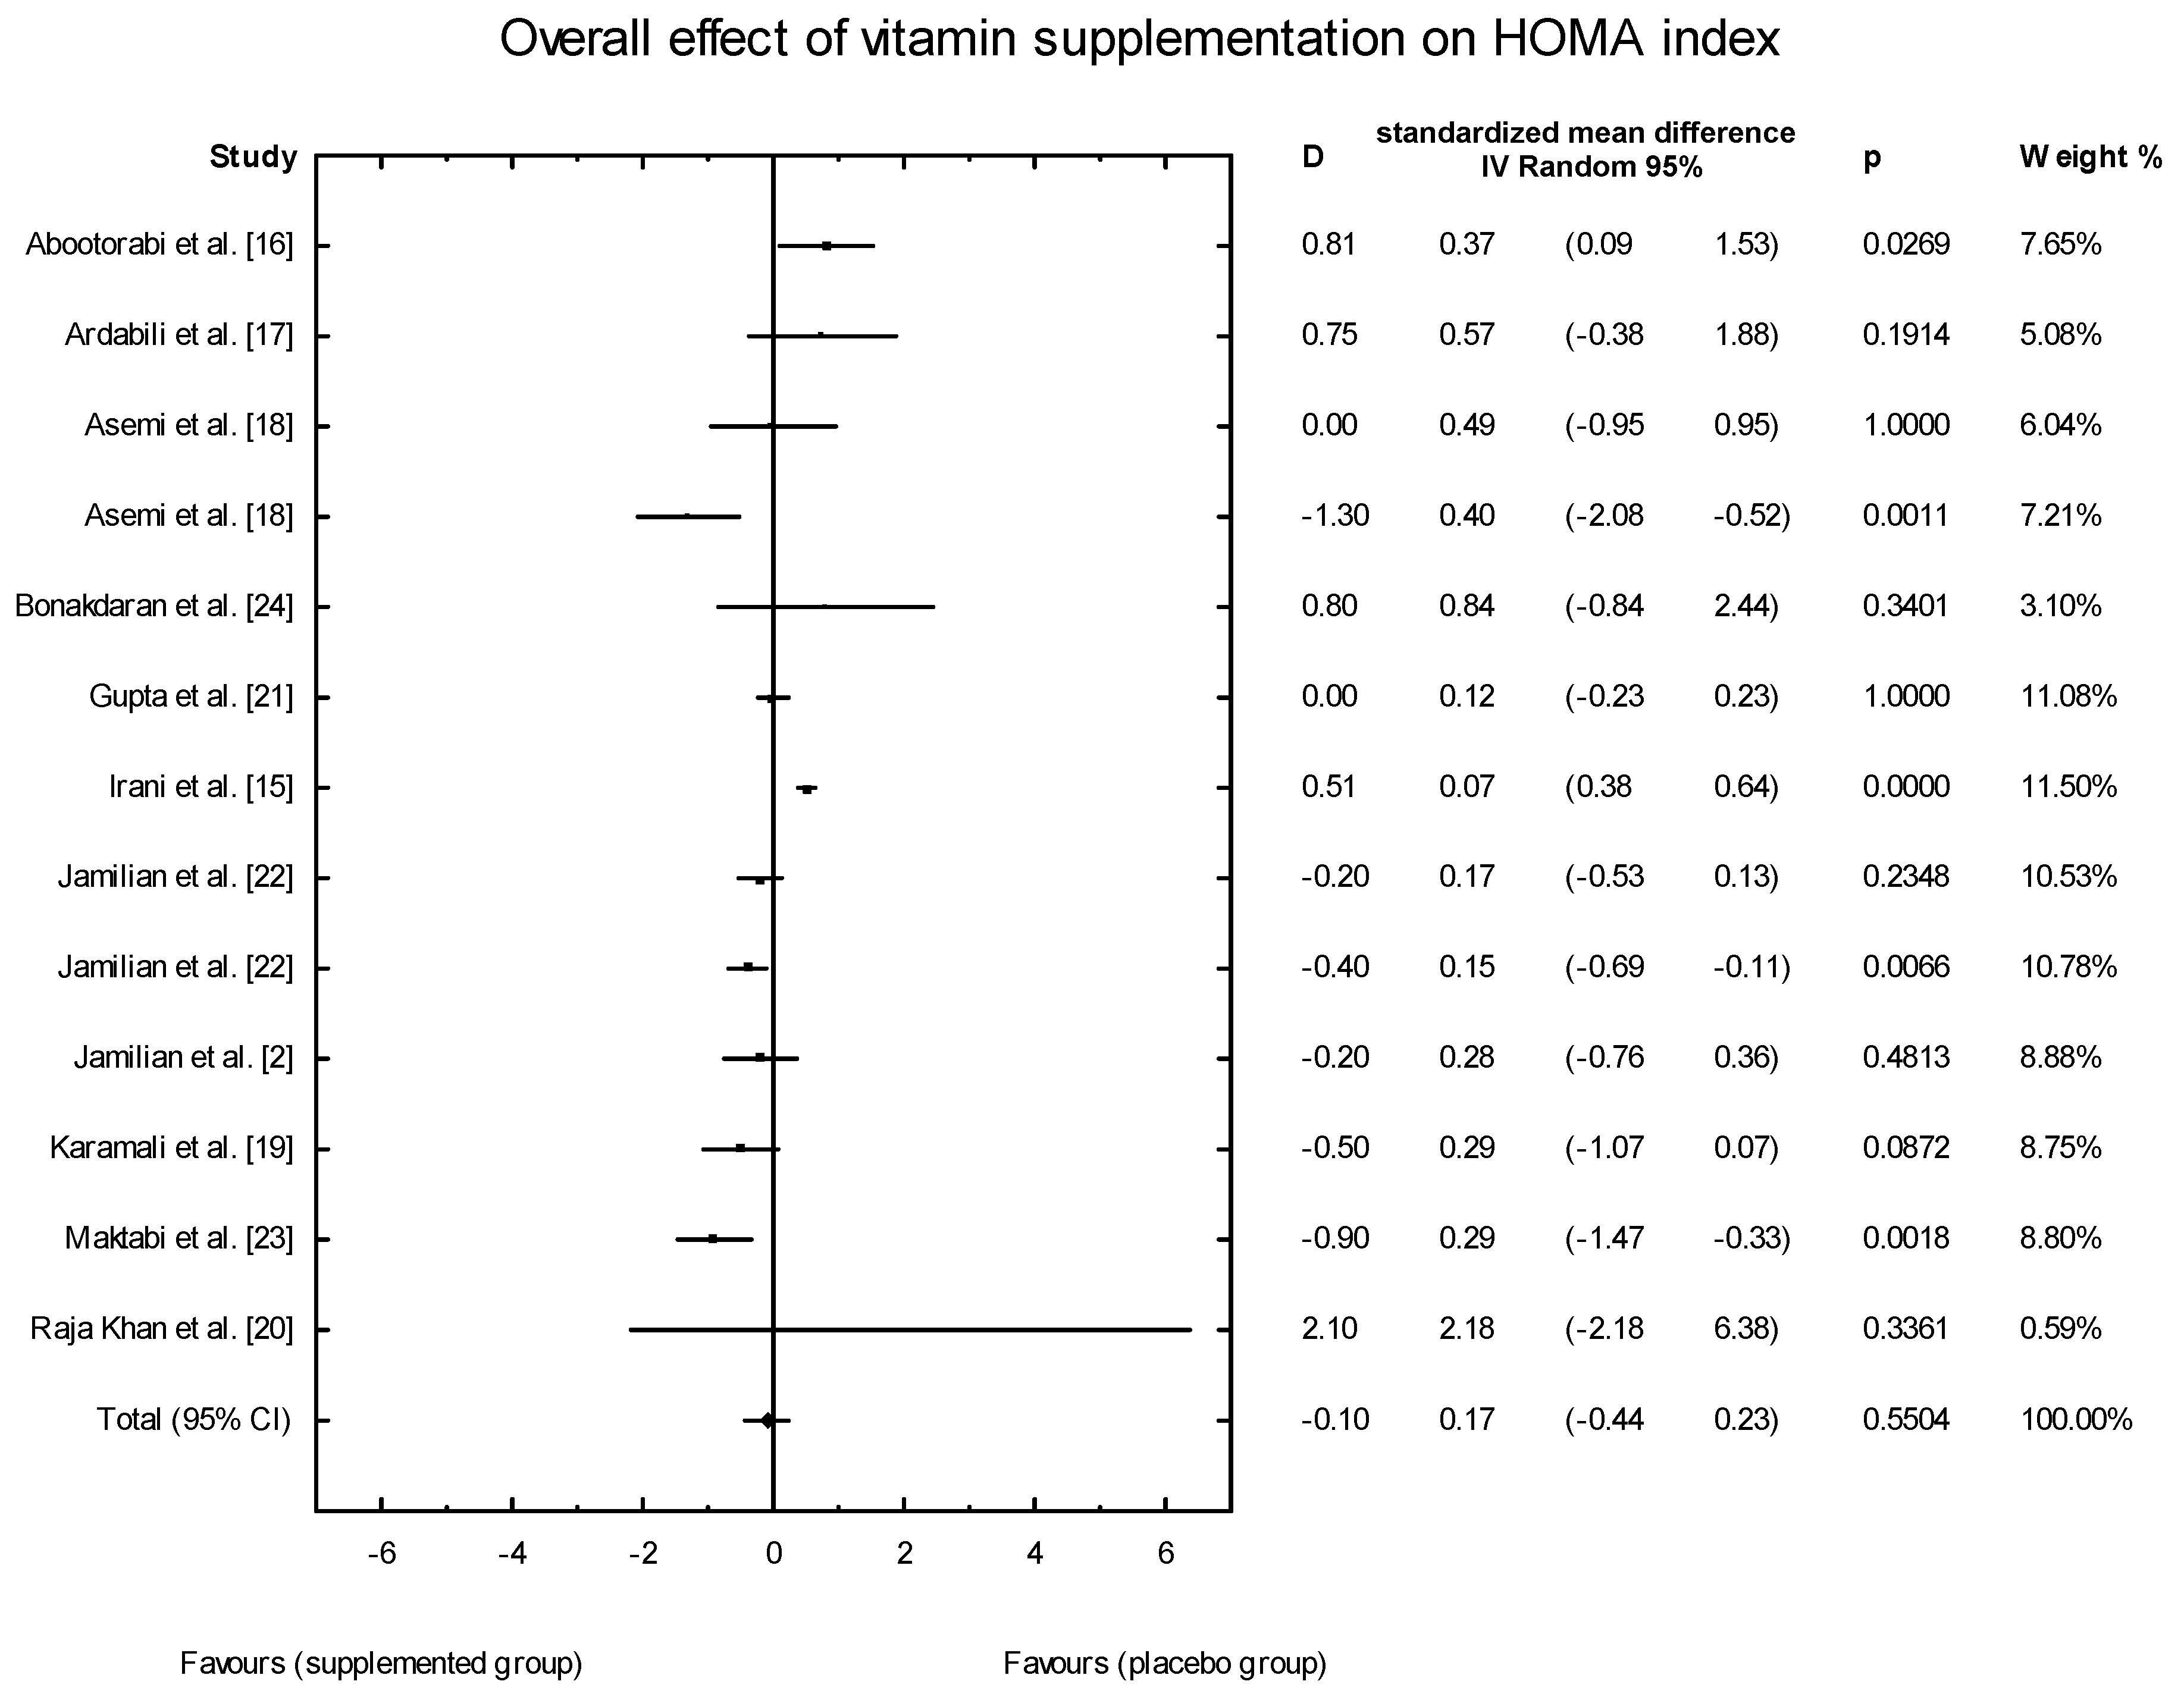
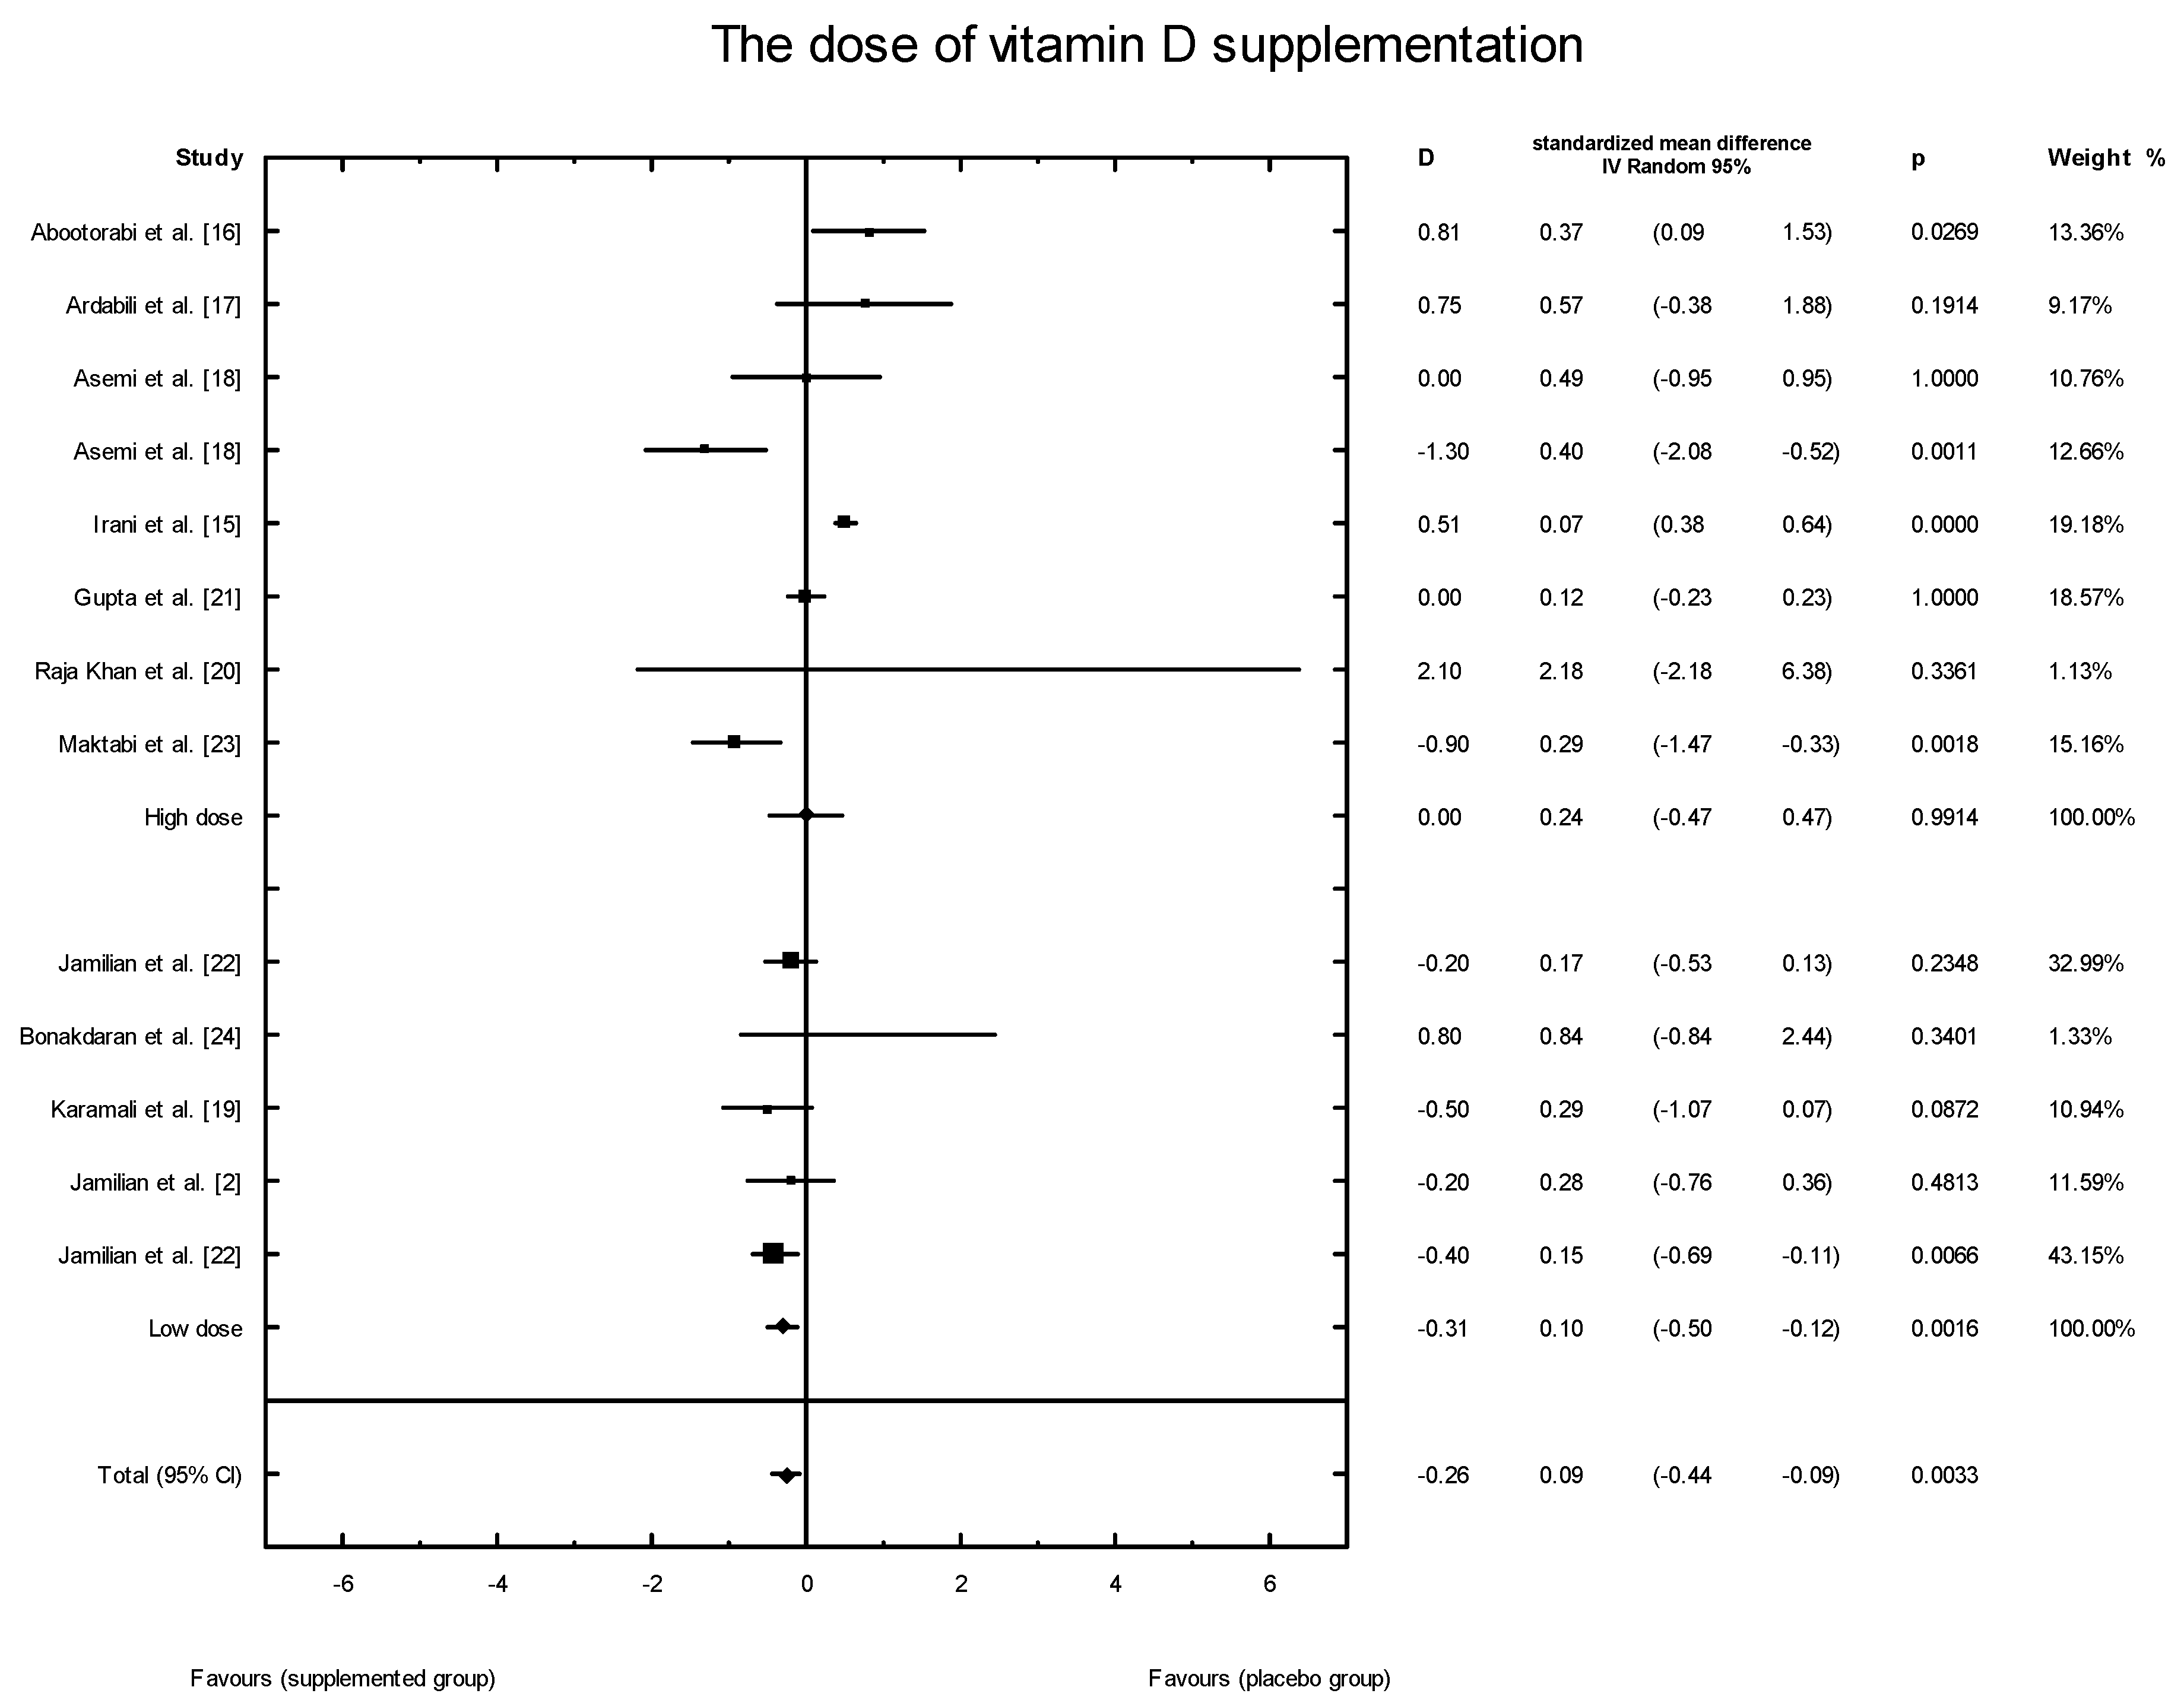
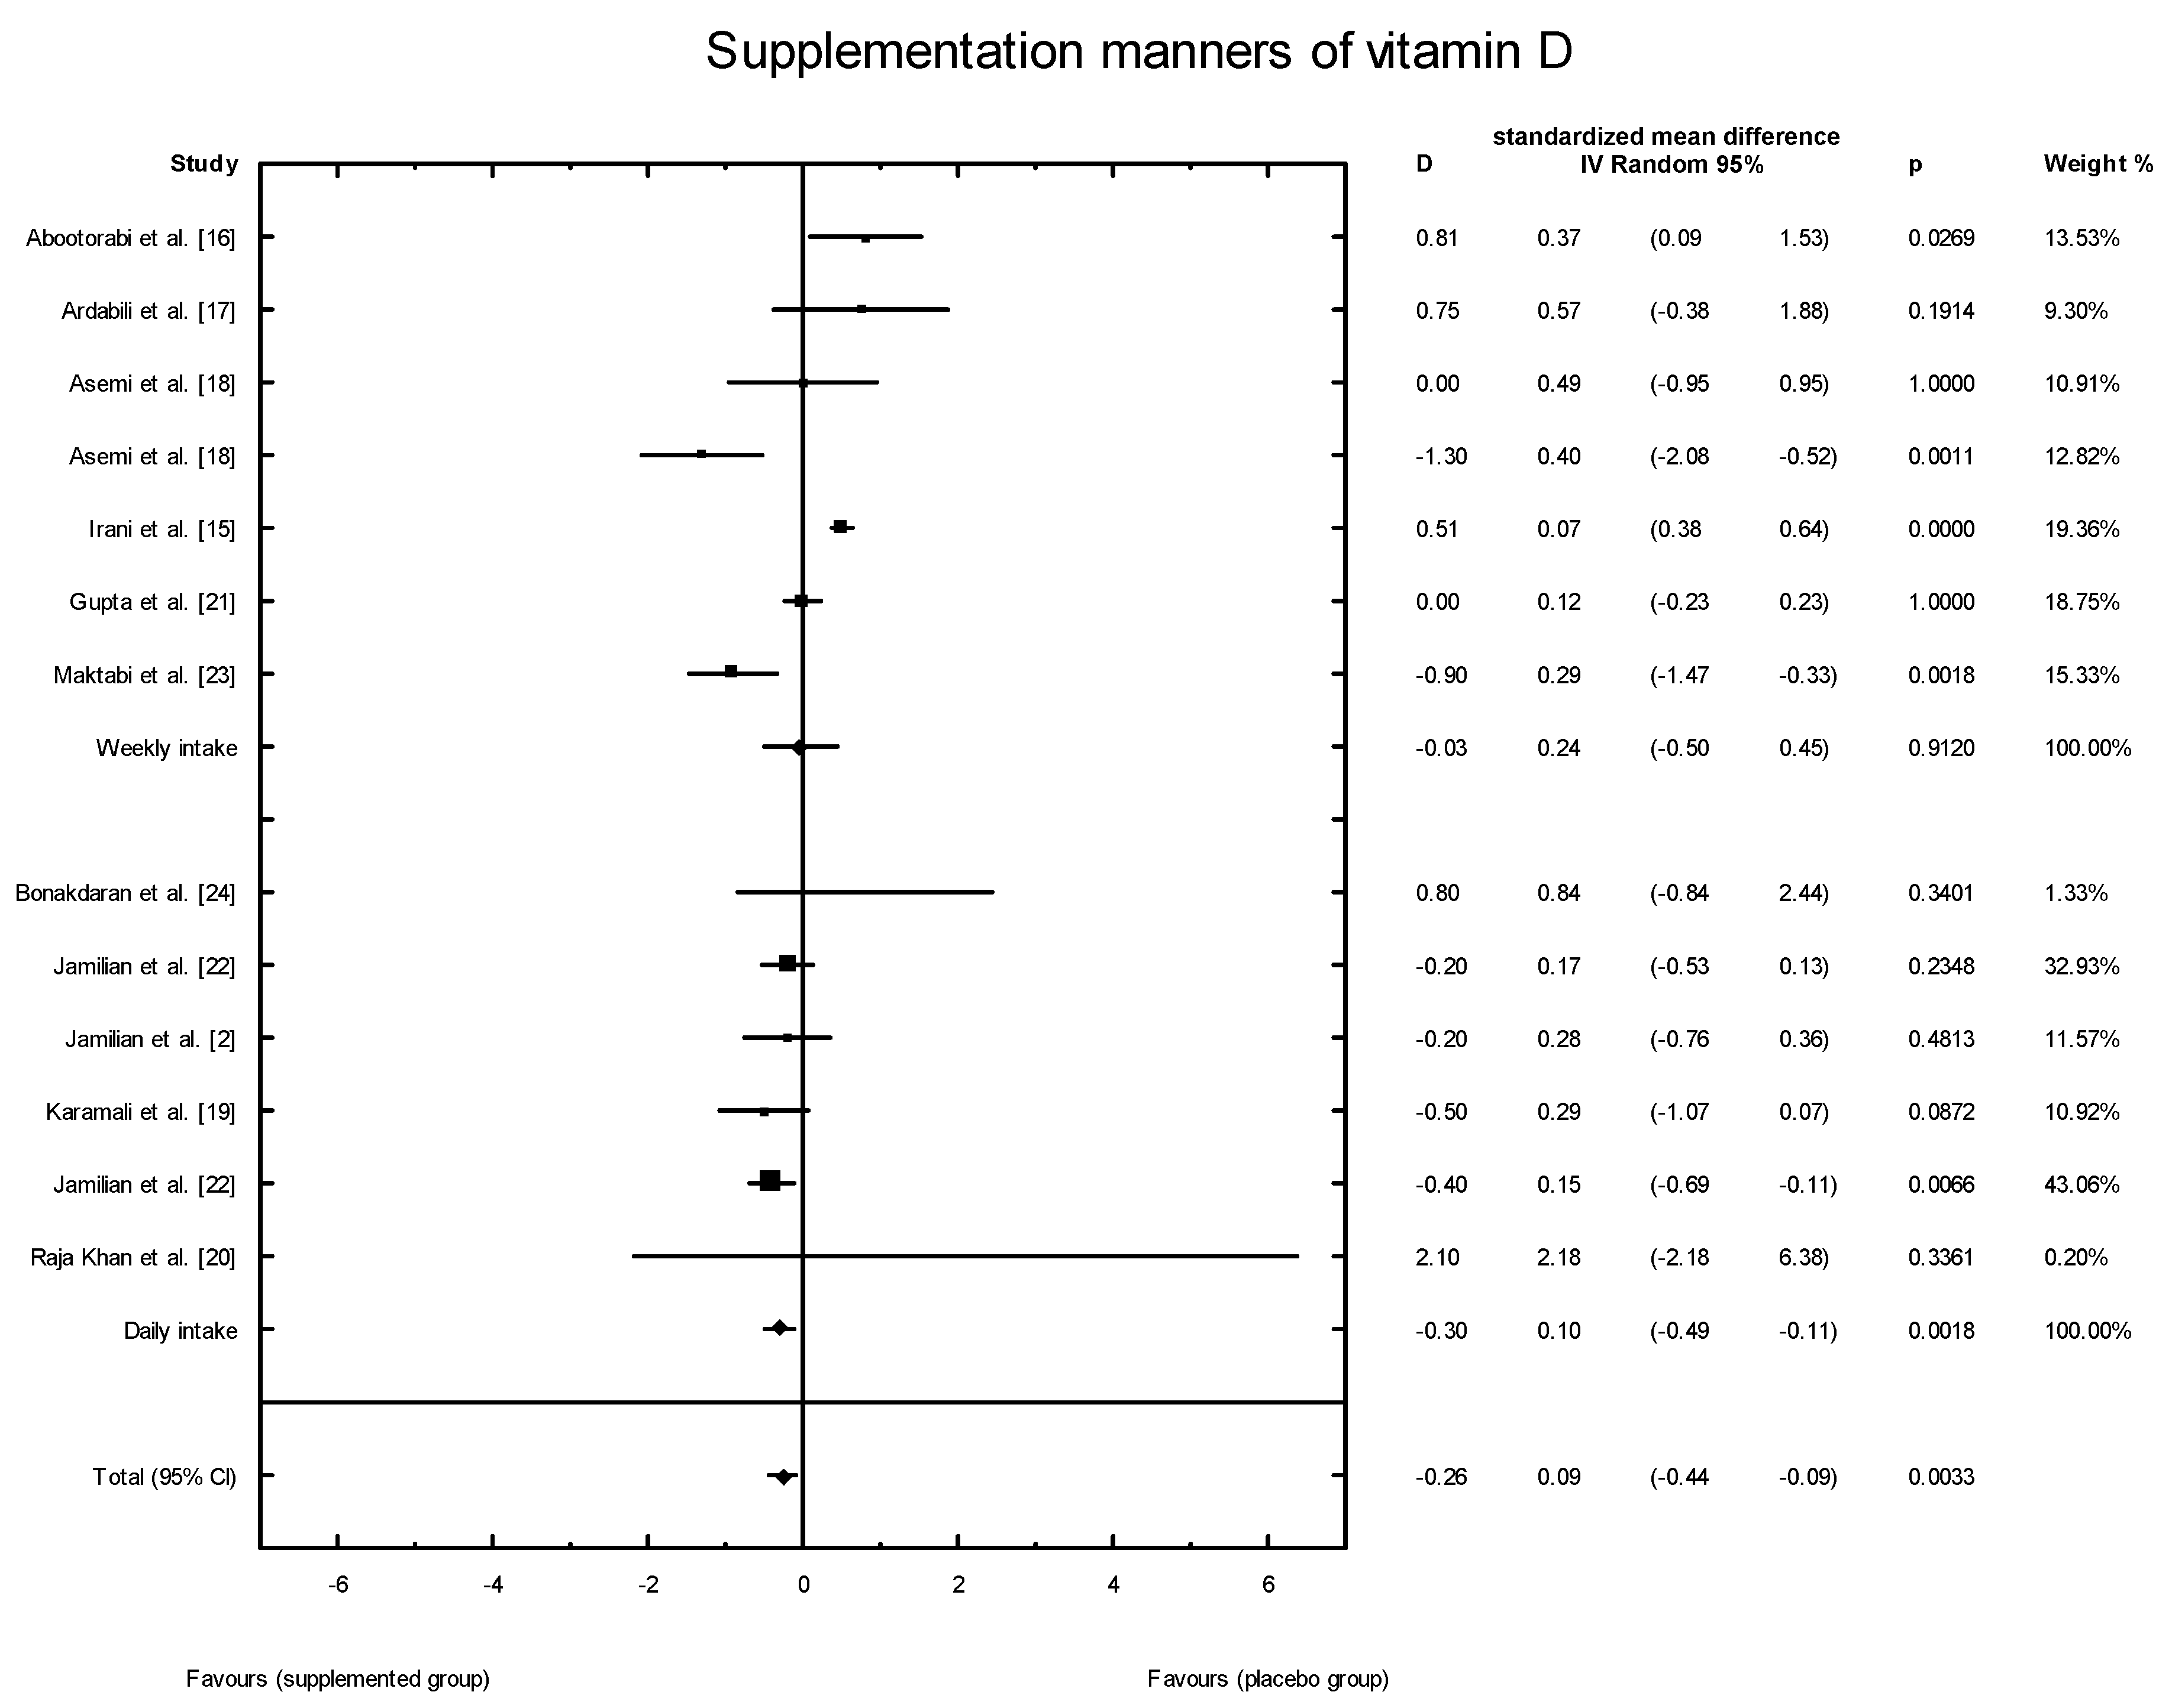
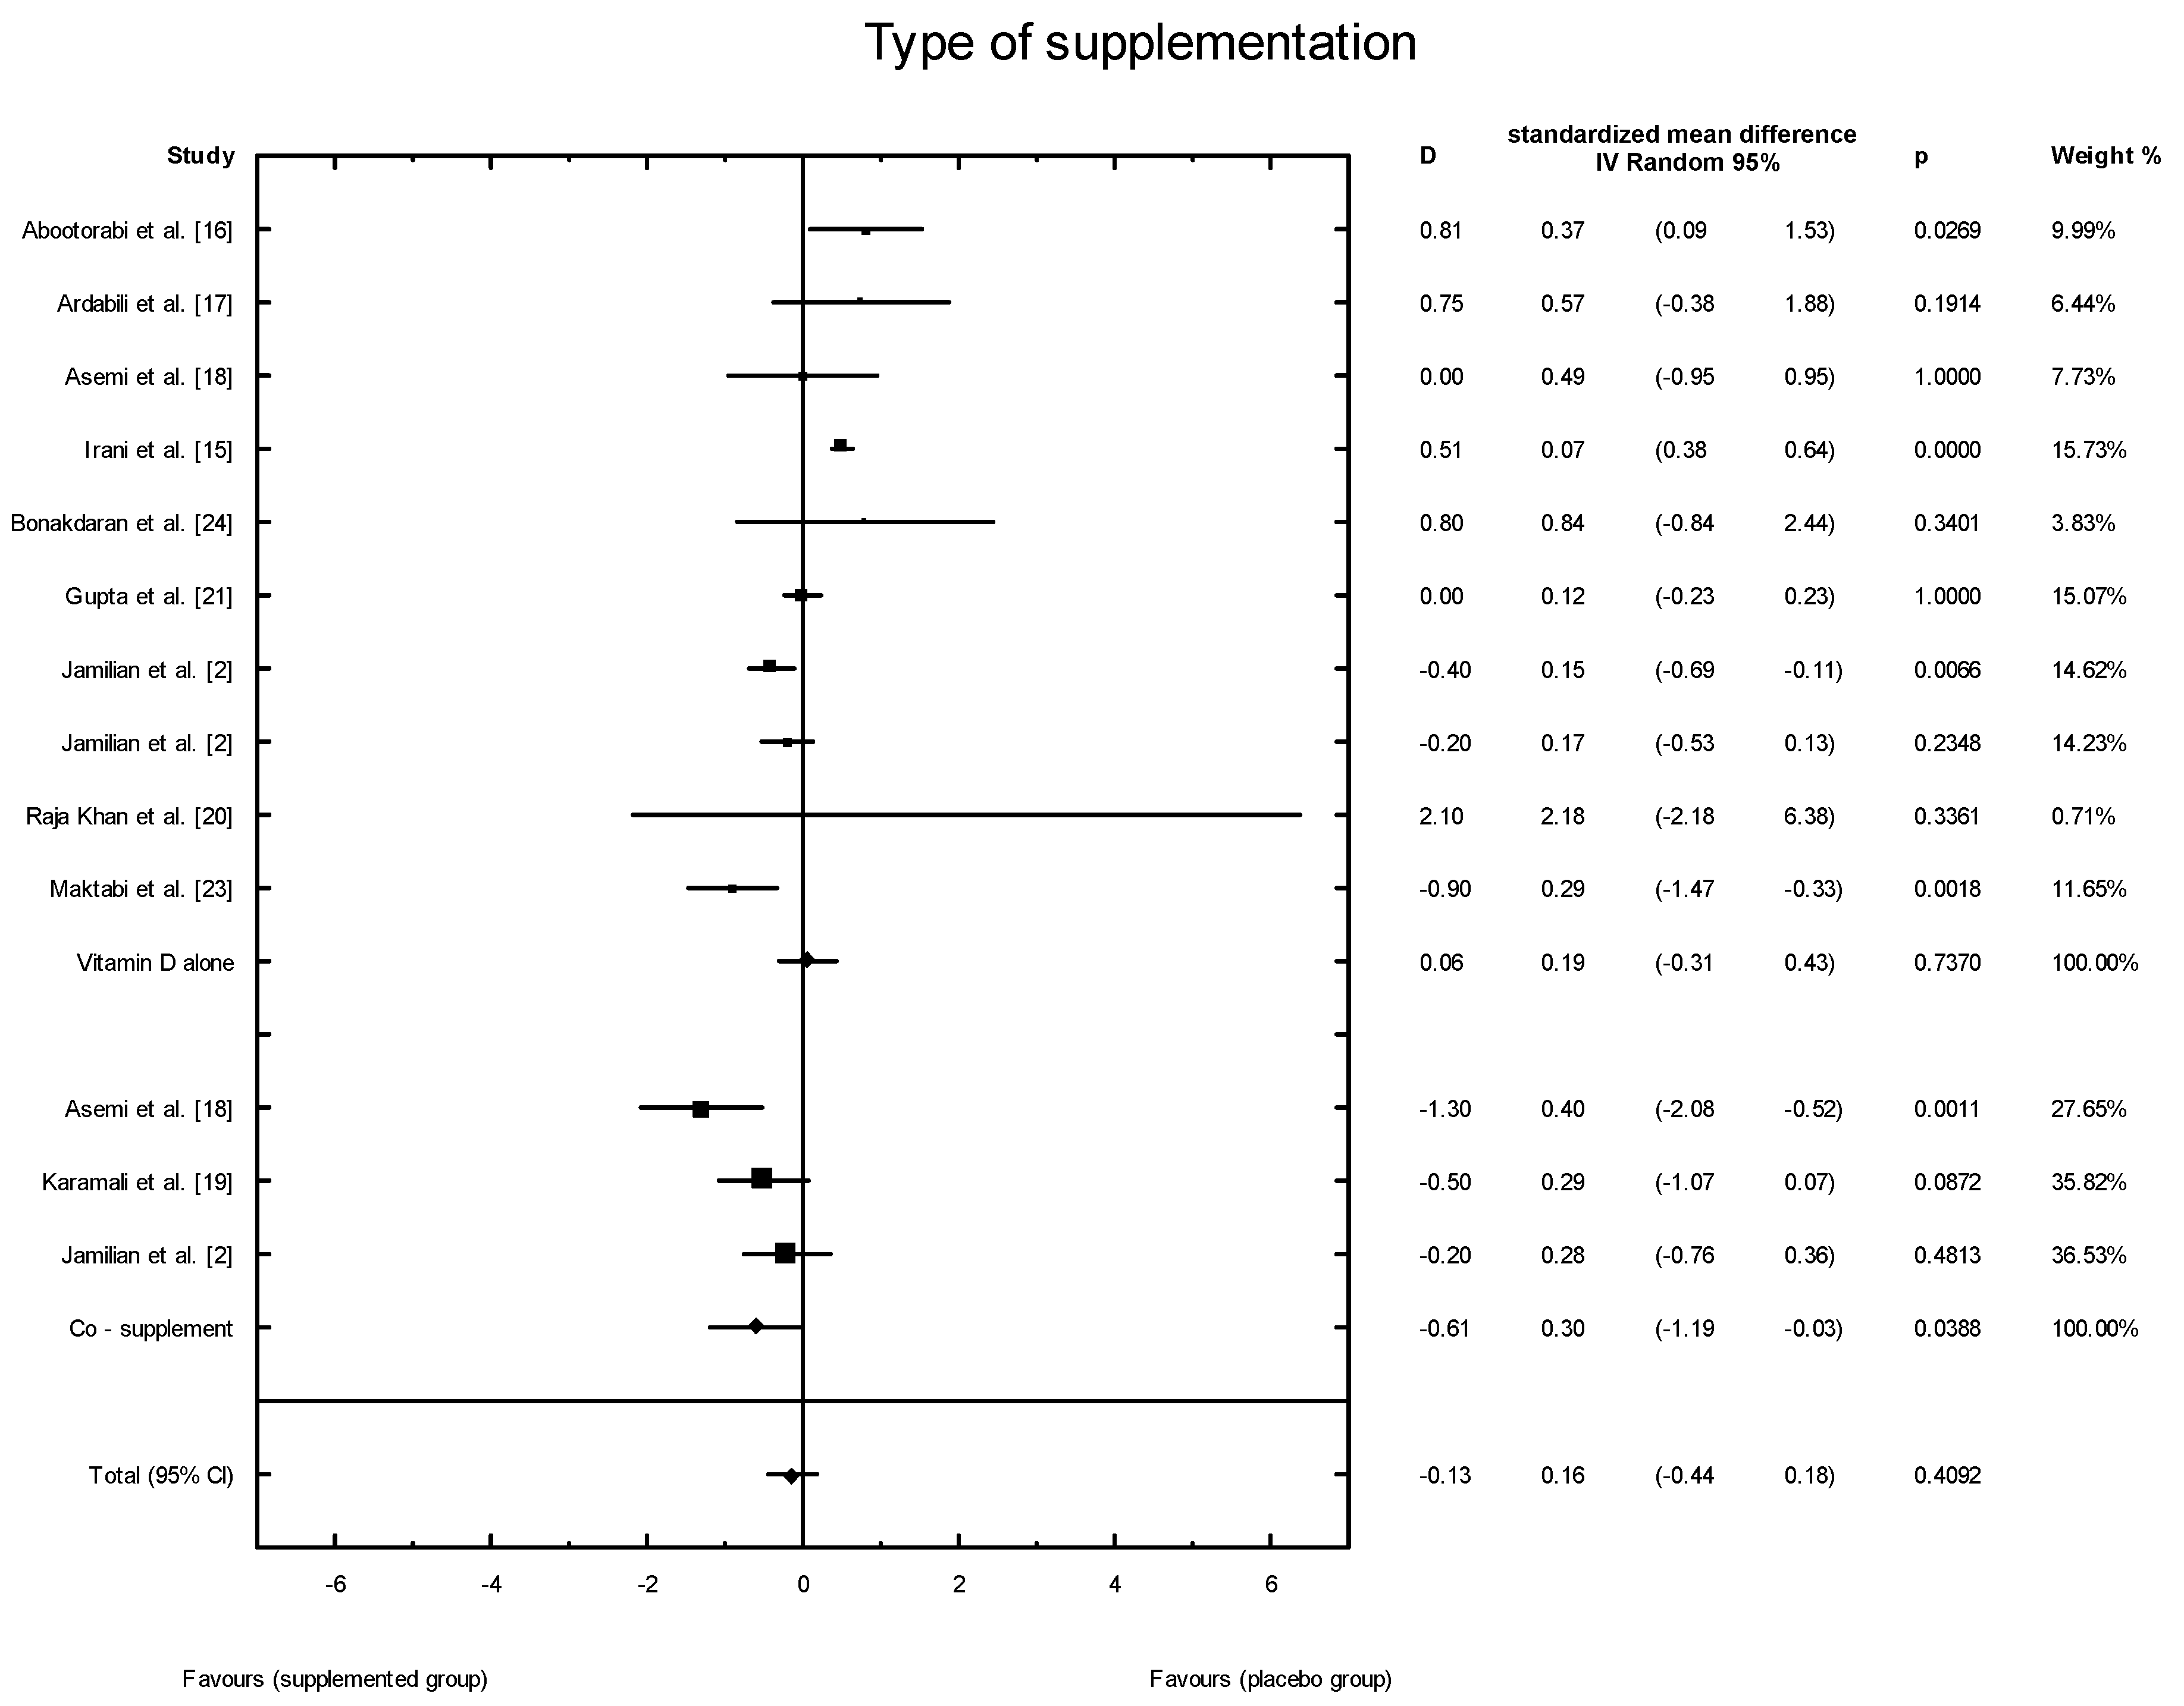
3.4. Effects of Vitamin D Supplementation on Changes in Parameters Related to Insulin Resistance
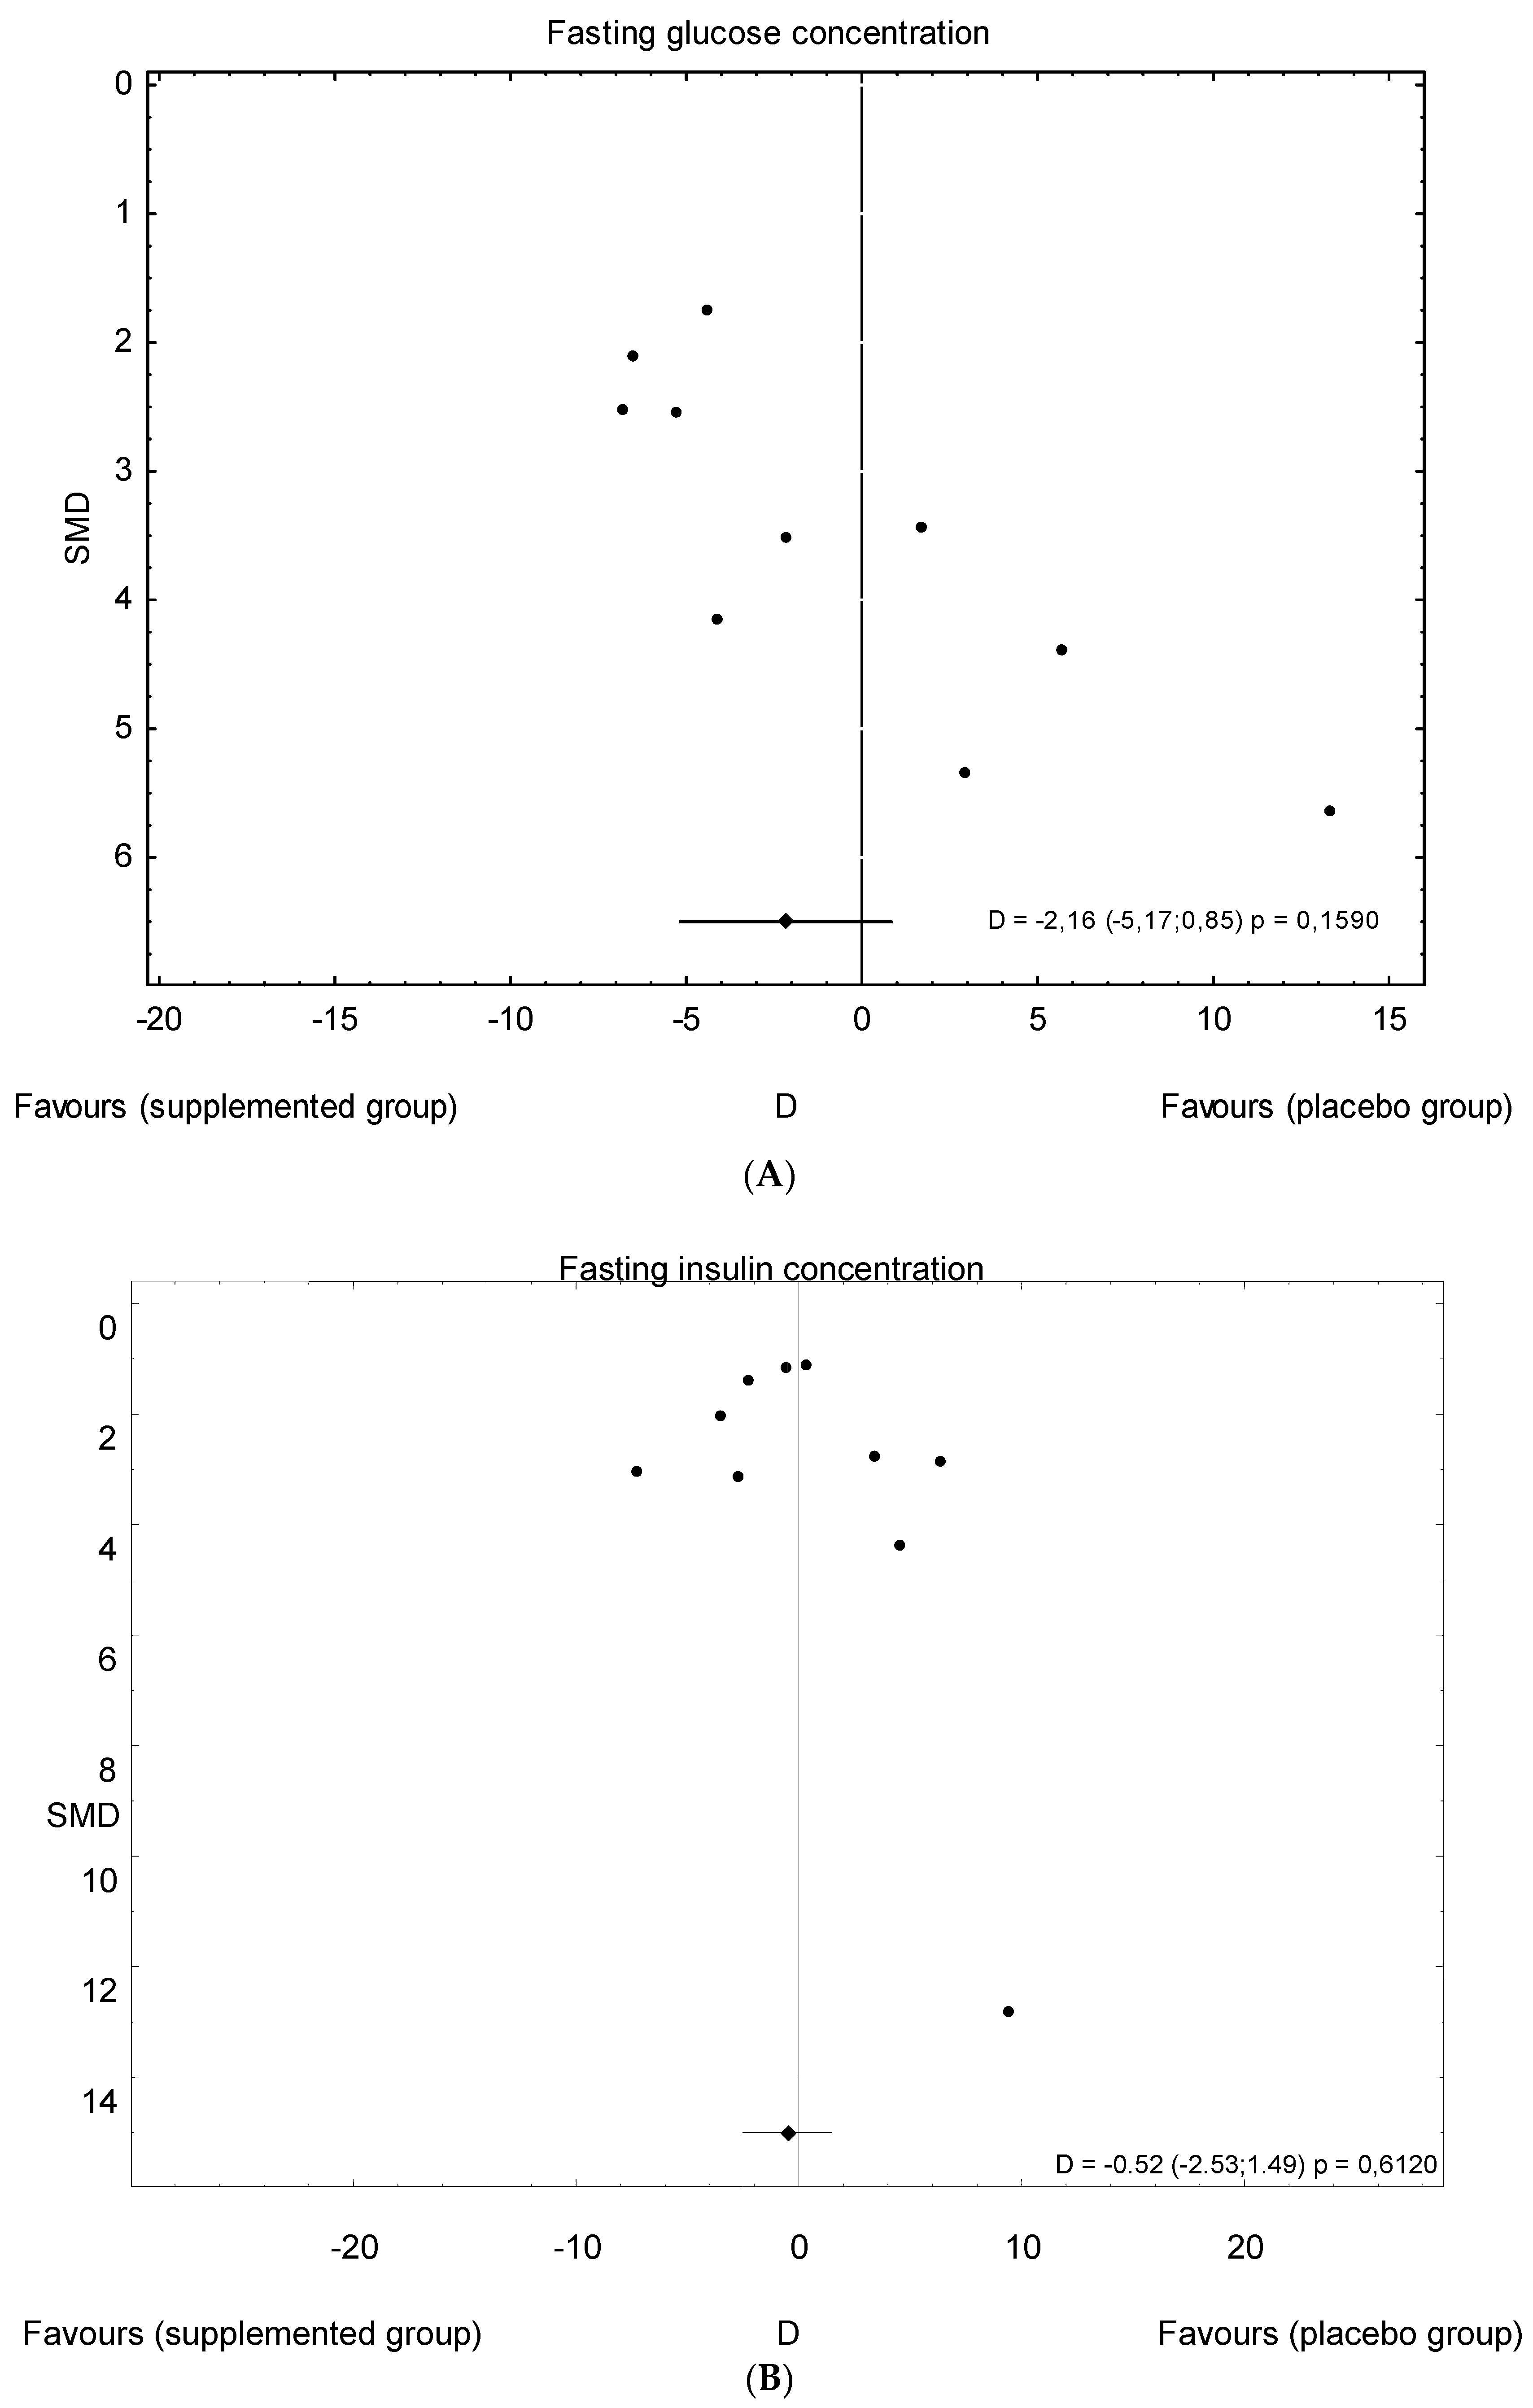
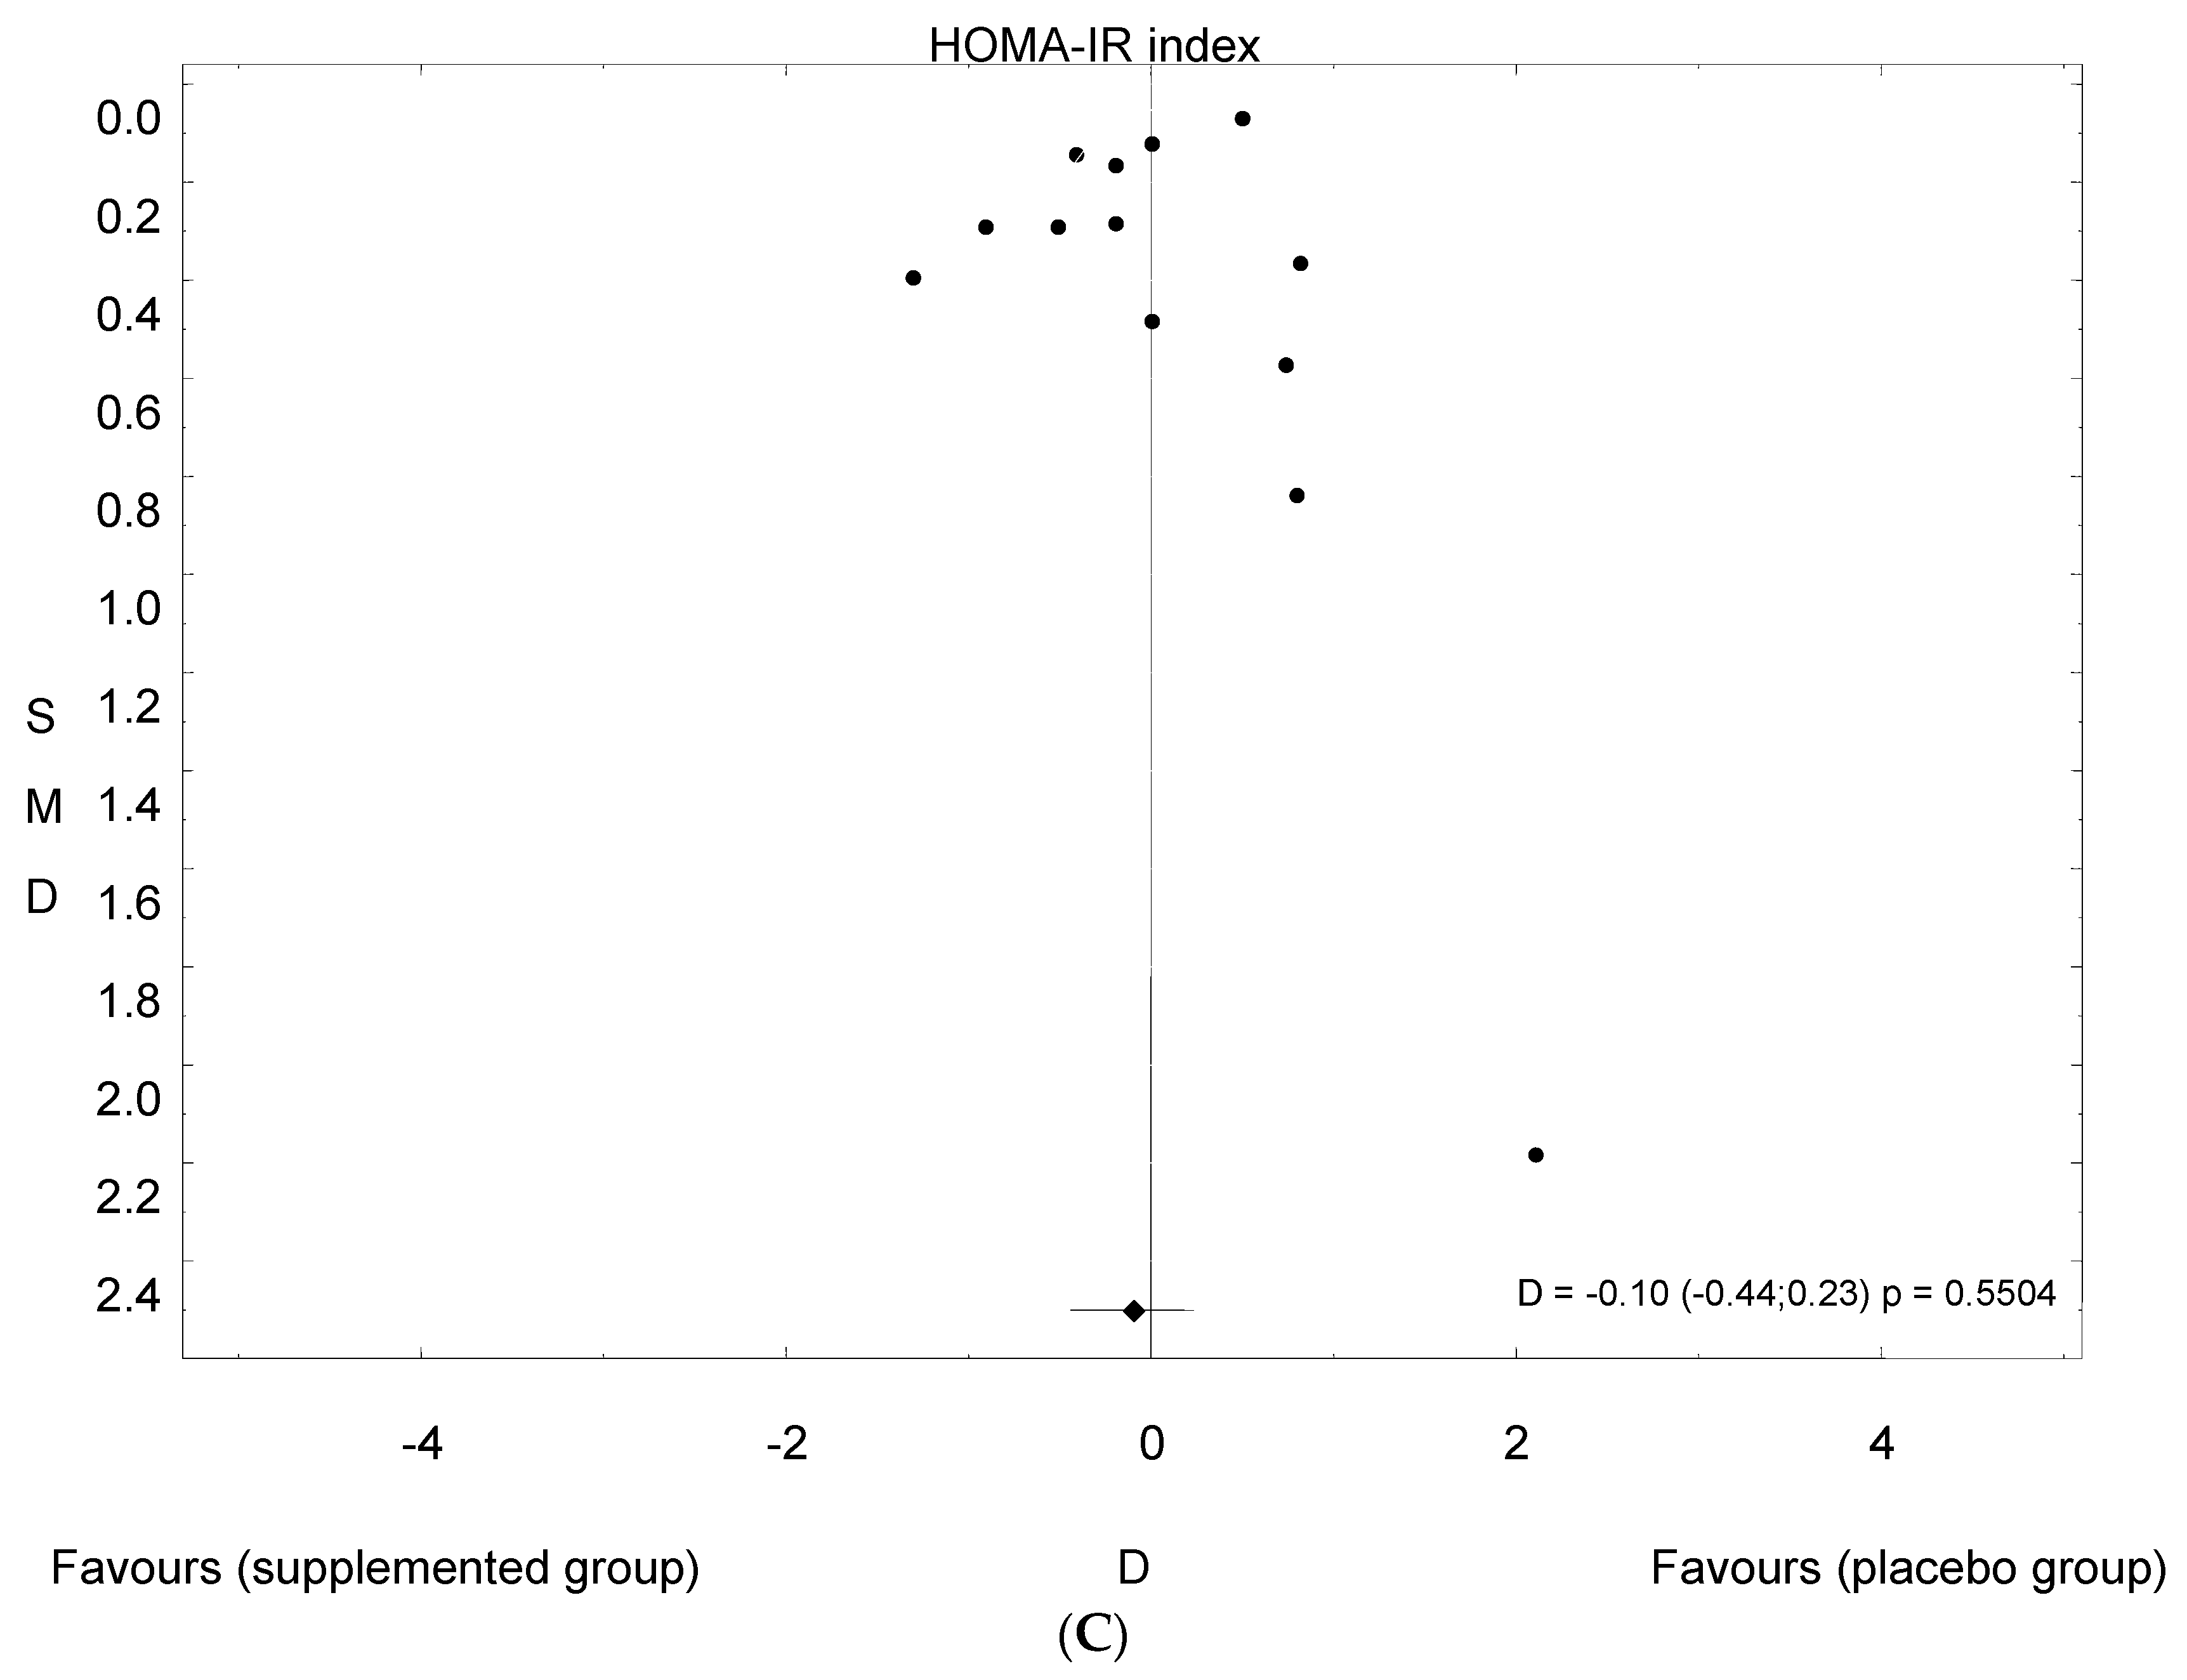
3.5. Publication Bias
4. Discussion
5. Conclusions
Author Contributions
Funding
Conflicts of Interest
References
- Pan, M.L.; Chen, L.R.; Tsao, H.M.; Chen, K.H. Relationship between polycystic ovarian syndrome and subsequent gestational diabetes mellitus: A nationwide population based study. PLoS ONE 2015, 21, e0140544. [Google Scholar] [CrossRef] [PubMed]
- Jamilian, M.; Maktabi, M.; Asemi, Z. A trial on the effects of magnesium-zinc-calcium-vitamin d co-supplementation on glycemic control and markers of cardio-metabolic risk in women with polycystic ovary syndrome. Arch. Iran. Med. 2017, 20, 640–645. [Google Scholar] [PubMed]
- Song, D.K.; Hong, Y.S.; Sung, Y.A.; Lee, H. Insulin resistanceaccording to β-cellfunction in women with polycystic ovary syndrome and normalglucosetolerance. PLoS ONE 2017, 12, e0178120. [Google Scholar] [CrossRef]
- Baptiste, C.G.; Battista, M.C.; Trottier, A.; Baillargeon, J.P. Insulin and hyperandrogenism in women with polycystic ovary syndrome. J. Steroid Biochem. Mol. Biol. 2010, 122, 42–52. [Google Scholar] [CrossRef] [PubMed]
- Marshall, J.C.; Dunaif, A. Should all women with PCOS be treated for insulin resistance? Fertil. Steril. 2012, 97, 18–22. [Google Scholar] [CrossRef] [PubMed]
- Diamanti-Kandarakis, E.; Dunaif, A. Insulin resistance and the polycystic ovary syndrome revisited: An update on mechanisms and implications. Endocr. Rev. 2012, 33, 981–1030. [Google Scholar] [CrossRef] [PubMed]
- Traub, M.L. Assessing and treating insulin resistance in women with polycystic ovarian syndrome. World J. Diabetes 2011, 2, 33–40. [Google Scholar] [CrossRef] [PubMed]
- Ito-Yamaguchi, A.; Suganuma, R.; Kumagami, A.; Hashimoto, S.; Yoshida-Komiya, H.; Fujimori, K. Effects of metformin on endocrine, metabolic milieus and endometrial expression of androgen receptor in patients with polycystic ovary syndrome. Gynecol. Endocrinol. 2015, 31, 44–47. [Google Scholar] [CrossRef] [PubMed]
- Legro, R.; Barnhart, H.; Schlaff, W.; Carr, B.R.; Diamond, M.P.; Carson, S.A.; Steinkampf, M.P.; Coutifaris, C.; McGovern, P.G.; Cataldo, N.A.; et al. Clomiphene, metformin, or both for infertility in the polycystic ovary syndrome. N. Engl. J. Med. 2007, 6, 551–556. [Google Scholar] [CrossRef] [PubMed]
- Kung, J.; Henry, R.R. Thiazolidinedione safety. Expert Opin. Drug Saf. 2012, 11, 565–579. [Google Scholar] [CrossRef] [PubMed]
- Wamberg, L.; Kampmann, U.; Stødkilde-Jørgensen, H.; Rejnmark, L.; Pedersen, S.B.; Richelsen, B. Effects of vitamin D supplementation on body fat accumulation, inflammation, and metabolic risk factors in obese adults with low vitamin D levels: Results from a randomized trial. Eur. J. Intern. Med. 2013, 24, 644–649. [Google Scholar] [CrossRef] [PubMed]
- Mason, C.; Xiao, L.; Imayama, I.; Duggan, C.; Wang, C.Y.; Korde, L.; McTiernan, A. Vitamin D3 supplementation during weight loss: A double-blind randomized controlled trial. Am. J. Clin. Nutr. 2014, 99, 1015–1025. [Google Scholar] [CrossRef] [PubMed]
- Nagpal, J.; Pande, J.N; Bhartia, A. A double-blind, randomized, placebo-controlled trial of the short-term effect of vitaminD3 supplementation on insulin sensitivity in apparently healthy, middle-aged, centrally obese men. Diabet. Med. 2009, 26, 19–27. [Google Scholar] [CrossRef] [PubMed]
- Beilfuss, J.; Berg, V.; Sneve, M.; Jorde, R.; Kamycheva, E. Effects of a 1-year supplementation with cholecalciferol on interleukin-6, tumor necrosis factor-alpha and insulin resistance in overweight and obese subjects. Cytokine 2012, 60, 870–874. [Google Scholar] [CrossRef] [PubMed]
- Irani, M.; Seifer, D.B.; Grazi, R.V.; Julka, N.; Bhatt, D.; Kalgi, B.; Irani, S.; Tal, O.; Lambert-Messerlian, G.; Tal, R. Vitamin D supplementation decreases TGF-β1 bioavailability in PCOS: A randomized placebo-controlled trial. J. Clin. Endocrinol. Metab. 2015, 11, 11–4307. [Google Scholar] [CrossRef] [PubMed]
- Abootorabi, M.; Ayremlou, P.; Behroozi-Lak, T.; Nourisaeidlou, S. The effect of vitamin D supplementation on insulin resistance, visceral fat and adiponectin in vitamin D deficient women with polycystic ovary syndrome: A randomized controlled trial. Gynecol. Endocrinol. 2018, 34, 489–494. [Google Scholar] [CrossRef] [PubMed]
- Ardabili, H.R.; Gargari, B.P.; Farzadi, L. Vitamin D supplementation has no effect on insulin resistance assessment in women with polycystic ovary syndrome and vitamin D deficiency. Nutr. Res. 2012, 32, 195–201. [Google Scholar] [CrossRef] [PubMed]
- Asemi, Z.; Foroozanfard, F.; Hashemi, T.; Bahmani, F.; Jamilian, M.; Esmaillzadeh, A. Calcium plus vitamin D supplementation affects glucose metabolism and lipid concentrations in overweight and obese vitamin D deficient women with polycystic ovary syndrome. Clin. Nutr. 2015, 34, 586–592. [Google Scholar] [CrossRef] [PubMed]
- Karamali, M.; Ashrafi, M.; Razavi, M.; Jamilian, M.; Kashanian, M.; Akbari, M.; Asemi, Z. The effects of calcium, vitamins D and K co-supplementation on markers of insulin metabolism and lipid profiles in vitamin D-deficient women with polycystic ovary syndrome. Exp. Clin. Endocrinol. Diabetes 2017, 125, 316–321. [Google Scholar] [CrossRef] [PubMed]
- Raja-Khan, N.; Shah, J.; Stetter, C.M.; Lott, M.E.; Kunselman, A.R.; Dodson, W.C.; Legro, R.S. High-dosevitamin Dsupplementation and measures of insulin sensitivity in polycystic ovary syndrome: A randomized, controlledpilottrial. Fertil. Steril. 2014, 101, 1740–1746. [Google Scholar] [CrossRef] [PubMed]
- Gupta, T.; Rawat, M.; Gupta, N.; Arora, S. Study of effect of vitaminDsupplementation onthe clinical, hormonal and metabolicprofile of the PCOSWomen. J. Obstet.Gynaecol. India 2017, 67, 349–335. [Google Scholar] [CrossRef] [PubMed]
- Jamilian, M.; Foroozanfard, F.; Rahmani, E.; Talebi, M.; Bahmani, F.; Asemi, Z. Effect of two different doses of vitamin D supplementation on metabolic profiles of insulin-resistant patients with polycystic ovary syndrome. Nutrients 2017, 24, 1280. [Google Scholar] [CrossRef] [PubMed]
- Maktabi, M.; Chamani, M.; Asemi, Z. The effects of vitamin D supplementation on metabolic status of patients with polycystic ovary syndrome: A randomized, double-blind, placebo-controlled trial. Horm. Metab. Res. 2017, 49, 493–498. [Google Scholar] [CrossRef] [PubMed]
- Bonakdaran, S.; MazloomKhorasani, Z.; Davachi, B.; MazloomKhorasani, J. The effects of calcitriol on improvement of insulinresistanc, ovulation and comparison with metformintherapy in PCOSpatients: A randomizedplacebo-controlledclinicaltrial. Iran. J. Reprod. Med. 2012, 10, 465–472. [Google Scholar] [PubMed]
- Hahn, S.; Haselhorst, U.; Tan, S.; Quadbeck, B.; Schmidt, M.; Roesler, S.; Kimmig, R.; Mann, K.; Janssen, O.E. Low serum 25-hydroxyvitamin D concentrations are associated with insulin resistance and obesity in women with polycystic ovary syndrome. Exp. Clin. Endocrinol. Diabetes 2006, 114, 577–583. [Google Scholar] [CrossRef] [PubMed]
- Hassan, N.E.; El-Orabi, H.A.; Eid, Y.M.; Mohammed, N.R. Effect of 25-hydroxyvitamin D on metabolic parameters and insulin resistance in patients with polycystic ovarian syndrome. Middle East Fertil. Soc. J. 2012, 17, 176–180. [Google Scholar] [CrossRef]
- Łagowska, K.; Bajerska, J. The Role of Vitamin D Supplementation on Insulin Resistance in Women with Polycystic Ovary Syndrome: A Systematic Review. Prospero 2018 CRD 42018090572. Available online: http://www.crd.york.ac.uk/PROSPERO/display_record.php?ID = CRD42018090572 (accessed on 15 March 2018).
- Moher, D.; Liberati, A.; Tetzlaff, J.; Altman, D.G. PRISMA Group. Preferred reporting items for systematic reviews and meta-analyses: The PRISMA statement. Ann. Intern. Med. 2009, 151, 264–269. [Google Scholar] [CrossRef] [PubMed]
- Geisthovel, F.; Rabe, T. The ESHRE/ASRMconsensus on polycysticovarysyndrome (PCOS)-an extended critical analysis. Reprod. Biomed. Online 2007, 14, 522–535. [Google Scholar] [CrossRef]
- Wells, G.A.; Shea, B.; O’Connell, D.; Peterson, J.; Welch, V.; Losos, M.; Tugwell, P. The Newcastle-Ottawa Scale (NOS) for assessing the quality of non randomised studies in meta-analyses. Eur. J. Epidemiol. 2011, 25, 603–605. [Google Scholar]
- Holick, M.F.; Binkley, N.C.; Bischoff-Ferrari, H.A.; Gordon, C.M.; Hanley, D.A.; Heaney, R.P.; Murad, M.H.; Weaver, C.M. EndocrineSociety.Evaluation,treatment, and prevention of vitamin D deficiency: An EndocrineSociety clinical practice guideline. J. Clin. Endocrinol. Metab. 2011, 96, 1911–1930. [Google Scholar] [CrossRef] [PubMed]
- Sempos, C.T.; Heijboer, A.C.; Bikle, D.D.; Bollerslev, J.; Bouillon, R.; Brannon, P.M.; DeLuca, H.F.; Jones, G.; Munns, C.F.; Bilezikian, J.P.; et al. Vitamin D assays and the definition of hypovitaminosis D: Results from the First International Conference on Controversies in Vitamin D. Br. J. Clin. Pharmacol. 2018, 84, 2194–2207. [Google Scholar] [CrossRef] [PubMed]
- American Diabetes Association. Diagnosis and classification of diabetes. Diabetes Care 2016, 39, 513–521. [Google Scholar]
- Gayoso-Diz, P.; Otero-González, A.; Rodriguez-Alvarez, M.X.; Gude, F.; García, F.; De Francisco, A.; Quintela, A.G. Insulin resistance (HOMA-IR) cut-off values and the metabolic syndrome in a general adult population: Effect of gender and age: EPIRCE cross-sectional study. BMC Endocr. Disord. 2013, 16, 13–47. [Google Scholar] [CrossRef] [PubMed]
- Jørgensen, L.; Paludan-Müller, A.S.; Laursen, D.R.; Savović, J.; Boutron, I.; Sterne, J.A.; Higgins, J.P.; Hróbjartsson, A. Evaluation of the Cochrane tool for assessingrisk of bias in randomizedclinicaltrials: Overviewof publishedcomments and analysis of userpracticein Cochrane and non-Cochranereviews. Syst. Rev. 2016, 5, 80. [Google Scholar] [CrossRef] [PubMed]
- He, C.; Lin, Z.; Robb, S.W.; Ezeamama, A.E. Serumvitamin Dlevels and polycystic ovary syndrome: A systematic review and meta-analysis. Nutrients 2015, 7, 4555–4577. [Google Scholar] [CrossRef] [PubMed]
- Selimoglu, H.; Duran, C.; Kiyici, S.; Ersoy, C.; Guclu, M.; Ozkaya, G.; Tuncel, E.; Erturk, E.; Imamoglu, S. The effect of vitamin D replacement therapy on insulin resistance and androgen levels in women with polycystic ovary syndrome. J. Endocrinol. Investig. 2010, 33, 234–238. [Google Scholar] [CrossRef] [PubMed]
- Fang, F.; Ni, K.; Cai, Y.; Shang, J.; Zhang, X.; Xiong, C. Effect of vitamin D supplementation on polycystic ovary syndrome: A systematic review and meta-analysis of randomized controlled trials. Complement. Ther. Clin. Pract. 2017, 26, 53–60. [Google Scholar] [CrossRef] [PubMed]
- Xue, Y.; Xu, P.; Xue, K.; Duan, X.; Cao, J.; Luan, T.; Li, Q.; Gu, L. Effect of vitamin D on biochemical parameters in polycystic ovary syndrome women: A meta-analysis. Arch. Gynecol. Obstet. 2017, 295, 487–496. [Google Scholar] [CrossRef] [PubMed]
- Jamka, M.; Woźniewicz, M.; Walkowiak, J.; Bogdański, P.; Jeszka, J.; Stelmach-Mardas, M. The effect of vitamin D supplementation on selected inflammatory biomarkers in obese and overweight subjects: A systematic review with meta-analysis. Eur. J. Nutr. 2016, 55, 2163–2176. [Google Scholar] [CrossRef] [PubMed]
- Gagnon, C.; Daly, R.M.; Carpentier, A.; Lu, Z.X.; Shore-Lorenti, C.; Sikaris, K.; Jean, S.; Ebeling, P.R. Effects of combined calcium and vitamin D supplementation on insulin secretion, insulin sensitivity and β-cell function in multi-ethnic vitamin D-deficient adults at risk for type 2 diabetes: A pilot randomized, placebo-controlled trial. PLoS ONE 2014, 9, e109607. [Google Scholar] [CrossRef] [PubMed]
- Sanders, K.M.; Nicholson, G.C.; Ebeling, P.R. Is high dose vitamin D harmful? Calcif. Tissue Int. 2013, 92, 191–206. [Google Scholar] [CrossRef] [PubMed]
- Grossmann, R.E.; Tangpricha, V. Evaluation of vehicle substances on vitamin D bioavailability: A systematic review. Mol. Nutr. Food Res. 2010, 54, 1055–1061. [Google Scholar] [CrossRef] [PubMed]
- Coelho, I.M.; Andrade, L.D.; Saldanha, L.; Diniz, E.T.; Griz, L.; Bandeira, F. Bioavailability of vitamin D3 in non-oily capsules: The role of formulated compounds and implications for intermittent replacement. Arq. Bras. Endocrinol. Metabol. 2010, 54, 239–243. [Google Scholar] [CrossRef] [PubMed]


| Study | Country | Subjects (n) | Intervention | Supplemented Dose of Vitamin D | Vitamin D Supplements: Formulation and Manufacturer | Time of Intervention | Ethnicity |
|---|---|---|---|---|---|---|---|
| Abootorabi et al. [16], 2017 | Iran | 36 | Cholecalciferol (n = 19) Placebo (n = 17) | 50,000 IU/weekly | Capsules: D-Vitamin 50,000; Zahravi Pharm Co, Tabriz, Iran | 8 weeks | Asian: 100% |
| Ardabili et al. [17], 2012 | Iran | 50 | Cholecalciferol (n = 24) Placebo (n = 26) | 50,000 IU every 20 days Placebo | Capsules: D-Vitin 50,000, Zahravi Pharm Co, Tabriz, Iran | 60 weeks | Asian: 100% |
| Asemi et al. [18], 2014 a | Iran | 78 | Cholecalciferol (n = 26) Cholecalciferol + Calcium(n = 26) placebo (n = 26) | 50,000 IU/week 50,000 IU/week + 1000 mg/d Placebo | Tablets: Dana Pharmaceutical Company (Tabriz, Iran) and Barij Essence Pharmaceutical Company (Kashan, Iran). | 8 weeks | Asian: 100% |
| Bonakdaran et al. [24], 2012 b | Iran | 31 | Calcitriol (n = 15) Placebo (n = 16) | 200 IU/d Placebo | Capsules: Zahravi, Tabriz, Iran | 12 weeks | Asian: 100% |
| Gupta et al. [21], 2017 | India | 50 | Cholecalciferol (n = 25) Placebo (n = 25) | 60,000 IU/weekly Placebo | Not given | 12 weeks | Asian: 100% |
| Irani et al. [15], 2015 | USA | 53 | Cholecalciferol (n = 35) Placebo (n = 18) | 50,000 IU/weekly Placebo | Capsules: manufacturer not given | 8 weeks | Vitamin D group: Hispanic: 69.4%; Asian: 25%; Black: 5.5% Placebo group: Hispanic: 72.2%; Asian: 22.2%; Black: 5.5% |
| Jamilian et al. [2], 2017 | Iran | 90 | Cholecalciferol (n = 30) Cholecalciferol (n = 30) Placebo (n = 30) | 1000 IU/d 4000 IU/d Placebo | Capsules: Zahravi Pharmaceutical Company (Tabriz, Iran) and Barij Essence Pharmaceutical Company Kashan, Iran | 12 weeks | Asian: 100% |
| Jamilian et al. [22], 2017 | Iran | 60 | Cholecalciferol+Magnesium+Zinc+Calcium (n = 30) Placebo (n = 30) | 200 IU + 100 mg + 4 mg + 400 mg/d Placebo | Tablets: Vitane (Wolfratshausen, Germany) and Barij Essence Pharmaceuticals (Kashan, Iran), | 12 weeks | Asian: 100% |
| Karamali et al. [19], 2018 | Iran | 55 | Cholecalciferol + Calcium + Vitamin K (n = 28) Placebo (n = 27) | 200 IU + 500 mg + 90 μg/d Placebo | Capsules: Arian SalamtSina (Tehran, Iran) and Barij Essence Pharmaceutical Company(Kashan, Iran) | 8 weeks | Asian: 100% |
| Maktabi et al. [23], 2017 | Iran | 70 | Cholecalciferol (n = 35) Placebo (n = 35) | 50,000 IU every 2 weeks Placebo | Capsules: Zahravi, Tabriz, Iran | 12 weeks | Asian: 100% |
| Raja-Khan et al. [20], 2014 | USA | 28 | Cholecalciferol (n = 13) Placebo (n = 15) | 12,000 IU/d Placebo | Gel caps: Maximum D3 (with soy lecithin oil): BTR Group, Inc. (Pittsfield, IL, USA) | 12 weeks | N/A |
| Study | Supplemented Dose of Vitamin D | Study Groups | Age (Years) Mean ± SD | BMI (kg/m2) Mean ± SD | Serum 25(OH)D (ng/mL)Concentration Mean ± SD | |
|---|---|---|---|---|---|---|
| Before Supplementation | After Supplementation | |||||
| Abootorabi et al. [16], 2017 | Cholecalciferol Placebo | SG PG | 26.2 ± 4.6 22.8 ± 4.4 | N/A | 8.65 ± 4.3 9.80 ± 5.1 | 36.9 ± 8.4 *** 13.4 ± 7.1 |
| Ardabili et al. [17], 2012 | Cholecalciferol Placebo | SG PG | 26.8 ± 4.7 27.0 ± 3.7 | 29.1 ± 4.6 28.3 ± 3.5 | 6.9 ± 2.8 | 23.4 ± 6.1 *** |
| Asemi et al. [18], 2014a | Cholecalciferol Cholecalciferol + Calcium placebo | SG SG PG | 25.6 ± 4.4 24.9 ± 5.1 24.3 ± 5.2 | 29.3 ± 3.9 27.3 ± 5.3 27.5 ± 5.2 | 11.6 ± 4.7 15.1 ± 3.6 14.0 ± 4.1 | 23.4 ± 7.1 ** 26.8 ± 7.8 *** 14.4 ± 4.7 |
| Bonakdaran et al. [24], 2012b | Calcitriol Placebo | SG PG | 24.7 ± 3.3 25.2 ± 7.9 | 24.8 ± 5.3 25.3 ± 5.1 | 11.4 ± 8.2 19.9 ± 16.5 | 20.1 ± 16.2 19.0 ± 15.3 |
| Gupta et al. [21], 2017 | Cholecalciferol Placebo | SG PG | 26.0 ± 3.7 26.6 ± 3.7 | 24.9 ± 2.8 25.6 ± 2.0 | 18.56 ± 9.7 | 44.90 ± 9.04 *** |
| Irani et al. [15], 2015 | Cholecalciferol Placebo | SG PG | 30.5 ± 1.0 29.6 ± 1.7 | 30.0 ± 1.0 28.0 ± 1.6 | 16.3 ± 0.9 17.0 ± 1.8 | 43.2 ± 2.4 ** 17.4 ± 1.9 |
| Jamilian et al. [22], 2017 | Cholecalciferol+Magnesium+Zinc+Calcium Placebo | SG PG | 18–40 | N/A | +7.9 ± 8.4 *** b +0.1 ± 8.4 | |
| Jamilian et al. [2], 2017 | Cholecalciferol Cholecalciferol Placebo | SG low dose SG high dose PG | 26 ± 5.0 28 ± 5.0 25 ± 5.0 | 33 ± 5 31 ± 6 30 ± 6 | 12.6 ± 3.4 12.6 ± 2.7 12.9 ± 2.4 | 18.5 ± 4.9 * 24.6 ± 3.3 * 13.1 ± 2.5 |
| Karamali et al. [19], 2018 | Cholecalciferol + calcium + vitamin K Placebo | SG PG | 23.5 ± 4.2 23.3 ± 3.4 | 24.2 ± 4.8 24.3 ± 3.9 | 14.7 ± 2.5 14.8 ± 3.9 | 20.0 ± 3.0 *** 14.5 ± 5.0 |
| Maktabi et al. [23], 2017 | Cholecalciferol Placebo | SG PG | 18–40 a | N/A | 12.8 ± 4.5 14.5 ± 5.1 | 27.5 ± 9.8 *** 14.4 ± 5.2 |
| Raja-Khan et al. [20], 2014 | Cholecalciferol Placebo | SG PG | 28.2 ± 5.2 28.7 ± 5.6 | 37.2 ± 4.5 35.1 ± 9.8 | 19.95 ± 9.5 22.20 ± 6.9 | 67.4 ± 28.6 *** 22.5 ± 7.0 |
| Study | Supplemented Dose of Vitamin D | Study Groups | Fasting Glucose (mg/dL) Mean ± SD | Fasting Insulin (μLU/mL) Mean ± SD | HOMA-IR Mean ± SD | |||
|---|---|---|---|---|---|---|---|---|
| Before | After | Before | After | Before | After | |||
| Abootorabi et al. [16], 2017 | Cholecalciferol Placebo | SG PG | 86.7 ± 6.8 84.2 ± 5.9 | 79.1 ± 7.1 *** 85.9 ± 7.9 | 14.7 ± 7.5 8.2 ± 5.8 | 15.9 ± 7.3 9.6 ± 3.3 | 2.8 ± 1.3 1.7 ± 1.2 | 2.8 ± 1.4 2.0 ± 0.7 |
| Ardabili et al. [17], 2012 | Cholecalciferol Placebo | SG PG | 99.8 ± 10.1 101.5 ± 10.6 | 96.6 ± 9.9 98.8 ± 14.6 | 12.5 ± 15.1 9.9 ± 5.3 | 13.3 ± 9.7 10.0 ± 4.1 | 3.2 ± 4.1 2.5 ± 1.4 | 3.2 ± 2.6 2.5 ± 1.1 |
| Asemi et al. [18], 2014 a | Cholecalciferol Cholecalciferol + calcium placebo | SG SG PG | 87.3 ± 16.4 81.6 ± 10.0 67.6 ± 11.7 | 86.8 ± 16.1 76.4 ± 13.3 * 73.5 ± 23.8 | 13.5 ± 9.9 11.1 ± 14.2 12.0 ± 5.6 | 12.4 ± 5.5 * 7.8 ± 3.6 * 15.1 ± 7.1 | 3.1 ± 2.8 2.2 ± 2.8 2.0 ± 1.1 | 2.8 ± 1.6 * 1.5 ± 0.7 * 2.8 ± 1.9 |
| Bonakdaran et al. [24], 2012 b | Calcitriol Placebo | SG PG | 81.7 ± 8.6 86.3 ± 5.4 | 89.0 ± 12.3 87.3 ± 5.3 | 18.3 ± 30.4 13.6 ± 14.6 | 13.1 ± 14.8 8.6 ± 5.0 | 4.2 ± 6.8 2.8 ± 2.9 | 2.7 ± 3.1 1.9 ± 1.0 |
| Gupta et al. [21], 2017 | Cholecalciferol Placebo | SG PG | 88.2 ± 9.3 91.3 ± 8.4 | 82.4 ± 8.0 * 87.6 ± 9.9 | 10.3 ± 20.0 4.6 ± 0.6 | 5.0 ± 3.2 * 4.6 ± 0.6 | 2.4 ± 4.9 1.0 ± 0.6 | 1.0 ± 0.6 * 1.0 ± 0.2 |
| Irani et al. [15], 2015 | Cholecalciferol Placebo | SG PG | N/A | N/A | N/A | N/A | 2.1 ± 0.4 1.6 ± 0.3 | 2.0 ± 0.2 1.5 ± 0.2 |
| Jamilian et al. [22], 2017 | Cholecalciferol Cholecalciferol Placebo | SG low dose SG high dose PG | N/A | N/A | N/A | N/A | 3.2 ± 0.4 3.2 ± 0.4 3.0 ± 0.3 | 2.9 ± 0.6 2.7 ± 0.4 * 3.1 ± 0.7 |
| Jamilian et al. [2], 2017 | Cholecalciferol+Magnesium+Zinc+Calcium Placebo | SG PG | 86.6 ± 6.9 90.0 ± 4.8 | 86.7 ± 7.5 91.1 ± 5.9 | 12.9 ± 4.4 11.2 ± 3.9 | 11.0 ± 4.6 11.6 ± 4.5 | 2.8 ± 0.9 2.5 ± 0.9 | 2.4 ± 1.1 2.6 ± 1.0 |
| Karamali et al. [19], 2018 | Cholecalciferol + calcium + vitamin K Placebo | SG PG | 84.2 ± 6.9 83.6 ± 13.0 | 84.5 ± 6.7 88.6 ± 20.5 | 11.8 ± 4.7 10.4 ± 5.3 | 9.9 ± 3.7 ** 12.2 ± 6.1 | 2.4 ± 1.0 2.1 ± 1.0 | 2.0 ± 0.8 ** 2.5 ± 1.3 |
| Maktabi et al. [23], 2017 | Cholecalciferol Placebo | SG PG | 91.0 ± 6.1 93.8 ± 7.8 | 87.8 ± 7.6 * 94.3 ± 9.8 | 9.6 ± 4.5 9.1 ± 7.3 | 8.2 ± 2.8 ** 11.7 ± 6.5 | 2.2 ± 1.1 2.1 ± 1.7 | 1.8 ± 0.6 ** 2.7 ± 1.6 |
| Raja-Khan et al. [20], 2014 | Cholecalciferol Placebo | SG PG | 84.9 ± 9.5 83.7 ± 9.3 | 83.8 ± 8.0 77.6 ± 14.7 | 26.31 ± 9.6 27.1 ± 15.8 | 38.1 ± 37.6 28.7 ± 14.6 | 5.5 ± 1.8 5.8 ± 3.9 | 7.8 ± 7.4 5.7 ± 3.0 |
© 2018 by the authors. Licensee MDPI, Basel, Switzerland. This article is an open access article distributed under the terms and conditions of the Creative Commons Attribution (CC BY) license (http://creativecommons.org/licenses/by/4.0/).
Share and Cite
Łagowska, K.; Bajerska, J.; Jamka, M. The Role of Vitamin D Oral Supplementation in Insulin Resistance in Women with Polycystic Ovary Syndrome: A Systematic Review and Meta-Analysis of Randomized Controlled Trials. Nutrients 2018, 10, 1637. https://doi.org/10.3390/nu10111637
Łagowska K, Bajerska J, Jamka M. The Role of Vitamin D Oral Supplementation in Insulin Resistance in Women with Polycystic Ovary Syndrome: A Systematic Review and Meta-Analysis of Randomized Controlled Trials. Nutrients. 2018; 10(11):1637. https://doi.org/10.3390/nu10111637
Chicago/Turabian StyleŁagowska, Karolina, Joanna Bajerska, and Małgorzata Jamka. 2018. "The Role of Vitamin D Oral Supplementation in Insulin Resistance in Women with Polycystic Ovary Syndrome: A Systematic Review and Meta-Analysis of Randomized Controlled Trials" Nutrients 10, no. 11: 1637. https://doi.org/10.3390/nu10111637
APA StyleŁagowska, K., Bajerska, J., & Jamka, M. (2018). The Role of Vitamin D Oral Supplementation in Insulin Resistance in Women with Polycystic Ovary Syndrome: A Systematic Review and Meta-Analysis of Randomized Controlled Trials. Nutrients, 10(11), 1637. https://doi.org/10.3390/nu10111637