A Comparison of a Pulse-Based Diet and the Therapeutic Lifestyle Changes Diet in Combination with Exercise and Health Counselling on the Cardio-Metabolic Risk Profile in Women with Polycystic Ovary Syndrome: A Randomized Controlled Trial

 ,
,  ,
, 
Abstract
1. Introduction
2. Materials and Methods
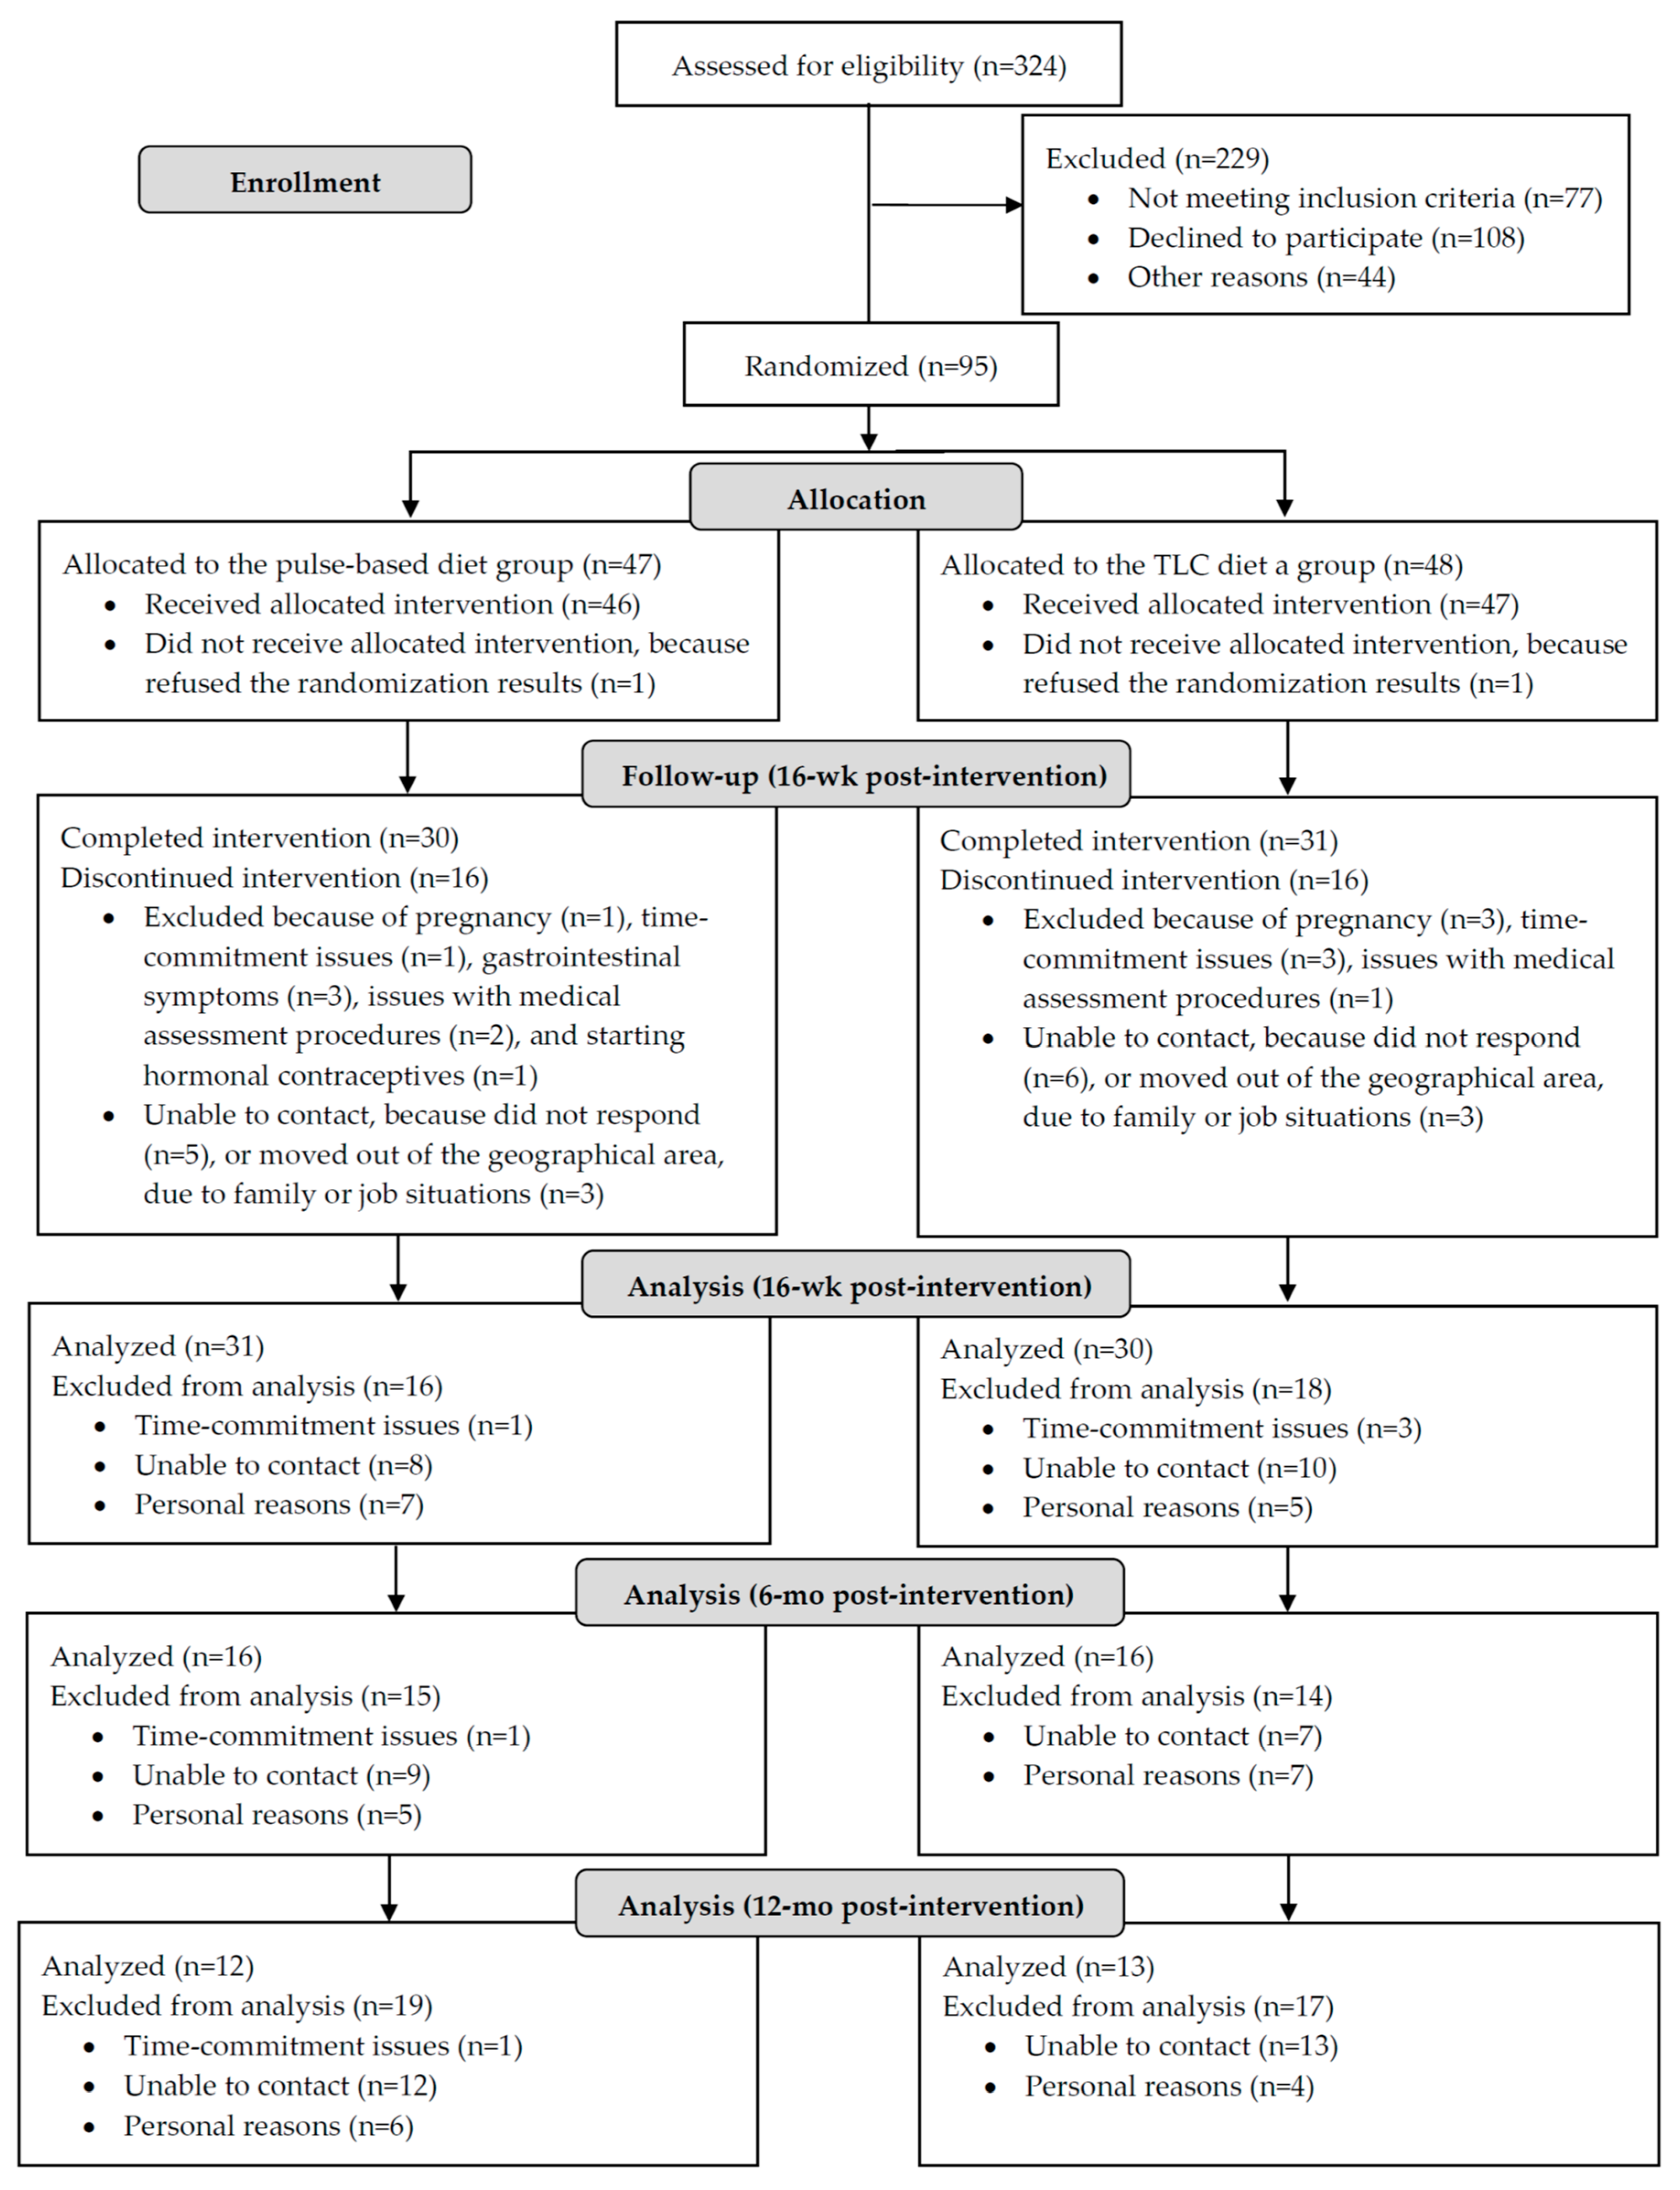
2.1. Study Design
2.2. Participants
2.3. Clinical Assessment
2.4. Cardio-Metabolic Risk Profile Measurement
2.5. Biochemical Analyses
2.6. Dietary and Physical Activity Assessment
2.7. Statistical Analysis
3. Results
3.1. Metformin-Dietary Intervention Interactions
3.2. Prevalence Rate of MetS
3.3. Anthropometric, Body Composition, and Blood Pressure Measures
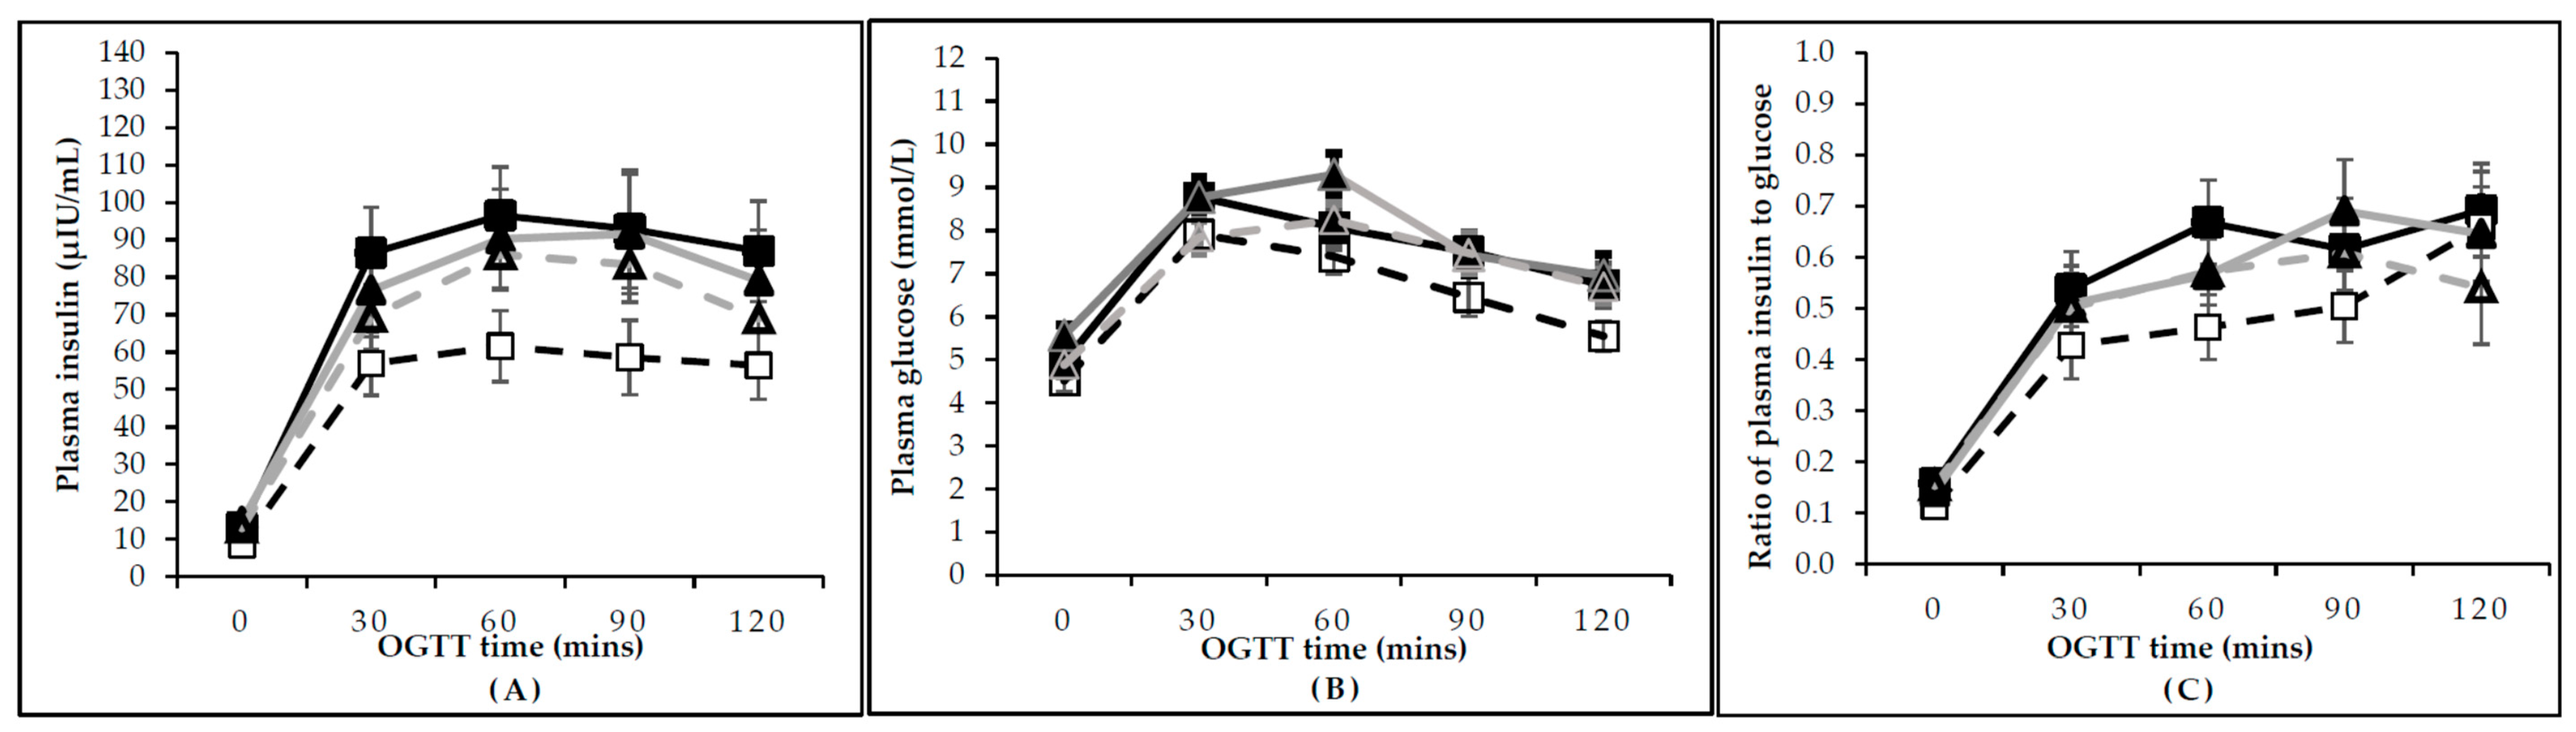
3.4. Insulin and Glucose Measurements and Responses to OGTT
3.5. Lipid Profile
3.6. Dietary Intake and Physical Activity
3.7. Adverse Events
3.8. Long-Term Follow-Up: Clinical and Biochemical Measures Following Six and 12 Months Post-Intervention
3.9. Long-Term Follow-Up: Dietary Intake and Physical Activity Following Six and 12 Months Post-Intervention
4. Discussion
5. Conclusions
Supplementary Materials
Author Contributions
Funding
Acknowledgments
Conflicts of Interest
References
- March, W.A.; Moore, V.M.; Willson, K.J.; Phillips, D.I.W.; Norman, R.J.; Davies, M.J. The prevalence of polycystic ovary syndrome in a community sample assessed under contrasting diagnostic criteria. Hum. Reprod. 2010, 25, 544–551. [Google Scholar] [CrossRef] [PubMed]
- Carmina, E.; Lobo, R.A. Polycystic ovary syndrome (PCOS): Arguably the most common endocrinopathy is associated with significant morbidity in women. J. Clin. Endocrinol. Metab. 1999, 84, 1897–1899. [Google Scholar] [CrossRef] [PubMed]
- Diamanti-Kandarakis, E.; Dunaif, A. Insulin resistance and the polycystic ovary syndrome revisited: An update on mechanisms and implications. Endocr. Rev. 2012, 33, 981–1030. [Google Scholar] [CrossRef] [PubMed]
- Wild, R.A.; Carmina, E.; Diamanti-Kandarakis, E.; Dokras, A.; Escobar-Morreale, H.F.; Futterweit, W.; Lobo, R.; Norman, R.J.; Talbott, E.; Dumesic, D.A. Assessment of cardiovascular risk and prevention of cardiovascular disease in women with the polycystic ovary syndrome: A consensus statement by the Androgen Excess and Polycystic Ovary Syndrome (AE-PCOS) Society. J. Clin. Endocrinol. Metab. 2010, 95, 2038–2049. [Google Scholar] [CrossRef] [PubMed]
- Alberti, K.G.M.M.; Eckel, R.H.; Grundy, S.M.; Zimmet, P.Z.; Cleeman, J.I.; Donato, K.A.; Fruchart, J.C.; James, W.P.T.; Loria, C.M.; Smith, S.C. Harmonizing the metabolic syndrome: A joint interim statement of the International Diabetes Federation Task Force on Epidemiology and Prevention; National Heart, Lung, and Blood Institute; American Heart Association; World Heart Federation; International Atherosclerosis Society; and International Association for the Study of Obesity. Circulation 2009, 120, 1640–1645. [Google Scholar] [CrossRef] [PubMed]
- Marsh, K.; Brand-Miller, J. The optimal diet for women with polycystic ovary syndrome? Br. J. Nutr. 2005, 94, 154–165. [Google Scholar] [CrossRef] [PubMed]
- Cooney, L.G.; Milman, L.W.; Hantsoo, L.; Kornfield, S.; Sammel, M.D.; Allison, K.C.; Epperson, C.N.; Dokras, A. Cognitive-behavioral therapy improves weight loss and quality of life in women with polycystic ovary syndrome: A pilot randomized clinical trial. Fertil. Steril. 2018, 110, 161.e1–171.e1. [Google Scholar] [CrossRef] [PubMed]
- Dokras, A.; Stener-Victorin, E.; Yildiz, B.O.; Li, R.; Ottey, S.; Shah, D.; Epperson, N.; Teede, H. Androgen Excess-Polycystic Ovary Syndrome Society: Position statement on depression, anxiety, quality of life, and eating disorders in polycystic ovary syndrome. Fertil. Steril. 2018, 109, 888–899. [Google Scholar] [CrossRef] [PubMed]
- Moran, L.J.; Hutchison, S.K.; Norman, R.J.; Teede, H.J. Lifestyle changes in women with polycystic ovary syndrome. Cochrane Database Syst. Rev. 2011, 7, Cd007506. [Google Scholar] [CrossRef]
- Teede, H.J.; Misso, M.L.; Costello, M.F.; Dokras, A.; Laven, J.; Moran, L.; Piltonen, T.; Norman, R.J.; International, P.N. Recommendations from the international evidence-based guideline for the assessment and management of polycystic ovary syndrome. Hum. Reprod. 2018, 33, 1602–1618. [Google Scholar] [CrossRef] [PubMed]
- Moran, L.J.; Ko, H.; Misso, M.; Marsh, K.; Noakes, M.; Talbot, M.; Frearson, M.; Thondan, M.; Stepto, N.; Teede, H.J. Dietary composition in the treatment of polycystic ovary syndrome: A systematic review to inform evidence-based guidelines. J. Acad. Nutr. Diet. 2013, 113, 520–545. [Google Scholar] [CrossRef] [PubMed]
- Asemi, Z.; Samimi, M.; Tabassi, Z.; Shakeri, H.; Sabihi, S.S.; Esmaillzadeh, A. Effects of DASH diet on lipid profiles and biomarkers of oxidative stress in overweight and obese women with polycystic ovary syndrome: A randomized clinical trial. Nutrition 2014, 30, 1287–1293. [Google Scholar] [CrossRef] [PubMed]
- Asemi, Z.; Esmaillzadeh, A. DASH diet, insulin resistance, and serum hs-CRP in polycystic ovary syndrome: A randomized controlled clinical trial. Horm. Metab. Res. 2015, 47, 232–238. [Google Scholar] [CrossRef] [PubMed]
- Toscani, M.K.; Mario, F.M.; Radavelli-Bagatini, S.; Wiltgen, D.; Matos, M.C.; Spritzer, P.M. Effect of high-protein or normal-protein diet on weight loss, body composition, hormone, and metabolic profile in southern Brazilian women with polycystic ovary syndrome: A randomized study. Gynecol. Endocrinol. 2011, 27, 925–930. [Google Scholar] [CrossRef] [PubMed]
- Stamets, K.; Taylor, D.S.; Kunselman, A.; Demers, L.M.; Pelkman, C.L.; Legro, R.S. A randomized trial of the effects of two types of short-term hypocaloric diets on weight loss in women with polycystic ovary syndrome. Fertil. Steril. 2004, 81, 630–637. [Google Scholar] [CrossRef] [PubMed]
- Thomson, R.L.; Buckley, J.D.; Noakes, M.; Clifton, P.M.; Norman, R.J.; Brinkworth, G.D. The effect of a hypocaloric diet with and without exercise training on body composition, cardiometabolic risk profile, and reproductive function in overweight and obese women with polycystic ovary syndrome. J. Clin. Endocrinol. Metab. 2008, 93, 3373–3380. [Google Scholar] [CrossRef] [PubMed]
- Mehrabani, H.H.; Salehpour, S.; Amiri, Z.; Farahani, S.J.; Meyer, B.J.; Tahbaz, F. Beneficial effects of a high-protein, low-glycemic-load hypocaloric diet in overweight and obese women with polycystic ovary syndrome: A randomized controlled intervention study. J. Am. Coll. Nutr. 2012, 31, 117–125. [Google Scholar] [CrossRef] [PubMed]
- Turner-McGrievy, G.M.; Davidson, C.R.; Wingard, E.E.; Billings, D.L. Low glycemic index vegan or low-calorie weight loss diets for women with polycystic ovary syndrome: A randomized controlled feasibility study. Nutr. Res. 2014, 34, 552–558. [Google Scholar] [CrossRef] [PubMed]
- Mudryj, A.N.; Yu, N.; Aukema, H.M. Nutritional and health benefits of pulses. Appl. Physiol. Nutr. Metab. 2014, 39, 1197–1204. [Google Scholar] [CrossRef] [PubMed]
- Ha, V.; Sievenpiper, J.L.; de Souza, R.J.; Jayalath, V.H.; Mirrahimi, A.; Agarwal, A.; Chiavaroli, L.; Mejia, S.B.; Sacks, F.M.; Di Buono, M.; et al. Effect of dietary pulse intake on established therapeutic lipid targets for cardiovascular risk reduction: A systematic review and meta-analysis of randomized controlled trials. Can. Med. Assoc. J. CMAJ 2014, 186, E252–E262. [Google Scholar] [CrossRef] [PubMed]
- McCrory, M.A.; Hamaker, B.R.; Lovejoy, J.C.; Eichelsdoerfer, P.E. Pulse consumption, satiety, and weight management. Adv. Nutr. 2010, 1, 17–30. [Google Scholar] [CrossRef] [PubMed]
- Sievenpiper, J.L.; Kendall, C.W.C.; Esfahani, A.; Wong, J.M.W.; Carleton, A.J.; Jiang, H.Y.; Bazinet, R.P.; Vidgen, E.; Jenkins, D.J.A. Effect of non-oil-seed pulses on glycaemic control: A systematic review and meta-analysis of randomised controlled experimental trials in people with and without diabetes. Diabetologia 2009, 52, 1479–1495. [Google Scholar] [CrossRef] [PubMed]
- Abeysekara, S.; Chilibeck, P.D.; Vatanparast, H.; Zello, G.A. A pulse-based diet is effective for reducing total and LDL-cholesterol in older adults. Br. J. Nutr. 2012, 108, S103–S110. [Google Scholar] [CrossRef] [PubMed]
- National Cholesterol Education Program (NCEP) Expert Panel on Detection, Evaluation, and Treatment of High Blood Cholesterol in Adults (Adult Treatment Panel III). Third report of the National Cholesterol Education Program (NCEP) Expert Panel on Detection, Evaluation, and Treatment of High Blood Cholesterol in adults (Adult Treatment Panel III) final report. Circulation 2002, 106, 3143–3421. [Google Scholar] [CrossRef]
- McBreairty, L.E.; Chilibeck, P.D.; Chizen, D.R.; Pierson, R.A.; Tumback, L.; Sherar, L.B.; Zello, G.A. The role of a pulse-based diet on infertility measures and metabolic syndrome risk: Protocol of a randomized clinical trial in women with polycystic ovary syndrome. BMC Nutr. 2017, 3, 23. [Google Scholar] [CrossRef]
- Canadian Institutes of Health Research, Natural Science and Engineering Research Council, Social Sciences and Humanities Research Council of Canada. Tri-Council Policy Statement: Ethical Conduct for Research Involving Humans. Available online: http://www.ethics.gc.ca/pdf/eng/tcps2/TCPS_2_FINAL_Web.pdf (accessed on 5 January 2016).
- Schäfer, G.; Schenk, U.; Ritzel, U.; Ramadori, G.; Leonhardt, U. Comparison of the effects of dried peas with those of potatoes in mixed meals on postprandial glucose and insulin concentrations in patients with type 2 diabetes. Am. J. Clin. Nutr. 2003, 78, 99–103. [Google Scholar] [CrossRef] [PubMed]
- Shutler, S.M.; Bircher, G.M.; Tredger, J.A.; Morgan, L.M.; Walker, A.F.; Low, A.G. The effect of daily baked bean (Phaseolus vulgaris) consumption on the plasma lipid levels of young, normo-cholesterolaemic men. Br. J. Nutr. 1989, 61, 257–265. [Google Scholar] [CrossRef] [PubMed]
- Sacks, F.M.; Svetkey, L.P.; Vollmer, W.M.; Appel, L.J.; Bray, G.A.; Harsha, D.; Obarzanek, E.; Conlin, P.R.; Miller, E.R.; Simons-Morton, D.G.; et al. Effects on blood pressure of reduced dietary sodium and the Dietary Approaches to Stop Hypertension (DASH) diet. N. Engl. J. Med. 2001, 344, 3–10. [Google Scholar] [CrossRef] [PubMed]
- Willett, W.C.; Sacks, F.; Trichopoulou, A.; Drescher, G.; Ferro-Luzzi, A.; Helsing, E.; Trichopoulos, D. Mediterranean diet pyramid: A cultural model for healthy eating. Am. J. Clin. Nutr. 1995, 61, 1402S–1406S. [Google Scholar] [CrossRef] [PubMed]
- Health Canada. Eating Well with Canada’s Food Guide. Available online: http://www.hc-sc.gc.ca/fn-an/alt_formats/hpfb-dgpsa/pdf/food-guide-aliment/print_eatwell_bienmang-eng.pdf (accessed on 14 May 2017).
- Azziz, R.; Carmina, E.; Dewailly, D.; Diamanti-Kandarakis, E.; Escobar-Morreale, H.F.; Futterweit, W.; Janssen, O.E.; Legro, R.S.; Norman, R.J.; Taylor, A.E.; et al. Criteria for defining polycystic ovary syndrome as a predominantly hyperandrogenic syndrome: An Androgen Excess Society guideline. J. Clin. Endocrinol. Metab. 2006, 91, 4237–4245. [Google Scholar] [CrossRef] [PubMed]
- Dewailly, D.; Lujan, M.E.; Carmina, E.; Cedars, M.I.; Laven, J.; Norman, R.J.; Escobar-Morreale, H.F. Definition and significance of polycystic ovarian morphology: A task force report from the Androgen Excess and Polycystic Ovary Syndrome Society. Hum. Reprod. Update 2014, 20, 334–352. [Google Scholar] [CrossRef] [PubMed]
- Clark, N.M.; Podolski, A.J.; Brooks, E.D.; Chizen, D.R.; Pierson, R.A.; Lehotay, D.C.; Lujan, M.E. Prevalence of polycystic ovary syndrome phenotypes using updated criteria for polycystic ovarian morphology: An assessment of over 100 consecutive women self-reporting features of polycystic ovary syndrome. Reprod. Sci. 2014, 21, 1034–1043. [Google Scholar] [CrossRef] [PubMed]
- World Health Organization. Waist Circumference and Waist-Hip Ratio: Report of a WHO Expert Consultation. Geneva, Switzerland, 8–11 December 2008; World Health Organization: Geneva, Switzerland, 2011; pp. 1–47. ISBN 978-924-150-149-1. [Google Scholar]
- Goldenberg, R.; Punthakee, Z. Definition, classification and diagnosis of diabetes, prediabetes and metabolic syndrome. Can. J. Diabetes 2013, 37, S8–S11. [Google Scholar] [CrossRef] [PubMed]
- Matthews, D.R.; Hosker, J.P.; Rudenski, A.S.; Naylor, B.A.; Treacher, D.F.; Turner, R.C. Homeostasis model assessment: Insulin resistance and beta-cell function from fasting plasma glucose and insulin concentrations in man. Diabetologia 1985, 28, 412–419. [Google Scholar] [CrossRef] [PubMed]
- World Health Organization. Preventing and Managing the Global Epidemic; WHO Technical Report Series 894; World Health Organization: Geneva, Switzerland, 2000; pp. 1–252. ISBN 924-120-894-5. [Google Scholar]
- Graff, S.K.; Mário, F.M.; Alves, B.C.; Spritzer, P.M. Dietary glycemic index is associated with less favorable anthropometric and metabolic profiles in polycystic ovary syndrome women with different phenotypes. Fertil. Steril. 2013, 100, 1081–1088. [Google Scholar] [CrossRef] [PubMed]
- Atkinson, F.S.; Foster-Powell, K.; Brand-Miller, J.C. International Tables of Glycemic Index and Glycemic Load Values: 2008. Diabetes Care 2008, 31, 2281–2283. [Google Scholar] [CrossRef] [PubMed]
- Egan, N.; Read, A.; Riley, P.; Atiomo, W. Evaluating compliance to a low glycaemic index (GI) diet in women with polycystic ovary syndrome (PCOS). BMC Res. Notes 2011, 4, 53. [Google Scholar] [CrossRef] [PubMed]
- Jenkins, D.J.; Kendall, C.W.; Augustin, L.S.; Franceschi, S.; Hamidi, M.; Marchie, A.; Jenkins, A.L.; Axelsen, M. Glycemic index: Overview of implications in health and disease. Am. J. Clin. Nutr. 2002, 76, 266S–273S. [Google Scholar] [CrossRef] [PubMed]
- Beulens, J.W.; de Bruijne, L.M.; Stolk, R.P.; Peeters, P.H.; Bots, M.L.; Grobbee, D.E.; van der Schouw, Y.T. High dietary glycemic load and glycemic index increase risk of cardiovascular disease among middle-aged women: A population-based follow-up study. J. Am. Coll. Cardiol. 2007, 50, 14–21. [Google Scholar] [CrossRef] [PubMed]
- Salmerón, J.; Manson, J.E.; Stampfer, M.J.; Colditz, G.A.; Wing, A.L.; Willett, W.C. Dietary fiber, glycemic load, and risk of non-insulin-dependent diabetes mellitus in women. JAMA 1997, 277, 472–477. [Google Scholar] [CrossRef] [PubMed]
- Nutrient Recommendations: Dietary Reference Intakes (DRI). Available online: https://ods.od.nih.gov/Health_Information/Dietary_Reference_Intakes.aspx (accessed on 2 May 2017).
- Godin, G.; Shephard, R. A simple method to assess exercise behaviour in the community. Can. J. Appl. Sport Sci. 1985, 10, 141–146. [Google Scholar] [PubMed]
- Tai, M.M. A mathematical model for the determination of total area under glucose tolerance and other metabolic curves. Diabetes Care 1994, 17, 152–154. [Google Scholar] [CrossRef] [PubMed]
- Yildiz, B.O.; Bolour, S.; Woods, K.; Moore, A.; Azziz, R. Visually scoring hirsutism. Hum. Reprod. Update 2010, 16, 51–64. [Google Scholar] [CrossRef] [PubMed]
- Jayalath, V.H.; De Souza, R.J.; Sievenpiper, J.L.; Ha, V.; Chiavaroli, L.; Mirrahimi, A.; Di Buono, M.; Bernstein, A.M.; Leiter, L.A.; Kris-Etherton, P.M.; et al. Effect of dietary pulses on blood pressure: A systematic review and meta-analysis of controlled feeding trials. Am. J. Hypertens. 2014, 27, 56–64. [Google Scholar] [CrossRef] [PubMed]
- Anderson, J.W.; Major, A.W. Pulses and lipaemia, short- and long-term effect: Potential in the prevention of cardiovascular disease. Br. J. Nutr. 2002, 88 (Suppl. 3), S263–S271. [Google Scholar] [CrossRef] [PubMed]
- Manson, J.E.; Tosteson, H.; Ridker, P.M.; Satterfield, S.; Hebert, P.; O’Connor, G.T.; Buring, J.E.; Hennekens, C.H. The primary prevention of myocardial infarction. N. Engl. J. Med. 1992, 326, 1406–1416. [Google Scholar] [CrossRef] [PubMed]
- Cholesterol Treatment Trialists’ (CTT) Collaborators; Mihaylova, B.; Emberson, J.; Blackwell, L.; Keech, A.; Simes, J.; Barnes, E.H.; Voysey, M.; Gray, A.; Collins, R. The effects of lowering LDL cholesterol with statin therapy in people at low risk of vascular disease: Meta-analysis of individual data from 27 randomised trials. Lancet 2012, 380, 581–590. [Google Scholar] [CrossRef]
- Bazzano, L.A.; Thompson, A.M.; Tees, M.T.; Nguyen, C.H.; Winham, D.M. Non-soy legume consumption lowers cholesterol levels: A meta-analysis of randomized controlled trials. Nutr. Metab. Cardiovasc. Dis. 2011, 21, 94–103. [Google Scholar] [CrossRef] [PubMed]
- Galisteo, M.; Duarte, J.; Zarzuelo, A. Effects of dietary fibers on disturbances clustered in the metabolic syndrome. J. Nutr. Biochem. 2008, 19, 71–84. [Google Scholar] [CrossRef] [PubMed]
- Brown, L.; Rosner, B.; Willett, W.W.; Sacks, F.M. Cholesterol-lowering effects of dietary fiber: A meta-analysis. Am. J. Clin. Nutr. 1999, 69, 30–42. [Google Scholar] [CrossRef] [PubMed]
- Kishimoto, Y.; Wakabayashi, S.; Takeda, H. Hypocholesterolemic effect of dietary fiber: Relation to intestinal fermentation and bile acid excretion. J. Nutr. Sci. Vitaminol. (Tokyo) 1995, 41, 151–161. [Google Scholar] [CrossRef] [PubMed]
- Pilch, S.M.; Center for Food Safety and Applied Nutrition; Federation of American Societies for Experimental Biology; Life Sciences Research Office (Contributors). Physiological Effects and Health Consequences of Dietary Fiber; Life Sciences Research Office, Federation of American Societies for Experimental Biology: Bethesda, MD, USA, 1987; pp. 1–236.
- Koh, A.; De Vadder, F.; Kovatcheva-Datchary, P.; Bäckhed, F. From dietary fiber to host physiology: Short-chain fatty acids as key bacterial metabolites. Cell 2016, 165, 1332–1345. [Google Scholar] [CrossRef] [PubMed]
- Van Bennekum, A.M.; Nguyen, D.V.; Schulthess, G.; Hauser, H.; Phillips, M.C. Mechanisms of cholesterol-lowering effects of dietary insoluble fibres: Relationships with intestinal and hepatic cholesterol parameters. Br. J. Nutr. 2005, 94, 331–337. [Google Scholar] [CrossRef] [PubMed]
- Chibbar, R.N.; Ambigaipalan, P.; Hoover, R. Review: Molecular diversity in pulse seed starch and complex carbohydrates and its role in human nutrition and health. Cereal Chem. 2010, 87, 342–352. [Google Scholar] [CrossRef]
- Schneeman, B.O. Dietary fiber and gastrointestinal function. Nutr. Rev. 1987, 45, 129–132. [Google Scholar] [CrossRef] [PubMed]
- Ludwig, D.S. The glycemic index: Physiological mechanisms relating to obesity, diabetes, and cardiovascular disease. JAMA 2002, 287, 2414–2423. [Google Scholar] [CrossRef] [PubMed]
- Mozaffarian, D.; Pischon, T.; Hankinson, S.E.; Rifai, N.; Joshipura, K.; Willett, W.C.; Rimm, E.B. Dietary intake of trans fatty acids and systemic inflammation in women. Am. J. Clin. Nutr. 2004, 79, 606–612. [Google Scholar] [CrossRef] [PubMed]
- Lefevre, M.; Lovejoy, J.C.; Smith, S.R.; DeLany, J.P.; Champagne, C.; Most, M.M.; Denkins, Y.; de Jonge, L.; Rood, J.; Bray, G.A. Comparison of the acute response to meals enriched with cis-or trans-fatty acids on glucose and lipids in overweight individuals with differing FABP2 genotypes. Metabolism 2005, 54, 1652–1658. [Google Scholar] [CrossRef] [PubMed]
- Diamanti-Kandarakis, E.; Alexandraki, K.; Piperi, C.; Protogerou, A.; Katsikis, I.; Paterakis, T.; Lekakis, J.; Panidis, D. Inflammatory and endothelial markers in women with polycystic ovary syndrome. Eur. J. Clin. Investig. 2006, 36, 691–697. [Google Scholar] [CrossRef] [PubMed]
- Velazquez, E.; Bellabarba, G.A.; Mendoza, S.; Sánchez, L. Postprandial triglyceride response in patients with polycystic ovary syndrome: Relationship with waist-to-hip ratio and insulin. Fertil. Steril. 2000, 74, 1159–1163. [Google Scholar] [CrossRef]
- Bahcecı, M.; Aydemır, M.; Tuzcu, A. Effects of oral fat and glucose tolerance test on serum lipid profile, apolipoprotein, and CRP concentration, and insulin resistance in patients with polycystic ovary syndrome. Fertil. Steril. 2007, 87, 1363–1368. [Google Scholar] [CrossRef] [PubMed]
- Kirchengast, S.; Huber, J. Body composition characteristics and body fat distribution in lean women with polycystic ovary syndrome. Hum. Reprod. 2001, 16, 1255–1260. [Google Scholar] [CrossRef] [PubMed]
- Kasim-Karakas, S.E.; Almario, R.U.; Gregory, L.; Wong, R.; Todd, H.; Lasley, B.L. Metabolic and endocrine effects of a polyunsaturated fatty acid-rich diet in polycystic ovary syndrome. J. Clin. Endocrinol. Metab. 2004, 89, 615–620. [Google Scholar] [CrossRef] [PubMed]
- Barclay, A.W.; Petocz, P.; McMillan-Price, J.; Flood, V.M.; Prvan, T.; Mitchell, P.; Brand-Miller, J.C. Glycemic index, glycemic load, and chronic disease risk—A meta-analysis of observational studies. Am. J. Clin. Nutr. 2008, 87, 627–637. [Google Scholar] [CrossRef] [PubMed]
- Thorne, M.J.; Thompson, L.; Jenkins, D. Factors affecting starch digestibility and the glycemic response with special reference to legumes. Am. J. Clin. Nutr. 1983, 38, 481–488. [Google Scholar] [CrossRef] [PubMed]
- Shishehgar, F.; Tehrani, F.R.; Mirmiran, P.; Hajian, S.; Baghestani, A.R.; Moslehi, N. Comparison of dietary intake between polycystic ovary syndrome women and controls. Glob. J. Health Sci. 2016, 8, 302–311. [Google Scholar] [CrossRef] [PubMed]
- Douglas, C.C.; Norris, L.E.; Oster, R.A.; Darnell, B.E.; Azziz, R.; Gower, B.A. Difference in dietary intake between women with polycystic ovary syndrome and healthy controls. Fertil. Steril. 2006, 86, 411–417. [Google Scholar] [CrossRef] [PubMed]
- Altieri, P.; Cavazza, C.; Pasqui, F.; Morselli, A.M.; Gambineri, A.; Pasquali, R. Dietary habits and their relationship with hormones and metabolism in overweight and obese women with polycystic ovary syndrome. Clin. Endocrinol. (Oxf.) 2013, 78, 52–59. [Google Scholar] [CrossRef] [PubMed]
- Toscani, M.K.; Mario, F.M.; Radavelli-Bagatini, S.; Spritzer, P.M. Insulin resistance is not strictly associated with energy intake or dietary macronutrient composition in women with polycystic ovary syndrome. Nutr. Res. 2011, 31, 97–103. [Google Scholar] [CrossRef] [PubMed]
- Frost, G.; Dornhorst, A. Glycemic Index. In Encyclopedia of Human Nutrition, 3rd ed.; Caballero, B., Allen, L., Prentice, A., Eds.; Academic Press: Waltham, MD, USA, 2012; pp. 393–398. ISBN 978-012-384-885-7. [Google Scholar]
- Barr, S.; Hart, K.; Reeves, S.; Sharp, K.; Jeanes, Y.M. Habitual dietary intake, eating pattern and physical activity of women with polycystic ovary syndrome. Eur. J. Clin. Nutr. 2011, 65, 1126. [Google Scholar] [CrossRef] [PubMed]
- Moran, L.J.; Ranasinha, S.; Zoungas, S.; McNaughton, S.A.; Brown, W.J.; Teede, H.J. The contribution of diet, physical activity and sedentary behavior to body mass index in women with and without polycystic ovary syndrome. Hum. Reprod. 2013, 28, 2276–2283. [Google Scholar] [CrossRef] [PubMed]
- Jang, Y.; Lee, J.H.; Kim, O.Y.; Park, H.Y.; Lee, S.Y. Consumption of whole grain and legume powder reduces insulin demand, lipid peroxidation, and plasma homocysteine concentrations in patients with coronary artery disease randomized controlled clinical trial. Arterioscler. Thromb. Vasc. Biol. 2001, 21, 2065–2071. [Google Scholar] [CrossRef] [PubMed]
- Jacobs, D.; Meyer, K.A.; Kushi, L.H.; Folsom, A.R. Whole-grain intake may reduce the risk of ischemic heart disease death in postmenopausal women: The Iowa Women’s Health Study. Am. J. Clin. Nutr. 1998, 68, 248–257. [Google Scholar] [CrossRef] [PubMed]
- Swennen, K.; Courtin, C.M.; Delcour, J.A. Non-digestible oligosaccharides with prebiotic properties. Crit. Rev. Food Sci. Nutr. 2006, 46, 459–471. [Google Scholar] [CrossRef] [PubMed]
- Baudrand, R.; Campino, C.; Carvajal, C.; Olivieri, O.; Guidi, G.; Faccini, G.; Vöhringer, P.; Cerda, J.; Owen, G.; Kalergis, A.; et al. High sodium intake is associated with increased glucocorticoid production, insulin resistance and metabolic syndrome. Clin. Endocrinol. (Oxf.) 2014, 80, 677–684. [Google Scholar] [CrossRef] [PubMed]
- Vedovato, M.; Lepore, G.; Coracina, A.; Dodesini, A.; Jori, E.; Tiengo, A.; Del Prato, S.; Trevisan, R. Effect of sodium intake on blood pressure and albuminuria in Type 2 diabetic patients: The role of insulin resistance. Diabetologia 2004, 47, 300–303. [Google Scholar] [CrossRef] [PubMed]
- Aburto, N.J.; Hanson, S.; Gutierrez, H.; Hooper, L.; Elliott, P.; Cappuccio, F.P. Effect of increased potassium intake on cardiovascular risk factors and disease: Systematic review and meta-analyses. BMJ 2013, 346, f1378. [Google Scholar] [CrossRef] [PubMed]
- Jee, S.H.; Miller, E.R.; Guallar, E.; Singh, V.K.; Appel, L.J.; Klag, M.J. The effect of magnesium supplementation on blood pressure: A meta-analysis of randomized clinical trials. Am. J. Hypertens. 2002, 15, 691–696. [Google Scholar] [CrossRef]
- Altorf-van der Kuil, W.; Engberink, M.F.; Brink, E.J.; van Baak, M.A.; Bakker, S.J.; Navis, G.; van’t Veer, P.; Geleijnse, J.M. Dietary protein and blood pressure: A systematic review. PLoS ONE 2010, 5, e12102. [Google Scholar] [CrossRef] [PubMed]
- Tielemans, S.M.; Altorf-van Der Kuil, W.; Engberink, M.F.; Brink, E.J.; Van Baak, M.A.; Bakker, S.J.; Geleijnse, J.M. Intake of total protein, plant protein and animal protein in relation to blood pressure: A meta-analysis of observational and intervention studies. J. Hum. Hypertens. 2013, 27, 564–571. [Google Scholar] [CrossRef] [PubMed]
- Forman, J.P.; Rimm, E.B.; Stampfer, M.J.; Curhan, G.C. Folate intake and the risk of incident hypertension among US women. JAMA 2005, 293, 320–329. [Google Scholar] [CrossRef] [PubMed]
- Xun, P.; Liu, K.; Loria, C.M.; Bujnowski, D.; Shikany, J.M.; Schreiner, P.J.; Sidney, S.; He, K. Folate intake and incidence of hypertension among American young adults: A 20-y follow-up study. Am. J. Clin. Nutr. 2012, 95, 1023–1030. [Google Scholar] [CrossRef] [PubMed]
- McCann, S.E.; Freudenheim, J.L.; Marshall, J.R.; Brasure, J.R.; Swanson, M.K.; Graham, S. Diet in the epidemiology of endometrial cancer in western New York (United States). Cancer Causes Control 2000, 11, 965–974. [Google Scholar] [CrossRef] [PubMed]
- Xu, W.H.; Shrubsole, M.J.; Xiang, Y.B.; Cai, Q.; Zhao, G.M.; Ruan, Z.X.; Cheng, J.R.; Zheng, W.; Shu, X.O. Dietary folate intake, MTHFR genetic polymorphisms, and the risk of endometrial cancer among Chinese women. Cancer Epidemiol. Biomark. Prev. 2007, 16, 281–287. [Google Scholar] [CrossRef] [PubMed]
- Charalampakis, V.; Tahrani, A.A.; Helmy, A.; Gupta, J.K.; Singhal, R. Polycystic ovary syndrome and endometrial hyperplasia: An overview of the role of bariatric surgery in female fertility. Eur. J. Obstet. Gynecol. Reprod. Biol. 2016, 207, 220–226. [Google Scholar] [CrossRef] [PubMed]
- Otten, J.J.; Hellwig, J.P.; Meyers, L.D. DRI, Dietary Reference Intakes: The Essential Guide to Nutrient Requirements; National Academies Press: Washington, DC, USA, 2006; pp. 1–1344. ISBN 978-030-915-742-1. [Google Scholar]
- Moran, L.J.; Noakes, M.; Clifton, P.M.; Tomlinson, L.; Norman, R.J. Dietary composition in restoring reproductive and metabolic physiology in overweight women with polycystic ovary syndrome. J. Clin. Endocrinol. Metab. 2003, 88, 812–819. [Google Scholar] [CrossRef] [PubMed]
- Legro, R.S. Effects of obesity treatment on female reproduction: Results do not match expectations. Fertil. Steril. 2017, 107, 860–867. [Google Scholar] [CrossRef] [PubMed]
- Marsh, K.A.; Steinbeck, K.S.; Atkinson, F.S.; Petocz, P.; Brand-Miller, J.C. Effect of a low glycemic index compared with a conventional healthy diet on polycystic ovary syndrome. Am. J. Clin. Nutr. 2010, 92, 83–92. [Google Scholar] [CrossRef] [PubMed]
- Barr, S.; Reeves, S.; Sharp, K.; Jeanes, Y.M. An isocaloric low glycemic index diet improves insulin sensitivity in women with polycystic ovary syndrome. J. Acad. Nutr. Diet. 2013, 113, 1523–1531. [Google Scholar] [CrossRef] [PubMed]
- Knowler, W.C.; Barrett-Connor, E.; Fowler, S.E.; Hamman, R.F.; Lachin, J.M.; Walker, E.A.; Nathan, D.M. Reduction in the Incidence of Type 2 Diabetes with Lifestyle Intervention or Metformin. N. Engl. J. Med. 2002, 346, 393–403. [Google Scholar] [CrossRef] [PubMed]
- Orchard, T.J.; Temprosa, M.; Goldberg, R.; Haffner, S.; Ratner, R.; Marcovina, S.; Fowler, S. The effect of metformin and intensive lifestyle intervention on the metabolic syndrome: The Diabetes Prevention Program randomized trial. Ann. Int. Med. 2005, 142, 611–619. [Google Scholar] [CrossRef] [PubMed]
- Hawley, J.A. Exercise as a therapeutic intervention for the prevention and treatment of insulin resistance. Diabetes Metab. Res. Rev. 2004, 20, 383–393. [Google Scholar] [CrossRef] [PubMed]
- Vigorito, C.; Giallauria, F.; Palomba, S.; Cascella, T.; Manguso, F.; Lucci, R.; De Lorenzo, A.; Tafuri, D.; Lombardi, G.; Colao, A.; et al. Beneficial effects of a three-month structured exercise training program on cardiopulmonary functional capacity in young women with polycystic ovary syndrome. J. Clin. Endocrinol. Metab. 2007, 92, 1379–1384. [Google Scholar] [CrossRef] [PubMed]
- Brown, A.J.; Setji, T.L.; Sanders, L.L.; Lowry, K.P.; Otvos, J.D.; Kraus, W.E.; Svetkey, P.L. Effects of exercise on lipoprotein particles in women with polycystic ovary syndrome. Med. Sci. Sports Exerc. 2009, 41, 497–504. [Google Scholar] [CrossRef] [PubMed]
- Greaves, C.J.; Sheppard, K.E.; Abraham, C.; Hardeman, W.; Roden, M.; Evans, P.H.; Schwarz, P.; The IMAGE Study Group. Systematic review of reviews of intervention components associated with increased effectiveness in dietary and physical activity interventions. BMC Public Health 2011, 11, 119. [Google Scholar] [CrossRef] [PubMed]
- Douglas, C.C.; Gower, B.A.; Darnell, B.E.; Ovalle, F.; Oster, R.A.; Azziz, R. Role of diet in the treatment of polycystic ovary syndrome. Fertil. Steril. 2006, 85, 679–688. [Google Scholar] [CrossRef] [PubMed]
- Hoeger, K.M.; Kochman, L.; Wixom, N.; Craig, K.; Miller, R.K.; Guzick, D.S. A randomized, 48-week, placebo-controlled trial of intensive lifestyle modification and/or metformin therapy in overweight women with polycystic ovary syndrome: A pilot study. Fertil. Steril. 2004, 82, 421–429. [Google Scholar] [CrossRef] [PubMed]
- Wu, T.; Gao, X.; Chen, M.; Van Dam, R.M. Long-term effectiveness of diet-plus-exercise interventions vs. diet-only interventions for weight loss: A meta-analysis. Obes. Rev. 2009, 10, 313–323. [Google Scholar] [CrossRef] [PubMed]
- Teede, H.J.; Joham, A.E.; Paul, E.; Moran, L.J.; Loxton, D.; Jolley, D.; Lombard, C. Longitudinal weight gain in women identified with polycystic ovary syndrome: Results of an observational study in young women. Obesity 2013, 21, 1526–1532. [Google Scholar] [CrossRef] [PubMed]
- Domecq, J.P.; Prutsky, G.; Mullan, R.J.; Hazem, A.; Sundaresh, V.; Elamin, M.B.; Phung, O.J.; Wang, A.; Hoeger, K.; Pasquali, R.; et al. Lifestyle modification programs in polycystic ovary syndrome: Systematic review and meta-analysis. J. Clin. Endocrinol. Metab. 2013, 98, 4655–4663. [Google Scholar] [CrossRef] [PubMed]
- Thompson, F.E.; Kirkpatrick, S.I.; Subar, A.F.; Reedy, J.; Schap, T.E.; Wilson, M.M.; Krebs-Smith, S.M. The national cancer institute’s dietary assessment primer: A resource for diet research. J. Acad. Nutr. Diet. 2015, 115, 1986–1995. [Google Scholar] [CrossRef] [PubMed]
- McCarney, R.; Warner, J.; Iliffe, S.; van Haselen, R.; Griffin, M.; Fisher, P. The Hawthorne Effect: A randomised, controlled trial. BMC Med. Res. Methodol. 2007, 7, 30. [Google Scholar] [CrossRef] [PubMed]


| Pulse-Based Diet Group | TLC Diet Group | p Value * | |
|---|---|---|---|
| Age (year) | 27.0 ± 4.6 | 26.9 ± 4.4 | 0.91 |
| Ethnicity (n (%)) | 0.69 | ||
| Caucasian | 35 (74.5) | 36 (75.0) | |
| Asian | 8 (17.0) | 10 (20.8) | |
| Indigenous | 1 (2.1) | 0 | |
| African | 1 (2.1) | 0 | |
| Latin American | 2 (4.3) | 2 (4.2) | |
| Metformin Tx (n (%)) | 18 (38.3) | 20 (41.7) | 0.45 |
| Anthropometrics and body composition measures | |||
| Weight (kg) | 87.4 ± 23.9 | 92.2 ± 24.5 | 0.33 |
| BMI (kg/m2) | 32.5 ± 8.4 | 33.3 ± 9.0 | 0.65 |
| WC (cm) | 102.4 ± 19.8 | 103.5 ± 20.6 | 0.78 |
| Total body fat mass (kg) | 36.1 ± 13.0 | 39.6 ± 16.7 | 0.26 |
| Trunk fat mass (kg) | 16.4 ± 6.4 | 18.4 ± 8.1 | 0.21 |
| Total body fat (%) | 41.3 ± 7.2 | 42.3 ± 8.5 | 0.54 |
| Total body lean mass (kg) | 46.4 ± 7.3 | 48.8 ± 9.5 | 0.18 |
| Physiologic measures | |||
| SBP (mmHg) | 115 ± 8 | 117 ± 11 | 0.33 |
| DBP (mmHg) | 76 ± 7 | 77 ± 9 | 0.81 |
| Pulse rate (beats/min) | 74 ± 14 | 74 ± 14 | 0.82 |
| Total energy intake (kcal/day) | 2165 ± 774 | 2128 ± 720 | 0.82 |
| Leisure physical activity score † (arbitrary units) | 28 ± 25 | 20 ± 19 | 0.08 |
| Family history of DM2 (n (%)) | 34 (77.3) | 32 (76.2) | 0.55 |
| Family history of CVD and/or HTN (n (%)) | 32 (72.7) | 34 (81.0) | 0.26 |
| Insulin sensitivity measures | |||
| FPG (mmol/L) | 5.2 ± 1.4 | 5.3 ± 1.3 | 0.68 |
| Fasting insulin (µIU/mL) | 13.0 ± 10.0 | 15.6 ± 12.2 | 0.25 |
| HbA1c (%) | 5.2 ± 0.4 | 5.3 ± 0.5 | 0.27 |
| HOMA-IR index | 3.0 ± 2.3 | 4.0 ± 4.0 | 0.16 |
| Fasting insulin/glucose ratio | 0.2 ± 0.1 | 0.2 ± 0.1 | 0.55 |
| Lipid profile | |||
| TC (mmol/L) | 4.7 ± 1.0 | 4.5 ± 0.7 | 0.38 |
| TG (mmol/L) | 1.4 ± 0.8 | 1.3 ± 0.7 | 0.81 |
| HDL-C (mmol/L) | 1.3 ± 0.3 | 1.3 ± 0.4 | 0.80 |
| LDL-C (mmol/L) | 2.8 ± 0.9 | 2.6 ± 0.7 | 0.31 |
| TC/HDL-C ratio | 3.8 ± 1.2 | 3.7 ± 1.3 | 0.84 |
| Prevalence of MetS ‡ (n (%)) | 18 (38.3) | 16 (33.3) | 0.67 |
| Presence of hirsutism ⸹ (n (%)) | 32 (68.1) | 35 (72.9) | 0.39 |
| Endocrine parameters | |||
| LH/FSH ratio | 2.2 ± 1.1 | 2.6 ± 1.7 | 0.32 |
| TT (nmol/L) | 1.5 ± 0.5 | 1.7 ± 1.1 | 0.41 |
| SHBG (nmoL/L) | 32.0 ± 18.7 | 36.5 ± 25.8 | 0.60 |
| DHEA-S (µmol/L) | 6.3 ± 2.2 | 5.8 ± 2.2 | 0.29 |
| Prolactin (µg/L) | 12.1 ± 3.6 | 11.8 ± 3.4 | 0.73 |
| TSH (mIU/L) | 2.2 ± 0.9 | 2.3 ± 0.9 | 0.75 |
| 17-OHP (nmol/L) | 2.3 ± 1.2 | 2.1 ± 0.8 | 0.38 |
| hsCRP (mg/L) | 4.0 ± 3.8 | 5.5 ± 6.6 | 0.18 |
| Pulse-Based Diet Group | TLC Diet Group | p Value * | ||||||
|---|---|---|---|---|---|---|---|---|
| Baseline | 16 Weeks | Change | Baseline | 16 Weeks | Change | Time | Group × Time | |
| Anthropometric and body composition measures | ||||||||
| Weight (kg) | 89.9 ± 27.0 | 84.4 ± 26.8 | −5.5 ± 4.5 | 93.3 ± 25.4 | 88.4 ± 23.0 | −4.9 ± 15.8 | <0.01 | 0.62 |
| BMI (kg/m2) | 33.3 ± 9.0 | 32.0 ± 9.0 | −1.3 ± 1.4 | 34.0 ± 9.8 | 32.2 ± 8.6 | −1.8 ± 6.1 | 0.01 | 0.62 |
| WC (cm) | 103.9 ± 19.8 | 99.5 ± 18.0 | −4.4 ± 11.2 | 103.5 ± 20.2 | 101.8 ± 19.3 | −1.7 ± 7.6 | 0.02 | 0.30 |
| Total body fat mass (kg) | 36.3 ± 13.5 | 34.6 ± 13.8 | −1.7 ± 2.4 | 40.5 ± 15.0 | 37.5 ± 15.3 | −3.0 ± 7.5 | <0.01 | 0.41 |
| Trunk fat mass (kg) | 16.0 ± 6.8 | 14.9 ± 6.4 | −1.1 ± 2.0 | 19.3 ± 8.3 | 17.3 ± 8.1 | −2 ± 3.9 | <0.0001 | 0.25 |
| Total body fat (%) | 41.1 ± 7.2 | 40.1 ± 7.8 | −1.0 ± 2.0 | 41.4 ± 8.7 | 40.4 ± 8.5 | −1.0 ± 2.4 | <0.01 | 0.96 |
| Total body lean mass (kg) | 47.5 ± 8.1 | 46.8 ± 8.1 | −0.7 ± 2.2 | 49.5 ± 9.1 | 49.7 ± 9.3 | 0.2 ± 14.1 | 0.22 | 0.09 |
| Physiologic measures | ||||||||
| SBP (mmHg) | 116 ± 7 | 113 ± 10 | −3 ± 8 | 118 ± 10 | 113 ± 10 | −5 ± 8 | <0.001 | 0.45 |
| DBP (mmHg) | 77 ± 7 | 74 ± 8 | −3 ± 7 | 77 ± 9 | 77 ± 10 | 0 ± 7 | 0.03 | 0.05 |
| Pulse rate (beats/min) | 74 ± 14 | 74 ± 14 | 0 ± 10 | 73 ± 12 | 73 ± 14 | 0 ± 12 | 0.89 | 0.89 |
| Insulin sensitivity measures | ||||||||
| FPG (mmol/L) | 5.0 ± 1.5 | 4.6 ± 1.3 | −0.4 ± 1.7 | 5.6 ± 1.4 | 4.8 ± 1.6 | −0.8 ± 1.5 | <0.01 | 0.38 |
| Fasting insulin (µIU/mL) | 14.0 ± 11.4 | 10.0 ± 7.7 | −4.0 ± 9.7 | 15.7 ± 12.4 | 12.7 ± 10.3 | −3.0 ± 6.8 | <0.01 | 0.60 |
| HbA1c (%) | 5.3 ± 0.4 | 5.2 ± 0.4 | −0.1 ± 0.3 | 5.3 ± 0.5 | 5.3 ± 0.4 | 0.0 ± 0.3 | 0.18 | 0.71 |
| HOMA-IR index | 3.1 ± 2.5 | 2.1 ± 1.9 | −1.0 ± 2.1 | 4.2 ± 4.4 | 2.9 ± 3.6 | −1.3 ± 2.1 | <0.001 | 0.66 |
| Fasting insulin/glucose ratio | 0.2 ± 0.1 | 0.1 ± 0.1 | −0.0 ± 0.1 | 0.2 ± 0.1 | 0.1 ± 0.1 | −0.1 ± 0.1 | 0.21 | 0.17 |
| Total insulin AUC (µIU/mL × min) | 326.9 ± 266.5 | 205.9 ± 106.7 | −121.0 ± 229.9 | 307.2 ± 181.7 | 279.8 ± 176.7 | −27.4 ± 110.2 | <0.01 | 0.05 |
| Incremental insulin AUC (µIU/mL × min) | 49.8 ± 45.7 | 32.5 ± 22.4 | −17.3 ± 47.2 | 45.6 ± 26.1 | 41.1 ± 29.3 | −4.5 ± 22.1 | 0.03 | 0.19 |
| Total glucose AUC (mmol/L × min) | 32.3 ± 9.6 | 26.8 ± 5.3 | −5.5 ± 10.4 | 33.7 ± 5.8 | 29.7 ± 7.1 | −4.0 ± 6.3 | <0.01 | 0.77 |
| Incremental glucose AUC (mmol/L × min) | 6.7 ± 1.9 | 6.2 ± 1.4 | −0.5 ± 2.3 | 7.2 ± 1.5 | 6.4 ± 1.5 | −0.8 ± 1.5 | <0.0001 | 0.51 |
| Lipid profile | ||||||||
| TC (mmol/L) | 5.0 ± 1.0 | 4.6 ± 0.8 | −0.4 ± 0.5 | 4.4 ± 0.8 | 4.3 ± 0.8 | −0.1 ± 0.5 | <0.01 | 0.12 |
| TG (mmol/L) | 1.5 ± 0.8 | 1.3 ± 0.7 | −0.2 ± 0.6 | 1.3 ± 0.7 | 1.3 ± 0.8 | 0 ± 0.5 | 0.36 | 0.04 |
| HDL-C (mmol/L) | 1.3 ± 0.3 | 1.4 ± 0.3 | 0.1 ± 0.2 | 1.3 ± 0.4 | 1.2 ± 0.3 | −0.1 ± 0.2 | 0.64 | <0.01 |
| LDL-C (mmol/L) | 2.9 ± 0.4 | 2.7 ± 0.8 | −0.2 ± 0.4 | 2.6 ± 0.7 | 2.5 ± 0.6 | −0.1 ± 0.4 | <0.01 | 0.05 |
| TC/HDL-C | 4.0 ± 1.2 | 3.6 ± 1.1 | −0.4 ± 0.4 | 3.7 ± 1.3 | 3.8 ± 1.3 | 0.1 ± 0.4 | 0.01 | <0.001 |
| hsCRP (mg/L) | 4.2 ± 3.8 | 3.9 ± 4.8 | −0.3 ± 3.4 | 5.0 ± 6.4 | 5.0 ± 8.2 | 0.0 ± 4.2 | 0.78 | 0.72 |
| Pulse-Based Diet Group | TLC Diet Group | p Value * | ||||||
|---|---|---|---|---|---|---|---|---|
| Baseline | 16 Weeks | Change | Baseline | 16 Weeks | Change | Time | Group × Time | |
| Total energy intake (kcal/day) | 2273 ± 724 | 1707 ± 27 | −566 ± 667 | 2211 ± 536 | 1654 ± 406 | −557 ± 696 | <0.0001 | 0.97 |
| Carbohydrate intake (g/day) | 272.3 ± 100.4 | 243.5 ± 64.1 | −28.8 ± 93.4 | 281.5 ± 95.1 | 221.2 ± 71.8 | −60.3 ± 106.8 | <0.01 | 0.30 |
| Fat intake (g/day) | 88.0 ± 42.0 | 56.7 ± 24.8 | −31.3 ± 43.6 | 84.6 ± 27.5 | 55.3 ± 19.8 | −29.3 ± 37.0 | <0.0001 | 0.87 |
| Protein intake (g/day) | 92.0 ± 29.3 | 69.1 ± 15.7 | −22.9 ± 24.9 | 87.3 ± 25.7 | 75.3 ± 25.7 | −12.0 ± 34.6 | <0.001 | 0.24 |
| Dietary fiber (g/day) | 22.8 ± 7.8 | 33.3 ± 8.2 | 10.5 ± 10.2 | 24.5 ± 14.6 | 24.5 ± 9.5 | 0.0 ± 14.4 | <0.01 | <0.01 |
| Soluble fiber (g/day) | 1.2 ± 1.3 | 1.5 ± 1.5 | 0.3 ± 1.3 | 1.3 ± 1.4 | 1.9 ± 1.7 | 0.6 ± 1.5 | 0.04 | 0.45 |
| Cholesterol intake (mg/day) | 357 ± 185 | 128 ± 114 | −229 ± 20.6 | 285 ± 155 | 288 ± 165 | 3 ± 196 | <0.01 | <0.001 |
| Saturated fat (g/day) | 27.9 ± 12.2 | 14.0 ± 5.4 | −13.9 ± 13.1 | 24.7 ± 15.7 | 17.4 ± 9.9 | −7.3 ± 18.8 | <0.0001 | 0.18 |
| Trans fat (g/day) | 1.3 ± 1.9 | 0.4 ± 0.5 | −0.9 ± 2.0 | 0.4 ± 0.4 | 0.3 ± 0.4 | −0.1 ± 0.5 | 0.04 | 0.06 |
| Monounsaturated fat (g/day) | 25.2 ± 14.2 | 19.0 ± 5.9 | −6.2 ± 13.5 | 22.1 ± 12.5 | 16.9 ± 8.4 | −5.2 ± 12.0 | <0.01 | 0.78 |
| Polyunsaturated fat (g/day) | 13.4 ± 12.0 | 9.9 ± 3.3 | −3.5 ± 11.2 | 11.1 ± 6.5 | 8.8 ± 3.3 | −2.3 ± 7.0 | 0.05 | 0.68 |
| Glycemic index † | 55 ± 7 | 39 ± 7 | −16 ± 10 | 54 ± 8 | 50 ± 8 | −4 ± 8 | <0.0001 | <0.01 |
| Glycemic load ‡ | 142 ± 60 | 96 ± 25 | −46 ± 57 | 163 ± 58 | 101 ± 26 | −62 ± 49 | <0.0001 | 0.43 |
| Vitamin B3 (mg/day) | 29 ± 24 | 21 ± 18 | −8 ± 17 | 26 ± 23 | 21 ± 10 | −5 ± 25 | 0.04 | 0.64 |
| Vitamin B5 (mg/day) | 9 ± 14 | 8 ± 9 | −1 ± 7 | 8 ± 12 | 5 ± 5 | −3 ± 8 | 0.05 | 0.47 |
| Folate (µg/day) | 380 ± 205 | 639 ± 266 | 259 ± 287 | 344 ± 260 | 295 ± 159 | −49 ± 271 | 0.02 | 0.001 |
| Vitamin K (µg/day) | 76 ± 41 | 147 ± 83 | 71 ± 85 | 91 ± 122 | 102 ± 107 | 11 ± 80 | <0.01 | 0.02 |
| Copper (µg/day) | 1542 ± 1127 | 2068 ± 918 | 526 ± 960 | 1412 ± 1169 | 1060 ± 439 | −352 ± 1193 | 0.60 | 0.01 |
| Manganese (mg/day) | 3 ± 1 | 5 ± 2 | 2 ± 2 | 3 ± 3 | 3.0 ± 1.1 | −0 ± 3 | 0.03 | 0.001 |
| Magnesium (mg/day) | 284 ± 120 | 357 ± 116 | 73 ± 115 | 279 ± 145 | 271 ± 96 | −8 ± 141 | 0.01 | 0.04 |
| Iron (mg/day) | 17 ± 8 | 19 ± 5 | 2 ± 7 | 22 ± 21 | 13 ± 4 | −9 ± 22 | 0.16 | 0.03 |
| Sodium (g/day) | 3.7 ± 2.2 | 1.7 ± 0.5 | −2.0 ± 2.2 | 3.1 ± 1.6 | 2.4 ± 1.5 | −0.7 ± 2.1 | <0.001 | 0.05 |
| Omega-3 polyunsaturated fatty acids (g/day) | 0.6 ± 0.6 | 0.3 ± 0.5 | −0.3 ± 0.6 | 0.5 ± 0.7 | 0.7 ± 0.9 | 0.2 ± 0.8 | 0.99 | 0.03 |
| Pulse-Based Diet Group | TLC Diet Group | p Value * | ||||||
|---|---|---|---|---|---|---|---|---|
| Baseline | 16 Weeks | Six Months | Baseline | 16-Weeks | Six Months | Time | Group × Time | |
| Anthropometric and body composition measures | ||||||||
| Weight (kg) | 81.6 ± 13.5 | 78.0 ± 12.6 a | 79.6 ± 13.4 b | 95.8 ± 21.1 | 92.0 ± 20.5 a | 94.8 ± 18.1 b | <0.00001 | 0.43 |
| BMI (kg/m2) | 30.4 ± 6.2 | 29.0 ± 5.6 a | 31.2 ± 7.2 b | 35.1 ± 9.1 | 33.9 ± 8.9 a | 34.7 ± 8.8 b | <0.0001 | 0.30 |
| WC (cm) | 98.0 ± 13.7 | 94.6 ± 13.6 a | 94.9 ± 14.2 | 108.2 ± 20.6 | 105.5 ± 17.7 a | 105.5 ± 17.1 | <0.01 | 0.95 |
| Total body fat mass (kg) | 32.3 ± 10.7 | 29.8 ± 10.1 a | 30.3 ± 9.9 a | 42.7 ± 14.3 | 40.3 ± 14.3 a | 41.5 ± 14.9 a | <0.001 | 0.67 |
| Trunk fat mass (kg) | 15.0 ± 5.9 | 14.0 ± 5.7 a | 14.8 ± 5.5 | 20.3 ± 8.3 | 19.1 ± 7.9 a | 18.4 ± 6.7 | 0.01 | 0.39 |
| Total body fat (%) | 38.9 ± 7.8 | 37.3 ± 8.1 a | 37.4 ± 7.6 a | 43.8 ± 8.2 | 42.3 ± 8.0 a | 43.0 ± 8.1 a | 0.001 | 0.52 |
| Total body lean mass (kg) | 46.5 ± 4.4 | 45.7 ± 4.7 | 46.7 ± 4.9 | 51.0 ± 8.4 | 51.1 ± 8.5 | 51.4 ± 8.6 | 0.18 | 0.42 |
| Physiologic measures | ||||||||
| SBP (mmHg) | 115 ± 8 | 112 ± 11 a | 112 ± 9 | 121 ± 10 | 115 ± 9 a | 118 ± 11 | 0.01 | 0.49 |
| DBP (mmHg) | 75 ± 7 | 71 ± 7 a | 74 ± 8 | 81 ± 7 | 81 ± 5 | 77 ± 8 | 0.11 | 0.01 |
| Pulse rate (beats/min) | 73 ± 14 | 70 ± 13.9 | 69 ± 15 | 73 ± 16 | 74 ± 13 | 77 ± 10 | 0.78 | 0.27 |
| Insulin sensitivity measures | ||||||||
| FPG (mmol/L) | 5.3 ± 1.7 | 4.6 ± 1.6 | 4.9 ± 0.2 | 5.5 ± 1.5 | 4.6 ± 1.8 | 5.3 ± 0.9 | 0.08 | 0.86 |
| Fasting insulin (µIU/mL) | 13.5 ± 12.8 | 9.8 ± 8.7 a | 13.3 ± 11.2 b | 14.6.1 ± 3.6 | 10.4 ± 11.9 a | 16.7 ± 9.1 b | <0.01 | 0.83 |
| Lipid profile | ||||||||
| TC (mmol/L) | 4.7 ± 1.1 | 4.4 ± 0.8 a | 4.6 ± 0.8 b | 4.4 ± 0.8 | 4.2 ± 0.8 a | 4.4 ± 0.7 b | <0.01 | 0.90 |
| TG (mmol/L) | 1.4 ± 0.9 | 1.3 ± 0.8 | 1.3 ± 0.7 | 1.2 ± 0.6 | 1.2 ± 0.6 | 1.3 ± 0.6 | 0.68 | 0.86 |
| HDL-C (mmol/L) | 1.2 ± 0.3 | 1.3 ± 0.4 | 1.3 ± 0.4 | 1.3 ± 0.4 | 1.2 ± 0.3 | 1.2 ± 0.2 | 0.98 | 0.02 |
| LDL-C (mmol/L) | 2.8 ± 1.0 | 2.4 ± 0.8 | 2.6 ± 0.8 | 2.5 ± 0.7 | 2.4 ± 0.6 | 2.6 ± 0.5 | <0.01 | 0.35 |
| TC/HDL-C | 4.0 ± 1.5 | 3.6 ± 1.4 a | 3.6 ± 1.2 a | 3.5 ± 0.8 | 3.5 ± 1.0 | 3.6 ± 0.8 | <0.01 | 0.02 |
| hsCRP (mg/L) | 3.2 ± 3.4 | 2.4 ± 2.8 | 2.9 ± 4.1 | 5.2 ± 7.3 | 6.3 ± 10.8 | 5.6 ± 7.4 | 0.99 | 0.22 |
| Pulse-Based Diet Group | TLC Diet Group | p Value * | ||||||
|---|---|---|---|---|---|---|---|---|
| Baseline | 16 Weeks | 12 Months | Baseline | 16 Weeks | 12 Months | Time | Group × Time | |
| Anthropometric and body composition measures | ||||||||
| Weight (kg) | 84.0 ± 14.6 | 78.9 ± 11.7 a | 80.4 ± 14.0 | 96.1 ± 24.6 | 92.8 ± 24.9 a | 95.9 ± 27.4 | 0.01 | 0.53 |
| BMI (kg/m2) | 31.6 ± 6.0 | 30.0 ± 5.5 a | 30.7 ± 6.8 | 35.5 ± 10.9 | 34.5 ± 10.6 a | 35.3 ± 11.2 | 0.02 | 0.74 |
| WC (cm) | 98.7 ± 11.6 | 94.4 ± 9.3 | 93.6 ± 11.4 | 107.6 ± 24.6 | 104.3 ± 20.9 | 105.5 ± 21.7 | 0.13 | 0.66 |
| Total body fat mass (kg) | 32.2 ± 11.1 | 29.4 ± 9.2 a | 29.8 ± 9.9 | 42.1 ± 16.2 | 40.9 ± 16.5 a | 41.3 ± 16.9 | <0.01 | 0.34 |
| Trunk fat mass (kg) | 14.6 ± 5.3 | 13.6 ± 5.3 | 13.5 ± 8.0 | 19.0 ± 9.7 | 18.3 ± 9.4 | 17.8 ± 8.0 | 0.52 | 0.70 |
| Total body fat (%) | 39.4 ± 8.0 | 37.7 ± 7.2 a | 38.2 ± 7.6 | 44.6 ± 8.4 | 43.9 ± 8.0 a | 43.6 ± 7.9 | 0.01 | 0.45 |
| Total body lean mass (kg) | 45.6 ± 3.5 | 45.4 ± 3.9 | 45.2 ± 4.3 | 48.7 ± 10.2 | 48.4 ± 1.0 | 49.4 ± 1.0 | 0.49 | 0.50 |
| Physiologic measures | ||||||||
| SBP (mmHg) | 112 ± 8 | 109 ± 11 a | 114 ± 8 | 121 ± 11 | 112 ± 9 a | 117 ± 11 | 0.02 | 0.17 |
| DBP (mmHg) | 76 ± 6 | 73 ± 7 | 76 ± 8 | 79 ± 8 | 78 ± 6 | 78 ± 6 | 0.12 | 0.64 |
| Pulse rate (beats/min) | 76 ± 16 | 71 ± 13 | 70 ± 10 | 73 ± 17 | 74 ± 14 | 77 ± 18 | 0.85 | 0.50 |
| Insulin sensitivity measures | ||||||||
| FPG (mmol/L) | 5.2 ± 1.1 | 4.3 ± 0.8 a | 4.9 ± 0.6 | 5.5 ± 1.4 | 4.7 ± 1.9 a | 5.3 ± 0.5 | 0.04 | 0.98 |
| Fasting insulin (µIU/mL) | 16.3 ± 15.3 | 11.4 ± 11.2 a | 14.1 ± 9.6 b | 18.0 ± 17.3 | 11.9 ± 12.6 a | 16.5 ± 10.0 b | 0.02 | 0.90 |
| Lipid profile | ||||||||
| TC (mmol/L) | 4.8 ± 1.1 | 4.5 ± 0.9 a | 5.0 ± 1.1 b | 4.8 ± 0.5 | 4.5 ± 0.5 a | 4.7 ± 0.7 b | 0.001 | 0.43 |
| TG (mmol/L) | 1.5 ± 0.8 | 1.2 ± 0.5 | 1.4 ± 0.6 | 1.2 ± 0.6 | 1.2 ± 0.5 | 1.4 ± 0.6 | 0.41 | 0.38 |
| HDL-C (mmol/L) | 1.1 ± 0.2 | 1.3 ± 0.4 a | 1.3 ± 0.3 a | 1.4 ± 0.4 | 1.3 ± 0.2 | 1.4 ± 0.4 | 0.22 | 0.02 |
| LDL-C (mmol/L) | 3.0 ± 1.1 | 2.6 ± 0.8 a | 2.9 ± 1.0 | 2.7 ± 0.5 | 2.6 ± 0.4 a | 2.5 ± 0.7 | 0.02 | 0.15 |
| TC/HDL-C | 4.4 ± 1.3 | 3.8 ± 1.2 a | 3.7 ± 0.9 a | 3.6 ± 0.8 | 3.5 ± 0.7 | 3.6 ± 0.8 | <0.01 | <0.01 |
| hsCRP (mg/L) | 4.5 ± 4.0 | 5.0 ± 7.6 | 5.8 ± 4.4 | 5.9 ± 7.7 | 7.1 ± 11.4 | 8.0 ± 14.4 | 0.48 | 0.95 |
| Pulse-Based Diet Group | TLC Diet Group | p Value * | ||||||
|---|---|---|---|---|---|---|---|---|
| Baseline | 16 Weeks | Six Months | Baseline | 16-Weeks | Six Months | Time | Group × Time | |
| Total energy intake (kcal/day) | 2020 ± 625 | 1634 ± 195 a | 1762 ± 288 | 2213 ± 525 | 1545 ± 297 a | 1687 ± 386 | <0.01 | 0.63 |
| Fat intake (g/day) | 77.9 ± 21.4 | 49.9 ± 7.1 a | 66.8 ± 25.5 | 78.8 ± 27.8 | 58.6 ± 19.1 a | 62.3 ± 8.9 | <0.01 | 0.56 |
| Protein intake (g/day) | 94.3 ± 34.7 | 66.6 ± 10.3 | 88.8 ± 22.7 b | 85.7 ± 26.9 | 71.1 ± 21.7 | 82.5 ± 17.4 b | 0.03 | 0.62 |
| Dietary fiber (g/day) | 24.0 ± 8.0 | 32.3 ± 7.3 a | 18.7 ± 5.0 a, b | 20.3 ± 8.4 | 20.3 ± 7.7 | 21.8 ± 8.0 | <0.01 | <0.01 |
| Soluble fiber (g/day) | 1.0 ± 1.4 | 1.3 ± 1.3 | 1.1 ± 1.0 | 0.9 ± 1.0 | 1.3 ± 1.1 | 0.6 ± 0.7 | 0.06 | 0.45 |
| Glycemic index † | 53 ± 5 | 38 ± 5 a | 55 ± 5 b | 55 ± 5 | 49 ± 6 a | 61 ± 2 b | <0.01 | 0.41 |
| Magnesium (mg/day) | 278 ± 113 | 349 ± 102 | 249 ± 74 | 318 ± 173 | 241 ± 92 | 218 ± 63 | 0.05 | 0.14 |
| Manganese (mg/day) | 3 ± 2 | 5 ± 2 a | 3 ± 1 b | 4 ± 4 | 3 ± 1 | 3 ± 1 | <0.01 | 0.03 |
| Sodium (g/day) | 3.8 ± 2.5 | 1.7 ± 0.6 a | 3.1 ± 1.0 b | 3.0 ± 0.7 | 2.1 ± 1.1 a | 3.0 ± 1.4 b | <0.01 | 0.11 |
| Potassium (mg/day) | 2916 ± 1051 | 3062 ± 874 | 2508 ± 472 | 2517 ± 966 | 1978 ± 647 | 1862 ± 731 | 0.13 | 0.38 |
| Pulse-Based Diet Group | TLC Diet Group | p Value * | ||||||
|---|---|---|---|---|---|---|---|---|
| Baseline | 16 Weeks | 12 Months | Baseline | 16-Weeks | 12 Months | Time | Group × Time | |
| Total energy intake (kcal/day) | 2126 ± 686 | 1583 ± 306 a | 1735 ± 358 | 2205 ± 673 | 1577 ± 361 a | 1749 ± 324 | 0.02 | 0.97 |
| Fat intake (g/day) | 74.5 ± 33.5 | 48.9 ± 7.5 a | 67.5 ± 25.9 | 73.9 ± 31.9 | 44.7 ± 13.6 a | 58.5 ± 20.3 | <0.01 | 0.67 |
| Protein intake (g/day) | 91.1 ± 25.5 | 73.3 ± 15.3 | 87.3 ± 18.5 | 81.8 ± 31.2 | 79.7 ± 27.4 | 82.6 ± 27.9 | 0.13 | 0.09 |
| Dietary fiber (g/day) | 20.8 ± 9.3 | 31.9 ± 7.4 a | 21.8 ± 6.5 b | 19.0 ± 9.4 | 25.0 ± 7.9 a | 20.0 ± 9.0 b | 0.02 | 0.53 |
| Soluble fiber (g/day) | 1.2 ± 1.2 | 1.6 ± 1.9 | 1.6 ± 1.3 | 1.3 ± 1.4 | 1.6 ± 1.4 | 1.0 ± 1.6 | 0.75 | 0.27 |
| Glycemic index † | 54 ± 6 | 38 ± 4 a | 46 ± 8 b | 54 ± 5 | 50 ± 3 a | 56 ± 8 b | <0.01 | 0.29 |
| Magnesium (mg/day) | 262 ± 125 | 349 ± 95 | 259 ± 167 | 243 ± 176 | 307 ± 74 | 242 ± 100 | 0.12 | 0.93 |
| Manganese (mg/day) | 3 ± 2 | 5 ± 1 | 2 ± 1 b | 3 ± 3 | 3 ± 1 | 2 ± 1b | 0.001 | 0.09 |
| Sodium (g/day) | 3.6 ± 2.7 | 1.7 ± 0.3 | 2.5 ± 1.8 | 2.8 ± 1.1 | 2.3 ± 1.1 | 2.5 ± 1.6 | 0.16 | 0.40 |
| Potassium (mg/day) | 2848 ± 1384 | 3021 ± 915 | 1683 ± 1001 b | 2215 ± 1132 | 2383 ± 929 | 1646 ± 942 b | 0.04 | 0.68 |
© 2018 by the authors. Licensee MDPI, Basel, Switzerland. This article is an open access article distributed under the terms and conditions of the Creative Commons Attribution (CC BY) license (http://creativecommons.org/licenses/by/4.0/).
Share and Cite
Kazemi, M.; McBreairty, L.E.; Chizen, D.R.; Pierson, R.A.; Chilibeck, P.D.; Zello, G.A. A Comparison of a Pulse-Based Diet and the Therapeutic Lifestyle Changes Diet in Combination with Exercise and Health Counselling on the Cardio-Metabolic Risk Profile in Women with Polycystic Ovary Syndrome: A Randomized Controlled Trial. Nutrients 2018, 10, 1387. https://doi.org/10.3390/nu10101387
Kazemi M, McBreairty LE, Chizen DR, Pierson RA, Chilibeck PD, Zello GA. A Comparison of a Pulse-Based Diet and the Therapeutic Lifestyle Changes Diet in Combination with Exercise and Health Counselling on the Cardio-Metabolic Risk Profile in Women with Polycystic Ovary Syndrome: A Randomized Controlled Trial. Nutrients. 2018; 10(10):1387. https://doi.org/10.3390/nu10101387
Chicago/Turabian StyleKazemi, Maryam, Laura E. McBreairty, Donna R. Chizen, Roger A. Pierson, Philip D. Chilibeck, and Gordon A. Zello. 2018. "A Comparison of a Pulse-Based Diet and the Therapeutic Lifestyle Changes Diet in Combination with Exercise and Health Counselling on the Cardio-Metabolic Risk Profile in Women with Polycystic Ovary Syndrome: A Randomized Controlled Trial" Nutrients 10, no. 10: 1387. https://doi.org/10.3390/nu10101387
APA StyleKazemi, M., McBreairty, L. E., Chizen, D. R., Pierson, R. A., Chilibeck, P. D., & Zello, G. A. (2018). A Comparison of a Pulse-Based Diet and the Therapeutic Lifestyle Changes Diet in Combination with Exercise and Health Counselling on the Cardio-Metabolic Risk Profile in Women with Polycystic Ovary Syndrome: A Randomized Controlled Trial. Nutrients, 10(10), 1387. https://doi.org/10.3390/nu10101387