Abstract
Sugar, particularly as free sugars or sugar-sweetened beverages, significantly contributes to total energy intake, and, possibly, to increased body weight. Excessive consumption may be considered as a proxy of poor diet quality. However, no previous studies evaluated the association between the habit of adding sugars to “healthy” foods, such as plain milk and fresh fruit, and indicators of adiposity and/or dietary quality in children. To answer to these research questions, we Panalysed the European cohort of children participating in the IDEFICS study. Anthropometric variables, frequency of consumption of sugars added to milk and fruit (SAMF), and scores of adherence to healthy dietary pattern (HDAS) were assessed at baseline in 9829 children stratified according to age and sex. From this cohort, 6929 children were investigated again after two years follow-up. At baseline, a direct association between SAMF categories and adiposity indexes was observed only in children aged 6–<10 years, while the lower frequency of SAMF consumption was significantly associated with a higher HDAS. At the two year follow-up, children with higher baseline SAMF consumption showed significantly higher increases in all the anthropometric variables measured, with the exception of girls 6–<10 years old. The inverse association between SAMF categories and HDAS was still present at the two years follow-up in all age and sex groups. Our results suggest that the habit to adding sugars to foods that are commonly perceived as healthy may impact the adherence to healthy dietary guidelines and increase in adiposity risk as well.
Keywords:
added sugars; milk; fruit; children; obesity; cohort study; healthy diet score; dietary pattern 1. Introduction
The childhood obesity pandemic being currently observed in most developed and developing countries urges the identification of effective strategies for its prevention and treatment [1]. One key modifiable factor for obesity prevention is energy intake, and its reduction could be achieved through nutritional and behavioural interventions [1]. Sugar, particularly as free sugar or sugar-sweetened beverages (SSB), significantly contributes to total energy intake, and, possibly, to increased body weight [2]. Excessive sugars consumption may be also considered as a proxy of poor diet quality [3,4].
During the last decades, the prevalence of overweight/obesity increased, along with the consumption of sugars, suggesting an association between sugar consumption and obesity [5], although the causal importance of this association has been questioned [6]. A trend toward decreasing sugar consumption has been observed worldwide [7], and recently confirmed for adolescents and young adults [8]. However, recent data on the European children participating to the Identification and Prevention of Dietary-and Lifestyle-Induced Health Effects in Children and Infants (IDEFICS) study indicate that the mean total intake is still high [9], particularly in the light of the WHO Guidelines for sugars intake released in 2015 [3]. The evidence about sugar intake in European countries has been recently reviewed by Azaïs-Braesco et al. [10], confirming the high intake of total and added sugars in Europe, especially in children, and identifying sweet products and beverages as the major contributors to added sugar intakes. Of note, the authors highlighted the many limitations in the interpretation of the available data, which is mainly due to important items, such as dietary data collection, food composition tables, or estimation of added sugars [10], not considering the varying definition of sugars used in different context [11].
Actually, international bodies generally agree on the term “sugars” to cover monosaccharides and disaccharides present in or added to foods, although some differences exist regarding the terms “added sugars” or “free sugars” [3,12,13].
Dietary guidances, differentiating free sugars from sugars that are naturally contained in foods, such as fruit and milk, recommend to reduce the intake of free sugars, replacing their energy contribution with starches, sugars contained within the cellular structure of foods and in milk and milk products [13]. As a matter of fact, daily consumption of non-fat (skim) or low-fat milk and dairy products, and fruit is widely recognized as part of the healthy diet for children and adolescents [14].
However, the effectiveness of the recommendations to increase the consumption of these “healthy” foods may be reduced if sugars are added to them, as often happens, particularly during childhood. The innate desire and preference of children for sweet foods [15] may indeed lead the parents or caregivers to add sugar to milk and fruit to favour the consumption of such foods, perceived as “healthy”, underestimating the caloric burden that is associated with these added sugars [16].
Various foods and food components have been considered to play a positive or negative role in the development of obesity in childhood and adolescence. However, it is plausible that, with the exception of SSB, whose association with obesity has been consistently reported [17], overall dietary patterns may better explain obesity risk than individual food components [18].
Of note, consumption of SSB appears to be associated to, and may be even considered, a proxy of an overall unhealthy dietary pattern [19,20].
As a consequence, the evaluation of added sugar intake was focused particularly on SSB, along with sweet snacks as major sources, overlooking the possible effect of the consumption of “healthy” foods to whom sugar is added. Several studies investigated the association of the consumption of ready-to-drink flavoured milk beverages with energy intake and obesity, as recently reviewed by Fayet-Moore [21] and Patel et al. [22]. To our knowledge, there are no previous studies evaluating the association between the habit of adding sugars to “healthy” foods, such as plain milk and fresh fruit, and indicators of adiposity and/or dietary quality.
Therefore, the novel research question of this study is to investigate in the large European cohort of children participating to the IDEFICS survey, both cross-sectionally and prospectively, whether the habit to add sugar to milk and/or fruit (sugars added to milk and/or fruit, SAMF) is associated to adiposity indexes and/or to the quality of the diet, as assessed by a healthy diet score (Healthy Dietary Adherence Score, HDAS) [23].
2. Subjects and Methods
2.1. Study Population
The IDEFICS study (Identification and prevention of dietary-and lifestyle-induced health effects in children and infants), registration number ISRCTN62310987, investigated the aetiology of diet- and lifestyle-related diseases and disorders with a strong focus on overweight and obesity in a large population-based cohort of 16,228 children aged 2–<10 years, who were recruited through schools and kindergartens in eight European countries (Belgium, Cyprus, Estonia, Germany, Hungary, Italy, Spain, and Sweden). Since the IDEFICS study included an intervention program, in each country two comparable areas (intervention and control region) were selected [24]. Details of the general design, instruments, and survey characteristics can be found elsewhere [25]. The baseline examination was carried out from September 2007 to May 2008 and the follow-up examination two years later, between September 2009 and May 2010.
From the full survey sample of 16,228 children, a total of 11,491 children (70.8% of the sample), was eligible for the cross-sectional analysis, after the exclusion of participants (n = 4737) for whom specific variables were missing (food frequency questionnaire and physical activity of the child, family income). Further 1662 children were excluded due to not reported consumption of milk and/or fruit. The final analysis was conducted on 9829 children that were stratified according to their age at baseline and sex (2–<6 years: boys 2368, girls 2228; 6–<10 years: boys 2579, girls 2654). Excluded children were not different from those that were included in the analysis with regard to the variables of interest (data not shown). Two years after baseline, the children participated in the follow-up examination, and all the examinations were repeated with comparable procedures. For the prospective analysis, a total of 6929 children were examined a second time two years later, during the follow-up survey. The participants flow chart is reported in Figure 1.
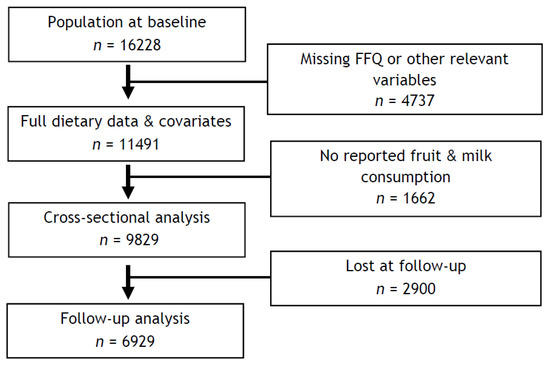
Figure 1.
Participant flow chart.
The study was conducted according to the standards of the Declaration of Helsinki and approved by local Ethics Committees of each participating centre (1. Belgium: Ethics Committee of the Gent University Hospital, 15/10/2007, ref: No. EC UZG 2007/243 and 19/02/2013, No. B670201316342. 2. Cyprus: Cyprus National Bioethics Committee, 12/07/2007, ref: No. EEBK/EM/2007/16 and 21/Feb/2013, No. EEBK/ETI/2012/33. 3. Estonia: Tallinn Medical Research Ethics Committee (TMREC), 14/06/2007, ref: No. 1093 and 17/January 2013, No. 128. 4. Germany: Ethic Commission of the University of Bremen, 16/01/2007 and 11/12/2012. 5. Hungary: Medical Research Council, 21/Jun/2007, ref: 22-156/2007-1018EKU and 18/12/2012, 4536/2013/EKU. 6. Italy: Ethics Committee of the Local Health Authority (ASL) in Avellino, 19/06/2007, ref: No. 2/CE and 18/Sep/2012, No. 12/12. 7. Spain: Ethics Committee for Clinical Research of Aragon (CEICA), 20/06/2007, ref: No. PI07/13 and 13/Feb/2013, No. PI13/0012. 8. Sweden: Regional Ethics Research Board in Gothenburg, 30/07/2007, ref: No. 264-07 and 10/Jan/2013, No. 927-12). Parents were asked to sign a written informed consent, whereas children provided their oral assent.
2.2. Physical Examination
The examination programme included standard anthropometric measures, blood pressure measurements and blood samples collection. We describe below the measurements that were considered in the present analysis. Body weight, height, waist circumference, and skinfold thickness were measured. A detailed description of the anthropometric measurements in the IDEFICS study, including intra- and inter-observer reliability, has been published by Stomfai et al. [26]. Weight was determined to the nearest 0.1 kg using an electronic scale (Tanita BC 420 SMA, Tanita Europe GmbH, Sindelfingen, Germany) with children that were wearing only light clothes without shoes. Height was measured while using a calibrated stadiometer instrument (Seca 225, Seca GmbH & Co., KG., Hamburg, Germany) with approximation of 0.1 cm. BMI was calculated as weight (in kg) divided by height squared (in m2). Sex- and age-specific BMI z-scores were calculated based on Cole & Lobstein [27].
Waist circumference (WC) was measured while using an inelastic tape (Seca 200, Seca GmbH & Co., KG., Hamburg, Germany), range 0 ± 150 cm, at the midpoint between the iliac crest and the lower border of tenth rib with the subject in a standing position with arms being relaxed on the sides and recorded at the nearest 0.1 cm. Skinfold thickness (mm) was measured twice on the right side of the body to the nearest 0.2 mm with a skinfold calliper (Holtain, range 0–40 mm, Holtain Ltd., Pembrokeshire, UK), as described in Nagy et al. [28]. The sum of subscapular (mm) and triceps (mm) skinfold thickness was used for the calculation of body fat mass (BFM), according to Slaughter [29].
2.3. Parental Questionnaire
Parents were asked to fill in the questionnaire for their children (date of birth, physical activity and lifestyle factors, and personal and familial medical history) and for themselves (age, self-reported weight and height, educational level, and occupation and family income). Income levels were grouped into four categories (low, medium, medium-high, high). As for physical activity, parents were invited to indicate how many minutes per day their children used to spend in outdoor activities (i.e., time spent playing in the yard or outdoor recreation area as swimming pool, zoo, and/or park) both on weekdays and weekend days. An additional question investigated whether or not the child would have attended a club or sport association to exercise.
2.4. Dietary Assessment
The food frequency consumption was evaluated by means of a specific section of the Children’s Eating Habits Questionnaire (CEHQ-FFQ), a reproducible screening instrument [30,31,32,33]. A pilot study found the CEHQ-FFQ to be reproducible with mean Kappa coefficients ranging from 0.41 to 0.60 and Spearman’s correlation higher than 0.5% for 81% of the food items [30]. Further, a validation study against repeated 24-h dietary recall found that under 12% of the food groups were classified in the wrong quartile of intake [32]. The validity and reliability of the IDEFICS CEHQ-FFQ with regard to the frequencies of milk consumption were further confirmed by a urinary biomarker-based analysis on the IDEFICS population [31].
CEHQ-FFQ asked for the consumption frequency of 43 pan-European food items of 14 food groups, which were designed to identify specific dietary patterns shown to be related to overweight or obesity in children. The sequence of food items queried for each food group was planned to avoid confusion and to minimise the risk of double reporting for the same food. CEHQ-FFQ was developed in English and then translated into local language with the aim to obtain comparable data on eating behaviour across all the participating centres. Parents were asked to complete the food questionnaire answering how many times their child had consumed food and drink they knew about, thus in their presence or outside the school canteen or childcare meal provision setting, referring to a typical week of the previous month. Frequencies of consumption were classified into eight categories: “never/less than once a week”, “1–3 times per week”, “4–6 times per week”, “once per day”, “twice per day”, “three times per day”, “four or more times per day”, and “I have no idea”.
The habit of adding sugar to milk and fruit was evaluated selecting the item “Sweetened milk (e.g., addition of sugar, chocolate powder, honey, etc.)” and the item “Fresh fruits (also as freshly squeezed, fruit smoothie) with added sugar” of the CEHQ-FFQ. These two items were combined into a new variable named “added sugars”. Combined frequencies of consumption of sugars added to milk and/or fruit (SAMF) were differentiated into three categories: “rarely” (that contains the category “never/less than once a week”), “weekly” (when the consumption is less than one time per day) and “daily” (when the added sugar consumption is once or more times per day). Fruit and milk consumption was calculated by summing all the items in CEHQ-FFQ regarding these foods: “Plain unsweetened milk”, “Sweetened milk (e.g., addition of sugar, chocolate powder, honey, etc.)”, “Fresh fruits (also freshly squeezed, fruit smoothie) without added sugar”, “Fresh fruits (also freshly squeezed, fruit smoothie) with added sugar”.
To assess children´s diet quality, a Healthy Dietary Adherence Score (HDAS) was calculated from CEHQ-FFQ as a measure of the degree to which children’s dietary intake follows nutrition guidelines [23]. The HDAS was developed according to the principles reviewed by Waijers et al. [34]. Briefly, healthy dietary recommendations include: limit the intake of refined sugars, reduce fat intake, especially of saturated fat, choose whole meal when possible, consume 400–500 g of fruits and vegetables per day and fish 2–3 times per week. Hence, the HDAS contains five components: sugar, fat, whole meal, fruits and vegetables, and fish. Each component has a minimum score of 0 and a maximum score of 10, summed to a maximum score of 50, where the highest score indicates the highest possible adherence to the dietary guidelines. A more detailed description of the HDAS can be found in Ardvisson et al. [23].
2.5. Statistical Analysis
All of the analyses were performed separately in boys and girls and stratified by baseline age groups (2–<6 years, ≥6–<10 years). Data were expressed as mean and standard deviation (SD) or 95% confidence intervals (95% CI), as indicated in the tables. The cross-sectional analysis of the categories of SAMF with anthropometric variables and HDAS was performed using analysis of co-variance (GLM, General Linear Model). The models were adjusted by age, country, family income, physical activity, and fruit and milk consumption of the child (obtained by the sum of the frequency of consumption of unsweetened and sweetened milk and fruit). p values for linear trend were calculated. Longitudinal analyses were performed using the two years variation in the adiposity variables (follow-up value minus baseline value) and HDAS at follow-up across the baseline categories of SAMF. Models were adjusted by the respective baseline value of the outcome variable of interest and by age, country, family income, physical activity, intervention/control study group, and fruit and milk consumption of the child (obtained by the sum of the frequency of consumption of unsweetened and sweetened milk and fruit). p values for linear trend were calculated. A two-tailed p value less than 0.05 was considered as statistically significant. Statistical analyses were performed while using IBM SPSS Statistics (Version 23.0. IBM Corp., Armonk, NY, USA)
3. Results
The characteristics of the population at baseline, and at the end of the two-years follow-up are reported in Table 1.

Table 1.
Characteristics of the population at baseline and at the two-years follow-up.
3.1. Cross-Sectional Analysis
Mean adiposity measures and the HDAS stratified by baseline categories of SAMF, after adjustment for covariates, are presented in Table 2.
Table 2.
Anthropometric variables and Healthy Dietary Adherence Score (HDAS) at baseline across sugars added to milk and/or fruit (SAMF) categories
At multiple regression analysis, in younger boys and girls, no association was evident between SAMF and adiposity indexes, while SAMF consumption was significantly and inversely associated with HDAS, in both boys and girls of all age groups. In older boys and girls, a positive association was observed between SAMF categories and adiposity indexes, with increasing BMI z-score values, sum of skinfolds, and percentage of body fat across SAMF categories.
3.2. Prospective Analysis
Table 3 reports the changes in anthropometric variables in boys and girls over the two years follow-up across the SAMF categories defined at baseline.
Table 3.
Changes in anthropometric variables and HDAS over the two-year follow-up across the SAMF defined at baseline.
Younger children with higher baseline SAMF consumption showed significantly higher increases in all the anthropometric variables measured. In older children, some differences between boys and girls became apparent. While, in boys, all anthropometric parameters were positively associated with SAMF consumption, in girls only a positive association with WC z-score was observed. The significant association between SAMF categories and HDAS was still present at the two years follow-up in all age and sex groups.
4. Discussion
A consistent body of evidence recognized the contribution of added sugars to poor quality, energy dense diet, and, possibly, to the development of conditions such as obesity and increased cardiometabolic risk in children and adolescents [35]. In 2015, the WHO released a strong recommendation to reduce the intake of free sugars to less than 10% of total energy intake in both adults and children, and a conditional recommendation to further reduce their intake to less than 5% of total energy intake [3]. Although the terminology that is used to describe dietary sugars is still under debate [11] and its discussion is beyond the scope of this paper, there is general agreement that naturally occurring sugars in dairy foods and in intact (fresh, cooked, or dried) fruit and vegetables are excluded by the common definition of added sugar, and might have different impact on health outcomes [11,36]. Actually, milk (particularly low-fat milk) and fruit are considered to be foods with a favourable nutrient profile and are consistently recognized as part of the healthy diet for children and adolescents [14]. However, to the best of our knowledge, the impact of adding sugars to these healthy foods on health outcomes, such as adiposity indexes, or on the adherence to healthy dietary guidelines, was not yet investigated.
Cross-sectional analyses revealed that the higher frequency of SAMF consumption was significantly associated with higher adiposity indexes in boys and girls in the age range 6–10 years. When examining the younger children group (2–<6 years), no evidence of such an association was observed. Since this is the first observation of the impact of SAMF on adiposity indexes, we do not have a plausible explanation for the discrepancy observed in younger and older children with regard to this association. However, based on the large body of evidence showing that the liking for sweet taste is innate, and that children show higher levels of sweet preferences than adults [37], we can speculate that, during the first years of life, the appetite for sweet may be a protective mechanism that is driven by the child’s need for calories during growth [38,39]. Thus, the higher sugar intake during early development did not show negative effects than compared to later in the life. However, further studies are needed to explore whether there is an age-related modulation of the association between SAMF consumption and adiposity in children.
Interestingly, a significant and linear inverse association was observed between SAMF and our score of adherence to healthy dietary guidelines, indicating that the adoption of a habit to add sugars to healthy foods can be a trigger for longer term inflation of dietary quality. Our longitudinal analyses showed that a higher frequency of SAMF consumption at baseline predicted a higher increase of all anthropometric indexes over the two-years follow up in all children groups with the exception of older girls, in which only a positive trend for waist circumference was observed. The observation that HDAS was inversely associated with the categories of SAMF consumption consistently remained even after follow-up. In summary, our results suggest that the habit of adding sugars to milk and fruit may have a not negligible impact on adiposity indexes, and on adherence to healthy dietary guidelines. Our results are in agreement with the conclusion of the recent systematic review by Patel et al. [22], suggesting that while the consumption of flavoured milk might promote overall milk intake, its potential adverse effects on caloric intake and possibly obesity for children and adolescents need further investigation.
Strenghts & Limitations
Our study has several strengths. First, this is, to our knowledge, the first study that examined the association between the frequency of consumption of SAMF and adiposity measures in children. Our findings add to the current literature in that we were able to examine the association between SAMF and adherence to healthy dietary guidelines. We used the a priori diet score, HDAS, as calculated from the FFQ used in the IDEFICS survey [23], as an indicator of the overall quality of the diet. Of note, the HDAS was based on healthy dietary guidelines common for the eight European countries that were included in the IDEFICS study, hence substantial evidence of beneficial health effects are underlying the foods and beverages included [23]. Other important strengths of the study are its multicentric nature, the large sample size, and the longitudinal design. We used standardized phenotypic measurements within the eight European countries participating in the survey. All of the measurements were conducted according to detailed standard operation procedures. In addition, subsamples of study subjects were repeatedly examined to calculate the inter- and intra-observer reliability of anthropometric measurements [26].
Despite the many strengths, there are also limitations. The present analysis, based on the CEHQ-FFQ, does not allow for a quantitative estimate of intakes, thus incurring in possible over- or under-estimation biases. However, this instrument has been found to be reproducible [30,31,32]. To account for the putative protective effect of milk and fruit consumption on adiposity [40,41], which might have confounded the observed associations, all of the analyses were adjusted for the frequency of consumption of milk and fruit at baseline.
5. Conclusions
Given the innate preference of children for sweet [37], it is conceivable that parents might be inclined to make milk and fruit sweeter by adding variable amount of sugar to these foods to favour their consumption, considered as healthy according to dietary recommendations. Although there is some evidence in favour of the addition of small amounts of sugar to encourage the intake of nutrients-rich foods, such as fruit and milk [42], our results suggest that leaving to discretionary parenting practices the use (or abuse) of adding sugars to increase the acceptability of such foods may, in the longer run, be counterproductive and result in deviations from the adherence to healthy dietary guidelines, and hence also an increase in adiposity risk.
Author Contributions
A.S., P.R. designed the research; M.D.R. conducted the research; G.E., A.H., V.P.: developed dietary instruments; M.D.R., P.R., A.S.: analyzed data and performed statistical analysis; M.D.R., A.S., P.R.: wrote the paper. All the authors collected and provided data necessary for research in this multicenter study and reviewed and edited the paper.
Funding
The IDEFICS Study (www.idefics.eu) was financially supported by the European Commission within the Sixth RTD Framework Programme Contract No. 016181 (FOOD).
Acknowledgments
The authors wish to thank the IDEFICS children and their parents for participating in the survey.
Conflicts of Interest
The authors declare no conflict of interest.
References
- Lobstein, T.; Jackson-Leach, R.; Moodie, M.L.; Hall, K.D.; Gortmaker, S.L.; Swinburn, B.A.; James, W.P.; Wang, Y.; McPherson, K. Child and adolescent obesity: Part of a bigger picture. Lancet 2015, 385, 2510–2520. [Google Scholar] [CrossRef]
- Te Morenga, L.; Mallard, S.; Mann, J. Dietary sugars and body weight: Systematic review and meta-analyses of randomised controlled trials and cohort studies. BMJ 2012, 346, e7492. [Google Scholar] [CrossRef] [PubMed]
- World Health Organization (WHO). Guideline: Sugars Intake for Adults and Children; WHO: Geneva, Switzerland, 2015. [Google Scholar]
- World Health Organization (WHO). Information Note about Intake of Sugars Recommended in the WHO Guideline for Adults and Children; WHO: Geneva, Switzerland, 2015. [Google Scholar]
- Bray, G.A.; Popkin, B.M. Dietary sugar and body weight: Have we reached a crisis in the epidemic of obesity and diabetes? Health be damned! Pour on the sugar. Diabetes Care 2014, 37, 950–956. [Google Scholar] [CrossRef] [PubMed]
- Kahn, R.; Sievenpiper, J.L. Dietary sugar and body weight: Have we reached a crisis in the epidemic of obesity and diabetes? we have, but the pox on sugar is overwrought and overworked. Diabetes Care 2014, 37, 957–962. [Google Scholar] [CrossRef] [PubMed]
- Wittekind, A.; Walton, J. Worldwide trends in dietary sugars intake. Nutr. Res. Rev. 2014, 27, 330–345. [Google Scholar] [CrossRef] [PubMed]
- Winpenny, E.M.; Penney, T.L.; Corder, K.; White, M.; van Sluijs, E.M.F. Changes in consumption of added sugars from age 13 to 30 years: A systematic review and meta-analysis of longitudinal studies. Obes. Rev. 2017, 18, 1336–1349. [Google Scholar] [CrossRef] [PubMed]
- Svensson, A.; Larsson, C.; Eiben, G.; Lanfer, A.; Pala, V.; Hebestreit, A.; Huybrechts, I.; Fernández-Alvira, J.M.; Russo, P.; IDEFICS Consortium. European children’s sugar intake on weekdays versus weekends: The IDEFICS study. Eur. J. Clin. Nutr. 2014, 68, 822–828. [Google Scholar] [CrossRef] [PubMed]
- Azaïs-Braesco, V.; Sluik, D.; Maillot, M.; Kok, F.; Moreno, L.A. A review of total & added sugar intakes and dietary sources in Europe. Nutr. J. 2017, 16, 6. [Google Scholar] [CrossRef] [PubMed]
- Mela, D.J.; Woolner, E.M. Perspective: Total, Added, or Free? What Kind of Sugars Should We Be Talking About? Adv. Nutr. 2018, 9, 63–69. [Google Scholar] [CrossRef] [PubMed]
- EFSA Panel on Dietetic Products, Nutrition, and Allergies (NDA). Scientific Opinion on Dietary Reference Values for carbohydrates and dietary fibre. EFSA J. 2010, 8, 1462. [Google Scholar] [CrossRef]
- Scientific Advisory Committee on Nutrition. Carbohydrates and Health; TSO: London, UK, 2015. [Google Scholar]
- Gidding, S.S.; Dennison, B.A.; Birch, L.L.; Daniels, S.R.; Gillman, M.W.; Lichtenstein, A.H.; Rattay, K.T.; Steinberger, J.; American Heart Association; American Academy of Pediatrics. Dietary recommendations for children and adolescents: A guide for practitioners: Consensus statement from the American Heart Association. Circulation 2005, 112, 2061–2075. [Google Scholar] [CrossRef] [PubMed]
- Ventura, A.K.; Mennella, J.A. Innate and learned preferences for sweet taste during childhood. Curr. Opin. Clin. Nutr. Metab. Care 2011, 14, 379–384. [Google Scholar] [CrossRef] [PubMed]
- Sütterlin, B.; Siegrist, M. Simply adding the word “fruit” makes sugar healthier: The misleading effect of symbolic information on the perceived healthiness of food. Appetite 2015, 95, 252–261. [Google Scholar] [CrossRef] [PubMed]
- Hu, F.B. Resolved: There is sufficient scientific evidence that decreasing sugar-sweetened beverage consumption will reduce the prevalence of obesity and obesity-related diseases. Obes. Rev. 2013, 14, 606–619. [Google Scholar] [CrossRef] [PubMed]
- Ambrosini, G.L. Childhood dietary patterns and later obesity: A review of the evidence. Proc. Nutr. Soc. 2014, 73, 137–146. [Google Scholar] [CrossRef] [PubMed]
- Vartanian, L.R.; Schwartz, M.B.; Brownell, K.D. Effects of soft drink consumption on nutrition and health: A systematic review and meta-analysis. Am. J. Public Health 2007, 97, 667–675. [Google Scholar] [CrossRef] [PubMed]
- Hebestreit, A.; Intemann, T.; Siani, A.; De Henauw, S.; Eiben, G.; Kourides, Y.A.; Kovacs, E.; Moreno, L.A.; Veidebaum, T.; IDEFICS Consortium. Dietary Patterns of European Children and Their Parents in Association with Family Food Environment: Results from the I. Family Study. Nutrients 2017, 9, 126. [Google Scholar] [CrossRef] [PubMed]
- Fayet-Moore, F. Effect of flavored milk vs plain milk on total milk intake and nutrient provision in children. Nutr. Rev. 2016, 74, 1–17. [Google Scholar] [CrossRef] [PubMed]
- Patel, A.I.; Moghadam, S.D.; Freedman, M.; Hazari, A.; Fang, M.L.; Allen, I.E. The association of flavored milk consumption with milk and energy intake, and obesity: A systematic review. Prev. Med. 2018, 111, 151–162. [Google Scholar] [CrossRef] [PubMed]
- Arvidsson, L.; Eiben, G.; Hunsberger, M.; De Bourdeaudhuij, I.; Molnar, D.; Jilani, H.; Thumann, B.; Veidebaum, T.; Russo, P.; IDEFICS Consortium. Bidirectional associations between psychosocial well-being and adherence to healthy dietary guidelines in European children: Prospective findings from the IDEFICS study. BMC Public Health 2017, 17, 926. [Google Scholar] [CrossRef] [PubMed]
- De Henauw, S.; Verbestel, V.; Mårild, S.; Barba, G.; Bammann, K.; Eiben, G.; Hebestreit, A.; Iacoviello, L.; Gallois, K.; IDEFICS Consortium. The IDEFICS community-oriented intervention programme: A new model for childhood obesity prevention in Europe? Int. J. Obes. (Lond.) 2011, 35, S16–S23. [Google Scholar] [CrossRef] [PubMed]
- Ahrens, W.; Bammann, K.; Siani, A.; Buchecker, K.; De Henauw, S.; Iacoviello, L.; Hebestreit, A.; Krogh, V.; Lissner, L.; IDEFICS Consortium. The IDEFICS cohort: Design, characteristics and participation in the baseline survey. Int. J. Obes. (Lond.) 2011, 35, S3–S15. [Google Scholar] [CrossRef] [PubMed]
- Stomfai, S.; Ahrens, W.; Bammann, K.; Kovács, E.; Mårild, S.; Michels, N.; Moreno, L.A.; Pohlabeln, H.; Siani, A.; IDEFICS Consortium. Intra- and inter-observer reliability in anthropometric measurements in children. Int. J. Obes. (Lond.) 2011, 35, S45–S51. [Google Scholar] [CrossRef] [PubMed]
- Cole, T.J.; Lobstein, T. Extended international (IOTF) body mass index cut-offs for thinness, overweight and obesity. Pediatr. Obes. 2012, 7, 284–894. [Google Scholar] [CrossRef] [PubMed]
- Nagy, P.; Kovacs, E.; Moreno, L.A.; Veidebaum, T.; Tornaritis, M.; Kourides, Y.; Siani, A.; Lauria, F.; Sioen, I.; IDEFICS Consortium. Percentile reference values for anthropometric body composition indexes in European children from the IDEFICS study. Int. J. Obes. (Lond.) 2014, 38, S15–S25. [Google Scholar] [CrossRef] [PubMed]
- Slaughter, M.H.; Lohman, T.G.; Boileau, R.A.; Horswill, C.A.; Stillman, R.J.; van Loan, M.D.; Bemben, D.A. Skinfold equations for estimation of body fatness in children and youths. Hum. Biol. 1988, 60, 709–723. [Google Scholar] [PubMed]
- Lanfer, A.; Hebestreit, A.; Ahrens, W.; Krogh, V.; Sieri, S.; Lissner, L.; Eiben, G.; Siani, A.; Huybrechts, I.; IDEFICS Consortium. Reproducibility of food consumption frequencies derived from the Children’s Eating Habits Questionnaire used in the IDEFICS study. Int. J. Obes. (Lond.) 2011, 35, S61–S68. [Google Scholar] [CrossRef] [PubMed]
- Huybrechts, I.; Börnhorst, C.; Pala, V.; Moreno, L.A.; Barba, G.; Lissner, L.; Fraterman, A.; Veidebaum, T.; Hebestreit, A.; IDEFICS Consortium. Evaluation of the Children’s Eating Habits Questionnaire used in the IDEFICS study by relating urinary calcium and potassium to milk consumption frequencies among European children. Int. J. Obes. (Lond.) 2011, 35. [Google Scholar] [CrossRef] [PubMed]
- Bel-Serrat, S.; Mouratidou, T.; Pala, V.; Huybrechts, I.; Börnhorst, C.; Fernández-Alvira, J.M.; Hadjigeorgiou, C.; Eiben, G.; Hebestreit, A.; Lissner, L.; et al. Relative validity of the Children’s Eating Habits Questionnaire-food frequency section among young European children: The IDEFICS Study. Public Health Nutr. 2014, 17, 266–276. [Google Scholar] [CrossRef] [PubMed]
- Pala, V.; Reisch, L.A.; Lissner, L.; on Behalf of the IDEFICS and I.Family Consortia. Dietary behaviour in children, adolescents and families: The Eating Habits Questionnaire (EHQ). In Instruments for Health Surveys in Children and Adolescents; Bammann, K., Lissner, L., Pigeot, I., Ahrens, W., Eds.; Springer Publisher: Heidelberg/Berlin, Germany, 2018. [Google Scholar]
- Waijers, P.M.; Feskens, E.J.; Ocke, M.C. A critical review of predefined diet quality scores. Br. J. Nutr. 2007, 97, 219–231. [Google Scholar] [CrossRef] [PubMed]
- Vos, M.B.; Kaar, J.L.; Welsh, J.A.; American Heart Association Nutrition Committee of the Council on Lifestyle and Cardiometabolic Health; Council on Clinical Cardiology; Council on Cardiovascular Disease in the Young; Council on Cardiovascular and Stroke Nursing; Council on Epidemiology and Prevention; Council on Functional Genomics and Translational Biology; Council on Hypertension. Added Sugars and Cardiovascular Disease Risk in Children: A Scientific Statement from the American Heart Association. Circulation 2017, 135, e1017–e1034. [Google Scholar] [CrossRef] [PubMed]
- Louie, J.C.; Tapsell, L.C. Association between intake of total vs added sugar on diet quality: A systematic review. Nutr. Rev. 2015, 73, 837–857. [Google Scholar] [CrossRef] [PubMed]
- Mennella, J.A.; Bobowski, N.K. The sweetness and bitterness of childhood: Insights from basic research on taste preferences. Physiol. Behav. 2015, 152, 502–507. [Google Scholar] [CrossRef] [PubMed]
- Drewnowski, A. Sensory control of energy density at different life stages. Proc. Nutr. Soc. 2000, 59, 239–244. [Google Scholar] [CrossRef] [PubMed]
- Coldwell, S.E.; Oswald, T.K.; Reed, D.R. A marker of growth differs between adolescents with high vs. low sugar preference. Physiol. Behav. 2009, 96, 574–580. [Google Scholar] [CrossRef] [PubMed]
- Boeing, H.; Bechthold, A.; Bub, A.; Ellinger, S.; Haller, D.; Kroke, A.; Leschik-Bonnet, E.; Müller, M.J.; Oberritter, H.; Schulze, M.; et al. Critical review: Vegetables and fruit in the prevention of chronic diseases. Eur. J. Nutr. 2012, 51, 637–663. [Google Scholar] [CrossRef] [PubMed]
- Dougkas, A.; Reynolds, C.K.; Givens, I.D.; Elwood, P.C.; Minihane, A.M. Associations between dairy consumption and body weight: A review of the evidence and underlying mechanisms. Nutr. Res. Rev. 2011, 24, 72–95. [Google Scholar] [CrossRef] [PubMed]
- Murray, R.D. Savoring Sweet: Sugars in Infant and Toddler Feeding. Ann. Nutr. Metab. 2017, 70, 38–46. [Google Scholar] [CrossRef] [PubMed]
© 2018 by the authors. Licensee MDPI, Basel, Switzerland. This article is an open access article distributed under the terms and conditions of the Creative Commons Attribution (CC BY) license (http://creativecommons.org/licenses/by/4.0/).