Abstract
Satellite derived vegetation indices (VIs) are broadly used in ecological research, ecosystem modeling, and land surface monitoring. The Normalized Difference Vegetation Index (NDVI), perhaps the most utilized VI, has countless applications across ecology, forestry, agriculture, wildlife, biodiversity, and other disciplines. Calculating satellite derived NDVI is not always straight-forward, however, as satellite remote sensing datasets are inherently noisy due to cloud and atmospheric contamination, data processing failures, and instrument malfunction. Readily available NDVI products that account for these complexities are generally at coarse resolution; high resolution NDVI datasets are not conveniently accessible and developing them often presents numerous technical and methodological challenges. We address this deficiency by producing a Landsat derived, high resolution (30 m), long-term (30+ years) NDVI dataset for the conterminous United States. We use Google Earth Engine, a planetary-scale cloud-based geospatial analysis platform, for processing the Landsat data and distributing the final dataset. We use a climatology driven approach to fill missing data and validate the dataset with established remote sensing products at multiple scales. We provide access to the composites through a simple web application, allowing users to customize key parameters appropriate for their application, question, and region of interest.
Keywords:
Google Earth Engine; NDVI; vegetation index; Landsat; remote sensing; phenology; surface reflectance 1. Introduction
The Normalized Difference Vegetation Index (NDVI) is arguably the most widely implemented remote sensing spectral index for monitoring Earth’s land surface. Since the earliest report of use in 1973 [1,2], the term NDVI is found in nearly 121,000 scientific articles, conference papers, and books (Google Scholar). The index capitalizes on the optical properties of the cellular structure of leaves; the photosynthetic pigments (chlorophyll, associated light-harvesting pigments, and accessory pigments) efficiently absorb radiation in the visible range of the spectrum (to power photosynthesis) and reflect radiation in the near-infrared (NIR) range. The simple formula of NDVI and its direct relationship to vegetation photosynthetic capacity is a proxy for a wide range of essential vegetation characteristics and functions (e.g., fraction of photosynthetic radiation absorbed by the canopy, leaf area, canopy “greenness”, gross primary productivity) with countless applications in agriculture, forestry, ecology, biodiversity, habitat modeling, species migrations, land surface phenology, earth system processes (nutrient cycling, net primary productivity, evapotranspiration), and even economic, social, and medical sciences.
Satellite remote sensing (SRS) allows for the calculation of NDVI globally at a range of temporal intervals and spatial resolutions dependent on sensor characteristics and the satellite orbit, with a common inverse relationship between temporal and spatial resolutions. The Landsat Mission, with its first sensor launched in 1972, is the only uninterrupted long-term (>30 years) high-resolution remote sensing dataset that can provide a continuous historic NDVI record globally. The Landsat record at 30-m resolution is ideally suited for local or regional scale time-series applications, particularly with the recent release of higher-level surface reflectance products from Landsat sensors 5 ETM, 7 ETM+, and 8 OLI from 1984 to present. Utilizing these products across scenes and through time, however, is not without complications [3], particularly for users without GIS and Remote Sensing training and resources. To create consistent mosaics or long-term time series, users must account for data record gaps, radiometric differences across sensors [4], scene overlaps, malfunctions (e.g., the Landsat 7 scan line corrector malfunction), and inherent noise (due to clouds, atmospheric contamination, missing auxiliary data, etc.). As the region of interest and temporal extent increases, data volume and compute processing needs present significant barriers to many users without access to high performance computing facilities or the necessary skills to manipulate such data. These limitations often prevent the implementation of such a dataset in ecological studies, conservation monitoring efforts, or teaching exercises despite the clear value of its application.
The rise of high performance computing clusters, public access to supercomputing facilities and cloud computing and storage removes many of the computational barriers associated with Landsat data. The ability to create user friendly applications that interacts with these computing services eliminates additional barriers associated with data manipulation and enables users with minimal technical coding skills to access and process data. We capitalize on the abilities of high performance computing resources and web-based software to provide a Landsat derived conterminous U.S. (CONUS), 30-m resolution, NDVI product (Figure 1). We use Landsat 5 ETM, 7 ETM+, and 8 OLI sensors, with a user specified climatology (historic NDVI value limited by a user-defined time-period) for temporal smoothing, and Google Earth Engine (a cloud-based geospatial platform for planetary-scale data analysis) for rapid data processing and visualization [5], to produce 16 day NDVI composites from 1984 to 2016. We validate the NDVI product by comparing against other established remote sensing products across multiple spatial scales. The resulting NDVI record enables greater use of Landsat data in answering crucial ecological questions across broad spatio-temporal scales at a higher level of spatial detail than possible with other currently available NDVI products. While Landsat composite products exist (e.g., the Web Enabled Landsat Data product [6] and the ability to create simple mean/median/max composites) our product improves upon these with the novel gap-filling and smoothing approaches (Figure 2). Additionally, we make the composites available through a dynamic web application, allowing users to customize key parameters to produce NDVI composites more suited to specific regions or ecological questions.
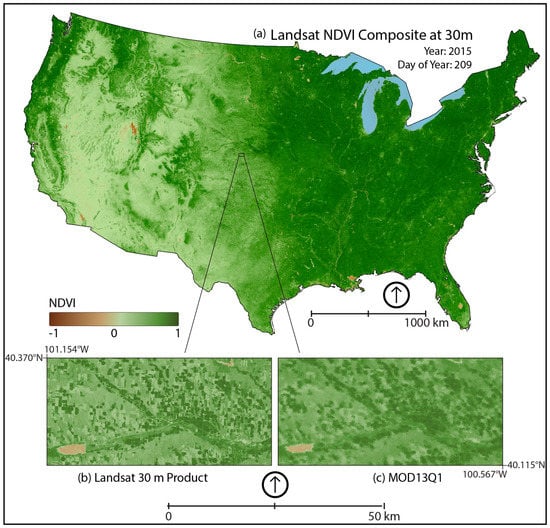
Figure 1.
(a) A 30 m continuous CONUS Landsat NDVI composite for 28 July 2015. Our methods produce broad scale composites with minimal gaps in data and reduce the effect of scene edges and Local scale comparison of (b) Landsat NDVI at 30 m and (c) MODIS MOD13Q1 at 250 m from the same composite period. The Landsat product provides added spatial detail important in measuring certain ecological processes.
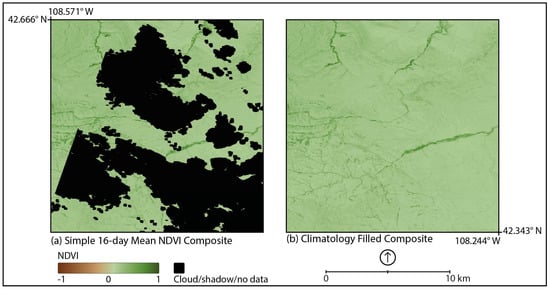
Figure 2.
(a) A simple 16-day mean NDVI composite from 28 July to 12 August 2015 created from Landsat 7 and 8 sensors. The composite contains missing data due to cloud cover and scene edges are apparent due to differing acquisition dates. (b) A 16-day climatology (5-year) gap filled composite for the same time and location. The climatology is user defined in order to produce an appropriate composite for the question being asked.
2. Materials and Methods
2.1. Data
We use the surface reflectance (SR) products from Landsat 5 ETM, 7 ETM+, and 8 OLI sensors to create NDVI composites. The Landsat satellites have near-polar orbits with a repeat overpass every 16 days; throughout the Landsat missions; however, two satellites have often operated simultaneously (Figure 3) in asynchrony, creating an eight-day return overpass for a given area.
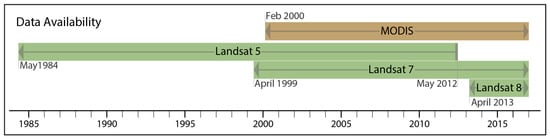
Figure 3.
A timeline showing the data availability for Landsat NDVI, based upon Landsat surface reflectance products and MOD13Q1. The extended Landsat record provides a longer continuous record of high resolution NDVI.
Furthermore, adjacent orbits of a single sensor spatially overlap from 7% at the equator to 68.7% at 70° latitude [7]. During a single 16-day period there may be as many as four independent views for a given point. Our compositing method (Figure 4) capitalizes on the operation of multiple sensors and views to maximize the potential of retrieving an NDVI observation every 16 days.
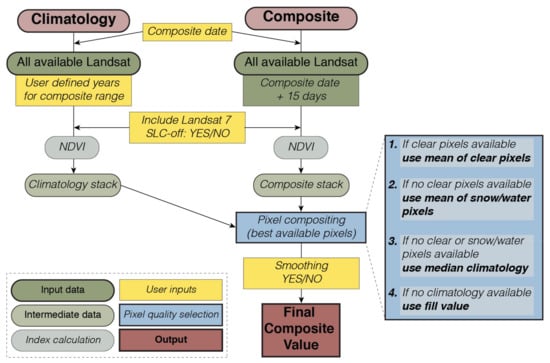
Figure 4.
A flow chart demonstrating the NDVI compositing process, in which the best available pixels from all available Landsat sensors are selected and combined to produce the final NDVI composite value.
The Landsat SR products [8,9] correct for atmospheric and illumination/viewing geometry effects, and are the highest level of image processing available for Landsat data. Although some images are not processed due to missing auxiliary data, the use of SR is generally more appropriate for measuring and monitoring vegetation at the land surface [10,11]. Landsat Surface reflectance products also contain useful pixel data quality flag information indicating clear, water, snow, cloud or shadow conditions, as determined by the CFMask algorithm [12]. We employ this information to select the best available data within each composite period.
2.2. Compositing
To produce a pixel-wise 16-day composite (date of composite plus subsequent 15 days), all available Landsat surface reflectance images (from 5 ETM, 7 ETM+, and 8 OLI) are processed. Landsat scenes are resampled bilinearly to a Geographic Coordinate System WGS84 grid of approximately 30 m (1/5000 degrees) resolution. NDVI is calculated as:
where ρNIR is surface reflectance in the near infrared band (band 4—Landsat 5, 7; band 5—Landsat 8) and ρRED is surface reflectance in the red band (band 3—Landsat 5, 7; band 4—Landsat 8). To account for sensor differences, we adjusted landsat NDVI values from Landsat 5 ETM and 7 ETM+ to match Landsat 8 OLI using a simple linear transformation: [13].
Additionally, Landsat 5 scenes often contain abnormalities along scene edges, resulting in both missing data and erroneously high NDVI values. These pixels are removed by buffering 450 m inwards from the image mask (Figure S1). The buffer size was determined from visual inspection of a subset of Landsat 5 scenes, ensuring removal of all the erroneous pixels without losing substantial amounts of valid data. To ensure the best available data for each composite, a pixels are selected and used based on their quality flag. First, all pixels flagged as clear during a 16-day period are selected and the mean NDVI calculated. If no ‘clear’ pixels are available, the mean NDVI value of all ‘water’ and ‘snow’ pixels is used. If there are still no available pixels, (i.e., all pixels within the 16-day period are flagged as cloud or shadow, or no surface reflectance images are available) the pixel is filled with a climatology. The climatology is calculated as the median NDVI of ‘clear’, ‘water’ and ‘snow’ pixels over the same 16-day period from previous years, with the user specifying the number of years. The median climatology is used to minimize the effects abnormally wet or dry years within the climatology record. In rare instances when no climatology is available (i.e., all pixels within the set climatology length are flagged as cloud or shadow), the composite is filled with a no-data value.
2.3. Smoothing
As NDVI is a proxy for vegetation greenness, it is expected to follow a relatively smooth and continuous temporal profile. Outside of disturbance or land cover change events, a sudden drop in NDVI is likely due to atmospheric contamination or a quality issue not identified in the Landsat surface reflectance product [14,15]. To account for these anomalous declines, we employ a smoothing method, similar to iterative Interpolation for Data Reconstruction (IDR) [16]. If a composite NDVI value is less than the mean of the previous and following time step composites by a threshold of 0.1, it is replaced by that mean value. While Julien and Sobrino suggest iteratively smoothing until convergence is reached, we only smooth once as multiple runs significantly increases computational time at large scales. Invocation of the smoothing algorithm by the user is optional.
2.4. Quality
A quality band is provided to specify the attributes of the raw data used to calculate each pixel’s composite value. The quality band indicates if a composite value was calculated from clear pixels; water or snow pixels; or if the climatology was used. The quality band also indicates if a composite value is the result of smoothing. Table 1 shows the range of quality band values and descriptions.

Table 1.
NDVI quality band values and descriptions.
2.5. Product Creation and Distribution
Landsat derived NDVI is available through a simplified web-interface (Figure 5, http://ndvi.ntsg.umt.edu/) that utilizes Google Earth Engine. Users define a region of interest, select a time period, the length of the climatology used for gap filling (2, 5, 10, 15, 20, 25, or 30 years), inclusion of Landsat 7 ETM+ SLC-off data, and whether to apply the smoothing algorithm. The customized NDVI composite is then produced (as a GeoTIFF) as requested based on the user defined parameters.
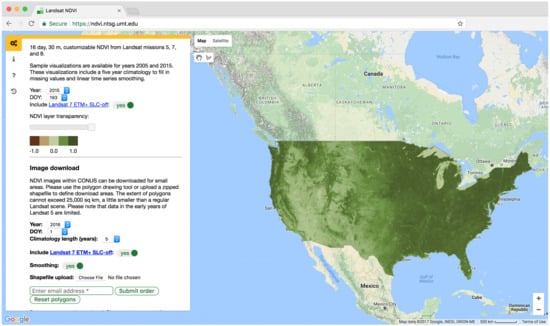
Figure 5.
A screen shot of the NDVI web application (https://ndvi.ntsg.umt.edu). To download a composite, users set their desired parameters in the left panel. The region of interest can either be an uploaded shapefile or a polygon drawn directly on the map. The composite is processed on the fly and users are notified via email when it is ready to download.
2.6. NDVI Comparisons Across Spatial Scales
We compare the Landsat derived NDVI record to independently derived finer and coarser resolution data, including: the green chromatic coordinate from in situ phenology camera (phenocam) observations and the Moderate Resolution Imaging Spectroradiometer 16-day 250 m NDVI product (MOD13Q1). We use Landsat derived NDVI composites with a five-year climatology for gap filling and employ the IDR smoothing algorithm for the validation comparisons.
2.6.1. Phenology Cameras
The PhenoCam Network provides automated, sub-daily, near-surface remote sensing of canopy phenology through digital repeat photography [17]. The images are continuous in time and robust to variation in illumination condition, with minimal influence from clouds or atmospheric effects, particularly when calculating vegetation indices [18]. Numerous studies [18,19,20,21] have demonstrated that the green chromatic coordinate (GCC; [22]); can be used to identify phenology phases and monitor canopy development, with strong correlations to NDVI time series. The GCC is calculated as:
where DN is the digital number recorded by the camera and r, g, and b denote red, green, and blue channels respectively. PhenoCam Network sites within CONUS that had at least four years of continuous imagery were selected for analysis; resulting in 43 sites that include agriculture/crops, shrublands, grasslands, deciduous broadleaf forests, and evergreen needleleaf forests (Figure S2). We use the daily GCC90 data provided by the PhenoCam Network, which represents the daily 90th percentile of the GCC during daylight hours. A 16-day mean is calculated from the daily GCC90, using the same 16-day period as the Landsat NDVI product. The corresponding Landsat NDVI time series is extracted over each PhenoCam site, followed by calculation of Pearson correlation coefficients.
Within each image field of view (FOV), a predefined region of interest (ROI) is used to calculate the GCC, isolating the plant functional type (PFT) of interest. Depending on the FOV, more than one ROI can be defined, providing two independent time series of different PFTs. Four of the 43 sites contained two ROIs and we compare both ROIs at these sites to the single broader scale (30 m) Landsat NDVI time series.
The comparison of two independent vegetation indices derived from sensors with different bandwidths, fields of view, and viewing geometries is not without issue [23]. The GCC is more sensitive to leaf pigmentation than NDVI [24] and the Landsat pixel may not capture the camera FOV or may be smaller than the FOV. However, the PhenoCam data provides the only multi-year, high spatial and temporal resolution standardized product comparable to the 30 m land surface phenology signal. The correlations provide an assessment of the Landsat NDVI composites seasonal response to vegetation conditions either within or in close proximity to the camera FOV.
2.6.2. MOD13Q1
The MODIS VI products (MOD13) are designed to provide consistent spatiotemporal observations of vegetation conditions, have been continually produced since 2001 [25], and employed in at least 1700 peer-reviewed research articles (Google Scholar). The MOD13Q1 product has a 16-day NDVI composite with an approximate spatial resolution of 250 m. Like the Landsat NDVI product, the MOD13Q1 16-day composite period includes the composite date and 15 ensuing days. MOD13Q1 composites are created using a constrained-view angle, maximum value composite technique, and the MODIS surface reflectance product [26].
We compare the Landsat derived NDVI to the MOD13Q1 NDVI from 2000 to 2016. Time series of both products are extracted for a set of points across the CONUS domain (Figure S2) using a stratified random sample across land cover classes. Points are only selected within areas of homogenous land cover at the MODIS resolution, determined using the National Land Cover Dataset (NLCD) for 2001, 2006, and 2011 [27,28,29]. Within these homogenous regions, up to 50 random points are created, using Google Earth Engine’s random point function, for 12 major land cover classes across the domain (evergreen forest, deciduous forest, mixed forest, shrubland, grassland, pasture/hay, herbaceous wetland, wooded wetland, barren, developed-open space, and developed-low intensity). For certain land cover classes, less than 50 random points in homogeneous pixels are available, resulting in a total sample size of 356 points across the domain. To match resolutions, the Landsat NDVI was degraded to the MODIS 250 m resolution where the mean Landsat NDVI value was calculated within the extent of each MODIS pixel. The time series for both products were extracted, disregarding any null values, resulting in 131,973 paired observations. The Pearson correlation coefficients (r-value), mean bias, mean absolute bias (MAB), and root mean square error (RMSE) are calculated for the entire series and each location separately.
3. Results
3.1. Phenology Cameras Results
The phenocam correlation analysis (Table S1) resulted in 36 of the 47 ROIs exhibiting r-values greater than 0.70, and just three ROIs with r-values less than 0.30 (all ROIs: mean r-value = 0.72; range: −0.35–0.92; p < 0.01 for all cases). The high and significant correlations demonstrate that the 16-day Landsat composites do well in capturing the seasonal greenness patterns exhibited by the phenocam GCC90. The sites with the three lowest correlations provide good examples where the resulting NDVI values and their comparison to other data products requires careful interpretation. One site (drippingsprings; r = 0.22) presents a mismatch between the vegetation in the extent of the Landsat pixel and the ROI of the phenocam image. The phenocam ROI delineates a single deciduous broadleaf tree canopy in a narrow ravine, while the extent of the Landsat pixel includes other riparian zone species and shrubs above the ravine. Another low correlation site (oregonMP; r = −0.24) is from an evergreen needleleaf forest in Oregon. Examination of the quality band indicates this site is often obscured by clouds and snow in the winter months, resulting in a spurious NDVI time series with poorly defined seasonality, while the GCC90 time series provides a well-defined seasonal signal. The site with the lowest correlation (sedgwick SH; r = −0.35) contained two ROIs and is discussed below.
Three of the four sites with two ROIs displayed strong correlations both between ROI’s (0.81 < r < 0.94) and versus the Landsat NDVI (0.72 < r < 0.88). Therefore, even though the two ROIs within a site delineated separate PFTs, the PFTs displayed a common seasonality. The fourth site with one grass ROI and one shrub ROI, located on the Sedgwick Reserve in southern California, displayed contrasting results: Shrub vs. Grass ROI, r-value = −0.20; Shrub ROI vs. Landsat NDVI, r-value = −0.35; Grass ROI vs. Landsat NDVI, r-value = 0.75. Examination of the time series revealed that the Shrub ROI was out of phase with the Grass ROI, with a seasonal lag of approximately three months, resulting in negative correlations when compared to the grassland dominated NDVI signal.
The low correlation sites highlight two important considerations that must be accounted for when comparing satellite and ground-level observations. First, vegetation indices from satellite data represent integrated measures of the vegetation at the pixel scale often confounding comparisons to canopy scale indices, such as those derived from phenology cameras particularly over heterogeneous landscapes [30,31]. Second, phenology camera FOVs will vary from site to site, and in some cases an ROI may be beyond the extent of the satellite pixel that contains the camera, particularly when implementing high resolution (30 m) data.
3.2. MOD13Q1 Results
We found high correlations between the Landsat NDVI product and coarser MOD13Q1 observations (Table 2, Figure 6), with an overall r-value of 0.94. When disaggregated by the Landsat product quality flag these data show a higher correlation for clear pixels (r-value = 0.97), slightly lower correlation for climatology filled pixels (r-value = 0.88) and still lower correlation for snow/water pixels (r-value = 0.70).
Table 2.
Mean bias, mean absolute bias (MAB), root mean square error (RMSE), and r-values for all the MOD13Q1 and Landsat NDVI sample points combined. Each statistic is calculated for all pixels and each quality flag separately.
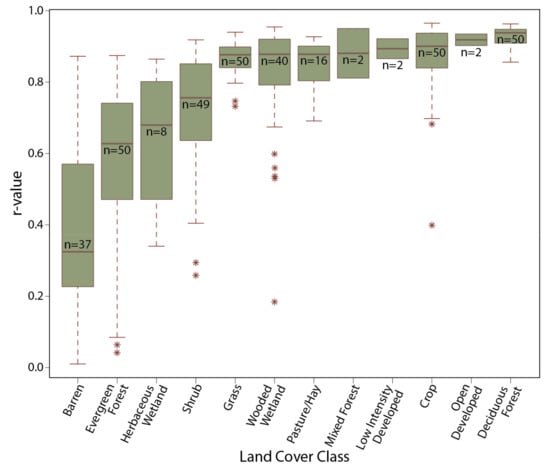
Figure 6.
The distribution of Pearson correlation coefficients between MOD13Q1 NDVI and Landsat NDVI for each land cover class. * represent suspected outliers (observations that fall outside the upper or lower quartiles plus or minus 1.5 times the interquartile distance).
When disaggregated to individual points, 258 of the 356 points (72%) exhibit r-values greater than 0.70, while 24 points had correlations lower than 0.30 (all points: mean r-value = 0.74; range: 0.01–0.97). The generally favorable results demonstrate that the 16-day Landsat NDVI composites track the greenness trends captured by the MOD13Q1 product. The relationship breaks down at some sites, especially within certain land cover classes (Figure 6).
The poorest performing land cover classes, with r-values less than 0.70, represent barren, evergreen needleleaf forest, and herbaceous wetland (mean r-values: 0.41, 0.57, and 0.64, respectively) land cover conditions. NDVI over barren land may be highly variable due to the high saturation of background soils affecting the sensors differently. The low mean correlations in evergreen forest is largely due to a few influential outliers. Many of these sites are located in the northwest. Similar to the oregonMP PhenoCam site, the time series are often contaminated with clouds and snow, and exhibit little NDVI seasonality. Temporal profiles of the Landsat NDVI and MOD13Q1 product (Figure 7), for a selection of points representing the major land cover classes across CONUS (Figure S2), demonstrate the strong correlation between the two products.
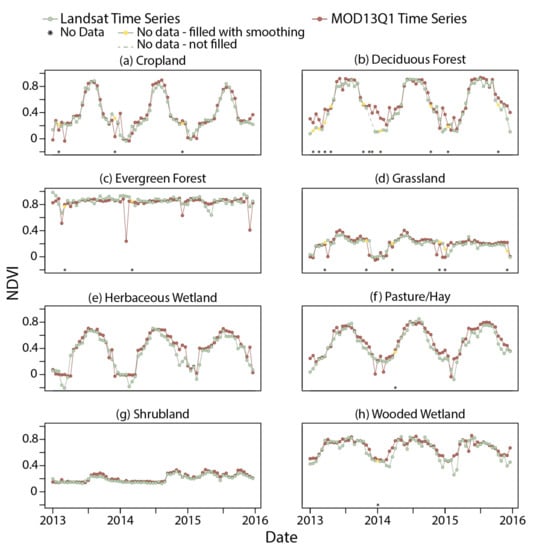
Figure 7.
Time series of 30 m Landsat NDVI and 250 m MOD13Q1 NDVI time series from 2013 to 2015, separated by land cover class. After April 2013, the Landsat NDVI time series include data from both Landsat 7 and 8, while before April 2013 they included just Landsat 7 data. Each time series is from a single point, within a homogenous area (i.e., pixels where both Landsat and MOD13Q1 represent the same land cover), sampled at a location indicative of the major land cover classes.
The profiles are particularly analogous during the growing season. It is mainly during the winter months where the profiles tend to diverge, as the Landsat composites are more likely contaminated with cloud and/or snow cover, with lower signal-to-noise. Additionally, in heterogeneous landscapes, the 30 m Landsat NDVI product better reflects the spatial variability of the underlying land cover (Figure 1 and Figure 8).
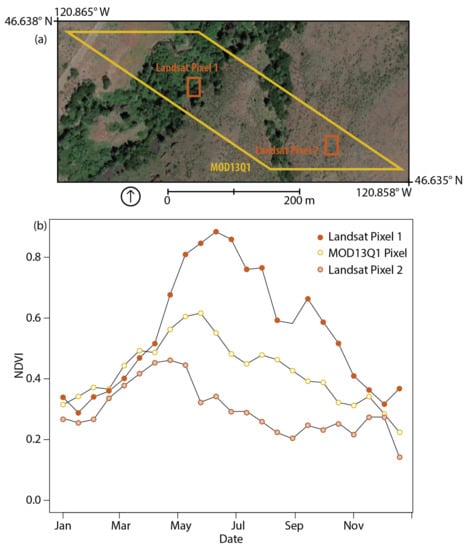
Figure 8.
(a) Pixel locations in central Washington, USA. Landsat derived NDVI can provide increased detail in heterogeneous landscapes. The difference in pixel shape is due to native projections being transformed to a common projection. (b) Chart for 2015 of a Landsat derived NDVI and MOD13Q1 NDVI time series.
4. Discussion
The first-ever 16-day continuous and customizable Landsat derived NDVI composites produced here (30 m resolution for CONUS; 1984–2016) overcome many of the previous barriers of working with Landsat imagery (e.g., obtaining current or historical images; managing overlapping scenes; image storage and processing; etc.), permitting ecologists to focus time and effort on specific questions rather than data/imagery manipulation. The composites are well correlated with other observational benchmarks, including in situ phenocam observations of local vegetation conditions and coarser satellite observations from MODIS (MOD13Q1), demonstrating product capabilities for tracking greenness trends from local to regional extents. Fine spatial resolution products such as these, with a longer historical record (Figure 3), open the door to numerous analytical possibilities and applications, ranging from change detection (Figure S3) to conservation monitoring to ecosystem assessment [32,33,34]. The ability to customize the NDVI composite, per user specification, grants the use of a priori knowledge of the region to obtain the most suitable composite for the question at hand, producing an application ready product without the need for post-processing.
As with all remotely sensed products, the scope of Landsat derived NDVI has limitations, and is best suited for local or regional applications, where incomplete data are minimized due to a smaller spatial extent. Due to the infrequent return time of Landsat observations, data may be limited during the 16-day compositing period; cloudy pixels or the lack of surface reflectance images will reduce the overall data available for the composite. Additionally, due to the orbital paths of the Worldwide Reference System 2, a composite may be created from multiple scenes obtained from different dates within the 16-day period (e.g., different scenes that intersect an area of interest, but are acquired at the beginning and end of the 16-day period). If data are incomplete (e.g., cloudy pixels, scan line corrector errors of Landsat 7 ETM+, etc.) within these scenes, it is possible that two adjacent pixels can represent two different acquisition dates; if no data for the period are available then a climatology is used for gap filling, further distancing the dates used in the composite. Frequency of gap filling that occurs varies both geographically and seasonally, and is more likely when only a single Landsat sensor is operational. Furthermore, gap filling with climatology may produce anomalies, particularly during unusually wet or dry years, yielding systematically low or high values, respectively. These caveats may result in visual artifacts in areas with incomplete data or along scene edges.
The real power of emerging big data, cloud and web-based applications, and technologies (e.g., Google Earth Engine, GeoTrellis, GeoMesa, Apache Spark, etc.) is our new-found ability to create customizable geospatial products. Publicly available applications may be built upon these technologies, ultimately allowing users greater flexibility to provide input data, set spatial or temporal restrictions, modify parameters of algorithms, or perform on the fly testing and validation before final analysis. Such capabilities change the paradigm of static geospatial products to dynamic geospatial products, where the output is dependent upon the user’s knowledge of both the system and the question. Although this requires products to be generated as needed, it provides the ability to create a much more appropriate product for any given system and question. The Landsat NDVI product and its associated web application (http://ndvi.ntsg.umt.edu/) provide a glimpse into this reality of dynamic geospatial products.
5. Conclusions
The present work introduces a unique approach to creating and disseminating high resolution spatially and temporally continuous Landsat derived NDVI. Our motivation is to remove the barriers of these datasets to further conservation and ecological research. Sixteen-day composites are created by selecting the best available pixels during each 16-day composite period from all available Landsat sensors. Missing values, due to unprocessed scenes, atmospheric contamination, or sensor malfunction are gap filled with a user-defined climatology. The resulting NDVI time series is then smoothed to approximate natural vegetative phenology. We validate the NDVI dataset using established remote sensing products at multiple scales, demonstrating the effectiveness of our approach. We provide open access to the dataset through a simple web application (http://ndvi.ntsg.umt.edu/) enabling ecologists, land managers, conservationists, and others–who may not have the compute processing capacity or technical skills–to process massive amounts of remote sensing data. This process is simplified with Google Earth Engine, an advanced planetary-scale cloud-based geospatial processing platform, which processes and distributes the product. Each 16-day composite for CONUS requires processing of at least 2700 individual Landsat scenes (more if the climatology is used for gap filling). The web application permits on-the-fly processing with customizable parameters, eliminating the need to store large amounts of data. Although we limit this study to CONUS, the framework can be expanded beyond CONUS where Landsat surface reflectance data are available and to include other useful vegetation indices (e.g., EVI, SAVI), and can be updated to accommodate updates or reorganization of the Landsat archive (e.g., Collection 1) or be modified to utilize other satellite remote sensing datasets.
Supplementary Materials
The following are available online at www.mdpi.com/2072-4292/9/8/863/s1, Figure S1: Landsat 5 Edge Removal, Figure S2: Map of PhenoCam Sites and MOD13Q1 comparison points, Figure S3: A visual example of long term land use change using the NDVI product, Table S1: PhenoCam Correlation Analysis, Acknowledgements S1: PhenoCam Site Acknowledgments.
Acknowledgments
We thank the Google Earth Engine developers for their support and technical advice. This work was funded through a Google Earth Engine research award and by the NRCS Wildlife Conservation Effects Assessment Project and Sage Grouse Initiative. The development of PhenoCam has been supported by the Northeastern States Research Cooperative, NSF’s Macrosystems Biology program (award EF-1065029 and EF-1702697), DOE’s Regional and Global Climate Modeling program (award DE-SC0016011), and the US National Park Service Inventory and Monitoring Program and the USA National Phenology Network (grant number G10AP00129 from the United States Geological Survey). We thank Koen Hufkens and Tom Milliman for their contributions to producing the PhenoCam data. We thank the PhenoCam site collaborators and funding sources (listed in the Supplementary Materials) for their support of the PhenoCam project.
Author Contributions
Nathaniel P. Robinson, Brady W. Allred, Matthew O. Jones, and Alvaro Moreno conceived and designed the project. Nathaniel P. Robinson and Brady W. Allred, with assistance from Tyler A. Erickson, wrote the Google Earth Engine code. Andrew D. Richardson provided PhenoCam data. All authors contributed to the writing and review of the manuscript.
Conflicts of Interest
The authors declare no conflict of interest.
References
- Rouse, J.W., Jr.; Haas, R.H.; Schell, J.A.; Deering, D.W. Monitoring vegetation systems in the Great Plains with ERTS. In Proceedings of the Third Earth Resources Technology Satellite-1 Symposium, Washington, DC, USA, 10–14 December 1973. [Google Scholar]
- Tucker, C.J.; Miller, L.D.; Pearson, R.L. Measurement of the combined effect of green biomass, chlorophyll, and leaf water on canopy spectroreflectance of the shortgrass prairie. Remote Sens. Earth Resour. 1973, 1973, 2. [Google Scholar]
- Wijedasa, L.S.; Sloan, S.; Michelakis, D.G.; Clements, G.R. Overcoming limitations with Landsat imagery for mapping of peat swamp forests in Sundaland. Remote Sens. 2012, 4, 2595–2618. [Google Scholar] [CrossRef]
- She, X.; Zhang, L.; Cen, Y.; Wu, T.; Huang, C.; Baig, M.H.A. Comparison of the continuity of vegetation indices derived from Landsat 8 OLI and Landsat 7 ETM+ data among different vegetation types. Remote Sens. 2015, 7, 13485–13506. [Google Scholar] [CrossRef]
- Gorelick, N.; Hancher, M.; Dixon, M.; Ilyushchenko, S.; Thau, D.; Moore, R. Google Earth Engine: Planetary-scale geospatial analysis for everyone. Remote Sens. Environ. 2016. [Google Scholar] [CrossRef]
- Roy, D.P.; Ju, J.; Kline, K.; Scaramuzza, P.L.; Kovalskyy, V.; Hansen, M.C.; Loveland, T.R.; Vermote, E.F.; Zhang, C. Web-enabled Landsat Data (WELD): Landsat ETM+ Composited Mosaics of the Conterminous United States. Remote Sens. Environ. 2010, 114, 35–49. [Google Scholar] [CrossRef]
- Pekel, J.-F.; Cottam, A.; Gorelick, N.; Belward, A.S. High-resolution mapping of global surface water and its long-term changes. Nature 2016, 540, 418–422. [Google Scholar] [CrossRef] [PubMed]
- Masek, J.G.; Vermote, E.F.; Saleous, N.E.; Wolfe, R.; Hall, F.G.; Huemmrich, K.F.; Gao, F.; Kutler, J.; Lim, T.-K. A Landsat surface reflectance dataset for North America, 1990–2000. IEEE Geosci. Remote Sens. Lett. 2006, 3, 68–72. [Google Scholar] [CrossRef]
- Vermote, E.; Justice, C.; Claverie, M.; Franch, B. Preliminary analysis of the performance of the Landsat 8/OLI land surface reflectance product. Remote Sens. Environ. 2016, 185, 46–56. [Google Scholar] [CrossRef]
- Feng, M.; Huang, C.; Channan, S.; Vermote, E.F.; Masek, J.G.; Townshend, J.R. Quality assessment of Landsat surface reflectance products using MODIS data. Comput. Geosci. 2012, 38, 9–22. [Google Scholar] [CrossRef]
- Song, C.; Woodcock, C.E.; Seto, K.C.; Lenney, M.P.; Macomber, S.A. Classification and change detection using Landsat TM data: When and how to correct atmospheric effects? Remote Sens. Environ. 2001, 75, 230–244. [Google Scholar] [CrossRef]
- Foga, S.; Scaramuzza, P.L.; Guo, S.; Zhu, Z.; Dilley, R.D., Jr.; Beckmann, T.; Schmidt, G.L.; Dwyer, J.L.; Joseph Hughes, M.; Laue, B. Cloud detection algorithm comparison and validation for operational Landsat data products. Remote Sens. Environ. 2017, 194, 379–390. [Google Scholar] [CrossRef]
- Roy, D.P.; Kovalskyy, V.; Zhang, H.K.; Vermote, E.F.; Yan, L.; Kumar, S.S.; Egorov, A. Characterization of Landsat-7 to Landsat-8 reflective wavelength and normalized difference vegetation index continuity. Remote Sens. Environ. 2016, 185, 57–70. [Google Scholar] [CrossRef]
- Bradley, B.A.; Jacob, R.W.; Hermance, J.F.; Mustard, J.F. A curve fitting procedure to derive inter-annual phenologies from time series of noisy satellite NDVI data. Remote Sens. Environ. 2007, 106, 137–145. [Google Scholar] [CrossRef]
- Reed, B.C.; Brown, J.F.; VanderZee, D.; Loveland, T.R.; Merchant, J.W.; Ohlen, D.O. Measuring phenological variability from satellite imagery. J. Veg. Sci. 1994, 5, 703–714. [Google Scholar] [CrossRef]
- Julien, Y.; Sobrino, J.A. Comparison of cloud-reconstruction methods for time series of composite NDVI data. Remote Sens. Environ. 2010, 114, 618–625. [Google Scholar] [CrossRef]
- Richardson, A.D.; Braswell, B.H.; Hollinger, D.Y.; Jenkins, J.P.; Ollinger, S.V. Near-surface remote sensing of spatial and temporal variation in canopy phenology. Ecol. Appl. 2009, 19, 1417–1428. [Google Scholar] [CrossRef] [PubMed]
- Sonnentag, O.; Hufkens, K.; Teshera-Sterne, C.; Young, A.M.; Friedl, M.; Braswell, B.H.; Milliman, T.; O’Keefe, J.; Richardson, A.D. Digital repeat photography for phenological research in forest ecosystems. Agric. For. Meteorol. 2012, 152, 159–177. [Google Scholar] [CrossRef]
- Richardson, A.D.; Jenkins, J.P.; Braswell, B.H.; Hollinger, D.Y.; Ollinger, S.V.; Smith, M.-L. Use of digital webcam images to track spring green-up in a deciduous broadleaf forest. Oecologia 2007, 152, 323–334. [Google Scholar] [CrossRef] [PubMed]
- Ahrends, H.E.; Etzold, S.; Kutsch, W.L.; Stoeckli, R.; Bruegger, R.; Jeanneret, F.; Wanner, H.; Buchmann, N.; Eugster, W. Tree phenology and carbon dioxide fluxes: Use of digital photography for process-based interpretation at the ecosystem scale. Clim. Res. 2009, 39, 261–274. [Google Scholar] [CrossRef]
- Zhao, J.; Zhang, Y.; Tan, Z.; Song, Q.; Liang, N.; Yu, L.; Zhao, J. Using digital cameras for comparative phenological monitoring in an evergreen broad-leaved forest and a seasonal rain forest. Ecol. Inform. 2012, 10, 65–72. [Google Scholar] [CrossRef]
- Toomey, M.; Friedl, M.A.; Frolking, S.; Hufkens, K.; Klosterman, S.; Sonnentag, O.; Baldocchi, D.D.; Bernacchi, C.J.; Biraud, S.C.; Bohrer, G.; et al. Greenness indices from digital cameras predict the timing and seasonal dynamics of canopy-scale photosynthesis. Ecol. Appl. 2015, 25, 99–115. [Google Scholar] [CrossRef] [PubMed]
- Petach, A.R.; Toomey, M.; Aubrecht, D.M.; Richardson, A.D. Monitoring vegetation phenology using an infrared-enabled security camera. Agric. For. Meteorol. 2014, 195–196, 143–151. [Google Scholar] [CrossRef]
- Keenan, T.F.; Darby, B.; Felts, E.; Sonnetag, O.; Friedl, M.A.; Hufkens, K.; O’Keefe, J.; Klosterman, S.; Munger, J.W.; Toomey, M.; et al. Tracking forest phenology and seasonal physiology using digital repeat photography: A critical assessment. Ecol. Appl. 2014, 24, 1478–1489. [Google Scholar] [CrossRef]
- Solano, R.; Didan, K.; Jacobson, A.; Huete, A. MODIS Vegetation Index User’s Guide (MOD13 Series); Version 2.0; Vegetation Index and Phenology Lab, the University of Arizona: Tucson, AZ, USA, 2010; pp. 1–38. [Google Scholar]
- Didan, K.; Munoz, A.B.; Solano, R.; Huete, A. MODIS Vegetation Index User’s Guide (MOD13 Series); Version 3.0; University of Arizona: Tucson, AZ, USA, 2015. [Google Scholar]
- Homer, C.; Dewitz, J.; Fry, J.; Coan, M.; Hossain, N.; Larson, C.; Herold, N.; McKerrow, A.; VanDriel, J.N.; Wickham, J. Completion of the 2001 national land cover database for the conterminous United States. Photogramm. Eng. Remote Sens. 2007, 73, 337–341. [Google Scholar]
- Fry, J.A.; Xian, G.; Jin, S.; Dewitz, J.A.; Homer, C.G.; Limin, Y.; Barnes, C.A.; Herold, N.D.; Wickham, J.D. Completion of the 2006 National Land Cover Database for the conterminous United States. Photogramm. Eng. Remote Sens. 2011, 77, 858–864. [Google Scholar]
- Homer, C.G.; Dewitz, J.A.; Yang, L.; Jin, S.; Danielson, P.; Xian, G.; Coulston, J.; Herold, N.D.; Wickham, J.D.; Megown, K. Completion of the 2011 National Land Cover Database for the conterminous United States-Representing a decade of land cover change information. Photogramm. Eng. Remote Sens. 2015, 81, 345–354. [Google Scholar]
- Hufkens, K.; Friedl, M.; Sonnentag, O.; Braswell, B.H.; Milliman, T.; Richardson, A.D. Linking near-surface and satellite remote sensing measurements of deciduous broadleaf forest phenology. Remote Sens. Environ. 2012, 117, 307–321. [Google Scholar] [CrossRef]
- Klosterman, S.T.; Hufkens, K.; Gray, J.M.; Melaas, E.; Sonnentag, O.; Lavine, I.; Mitchell, L.; Norman, R.; Friedl, M.A.; Richardson, A.D. Evaluating remote sensing of deciduous forest phenology at multiple spatial scales using PhenoCam imagery. Biogeosciences 2014, 11, 4305–4320. [Google Scholar] [CrossRef]
- Hansen, M.C.; Loveland, T.R. A review of large area monitoring of land cover change using Landsat data. Remote Sens. Environ. 2012, 122, 66–74. [Google Scholar] [CrossRef]
- Jensen, J.R.; Rutchey, K.; Koch, M.S.; Narumalani, S. Inland wetland change detection in the Everglades Water Conservation Area 2A using a time series of normalized remotely sensed data. Photogramm. Eng. Remote Sens. 1995, 61, 199–209. [Google Scholar]
- Nouvellon, Y.; Moran, M.S.; Seen, D.L.; Bryant, R.; Rambal, S.; Ni, W.; Bégué, A.; Chehbouni, A.; Emmerich, W.E.; Heilman, P.; et al. Coupling a grassland ecosystem model with Landsat imagery for a 10-year simulation of carbon and water budgets. Remote Sens. Environ. 2001, 78, 131–149. [Google Scholar] [CrossRef]


© 2017 by the authors. Licensee MDPI, Basel, Switzerland. This article is an open access article distributed under the terms and conditions of the Creative Commons Attribution (CC BY) license (http://creativecommons.org/licenses/by/4.0/).