Article

Assessment of GPM and TRMM Precipitation Products over Singapore

1
Geography Section, School of Humanities, Universiti Sains Malaysia, 11800 Penang, Malaysia
2
Department of Civil and Environmental Engineering, National University of Singapore, No. 1 Engineering Drive 2, Singapore 117576, Singapore
3
Chair of Hydrology and River Basin Management, Technical University of Munich, Arcisstrasse 21, 80333 Munich, Germany
*
Author to whom correspondence should be addressed.
Remote Sens. 2017, 9(7), 720; https://doi.org/10.3390/rs9070720
Submission received: 2 May 2017 / Revised: 30 June 2017 / Accepted: 10 July 2017 / Published: 13 July 2017

Abstract

:
The evaluation of satellite precipitation products (SPPs) at regional and local scales is essential in improving satellite-based algorithms and sensors, as well as in providing valuable guidance when choosing alternative precipitation data for the local community. The Tropical Rainfall Measuring Mission (TRMM) has made significant contributions to the development of various SPPs since its launch in 1997. The Global Precipitation Measurement (GPM) mission launched in 2014 and is expected to continue the success of TRMM. During the transition from the TRMM era to the GPM era, it is necessary to assess GPM products and make comparisons with TRMM products in different regions to achieve a global view of the performance of GPM products. To this end, this study aims to assess the capability of the latest Integrated Multi-satellite Retrievals for GPM (IMERG) and two TRMM Multisatellite Precipitation Analysis (TMPA) products (TMPA 3B42 and TMPA 3B42RT) in estimating precipitation over Singapore that represents a typical tropical region. The evaluation was conducted at daily, monthly, seasonal and annual scales from 1 April 2014 to 31 January 2016. The capability of SPPs in detecting rainy/non-rainy days and different precipitation classes was also evaluated. The findings showed that: (1) all SPPs correlated well with measurements from gauges at the monthly scale, but moderately at the daily scale; (2) SPPs performed better in the northeast monsoon season (1 December–15 March) than in the inter-monsoon 1 (16 March–31 May), southwest monsoon (1 June–30 September) and inter-monsoon 2 (1 October–30 November) seasons; (3) IMERG had better performance in the characterization of spatial precipitation variability and precipitation detection capability compared to the TMPA products; (4) for the daily precipitation estimates, IMERG had the lowest systematic bias, followed by 3B42 and 3B42RT; and (5) most of the SPPs overestimated moderate precipitation events (1–20 mm/day), while underestimating light (0.1–1 mm/day) and heavy (>20 mm/day) precipitation events. Overall, IMERG is superior but with only slight improvement compared to the TMPA products over Singapore. This study is one of the earliest assessments of IMERG and a comparison of it with TMPA products in Singapore. Our findings were compared with existing studies conducted in other regions, and some limitations of the IMERG and TMPA products in this tropical region were identified and discussed. This study provides an added value to the understanding of the global performance of the IMERG product.

1. Introduction

Precipitation plays a significant role in affecting our environment [1]. It is one of the main freshwater resources for humans, wildlife and vegetation to sustain life. However, extremely high amounts of precipitation in a relatively short period could lead to flood events [2]. Meanwhile, a prolonged deficit precipitation period could also cause drought conditions. Therefore, understanding and monitoring of precipitation patterns is vital in reducing its negative impacts on human society and the environment [3]. Satellite precipitation products (SPPs) have been emerging as one of the most important precipitation data sources in hydrology, climatology and meteorology studies for the last few decades. These products have been successfully applied in studying global and regional precipitation patterns [4]. Applications of SPPs are rapidly increasing due to their extensive spatial coverage, continuous measurement, the fact that they are free of charge and the availability of some products in nearly real time via the internet [5]. Most importantly, the SPPs could overcome the spatial coverage limitation of point-based ground observations in less accessible mountaineous and oceanic regions [6].
The launch of the Tropical Rainfall Measuring Mission (TRMM) satellite in 1997 under a collaboration of the United States National Aeronautics and Space Administration (NASA) and the Japan Aerospace Exploration Agency (JAXA) has urged the development of various satellite-based quantitative precipitation estimates (QPE) algorithms [7]. The TRMM Multi-satellite Precipitation Analysis (TMPA) algorithm has generated two main SPPs, which are post-realtime (3B42) and near-realtime (3B42RT) products at the spatial resolution of 0.25° and three-hourly temporal resolution. These products have been widely used in different applications and regions [8,9]. However, the TRMM satellite was retired on 8 April 2015 after about 17 years in service due to fuel depletion. Given the notable successes of the TRMM, the NASA and JAXA launched the Global Precipitation Measurement (GPM) Core Observatory satellite in early 2014 to replace the TRMM satellite [10]. The Integrated Multi-satellite Retrievals for GPM (IMERG) products provide better spatial (0.1°) and temporal (30 min) resolutions than the TMPA products. In addition, the coverage of the IMERG (60°N–60°S) is also larger compared to the TMPA products (50°N–50°S).
Huffman et al. [7,11] have conducted a preliminary assessment of the IMERG and TMPA products in various regions of the world. However, more comprehensive assessments are still essential to better understand their uncertainties in different regions, time-periods, surface conditions and precipitation patterns. Therefore, assessment of the TMPA products have been widely conducted in many regions around the world [12,13,14,15]. There have been fewer accuracy assessment studies of the IMERG than those for TMPA products as the IMERG product has been released recently. Some initial assessments of the IMERG have been conducted in China [16], the Netherlands [17], Western United States [18] and the upper Blue Nile basin [19]. Most of the studies found that the product is suitable to be used in hydro-climatic applications in their regions.
Singapore is a highly populated city state located between Malaysia and Indonesia in Southeast Asia. To date, Hur et al. [20] is the only study that evaluated the performance of the TMPA 3B42 version 7 product over Singapore over a 10-year period (2000–2010). They found that the product is able to capture the general annual and monthly precipitation behavior, but fails to represent the diurnal cycle of the extreme precipitation. The small land area surrounded by ocean, which is a charateristic of Singapore, causes difficulty in studying spatial and temporal precipitation pattern using the precipitation gauges only. Therefore, the newly released IMERG product may offer an alternative source for studying precipitation pattern and behavior in this region. This study aims to conduct a preliminary assessment of the IMERG and compare it with the two TMPA products (3B42 and 3B42RT) over Singapore in estimating daily precipitation by using measured daily precipitation data from a total of 48 rain gauge stations as the reference for the common period of data availability (1 April 2014 to 31 January 2016). The findings of this study could provide not only valuable guidance for local reseachers to choose a better SPP, but also beneficial feedback to developers of satellite sensors and QPE algorithms for further improvements in SPPs.

2. Study Area and Data
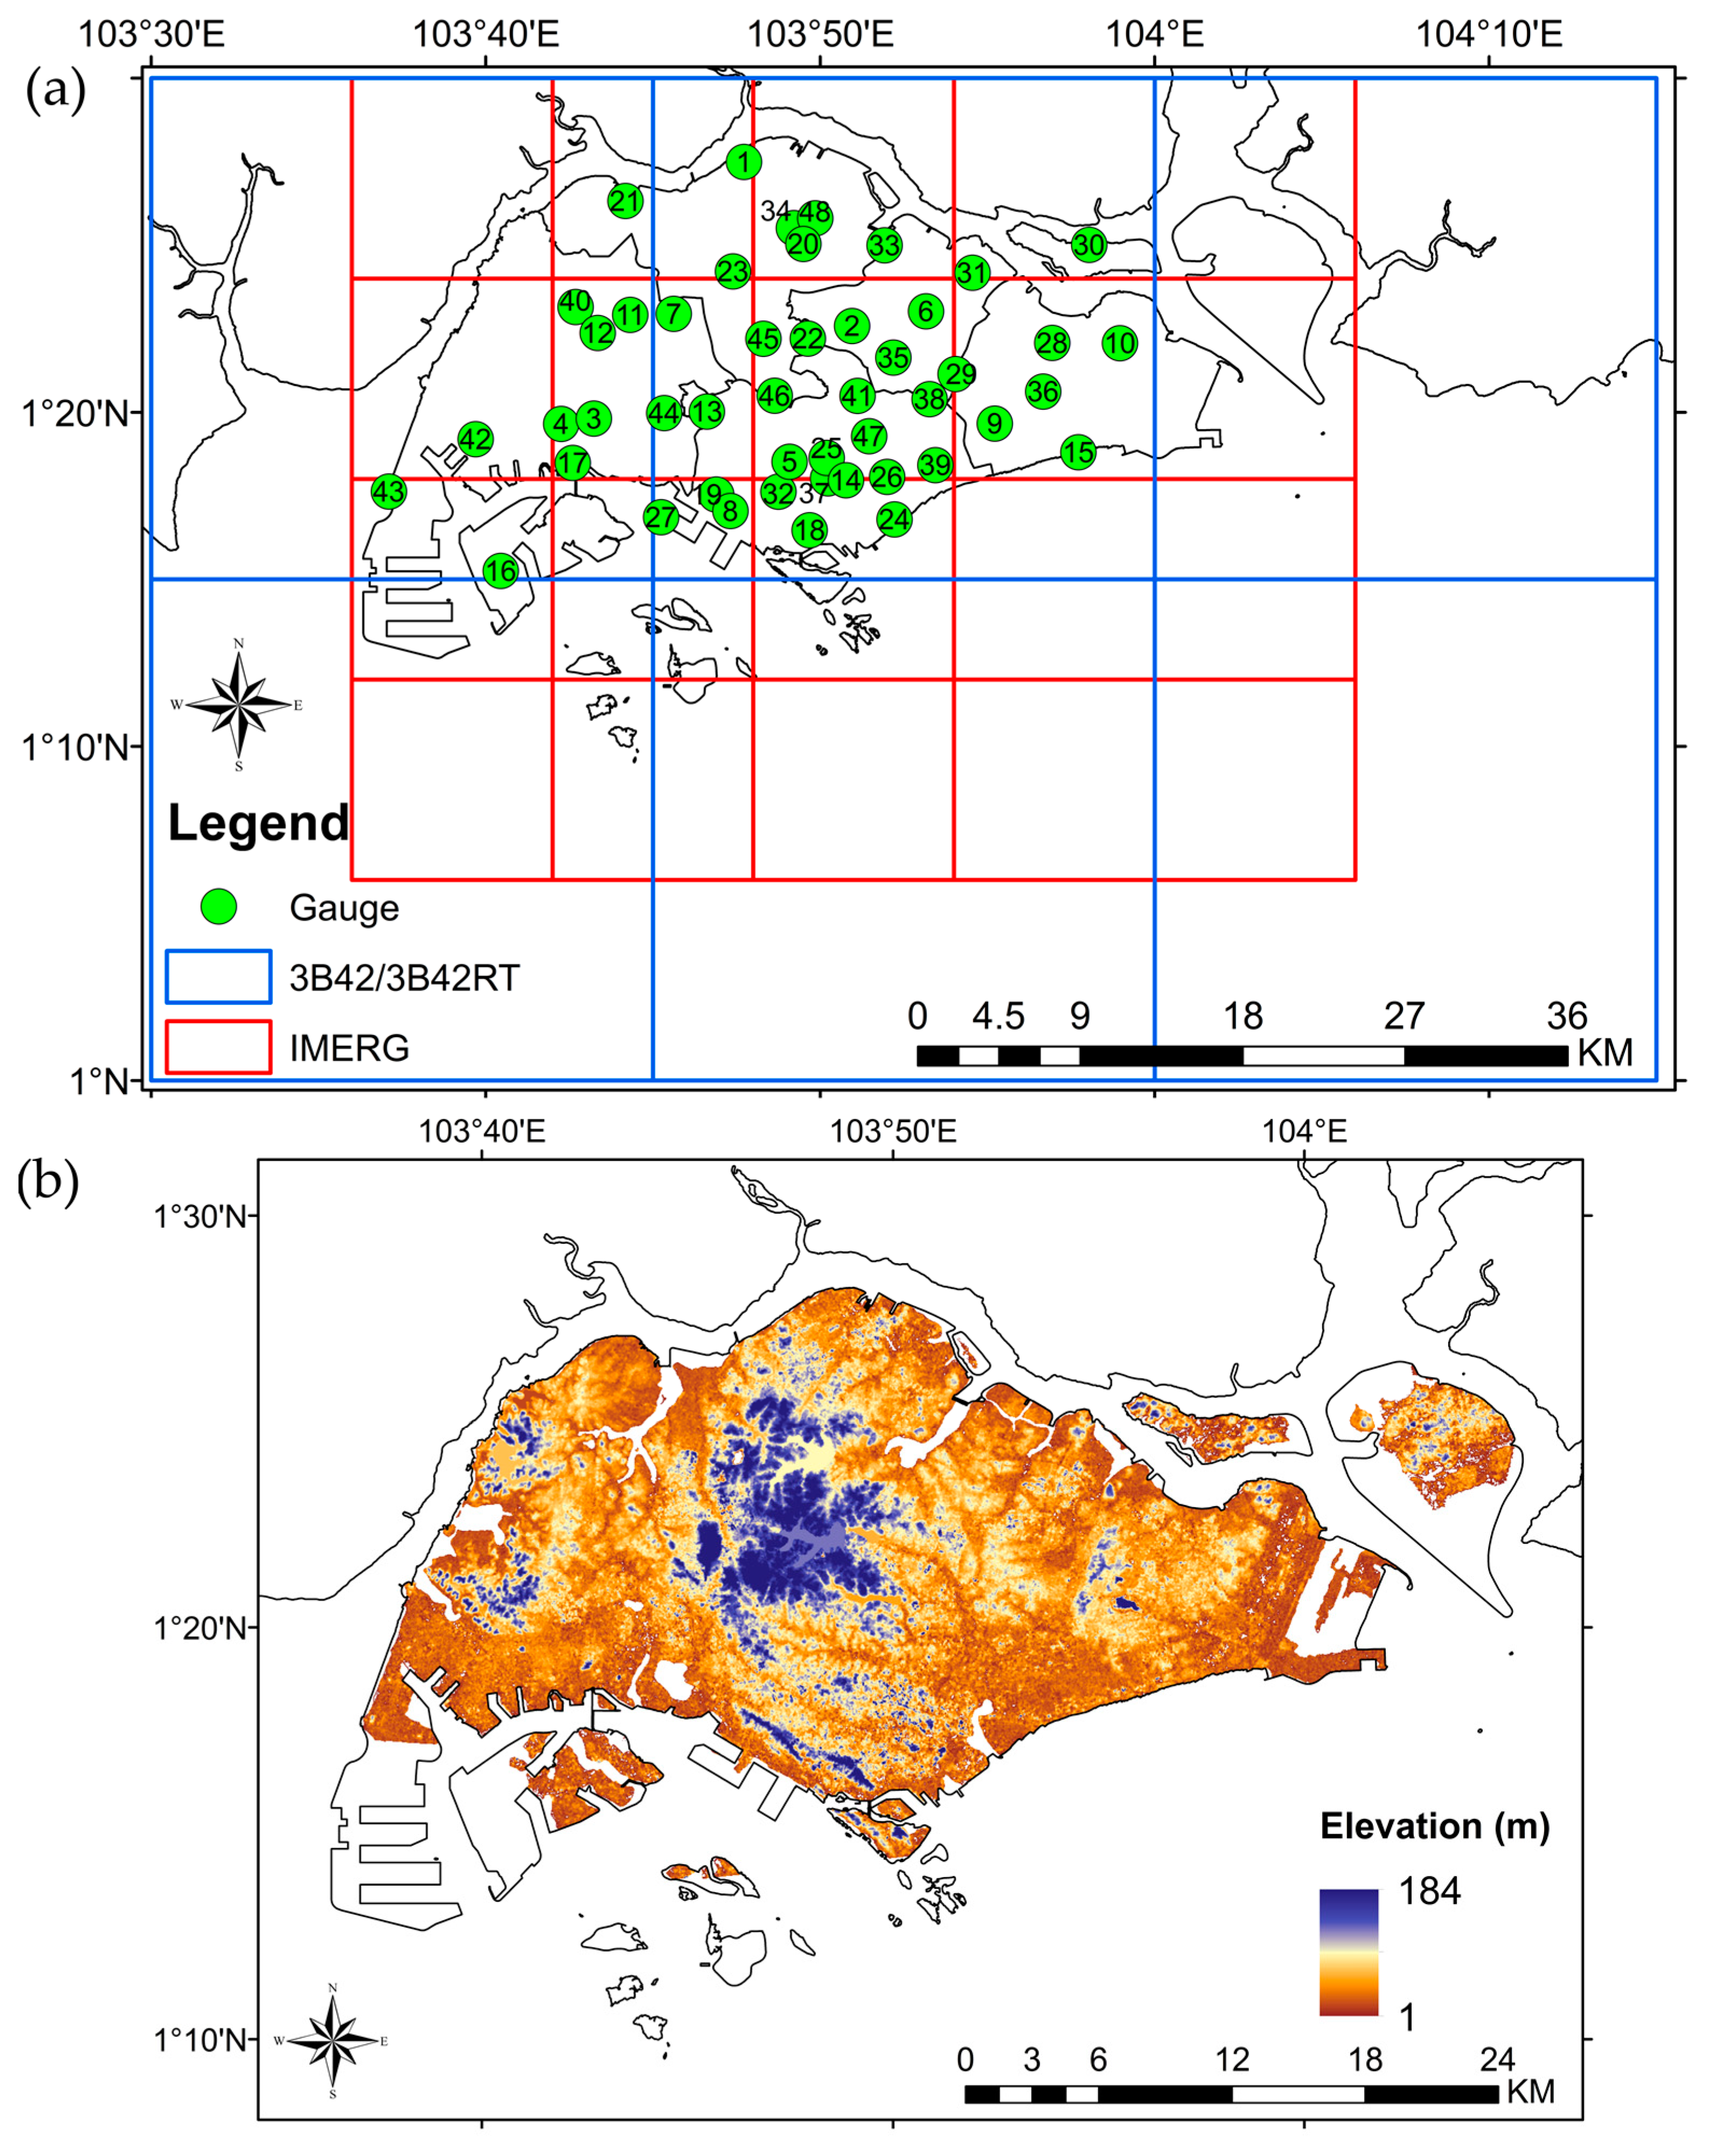
2.1. Study Area

Singapore is a diamond-shaped island, with a total land area of about 720 km2 (Figure 1a). It lies within the longitude of 103°30′~104°10′E and latitude of 1°~1°30′N. Based on the 30 m resolution digital elevation model data from Shuttle Radar Topography Mission (SRTM), most regions in the Singapore lie on less than 15 m above mean sea level (Figure 1b). The highest topography of Singapore is the Bukit Timah Hill that is located in the centre of the island. The total population in Singapore is about 5.7 million people in 2017. The Urban Redevelopment Authority (URA) has divided Singapore into five regions (West, Central, North, Northeast and East regions) to facilitate urban planning (Figure 1).
The climate of Singapore is classified as a tropical rainforest system, with high amount of annual rainfall and humidity throughout the year [21]. The uniform temperature ranges from 25 °C to 37 °C all year round. April and May are considered as the hottest months in Singapore. Generally, Singapore is influenced by two main monsoon seasons: the northeast monsoon (NEM) during December to early March and the southwest monsoon (SWM) during June to September [22]. The NEM and SWM are separated by two inter-monsoon periods, with inter-monsoon 1 and inter-monsoon 2 season spanning from 16 March to 31 May and from 1 October to 30 November, respectively. In the early NEM (wet phase), monsoon surges or strong northerly to northeasterly winds bring moderate to heavy precipitation to Singapore. On the other hand, the climate becomes relatively dry in the late NEM (dry phase) from late January to early March. Afternoon and evening thunderstorms normally occur during the two inter-monsoon periods. These thunderstorms are normally caused by the sea breeze circulation and strong surface heating. Moreover, Sumatra squalls originating from the Strait of Malacca also bring heavy precipitation for short periods in the afternoons during the SWM, which is traversing Singapore from West to East [21].

2.2. Satellite Data

2.2.1. GPM IMERG

The sensor package of GPM is an extension of TRMM and includes the first space-borne dual-frequency phased array precipitation radar (DPR) and a conical-scanning multi-channel microwave imager (GMI). The DPR observes the internal structure of storms within and under the clouds, while the GMI measures the intensity, type and size of the precipitation. The Integrated Multi-satellite Retrievals for GPM (IMERG) is the level-3 GPM’s algorithm, which integrates precipitation estimates from all constellation microwave (MW) sensors, IR-based sensors onboard geosynchronous satellites, and monthly precipitation gauge product [10].
The GPM IMERG algorithm integrates satellite retrieval from the TMPA, Climate Prediction Center MORPHing technique (CMORPH) and Percipitation Estimation from the Remotely Sensed Information Using Artificial Network (PERSIANN) [23]. These input datasets were firstly processed using the 2014 version of the Goddard Profiling Algorithm (GPROF2014). Then, the product was re-gridded into half-hourly 0.1° × 0.1° scales using Climate Prediction Center (CPC) Morphing-Kalman Filter (CMORPH-KF) Lagrangian time interpolation scheme and the PERSIANN-Cloud Classification System (PERSIANN-CCS) recalibration scheme [24]. Finally, a bias correction was conducted using monthly Global Precipitation Climatology Centre (GPCC) product to improve the accuracy of the product [23]. The original GPCC product at 1° spatial resolution is converted to the IMERG 0.1° resolution using a bilinear interpolation technique.
The IMERG provides three different types of products: (1) near real time “Early” run product; (2) near real time “Late” run product; and (3) post real time “Final” run product. The first product is available 6 h after the data retrieval period, while the second product is only released after 18 h. The “Final” product also includes the GPCC product for bias correction, and is available to the public about four months later. In this study, we evaluated the latest IMERG half-hourly final run version 4 product because the product is widely used for research purposes. The IMERG product was downloaded from the Precipitation Measurement Missions (PMM) website (http://pmm.nasa.gov/data-access/downloads/gpm). The Singapore precipitation gauges measure daily precipitation at 12 a.m. midnight local time, which is equivalent to 1600 Coordinated Universal Time (UTC). The half-hourly IMERG data were converted to daily local timescale by summing all the 48 half-hourly data from 1600 to 1600 UTC. The daily accumulation of 48 hour-hourly precipitation is then multiplied by a factor of 0.5 because the unit of the half-hourly data is in mm/h.

2.2.2. TMPA Products

The TRMM is a Low Earth Orbit (LEO) satellite that is mainly used to study the characteristics of tropical and sub-tropical precipitation. The satellite is equipped with various sensors such as the precipitation radar TRMM Microwave Imager (TMI), Lightening Imaging Sensor (LIS) and Visible and Infrared Sensor (VIRS). The TMPA algorithm contains various precipitation estimates from various passive microwave (PMW) sensors, microwave-adjusted merged geo-IR and monthly GPCC products [7]. There are four steps in the TMPA production: (1) the optimal values from the PMW observations were estimated using the version 2010 GPROF Algorithm (GPROF2010); (2) the optimal values were used to create Geo-IR precipitation estimates; (3) the PMW and Geo-IR estimates were combined inter-compatibly, and; (4) the combined values with the GPCC data were re-scaled and calibrated.
The TMPA 3B42 product provides three-hourly (3B42), daily (3B42 derived) and monthly (3B43) precipitation at 0.25° spatial resolution from 1998 to the present. Among the TMPA products, the version 7 daily-scale 3B42 (post-processing) and 3B42RT (real-time) products, which were released in May 2012, have been widely used in hydro-climatic studies. The real-time product, 3B42RT applies the previous 30 days of TRMM Combined Instrument (TMI) dataset for calibration purposes, and this product is available after about 8 h from satellite acquisition. Similar to the GPM IMERG, the GPCC monthly gauge precipitation product is used to calibrate the 3B42 for better precipitation estimation, however, the product is only released 10–15 days after the end of each month. The TMPA product will be available until early 2018. The TMPA 3B42 and 3B42RT products were downloaded from the same website with the IMERG product as mentioned above. To match with the daily precipitation gauge data, the 3-hourly TMPA products were accumulated to daily values at 1600 UTC. There are eight TMPA files (00z, 03z, 06z, 09z, 12z, 15z, 18z and 21z) for a specific day, where the 15z file represents precipitation data from 1430 UTC to 1630 UTC. The three-hourly precipitation rates in these files were firstly converted to hourly precipitation rate by multiplying a factor of three. Then, a ratio of 5/6 (0.83) weight was applied to each 15z file to obtain 1600 UTC data [25].

2.3. Ground Data

The measured daily precipitation from a total of 48 precipitation gauges that are well distributed over Singapore (Figure 1) from 1 April 2014 to 31 January 2016 were used in this study. The measured precipitation data are freely available from the Meteorological Service Singapore at http://www.weather.gov.sg/climate-historical-daily/. The daily precipitation data were collected from midnight to midnight Singapore local time [26]. These precipitation gauges were selected due to their low missing data (<5%). Generally, 39 precipitation gauges had less than 1% missing data, while another seven precipitation gauges have missing values ranged between 1% and 2%. The missing values of the remaining two precipitation gauges are more than 4%. The missing data were then filled with the precipitation data from the nearest adjacent station [27].
It is essential to make sure that precipitation gauges taken as the reference should not have been previously applied in the creation or calibration of the SPPs. This is to clarify that the used precipitation gauges are independent from the SPPs’ development for a reliable evaluation [28]. However, the information of the exact locations information of the precipitation gauges applied in the SPPs’ calibration is usually not made available to the public, but the number of the used stations within each grid is provided. We found that both Singapore and southern Peninsular Malaysia were covered by a GPCC grid (1° × 1°) only. Only one precipitation gauge was found within this grid. Therefore, about 98% of the precipitation gauges in this study were not used in the generation of GPCC monitoring product. Hence, most of the 48 precipitation gauges were excluded from the bias correction in the IMERG and TMPA products; this justifies the independent evaluation carried out in this work.

3. Methods

For comparing the precipitation values between SPPs and ground-based observations, the mismatch in the spatial scales between two products is always a critical issue and needs to be carefully considered. This is mainly because the SPPs’ precipitation values are available at the grid-scale (i.e., 0.1° and 0.25° for IMERG and two TMPA products in this study, respectively), while measurements from precipitation gauges represent precipitation at point scale. For comparison, one common way is to upscale point-based precipitation data from gauges to the same grid scale as SPPs, either by spatial interpolation or simply averaging [29,30]. This is the concept of pixel-to-pixel or grid-to-grid evaluation appproach. However, some researchers have argued that interpolation might bring to some uncertainties due to precipitation gauges’ density, systematic error and uncertainties associated with different interpolation method. It has been highlighted by Duan et al. [28] that investigating the effect of different interporpolation methods used in upscaling precipitation data from gauges on the evaluation of SPPs would be an interesting topic for future studies. In this study, we adopted the simple averaging method to upscale the point-based precipitation from gauges to the grid-scale for the IMERG and two TMPA products. For assessment of these three SPPs, we considered only the grids that cover at least one precipitation gauge [31,32,33], and other grids covering no precipitation gauges were excluded from the evaluation.
Four widely applied statistical metrics, that is, Correlation Coefficient (CC), Root Mean Square Error (RMSE), Relative Bias (RB) and Bias (Bias) [5], were computed to quantatively evaluate the three SPPs. The CC was used to evaluate the degree of agreement between SPP and gauge data, with values ranging from −1 to 1. Positive CC values indicate positive correlation, while negative values show negative correlation. The RMSE was used to represent the average error magnitude. The RB and bias were applied to evaluate the systematic bias between SPP and gauge data in percentage and precipitation amount, respectively. Overestimation of precipitation estimation is represented as positive RB or Bias values, and vice versa. These statistical metrics were calculated as follows:
C C = i = 1 n ( O i O ¯ ) ( S i S ¯ ) i = 1 n ( O i O ¯ ) 2 · i = 1 n ( S i S ¯ ) 2
RMSE = 1 n i = 1 n ( S i O i ) 2
R B = i = 1 n ( S i O i ) i = 1 n O i ( 100 )
Bias = i = 1 n ( S i O i ) n
where S refers to the satellite measurement, O refers to the gauge measurement, and n is the number of sample. Based on Brown [34] and Condom et al. [35], an acceptable performance of SPPs should be charaterized with RB value ranging from −10% to 10%, and a CC value of more than 0.7. For seasonal analysis, we divided the year to the following four seasons: the NEM (1 December to 15 March); inter-monsoon 1 (16 March to 31 May); SWM (1 June to 30 September), and; inter-monsoon 2 (1 October to 30 November). To evaluate the probability density function (PDF), we classified the precipitation amounts into eight categories following the World Meteorological Organization (WMO) standard with slight modification [36]: (1) 0 to 0.1 mm/day; (2) 0.1 to 1 mm/day; (3) 1 to 2 mm/day; (4) 2 to 5 mm/day; (5) 5 to 10 mm/day; (6) 10 to 20 mm/day; (7) 20 to 50 mm/day, and; (8) >50 mm/day.
The categorical statistical metrics including Probability of Detection (POD), False Alarm Ratio (FAR) and Critical Success Index (CSI) were used to detect the SPPs’ precipitation detection ability [37]. The POD measures the ratio of the number of precipitation correctly detected by the SPPs to the total number of actual precipitation events. The FAR evaluates the ratio of the number of precipitation falsely detected by the SPPs to the total observed events. The CSI, being a function of POD and FAR, has a more balance score. The precipitation day threshold was set as 1 mm/day. These categorical statistical metrics were computed as follows:
POD = Hits Hits + Misses
FAR = FalseAlarm Hits + FalseAlarm
CSI = Hits Hits + FalseAlarm + Misses
where Hits refers to the number of observed precipitation correctly detected by SPPs; False Alarm means the number of the precipitation detected by SPPs, but not observed by precipitation gauge; Misses refers to the number of the precipitation observed by precipitation gauges but not detected by SPPs [28]. The perfect score for the POD and CSI is 1, while the FAR is 0. Due to the difference in spatial resolution among SPPs (Figure 1), the comparisons were carried out by grid-to-grid approach [38], where the satellite grid containing no precipitation gauges was excluded from the evaluation. Then, precipitation values of precipitation gauges within a specific grid were averaged and compared with the respective SPPs’ grid values. Besides that, the total annual precipitation measured by precipitation gauges in 2015 was interpolated using the inverse distance weighting (IDW) method to generate precipitation map at the spatial resolution of 0.01° for spatial variability assessment [39,40]. The interpolated precipitation map was then compared with the three SPPs through visualization analysis.

4. Results

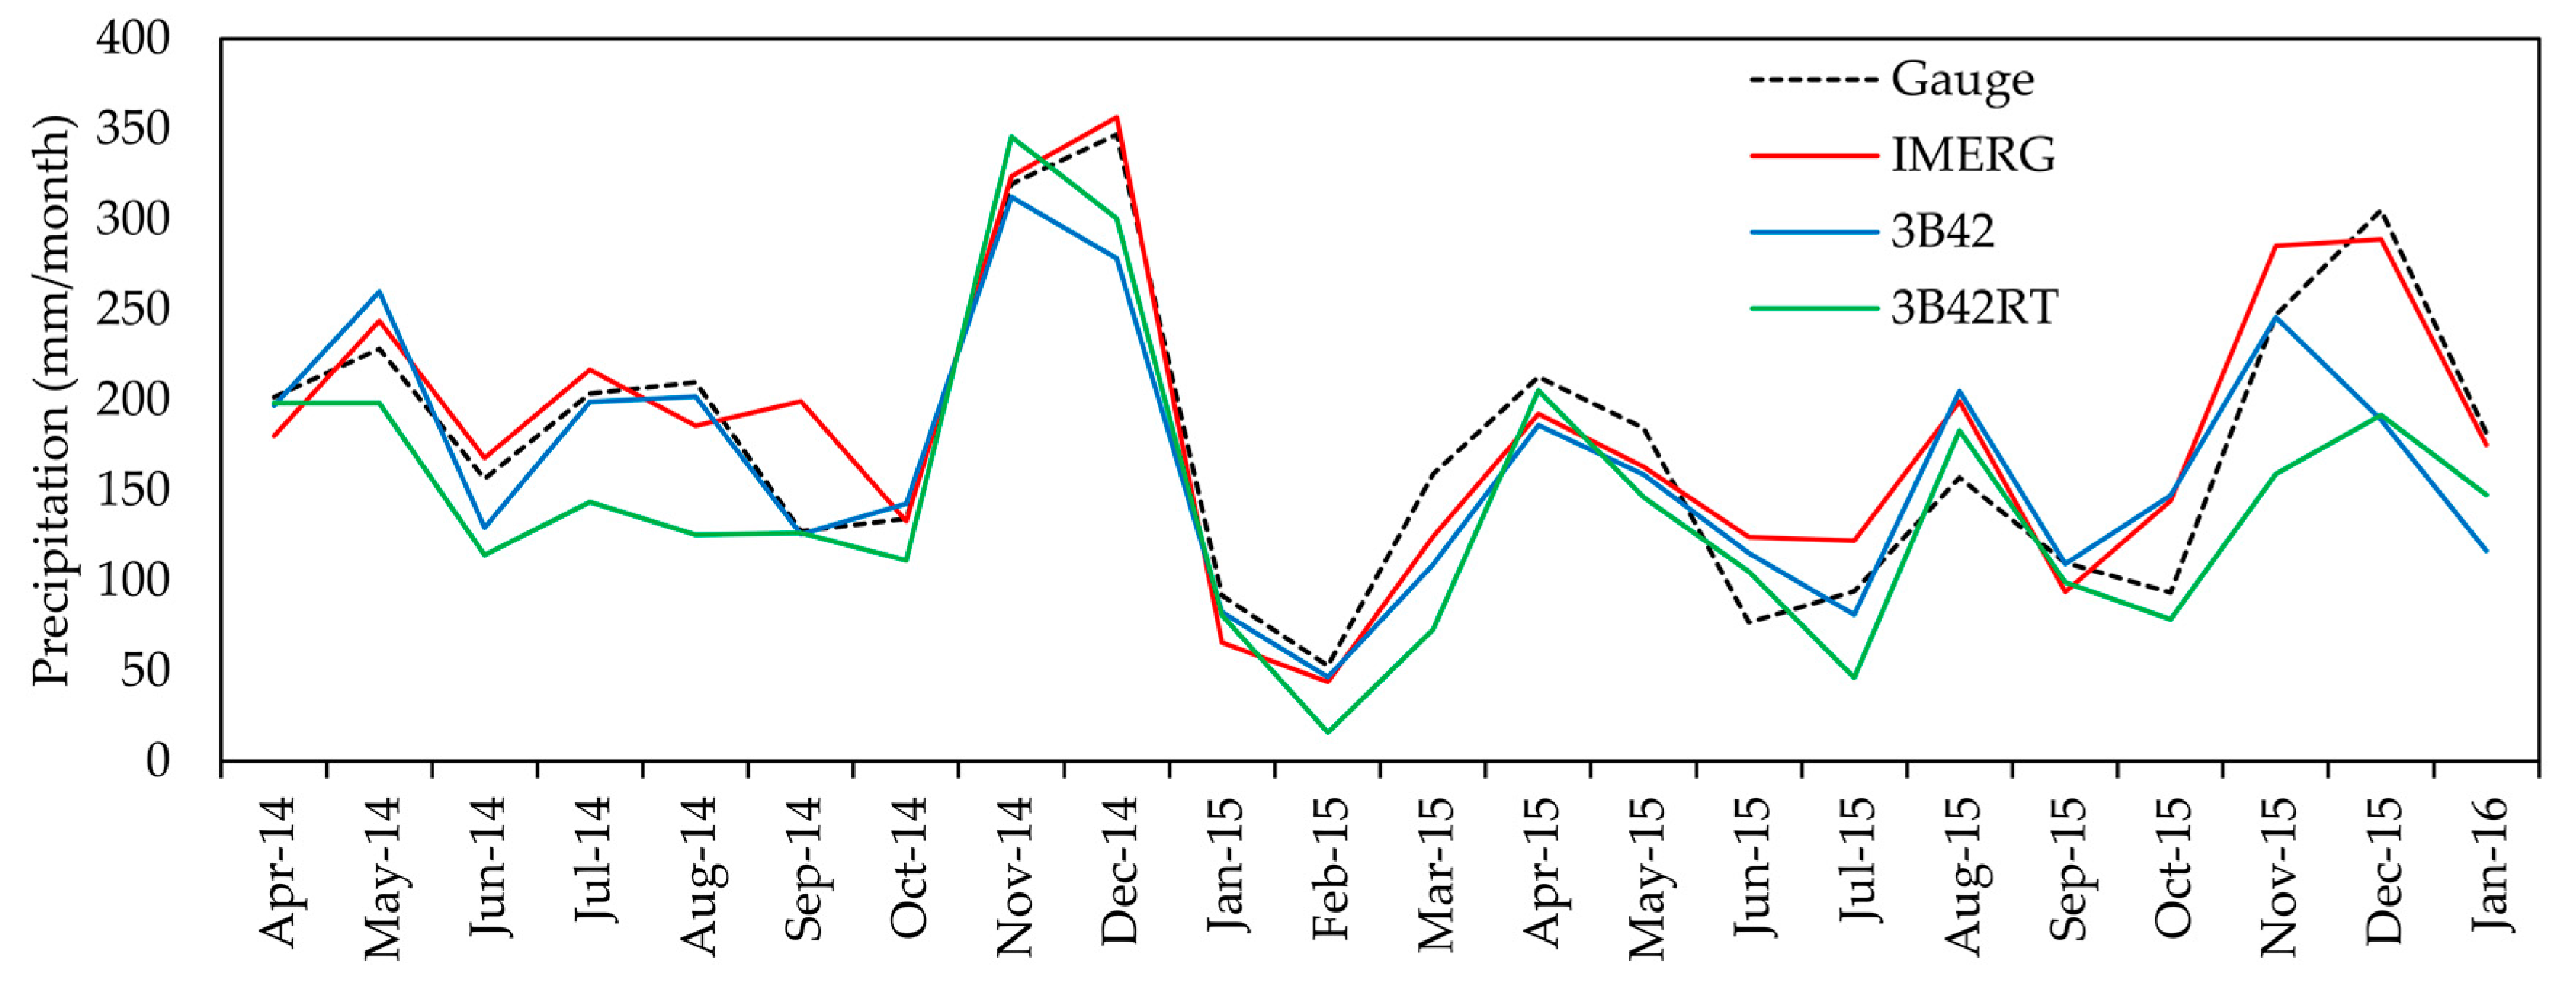
4.1. Annual and Monthly Assessment

The average total annual precipitation from 48 gauges in 2015 is 1782.53 mm/year. Figure 2 shows most of the SPPs underestimated the total annual precipitation, except for the IMERG. The 3B42 shows the smallest underestimation (6.08%), followed by the 3B42RT (22.47%). By contrast, the IMERG overestimates the total annual precipitation by 3.54%. Generally, the total annual precipitation in 2015 was lower than the normal condition (defined as ~2300 mm/year) due to the strong El Niño events. The 2015 year is considered as the second driest year in the Singapore’s historical records, after 1997 [41]. Singapore started to experience warmer condition after the formation of El Niño in the middle of 2015, where the average monthly temperatures in July and December were higher than those in 1997.
The spatial pattern of the 2015 total annual precipitation of the gauges and three SPPs is shown in Figure 3. The total annual precipitation from the gauge measurement indicates a decreasing trend from west to east, which is consistent with all three SPPs. Despite the fact that Singapore is covered by a very limited number of grids, IMERG showed a similar west-to-east decreasing trend in the annual precipitation. A higher total annual precipitation patterns in Western regions, particularly about 2000 mm/year, were captured by the IMERG. Similar to the gauge-measured map, the IMERG exhibited the lower total annual precipitation over the Northern and Eastern regions, and higher precipitation in the Western and Southern regions. In contrast, only two grids from TMPA products over Singapore, thereby making it unsuitable to detect spatial variability of precipitation in Singapore.
Figure 4 shows the comparison of monthly precipitation from gauges and three SPPs from April 2014 to January 2016. All SPPs capture the temporal trend of monthly precipitation quite well. For example, all products captured high monthly precipitation in November and December 2014, and low monthly precipitation in February 2015. Generally, IMERG showed better performance than other two SPPs with higher CC (0.82) and lower RMSE (54.75 mm/month), RB (5.24%) and Bias (6.7 mm/month) values, as listed in Table 1. The TMPA products also had good correlation with the measured precipitation from gauges with the CC value of 0.79. However, the 3B42 and 3B42RT underestimated the observed precipitation with the RB by 10.25% to 21.77%, respectively.

4.2. Daily Assessment

Table 2 shows the statistical metrics of daily precipitation estimates from IMERG, 3B42 and 3B42RT in the whole and seasonal time periods. Most of the SPPs tend to underestimate daily precipitation from 1 April 2014 to 31 January 2016, except for the IMERG. 3B42 has a better CC value of 0.56, followed by the IMERG (0.53) and 3B42RT (0.53). However, the CC values show that the three SPPs have moderate correlation with the gauges. The RMSE values of the SPPs ranged from 9.1 mm/day to 11.83 mm/day. The SPPs show an overall good performance in precipitation detection ability, with the IMERG (POD = 0.78), followed by the 3B42 (POD = 0.66) and 3B42RT (POD = 0.65). This result is similar to that reported by Tan et al. [36], where the 3B42 had a POD value of 0.76 in Malaysia. In term of the metric FAR, the 3B42 and 3B42RT performed better by having a false detection of 15% and 16% of the time, respectively.
Similar evaluation was carried out to assess the performance of daily precipitation estimates from three SPPs in four seasons as mentioned in Section 2.1. Generally, the SPPs have better performance in the NEM and SWM compared to the IM1 and IM2. In the NEM and SWM, the 3B42 performed better than those of IMERG and 3B42RT. Moreover, the 3B42RT tended to underestimate daily precipitation in both seasons. All SPPs underestimated daily precipitation in NEM and IM1 seasons. In terms of precipitation detection capability, the IMERG had the best performance in all four seasons, with the CSI values ranging from 0.54 to 0.64.

4.3. Precipitation Intensity Assessment

The precipitation frequency distribution of gauges and three SPPs in Singapore is shown in Figure 5. In Singapore, low precipitation intensity (less than 1 mm/day) accounts for 62% of the total precipitation events. Only about 10% of the precipitation events are categorized as heavy to extreme precipitation (≥20 mm/day). Generally, most of the SPPs underestimated light and heavy precipitation events, with the precipitation intensity of 0.1–1 mm/day and >20 mm/day, respectively. By contrast, all SPPs tended to overestimate the moderate precipitation events with the intensity ranging from 1 to 20 mm/day.
As far as the performance of SPPs in the four seasons is concerned, the IMERG showed a slight overestimation for the precipitation class with an intensity of 0.1–1 mm/day in the NEM. Interestingly, the 3B42 and 3B42RT did not capture any extreme precipitation events (>50 mm/day) during the NEM period. The IMERG is the only SPP that underestimated the non-precipitation events for all four seasons. On the other hand, the 3B42RT missed most of the extreme precipitation events for all four seasons, indicating that this product is not suitable for studying extreme flood events in Singapore. For example, Figure 5a shows the 3B42RT estimated the extreme precipitation events by 0.67%, while the gauges estimated by 1.8%.

5. Discussion

Generally, the performance of the IMERG is almost similar to that of TRMM products in Singapore, which is consistent with findings in China [38], the Tibetan Plateau [37,42], Iran [43], India [44], Japan and Korea [39]. For instance, the IMERG slightly improves the daily POD value by 0.12 as compared to the 3B42 product. The better performance of IMERG could be mainly due to the fact that the GPM combined Instrument (GMI) sensor can capture light precipitation better than the TRMM combined Instrument (TMI) [42,45]. The sensors on the GMI added four channels (10–183 GHz) compared to the nine channels (10–85.5 GHz) on the TMI [10]. Furthermore, the DPR onboard the GPM satellite uses the Ku band and the Ka band (35.3 GHz), while the PR onboard the TRMM satellite only applied the Ku band (35.3 GHz). The better performance of the IMERG could also be due to the improvements in the spatial and temporal resolutions. The GPM has a shorter temporal resolution of 30 min observation, while the TRMM estimates every three-hourly precipitation with the inability in observing the precipitation events in between. The shorter time-scale estimation capability is very useful in capturing short-lived precipitation that commonly occurs in Singapore. Compared to the coarse resolution (0.25°) of the TMPA products, the GPM’s finer spatial resolution (0.1°) undoubtedly increases the possibilities in observing precipitation in small spatial-scale precipitation events, thus making it more suitable for detecting precipitation over small regions.
To put our study in context, we compared our findings with existing studies that evaluated the performance of daily precipitation estimates from IMERG. The comparison is presented in Table 3. Most of the IMERG assessment studies were conducted in Asia. It should be noted that several other IMERG assessment studies were conducted in Western countries, for example, [17,18], but they did not perform the daily scale assessment and were therefore excluded from this comparison. To date, the IMERG’s daily precipitation was found to have a very good correlation with ground-based precipitation in China [16,38,46]. By contrast, moderate correlation was found in Singapore by this study, in Blue Nile basin by Sahlu et al. [19], in Japan and in Korea by Kim et al. [39]. This could be due to the fact that the number of gauges used in the GPCC product development is higher in China compared to other regions. This result may also be explained by the overestimation in light to moderate precipitation events (0.1 to 20 mm/day) by the IMERG in Singapore, as shown in Figure 5. Another possible explanation for this is that the GPROF2014 applied in the IMERG products may still poorly represent the coastline regions. The prior database of the GPROF2014 was constructed from ground-based radars that tend to underestimate precipitation off the coast [47].
The correlation between all three evaluated SPPs and measurements from gauges is still moderate in daily precipitation estimation. A possible explanation is the limited number of gauges used in the negation of the GPCC monthly monitoring product that was used in the bias correction for both TMPA and IMERG products. We found that the GPCC monitoring product in 2015 covering Singapore and southern Peninsular Malaysia only contains one gauge, which will lead to under-representative and biased precipitation. Due to the international agreement, the GPCC developer is not allowed to report the exact location of the gauges applied in the GPCC product development [48]. However, we can confirm that the number of gauges that applied in the SPPs bias correction in Singapore is either only one gauge or no gauge, as the station could be located in southern Peninsular Malaysia. In order to dramatically improve the IMERG products, a more reliable ground-based precipitation product with more gauge stations in Singapore and at a finer time-scale (e.g., daily or hourly scales) should be developed and applied in the SPPs’ bias correction. A regional-based bias correction is recommended to be applied in the original SPPs with measured precipitation from local gauges if available to achieve improved daily precipitation data.

6. Conclusions

In this study, we conducted a preliminary assessment of three satellite precipitation products (SPPs), namely, GPM IMERG, TMPA 3B42 and TMPA 3B42RT products, in estimating annual, seasonal, monthly and daily precipitation over Singapore using measurements from 48 gauges for a common period from April 2014 to January 2016. The location of Singapore enables it to act as a representative tropical assessment site, which provides feedback on the performance of current SPPs’ to algorithm and sensor developers and further provides valuable guidance for future improvements. This study could also act as a reference for researchers who wish to apply or evaluate various SPPs in nearby countries such as Malaysia, Thailand, Philippines and Indonesia. The conclusions drawn from this study are summarized as follows:
(1)
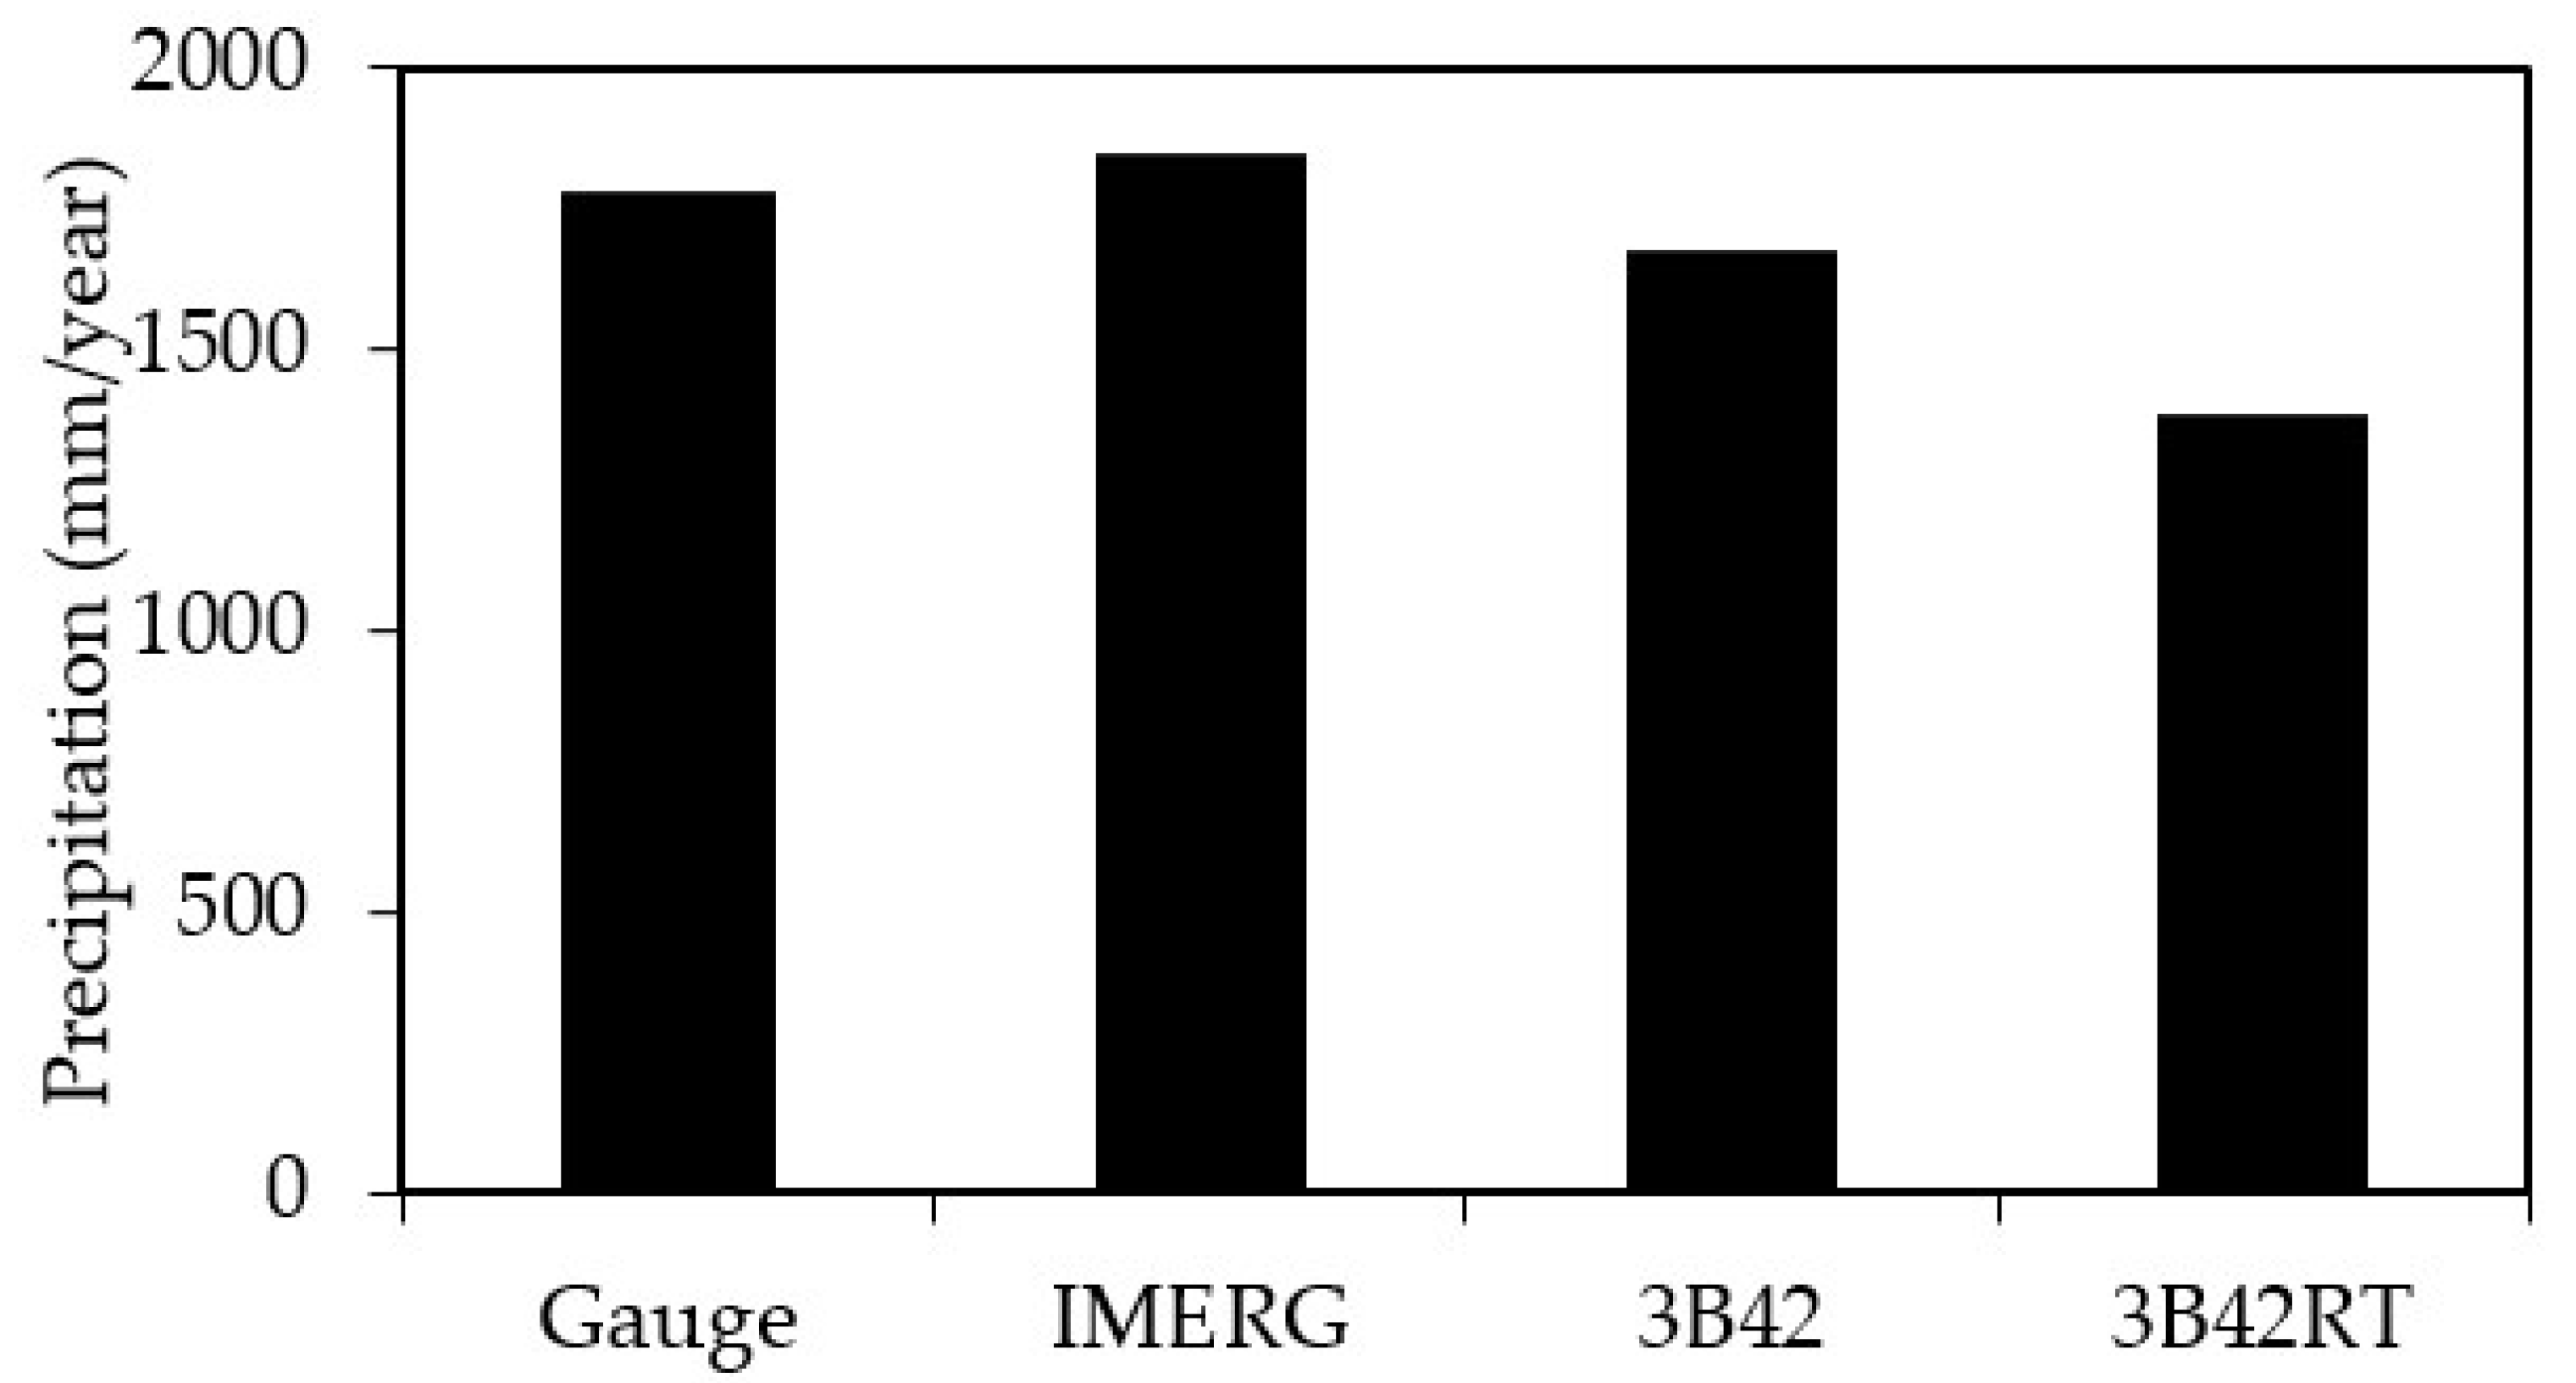
Most of the SPPs performed well in annual and montly precipitation estimation, except for the 3B42RT. The IMERG slightly overestimated the annual and monthly precipitation, while the TMPA products undrestimated the measured precipitation.
(2)
The IMERG performed slightly better than TMPA products in detecting daily precipitation over Singapore. Generally, the 3B42RT performed the worst among the evaluated SPPs, while the IMERG showed the best performance in precipitation detection capability. As far as the performance of SPPs in different seasons is concerned, the SPPs showed better performance in the northeast moonson (1 December to 15 March) than in the inter-monsoon 1 (16 March to 31 May), southwest monsoon (1 June to 30 September) and inter-monsoon 2 (1 October to 30 November).
(3)
The correlation between measurements from gauges and IMERG at the daily scale is moderate, which is consistent with the findings reported in the Blue Nile basin [19], Japan and Korea [39]. However, the finding is in contrast with previous studies, which suggested very good correlation of IMERG product in China [16,38,46]. This again highlights varying the performance of SPPs over regions, wich needs more local evaluation studies to achieve a better global view of the accuracy of SPPs.
(4)
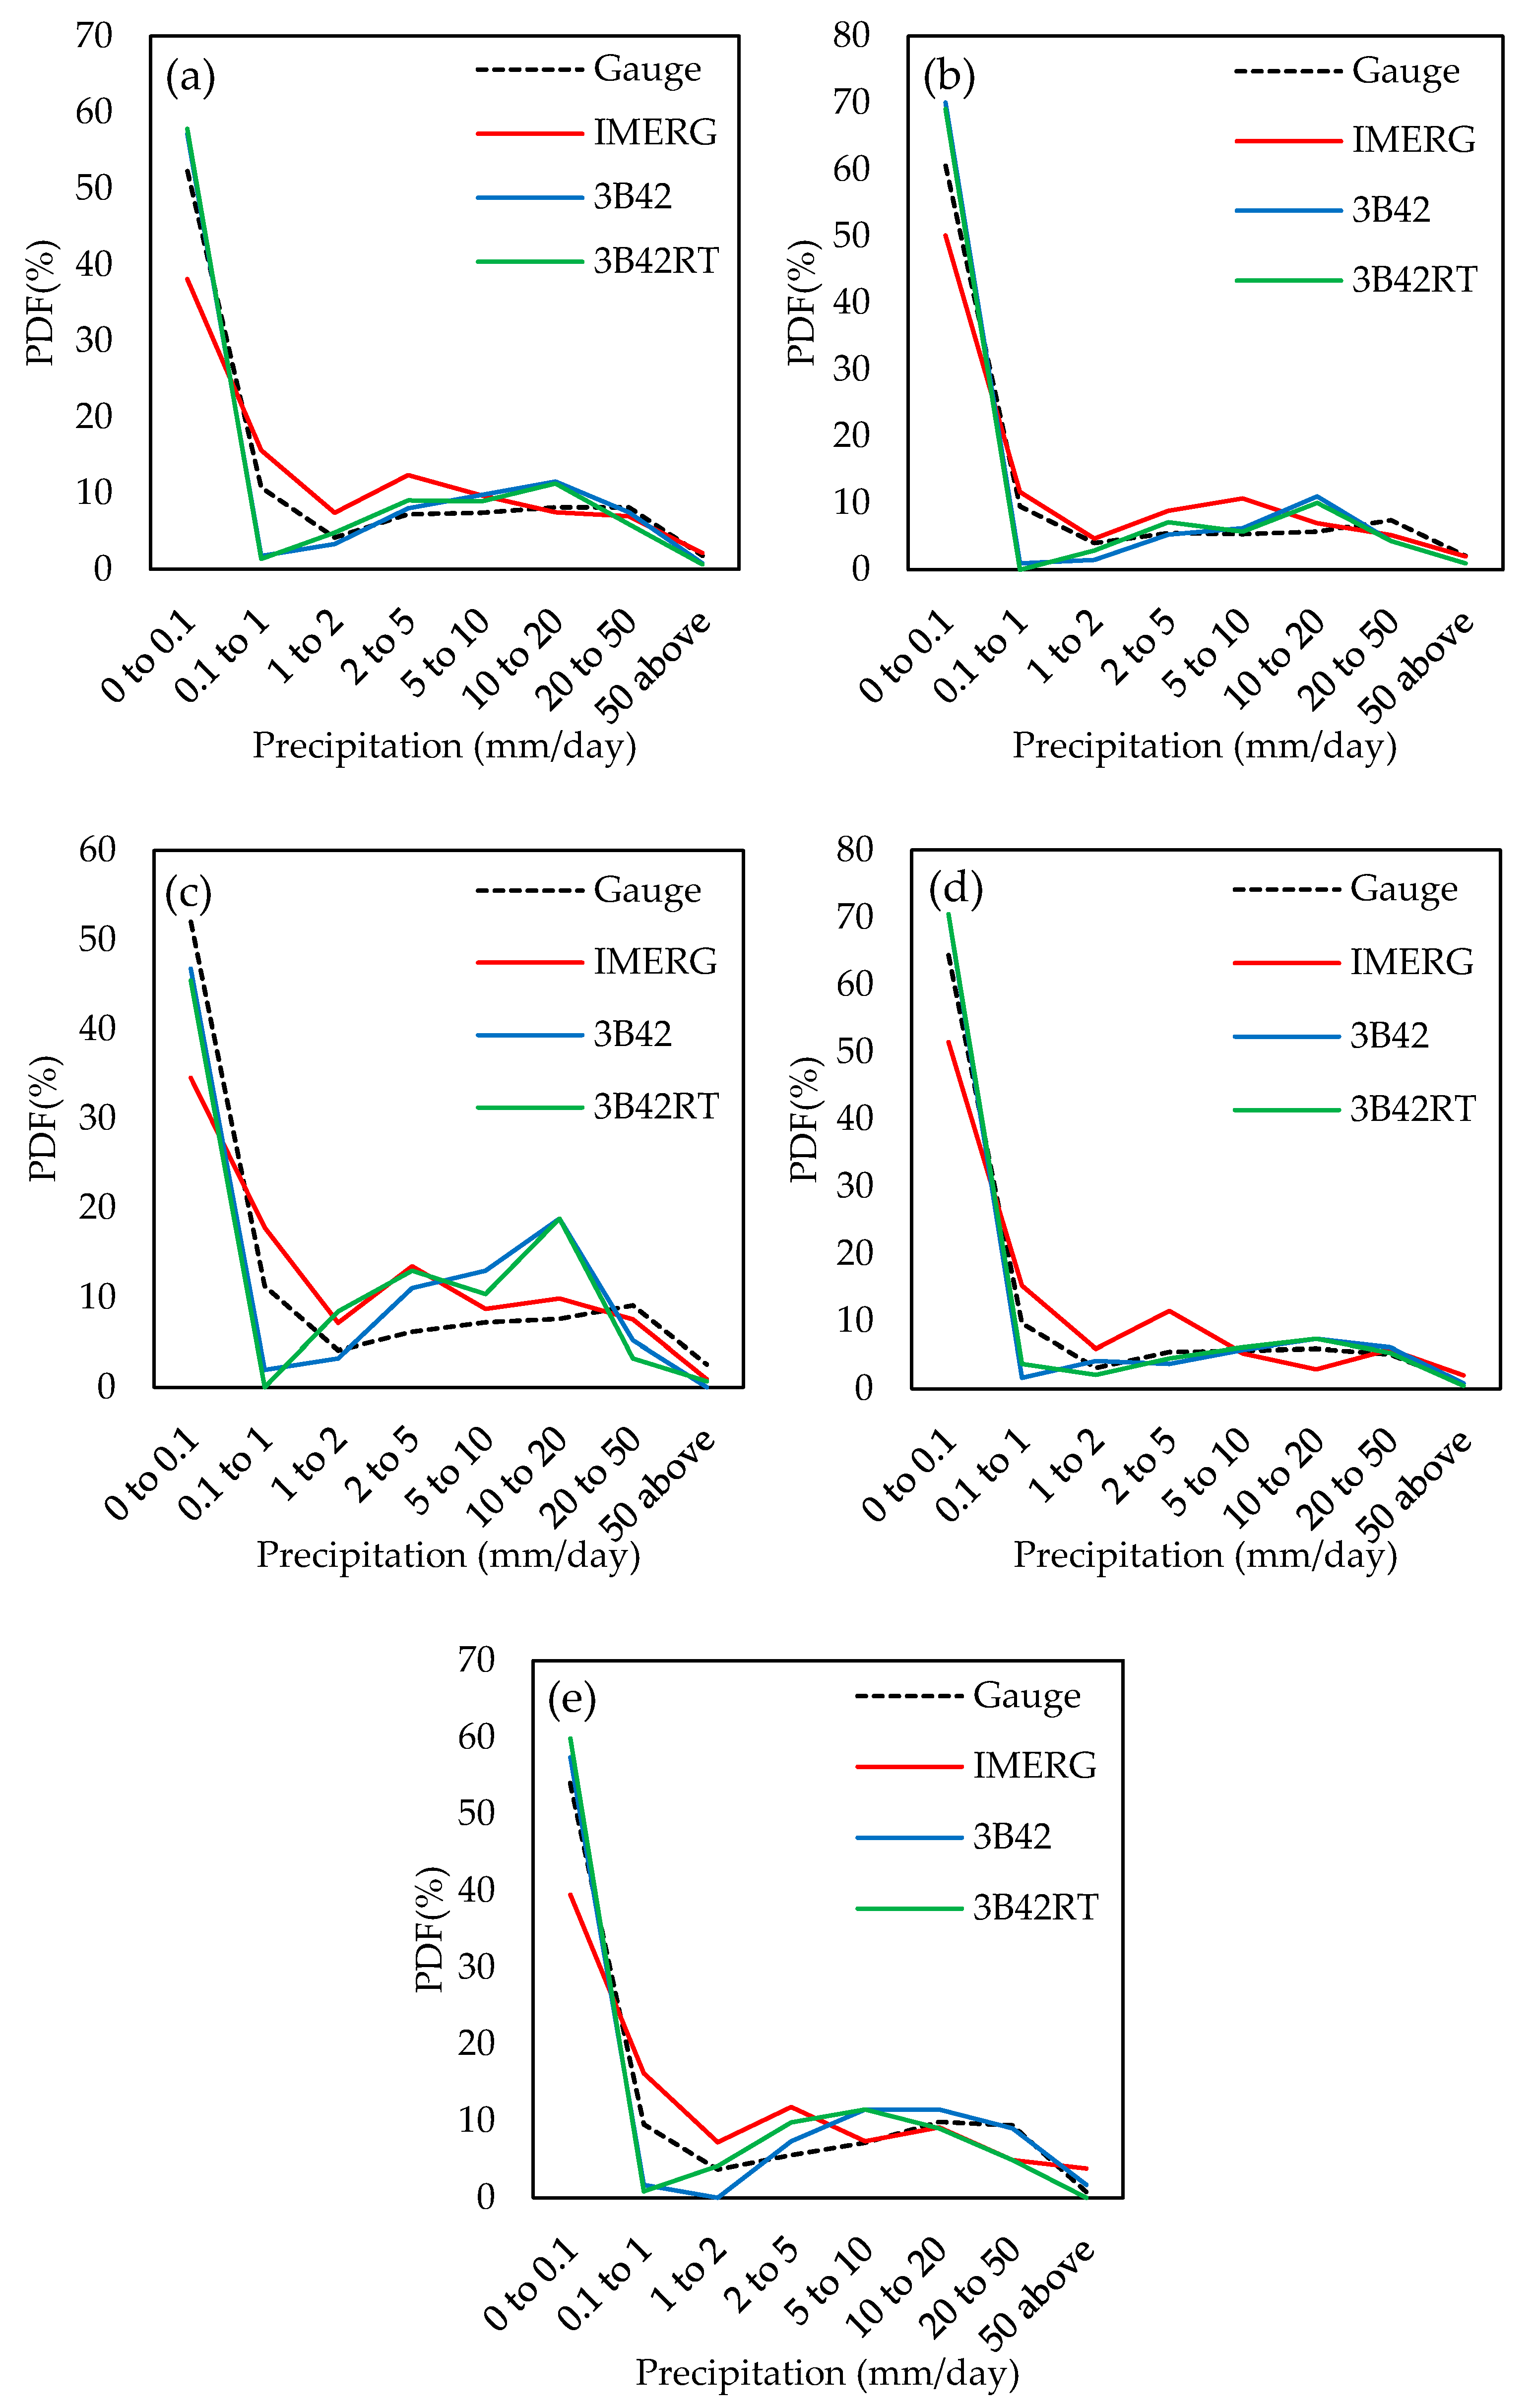
For the precipitation probability density function analysis, most of the SPPs overestimated moderate precipitation events (1–20 mm/day). All three SPPs tended to underestimate light (0.1–1 mm/day) and heavy (>20 mm/day) precipitation events over Singapore, which is similar to the findings reported in Malaysia [36].
Overall, this study showed the IMERG did not show significant improvement compared to the TMPA products. However, it has finer spatial and temporal resolutions than TMPA, which in principle would favor its use in small basins and flood studies. Given the moderate performance of all SPPs in daily preciptation estimates, the monthly and annual precipitation estimates from SPPs are better suitable to be used for related applications in Singapore. We recommend that an additional bias correction should be conducted to daily precipitation estimates from SPPs for achieving improved products before applying them to any research and operational work. Therefore, future research should be carried out to establish efficient regional SPP bias-correation algorithms. Finally, the capability of SPPs in hydrological and flood modelling as well as drought monitoring should also be evaluated in the future.

Acknowledgments

We acknowledge the Meteorological Service Singapore for providing the ground-based precipitation data. We thank all organizations for providing the GPM and TRMM products freely to public. This work was supported by the German Research Foundation (DFG) and the Technical University of Munich (TUM) in the framework of the Open Access Publishing Program.

Author Contributions

All authors contributed extensively in this study. Mou Leong Tan conceived and designed the framework and wrote the manuscript. Zheng Duan provided constructive comments and revised the manuscript.

Conflicts of Interest

The authors declare no conflict of interest.

References

  1. Tan, M.L.; Ibrahim, A.L.; Cracknell, A.P.; Yusop, Z. Changes in precipitation extremes over the Kelantan River Basin, Malaysia. Int. J. Climatol. 2016. [Google Scholar] [CrossRef]
  2. Tan, M.L.; Ibrahim, A.L.; Yusop, Z.; Chua, V.P.; Chan, N.W. Climate change impacts under CMIP5 RCP scenarios on water resources of the Kelantan River Basin, Malaysia. Atmos. Res. 2017, 189, 1–10. [Google Scholar] [CrossRef]
  3. Li, C.; Wang, R. Recent changes of precipitation in Gansu, Northwest China: An index-based analysis. Theor. Appl. Climatol. 2017, 129, 397–412. [Google Scholar] [CrossRef]
  4. Varikoden, H.; Preethi, B.; Samah, A.A.; Babu, C.A. Seasonal variation of rainfall characteristics in different intensity classes over Peninsular Malaysia. J. Hydrol. 2011, 404, 99–108. [Google Scholar] [CrossRef]
  5. Tan, M.L.; Tan, K.C.; Chua, V.P.; Chan, N.W. Evaluation of TRMM product for monitoring drought in the Kelantan River Basin, Malaysia. Water 2017, 9, 57. [Google Scholar] [CrossRef]
  6. Tan, M.L.; Gassman, P.W.; Cracknell, A.P. Assessment of three long-term gridded climate products for hydro-climatic simulations in tropical river basins. Water 2017, 9, 229. [Google Scholar] [CrossRef]
  7. Huffman, G.J.; Adler, R.F.; Bolvin, D.T.; Gu, G.J.; Nelkin, E.J.; Bowman, K.P.; Hong, Y.; Stocker, E.F.; Wolff, D.B. The TRMM Multisatellite Precipitation Analysis (TMPA): Quasi-global, multiyear, combined-sensor precipitation estimates at fine scales. J. Hydrometeorol. 2007, 8, 38–55. [Google Scholar] [CrossRef]
  8. De Jesus, A.; Brena-Naranjo, J.A.; Pedrozo-Acuna, A.; Yamanaka, V.H.A. The use of TRMM 3B42 product for drought monitoring in Mexico. Water 2016, 8, 325. [Google Scholar] [CrossRef]
  9. Rapp, A.D.; Peterson, A.G.; Frauenfeld, O.W.; Quiring, S.M.; Roark, E.B. Climatology of storm characteristics in Costa Rica using the TRMM precipitation radar. J. Hydrometeorol. 2014, 15, 2615–2633. [Google Scholar] [CrossRef]
  10. Hou, A.Y.; Kakar, R.K.; Neeck, S.; Azarbarzin, A.A.; Kummerow, C.D.; Kojima, M.; Oki, R.; Nakamura, K.; Iguchi, T. The global precipitation measurement mission. Bull. Am. Meteorol. Soc. 2014, 95, 701–722. [Google Scholar] [CrossRef]
  11. Huffman, G.J.; Bolvin, D.; Nelkin, E.J. Day 1 IMERG Final Run Release Notes; NASA/GSFC: Greenbelt, MD, USA, 2015.
  12. Sahoo, A.K.; Sheffield, J.; Pan, M.; Wood, E.F. Evaluation of the Tropical Rainfall Measuring Mission Multi-satellite Precipitation Analysis (TMPA) for assessment of large-scale meteorological drought. Remote Sens. Environ. 2015, 159, 181–193. [Google Scholar] [CrossRef]
  13. Fensterseifer, C.; Allasia, D.G.; Paz, A.R. Assessment of the TRMM 3B42 precipitation product in southern Brazil. J. Am. Water Resour. Assoc. 2016, 52, 367–375. [Google Scholar] [CrossRef]
  14. Joshi, M.K.; Rai, A.; Pandey, A.C. Validation of TMPA and GPCP 1DD against the ground truth rain-gauge data for Indian region. Int. J. Climatol. 2013, 33, 2633–2648. [Google Scholar] [CrossRef]
  15. Moazami, S.; Golian, S.; Kavianpour, M.R.; Hong, Y. Comparison of PERSIANN and v7 TRMM Multi-satellite Precipitation Analysis (TMPA) products with rain gauge data over Iran. Int. J. Remote Sens. 2013, 34, 8156–8171. [Google Scholar] [CrossRef]
  16. Guo, H.; Chen, S.; Bao, A.; Behrangi, A.; Hong, Y.; Ndayisaba, F.; Hu, J.; Stepanian, P.M. Early assessment of integrated multi-satellite retrievals for global precipitation measurement over China. Atmos. Res. 2016, 176–177, 121–133. [Google Scholar] [CrossRef]
  17. Gaona, M.F.R.; Overeem, A.; Leijnse, H.; Uijlenhoet, R. First-year evaluation of GPM rainfall over the Netherlands: IMERG day 1 final run (VO3D). J. Hydrometeorol. 2016, 17, 2799–2814. [Google Scholar] [CrossRef]
  18. Wen, Y.X.; Behrangi, A.; Lambrigtsen, B.; Kirstetter, P.E. Evaluation and uncertainty estimation of the latest radar and satellite snowfall products using snotel measurements over mountainous regions in western United States. Remote Sens. 2016, 8, 904. [Google Scholar] [CrossRef]
  19. Sahlu, D.; Nikolopoulos, E.I.; Moges, S.A.; Anagnostou, E.N.; Hailu, D. First evaluation of the day-1 IMERG over the upper Blue Nile Basin. J. Hydrometeorol. 2016, 17, 2875–2882. [Google Scholar] [CrossRef]
  20. Hur, J.; Raghavan, S.V.; Nguyen, N.S.; Liong, S.Y. Are satellite products good proxies for gauge precipitation over Singapore? Theor. Appl. Climatol. 2017, 1–12. [Google Scholar] [CrossRef]
  21. Li, X.; Meshgi, A.; Babovic, V. Spatio-temporal variation of wet and dry spell characteristics of tropical precipitation in Singapore and its association with ENSO. Int. J. Climatol. 2016, 36, 4831–4846. [Google Scholar] [CrossRef]
  22. McBride, J.L.; Sahany, S.; Hassim, M.E.E.; Nguyen, C.M.; Lim, S.Y.; Rahmat, R.; Cheong, W.K. The 2014 record dry spell at Singapore: An Intertropical Convergence Zone (ITCZ) drought. Bull. Am. Meteorol. Soc. 2015, 96, S126–S130. [Google Scholar] [CrossRef]
  23. Huffman, G.J.; Bolvin, D.T.; Nelkin, E.J. Integrated Multi-Satellite Retrievals for GPM (IMERG) Technical Documentation; NASA/GSFC: Greenbelt, MD, USA, 2017.
  24. Tan, J.; Petersen, W.A.; Kirstetter, P.E.; Tian, Y.D. Performance of IMERG as a function of spatiotemporal scale. J. Hydrometeorol. 2017, 18, 307–319. [Google Scholar] [CrossRef]
  25. Yuan, F.; Zhang, L.; Win, K.; Ren, L.; Zhao, C.; Zhu, Y.; Jiang, S.; Liu, Y. Assessment of GPM and TRMM multi-satellite precipitation products in streamflow simulations in a data-sparse mountainous watershed in Myanmar. Remote Sens. 2017, 9, 302. [Google Scholar] [CrossRef]
  26. Singapore Meteorolgical Services. Annual Climatological Report; Singapore Meteorolgical Services: Singapore, 2016.
  27. Tan, M.L.; Ficklin, D.L.; Ibrahim, A.L.; Yusop, Z. Impacts and uncertainties of climate change on streamflow of the Johor River Basin, Malaysia using a CMIP5 general circulation model ensemble. J. Water Clim. Chang. 2014, 5, 676–695. [Google Scholar] [CrossRef]
  28. Duan, Z.; Liu, J.; Tuo, Y.; Chiogna, G.; Disse, M. Evaluation of eight high spatial resolution gridded precipitation products in Adige Basin (Italy) at multiple temporal and spatial scales. Sci. Total Environ. 2016, 573, 1536–1553. [Google Scholar] [CrossRef] [PubMed]
  29. Pombo, S.; de Oliveira, R.P. Evaluation of extreme precipitation estimates from TRMM in Angola. J. Hydrol. 2015, 523, 663–679. [Google Scholar] [CrossRef]
  30. Liu, J.; Duan, Z.; Jiang, J.; Zhu, A.X. Evaluation of three satellite precipitation products TRMM 3B42, CMORPH, and PERSIANN over a subtropical watershed in China. Adv. Meteorol. 2015, 2015, 151239. [Google Scholar] [CrossRef]
  31. Li, Z.; Yang, D.; Gao, B.; Jiao, Y.; Hong, Y.; Xu, T. Multiscale hydrologic applications of the latest satellite precipitation products in the Yangtze River Basin using a distributed hydrologic model. J. Hydrometeorol. 2015, 16, 407–426. [Google Scholar] [CrossRef]
  32. Mashingia, F.; Mtalo, F.; Bruen, M. Validation of remotely sensed rainfall over major climatic regions in Northeast Tanzania. Phys. Chem. Earth 2014, 67–69, 55–63. [Google Scholar] [CrossRef]
  33. Yang, X.Q.; Yong, B.; Hong, Y.; Chen, S.; Zhang, X.H. Error analysis of multi-satellite precipitation estimates with an independent raingauge observation network over a medium-sized humid basin. Hydrol. Sci. J. 2016, 61, 1813–1830. [Google Scholar] [CrossRef]
  34. Brown, J.E.M. An analysis of the performance of hybrid infrared and microwave satellite precipitation algorithnis over India and adjacent regions. Remote Sens. Environ. 2006, 101, 63–81. [Google Scholar] [CrossRef]
  35. Condom, T.; Rau, P.; Espinoza, J.C. Correction of TRMM 3B43 monthly precipitation data over the mountainous areas of Peru during the period 1998–2007. Hydrol. Process. 2011, 25, 1924–1933. [Google Scholar] [CrossRef]
  36. Tan, M.L.; Ibrahim, A.L.; Duan, Z.; Cracknell, A.P.; Chaplot, V. Evaluation of six high-resolution satellite and ground-based precipitation products over Malaysia. Remote Sens. 2015, 7, 1504–1528. [Google Scholar] [CrossRef]
  37. Xu, R.; Tian, F.; Yang, L.; Hu, H.; Lu, H.; Hou, A. Ground validation of GPM IMERG and TRMM 3B42V7 rainfall products over southern Tibetan Plateau based on a high-density rain-gauge network. J. Geophys. Res. Atmos. 2017, 122, 910–924. [Google Scholar] [CrossRef]
  38. Tang, G.; Ma, Y.; Long, D.; Zhong, L.; Hong, Y. Evaluation of GPM day-1 IMERG and TMPA version-7 legacy products over mainland China at multiple spatiotemporal scales. J. Hydrol. 2016, 533, 152–167. [Google Scholar] [CrossRef]
  39. Kim, K.; Park, J.; Baik, J.; Choi, M. Evaluation of topographical and seasonal feature using GPM IMERG and TRMM 3B42 over Far-east Asia. Atmos. Res. 2017, 187, 95–105. [Google Scholar] [CrossRef]
  40. Li, N.; Tang, G.; Zhao, P.; Hong, Y.; Gou, Y.; Yang, K. Statistical assessment and hydrological utility of the latest multi-satellite precipitation analysis IMERG in Ganjiang River Basin. Atmos. Res. 2017, 183, 212–223. [Google Scholar] [CrossRef]
  41. Singapore Meteorolgical Services. Annual Climate Assessment; Singapore Meteorolgical Services: Singapore, 2015.
  42. Ma, Y.Z.; Tang, G.Q.; Long, D.; Yong, B.; Zhong, L.Z.; Wan, W.; Hong, Y. Similarity and error intercomparison of the GPM and its predecessor-TRMM multisatellite precipitation analysis using the best available hourly gauge network over the Tibetan Plateau. Remote Sens. 2016, 8, 569. [Google Scholar] [CrossRef]
  43. Sharifi, E.; Steinacker, R.; Saghafian, B. Assessment of GPM-IMERG and other precipitation products against gauge data under different topographic and climatic conditions in Iran: Preliminary results. Remote Sens. 2016, 8, 135. [Google Scholar] [CrossRef]
  44. Prakash, S.; Mitra, A.K.; Pai, D.S.; AghaKouchak, A. From TRMM to GPM: How well can heavy rainfall be detected from space? Adv. Water Resour. 2016, 88, 1–7. [Google Scholar] [CrossRef]
  45. Wang, W.; Lu, H.; Zhao, T.; Jiang, L.; Shi, J. Evaluation and comparison of daily rainfall from latest GPM and TRMM products over the Mekong River Basin. IEEE J. STARS 2017, 99, 1–10. [Google Scholar] [CrossRef]
  46. Tang, G.Q.; Zeng, Z.Y.; Long, D.; Guo, X.L.; Yong, B.; Zhang, W.H.; Hong, Y. Statistical and hydrological comparisons between TRMM and GPM level-3 products over a midlatitude basin: Is day-1 IMERG a good successor for TMPA 3B42V7? J. Hydrometeorol. 2016, 17, 121–137. [Google Scholar] [CrossRef]
  47. Kummerow, C.D.; David, L.R.; Kulie, M.; Wang, N.Y.; Ferraro, R.; Munchak, S.J.; Petkovic, V. The evolution of the goddard profiling algorithm to a fully parametric scheme. J. Atmos. Ocean. Technol. 2015, 32, 2265–2280. [Google Scholar] [CrossRef]
  48. Schneider, U.; Becker, A.; Meyer-Christoffer, A.; Fuchs, T.; Rudolf, B. Global Precipitation Analysis Products of the GPCC; Global Precipitation Climatology Centre: Offenbach am Main, Germany, 2011. [Google Scholar]
  49. Ning, S.W.; Wang, J.; Jin, J.L.; Ishidaira, H. Assessment of the latest GPM-era high-resolution satellite precipitation products by comparison with observation gauge data over the Chinese Mainland. Water 2016, 8, 481. [Google Scholar] [CrossRef]
Figure 1. (a) Locations of rain gauge stations and the spatial coverage of a single grid from TRMM Multisatellite Precipitation Analysis (TMPA) (TRMM = Tropical Rainfall Measuring Mission) and Integrated Multi-satellite Retrievals for GPM (IMERG) products (GPM = Global Precipitation Measurement) (the blue grid represents the 3B42 or 3B42RT product, and the red grid represents IMERG) and (b) topography map of Singapore.
Remotesensing 09 00720 g001
Figure 2. Total annual precipitation measured from gauges IMERG, 3B42 and 3B42RT in 2015.
Remotesensing 09 00720 g002
Figure 3. Spatial variability of the 2015 total annual precipitation interpolated of measurements from (a) gauges, (b) IMERG, (c) 3B42 and (d) 3B42RT over Singapore.
Remotesensing 09 00720 g003
Figure 4. Monthly precipitation from gauges and three satellite precipitation products (SPPs).
Remotesensing 09 00720 g004
Figure 5. Probability Density Function (PDF) of daily precipitation in (a) entire, (b) NEM, (c) IM1, (d) SWM and (e) IM2 time periods.
Remotesensing 09 00720 g005
Table 1. Statistical metrics of monthly precipitation estimates by three SPPs. Root Mean Square Error (RMSE); Relative Bias (RB).
IMERG3B423B42RT
CC0.820.790.79
RMSE (mm/month)54.7551.5268.02
RB (%)5.24−10.25−21.77
Bias6.70−18.89−39.06
Table 2. Statistical metrics of daily precipitation measures by IMERG, 3B42 and 3B42RT in different time periods. Probability of Detection (POD); False Alarm Ratio (FAR); Critical Success Index (CSI); Correlation Coefficient (CC); northeast monsoon (NEM); southwest monsoon (SWM).
IMERG3B423B42RT
Entire Period (1 April 2014 to 31 June 2016)
CC0.530.560.53
RMSE (mm/day)11.839.209.10
RB (%)5.24−10.25−21.77
Bias0.22−0.62−1.28
POD0.780.660.65
FAR0.280.150.16
CSI0.600.650.58
NEM (1 December 2014 to 15 March 2015)
CC0.630.670.67
RMSE (mm/day)10.247.967.95
RB (%)−0.86−26.94−29.07
Bias−0.25−1.48−1.59
POD0.810.590.60
FAR0.300.180.22
CSI0.600.520.52
IM1 (16 March 2015 to 31 May 2015)
CC0.540.570.30
RMSE (mm/day)10.478.9111.47
RB (%)−8.58−14.07−19.82
Bias−0.86−0.92−1.28
POD0.750.710.74
FAR0.310.190.20
CSI0.640.610.62
SWM (1 June 2015 to 31 September 2015)
CC0.580.700.63
RMSE (mm/day)9.867.266.99
RB (%)21.199.24−8.08
Bias0.750.31−0.33
POD0.740.570.55
FAR0.340.240.24
CSI0.540.490.47
IM2 (1 October 2015 to 31 November 2015)
CC0.440.440.47
RMSE (mm/day)16.1411.018.10
RB (%)33.479.03−34.78
Bias1.330.48−2.07
POD0.730.640.61
FAR0.280.080.09
CSI0.580.610.58
Table 3. Comparison with other IMERG evaluation studies at daily scale estimation.
Study AreaPeriodCCRMSE (mm/day)POD
This studySingaporeApril 2014 to January 20160.5311.830.78
Xu et al. [37]Southern Tibetan PlateauMay to October 20140.467.160.69
Kim et al. [39]Korea, JapanMarch to August 20140.53–0.686.68–23.410.6–0.76
Tang et al. [46]Ganjiang River Basin, ChinaMay to September 20140.62–0.94.44–13.09-
Tang et al. [38]ChinaApril to December 20140.960.50.91
Sharifi et al. [43]IranMarch 2014 to February 20150.4–0.526.38–19.410.46–0.7
Sahlu et al. [19]Blue Nile BasinMay to October 20140.55-0.87
Ning et al. [49]ChinaApril 2014 to November 20150.686.430.79
Guo et al. [16]China12 March 2014 to 31 March 20150.930.56-

