
Classification of Personnel Targets with Baggage Using Dual-band Radar


Abstract
:
1. Introduction
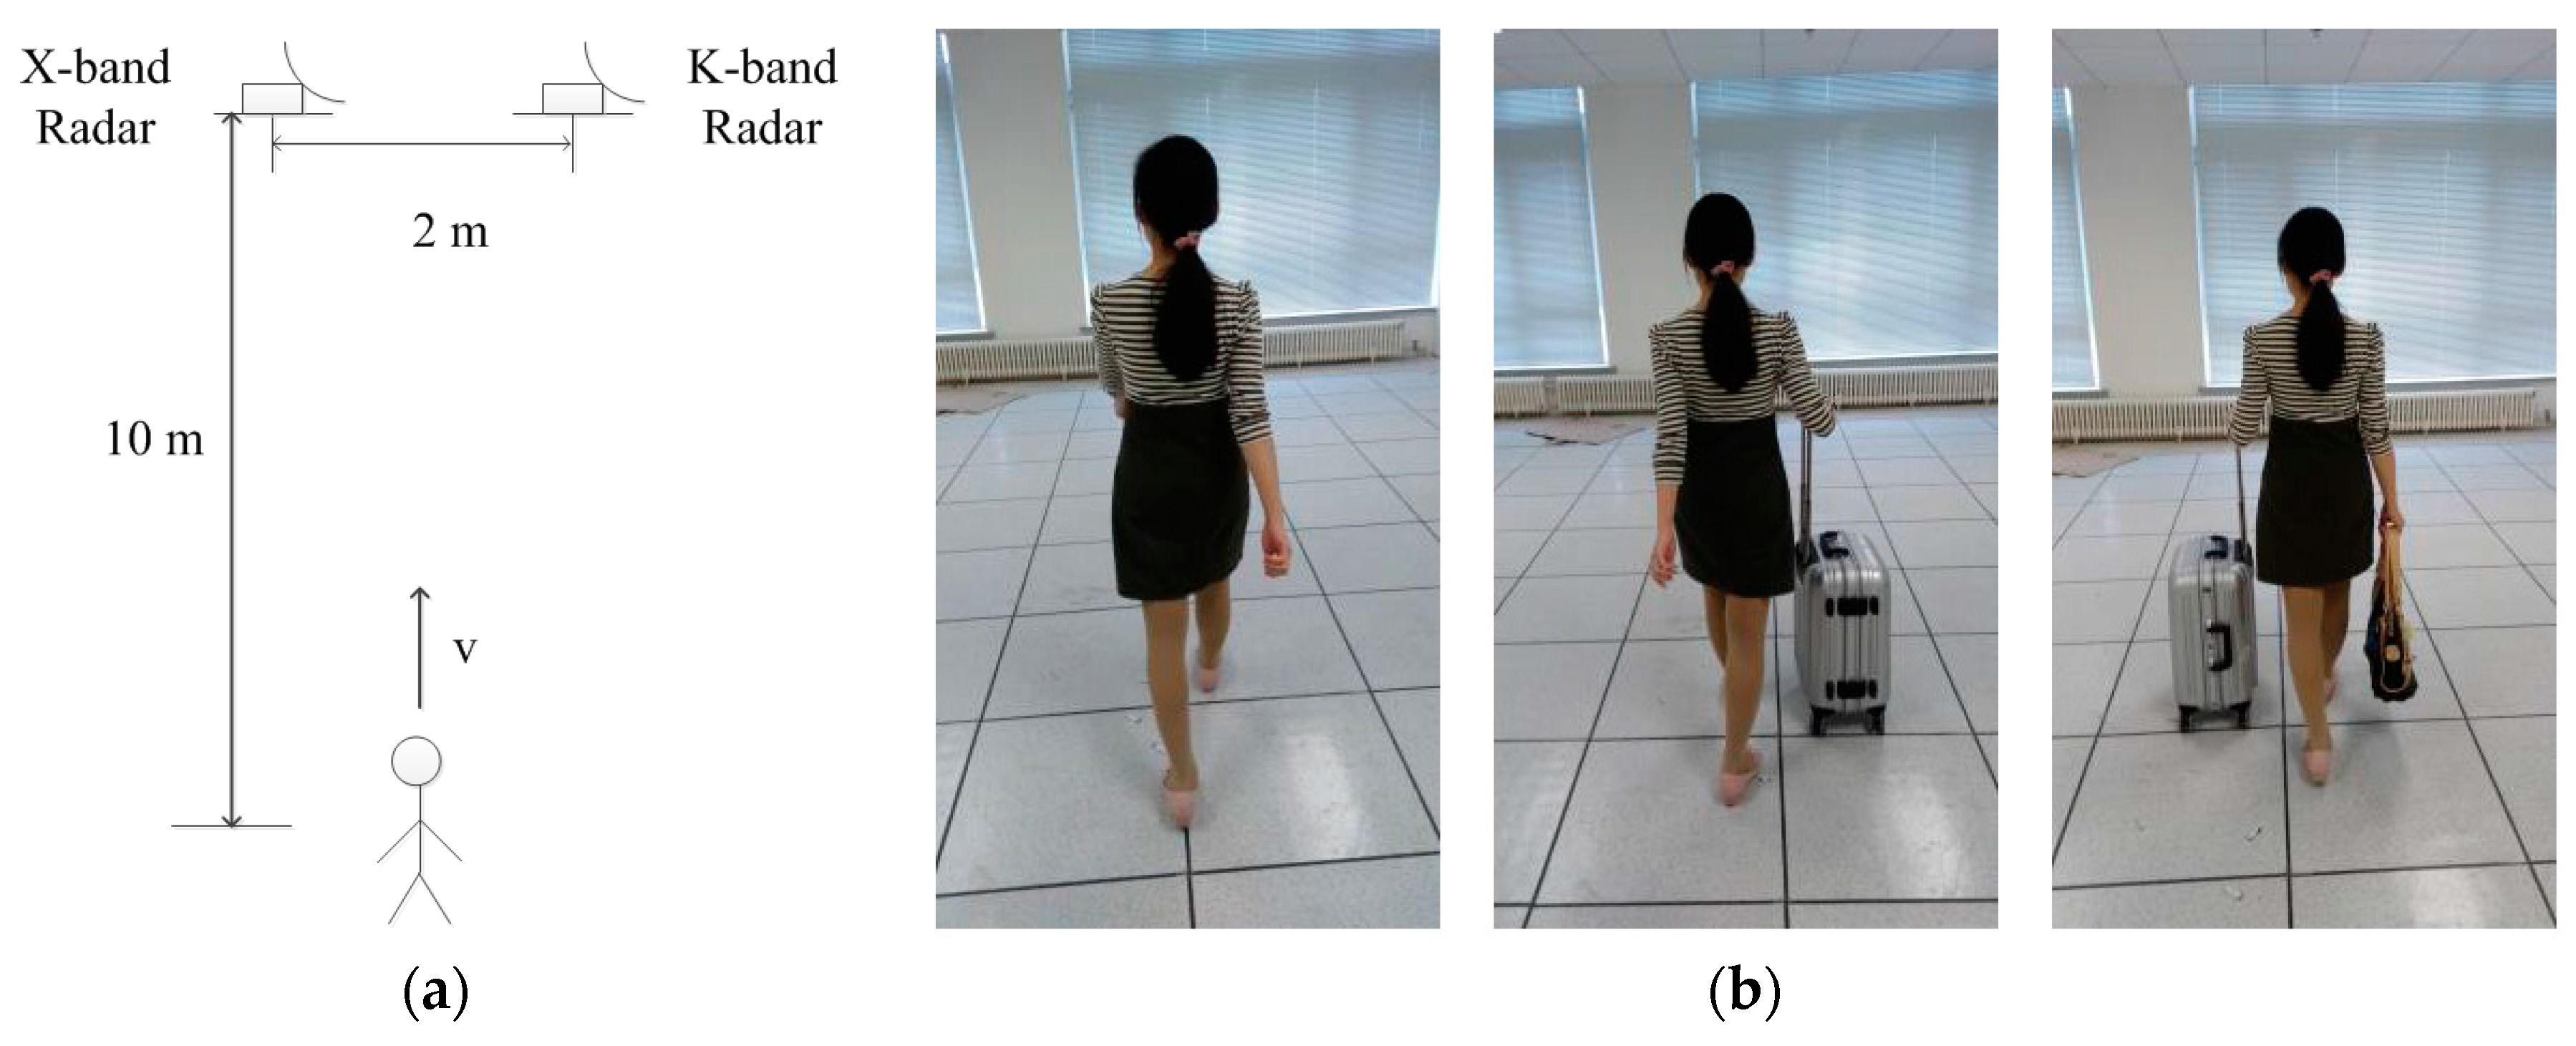
2. Experimental Setup
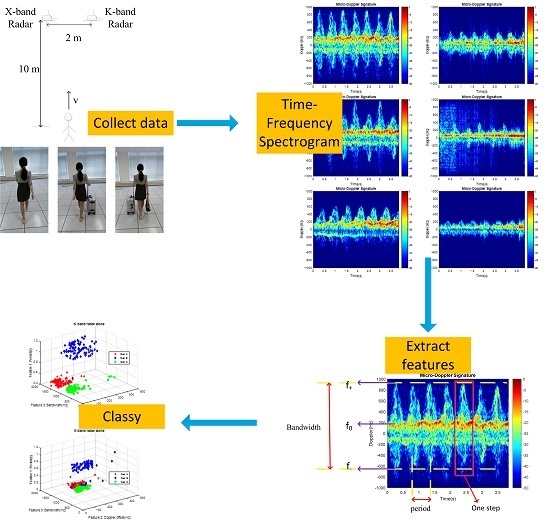
3. The Proposed Method
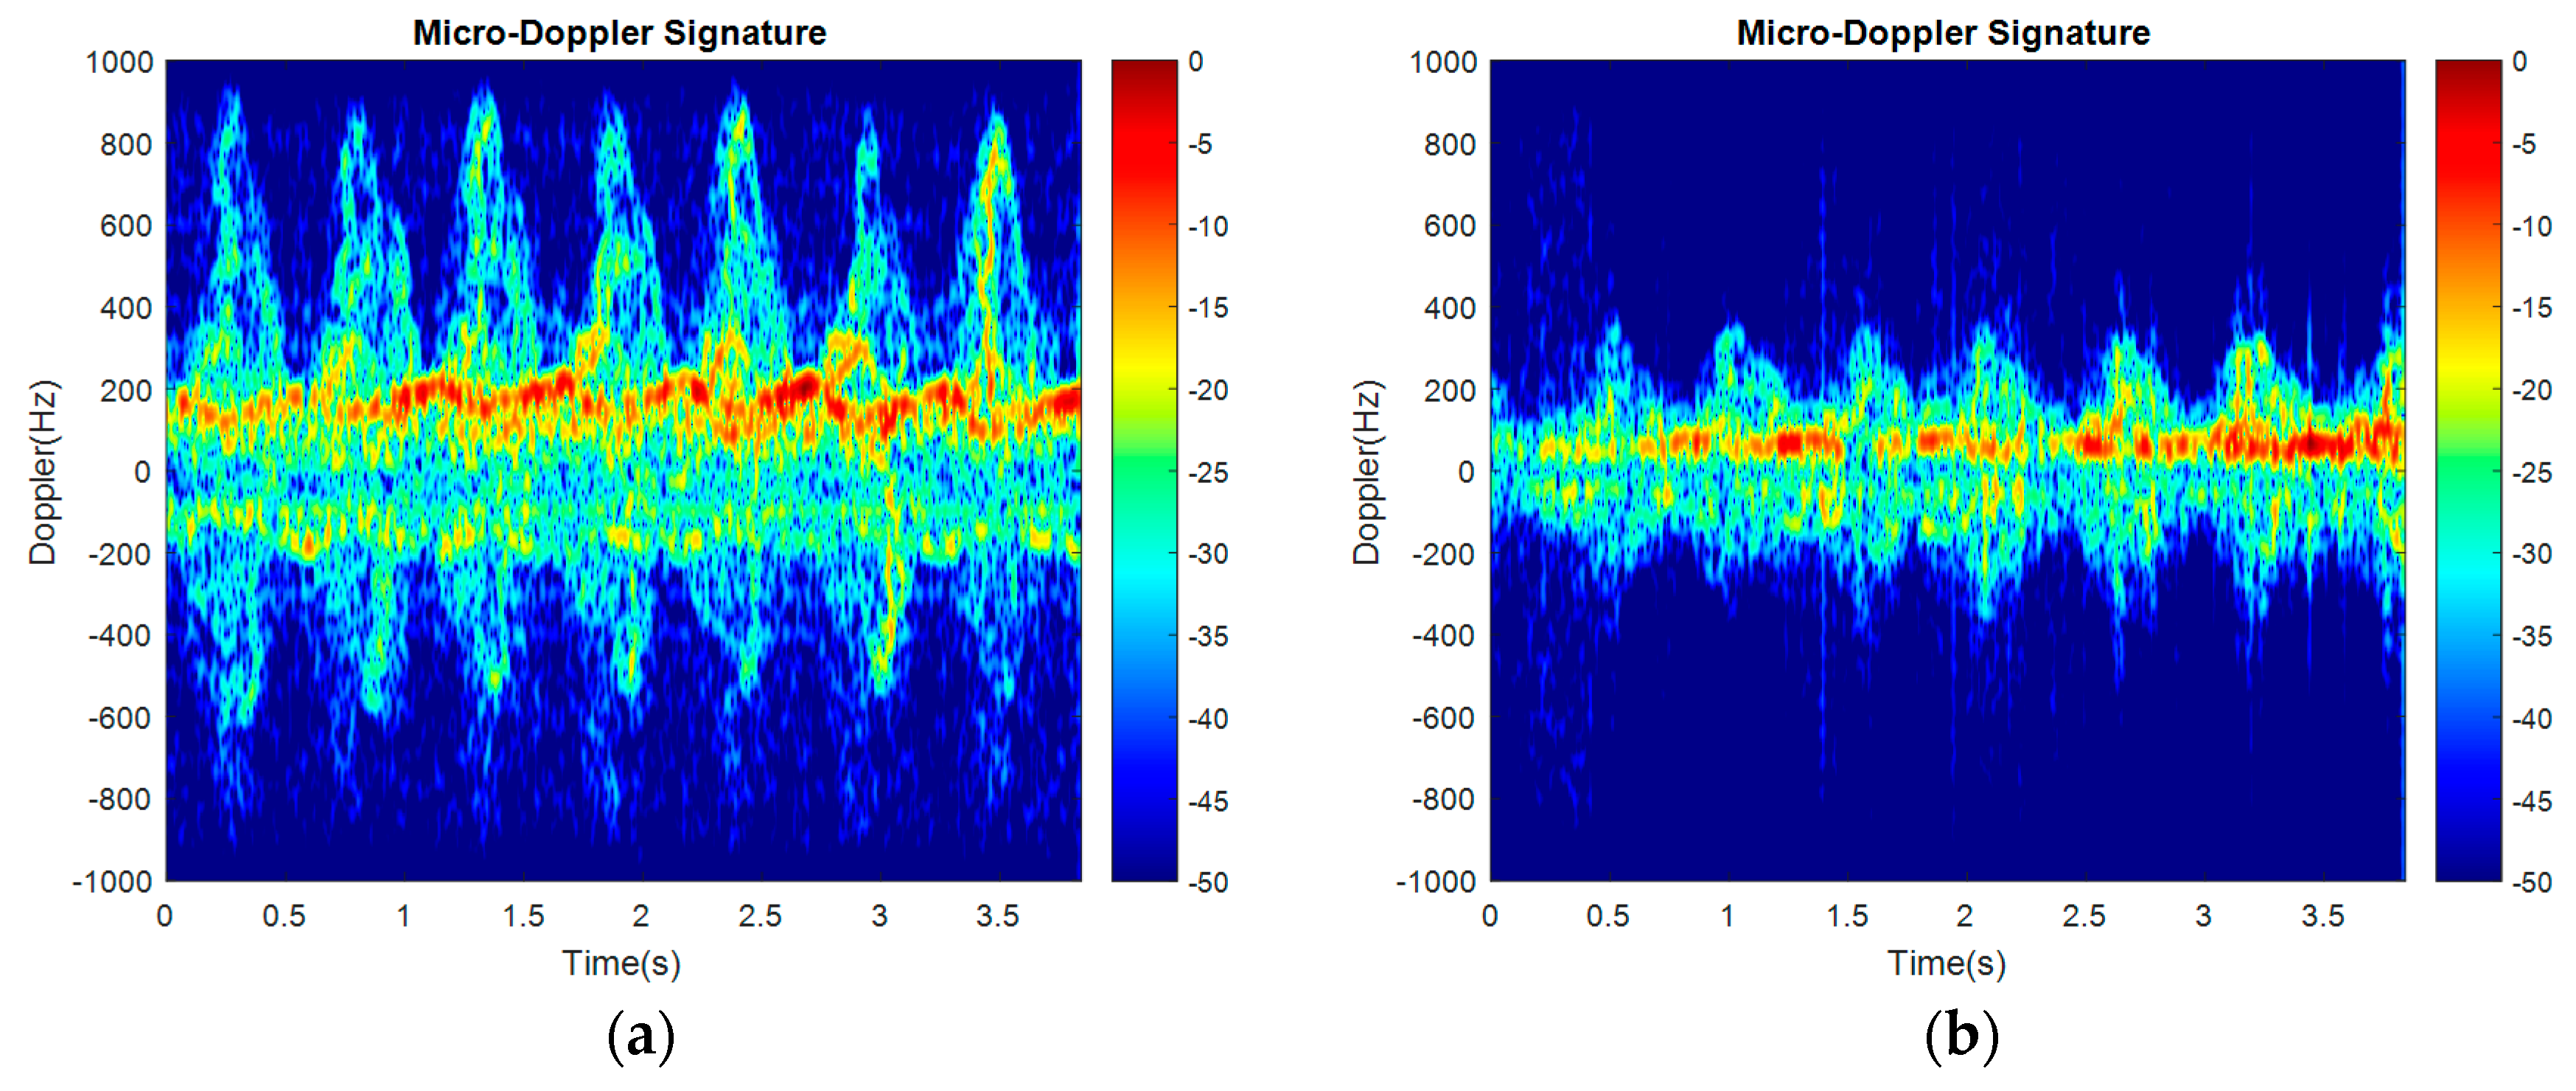
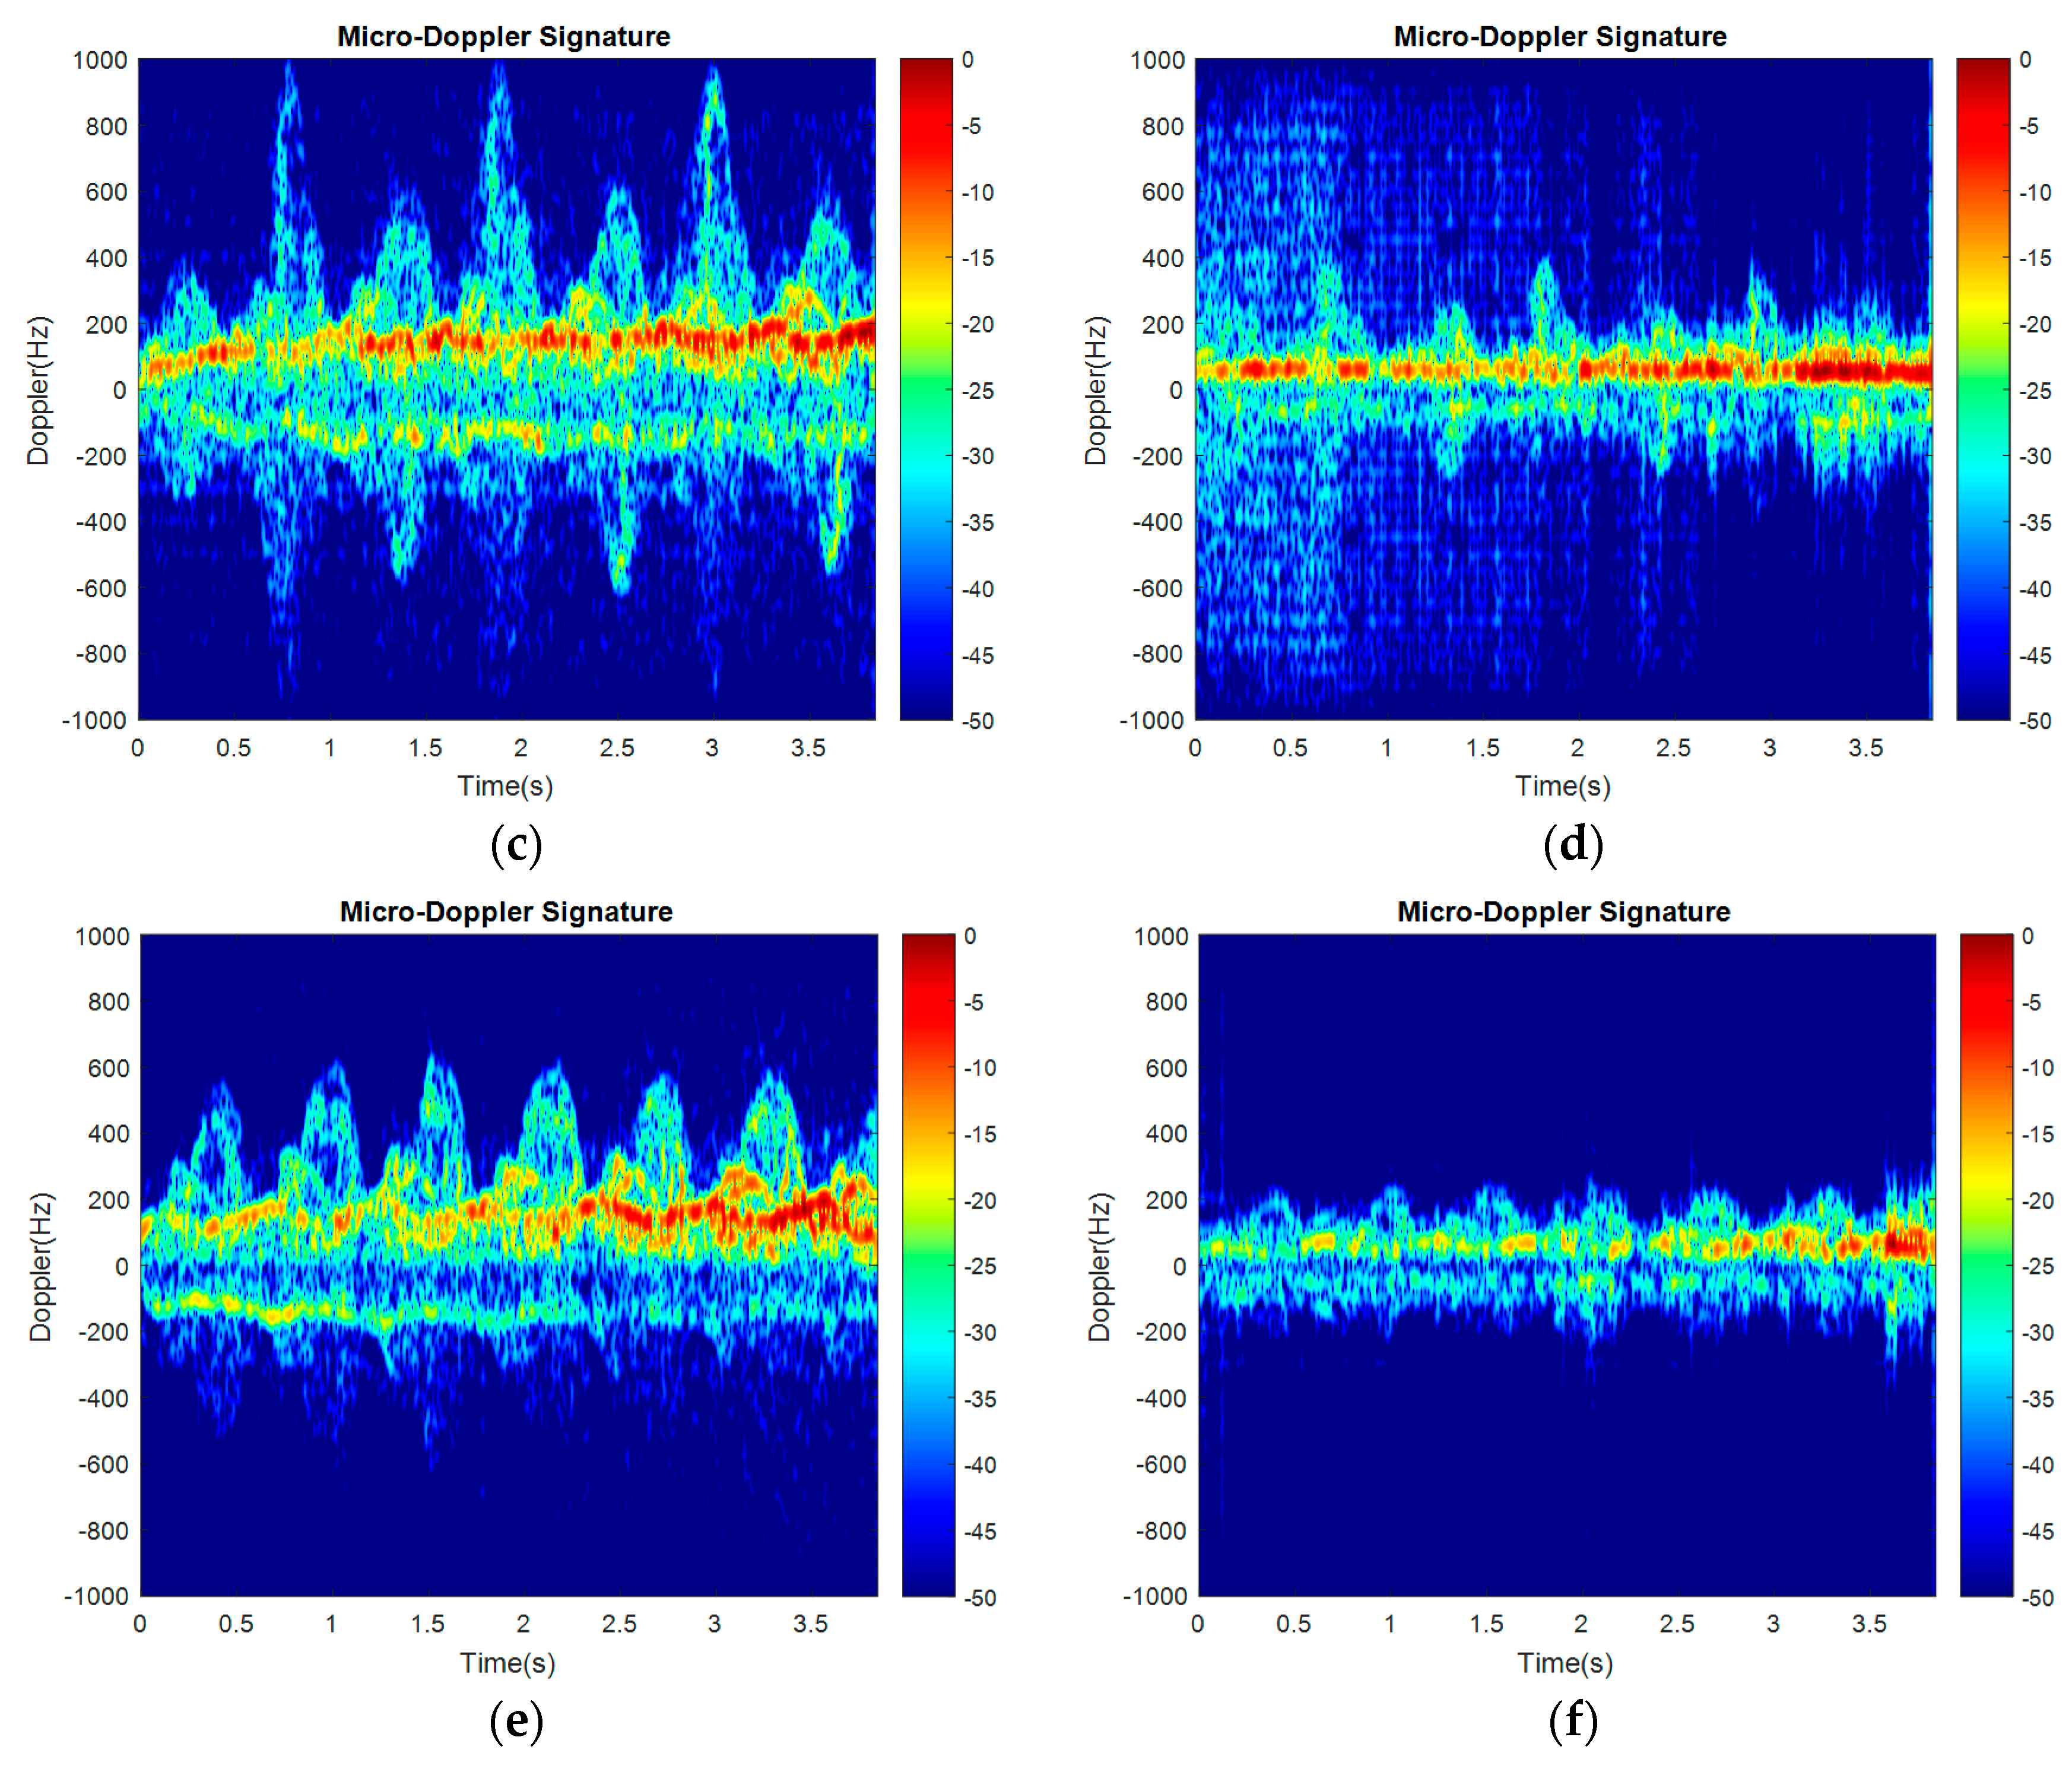
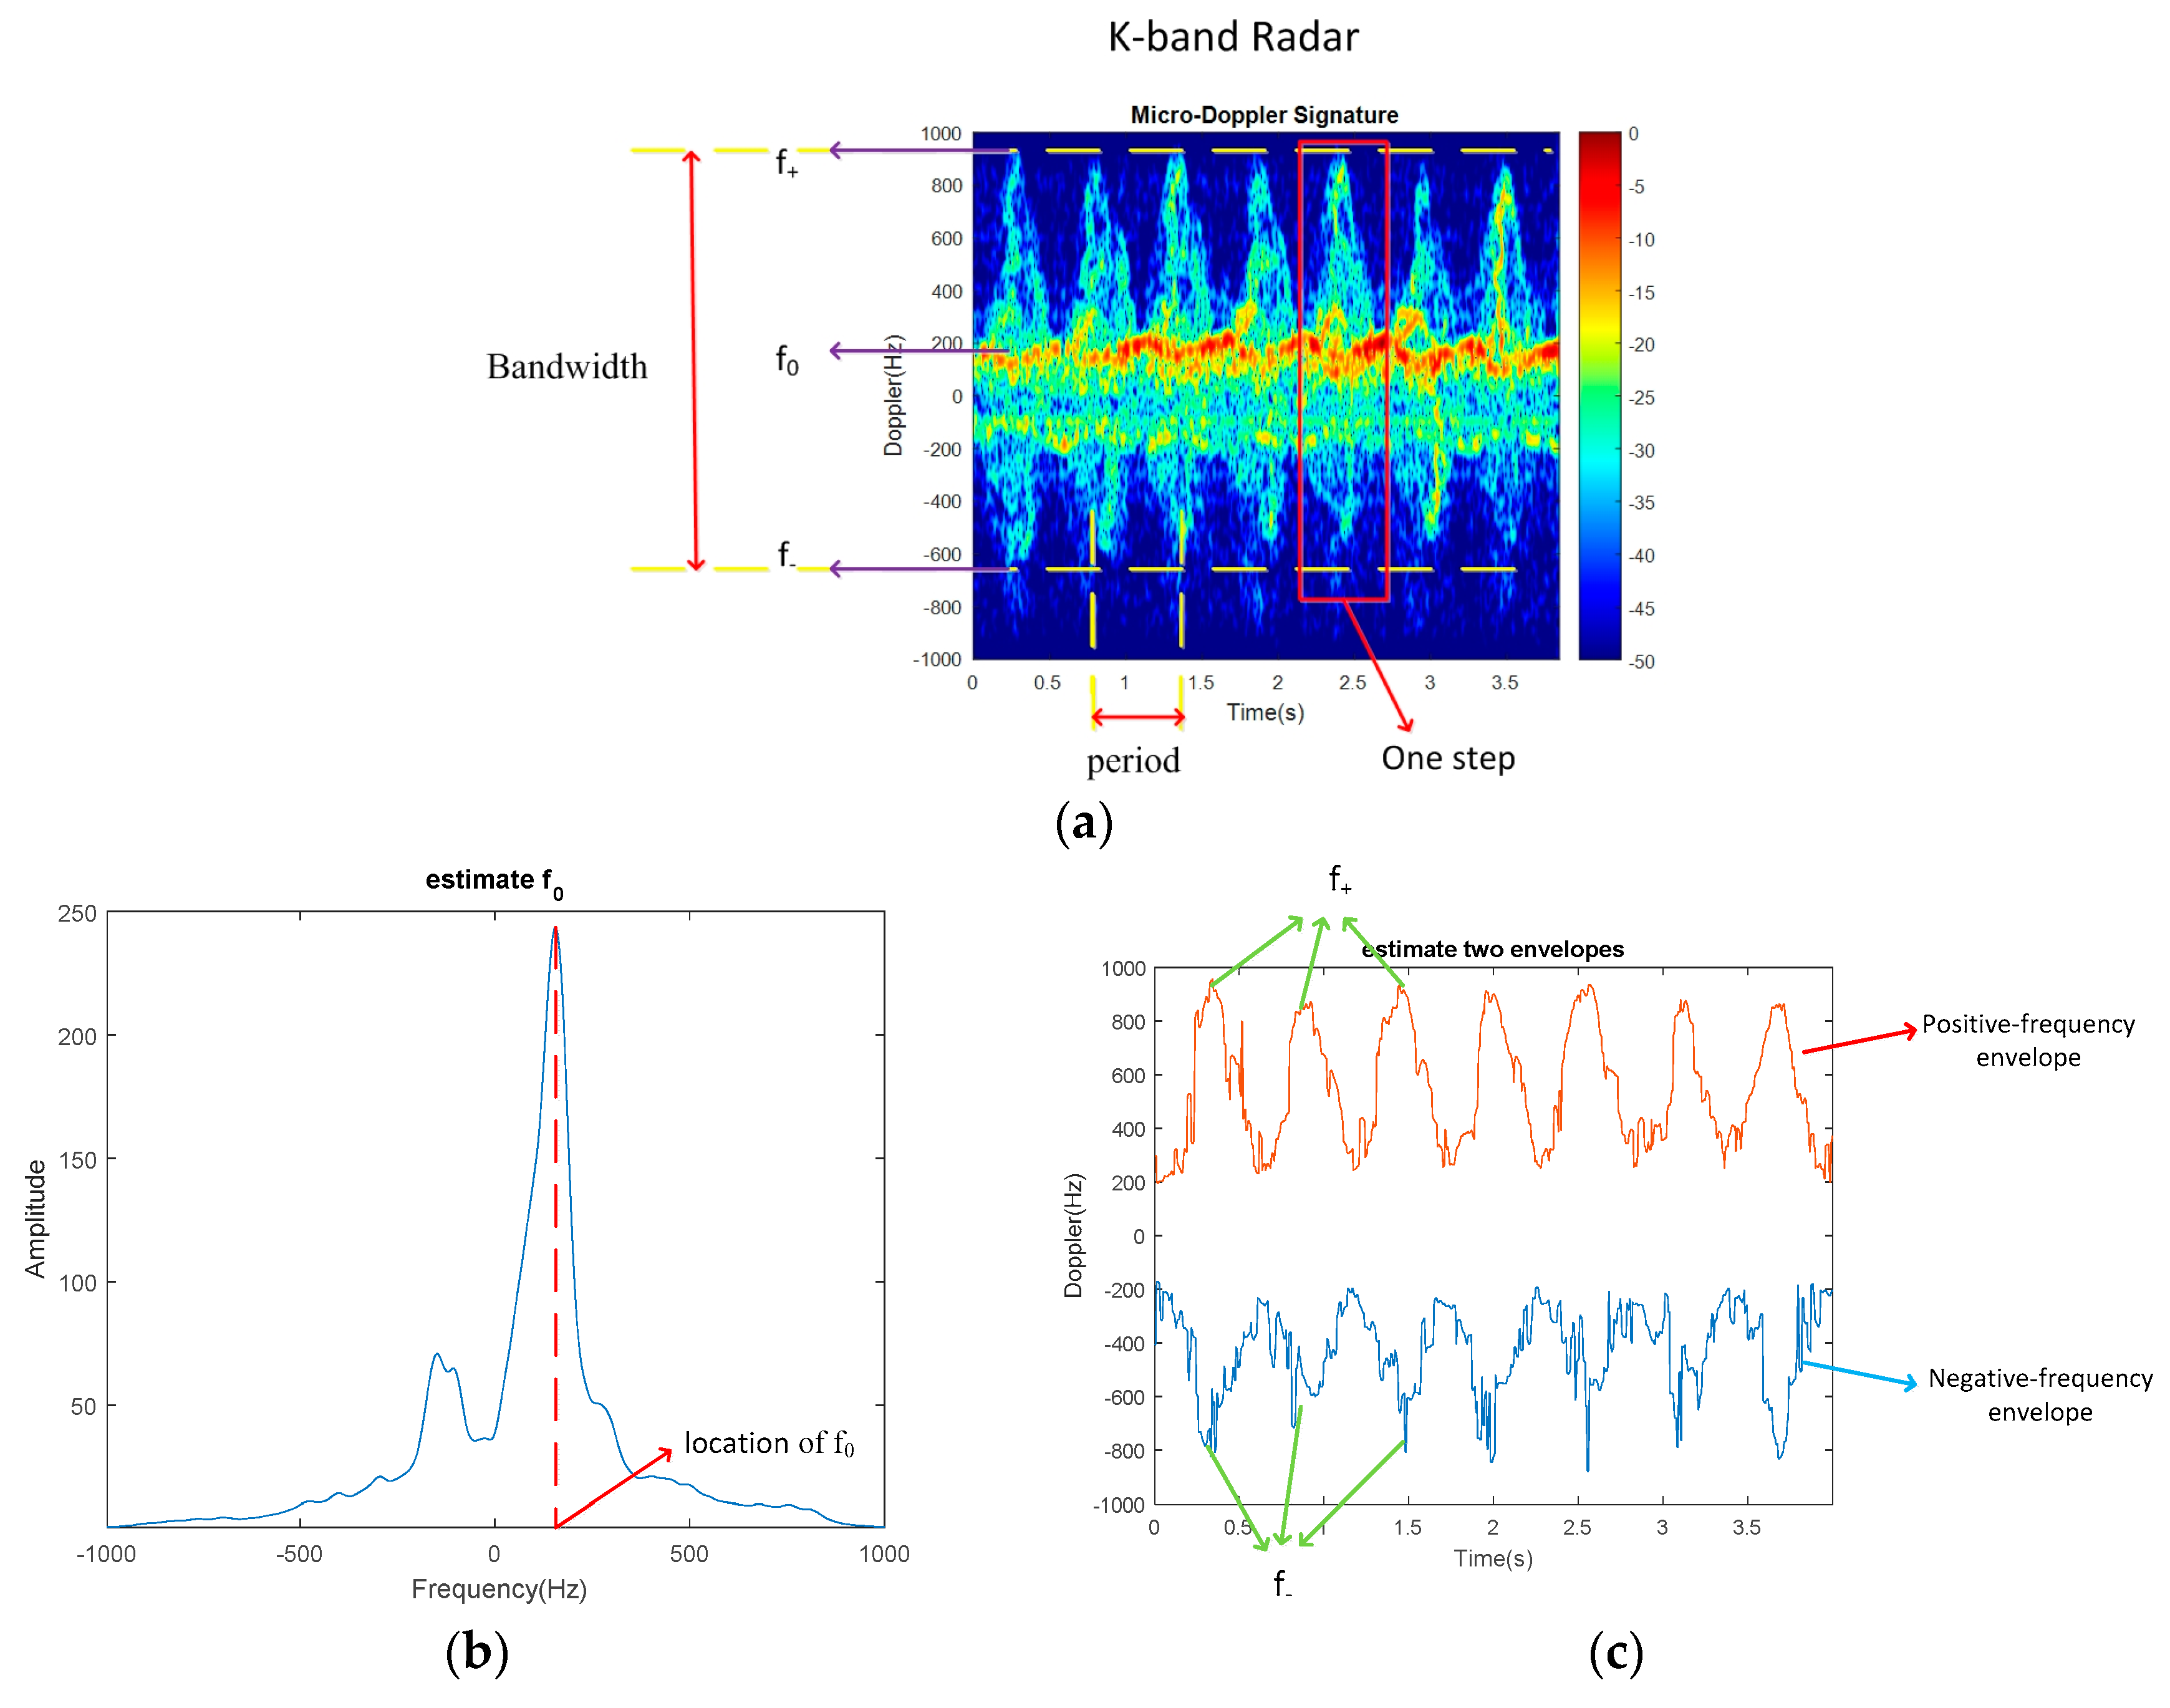
3.1. Time-Frequency Analysis
3.2. Feature Extraction
3.2.1. Period
3.2.2. Doppler Offset
3.2.3. Bandwidth
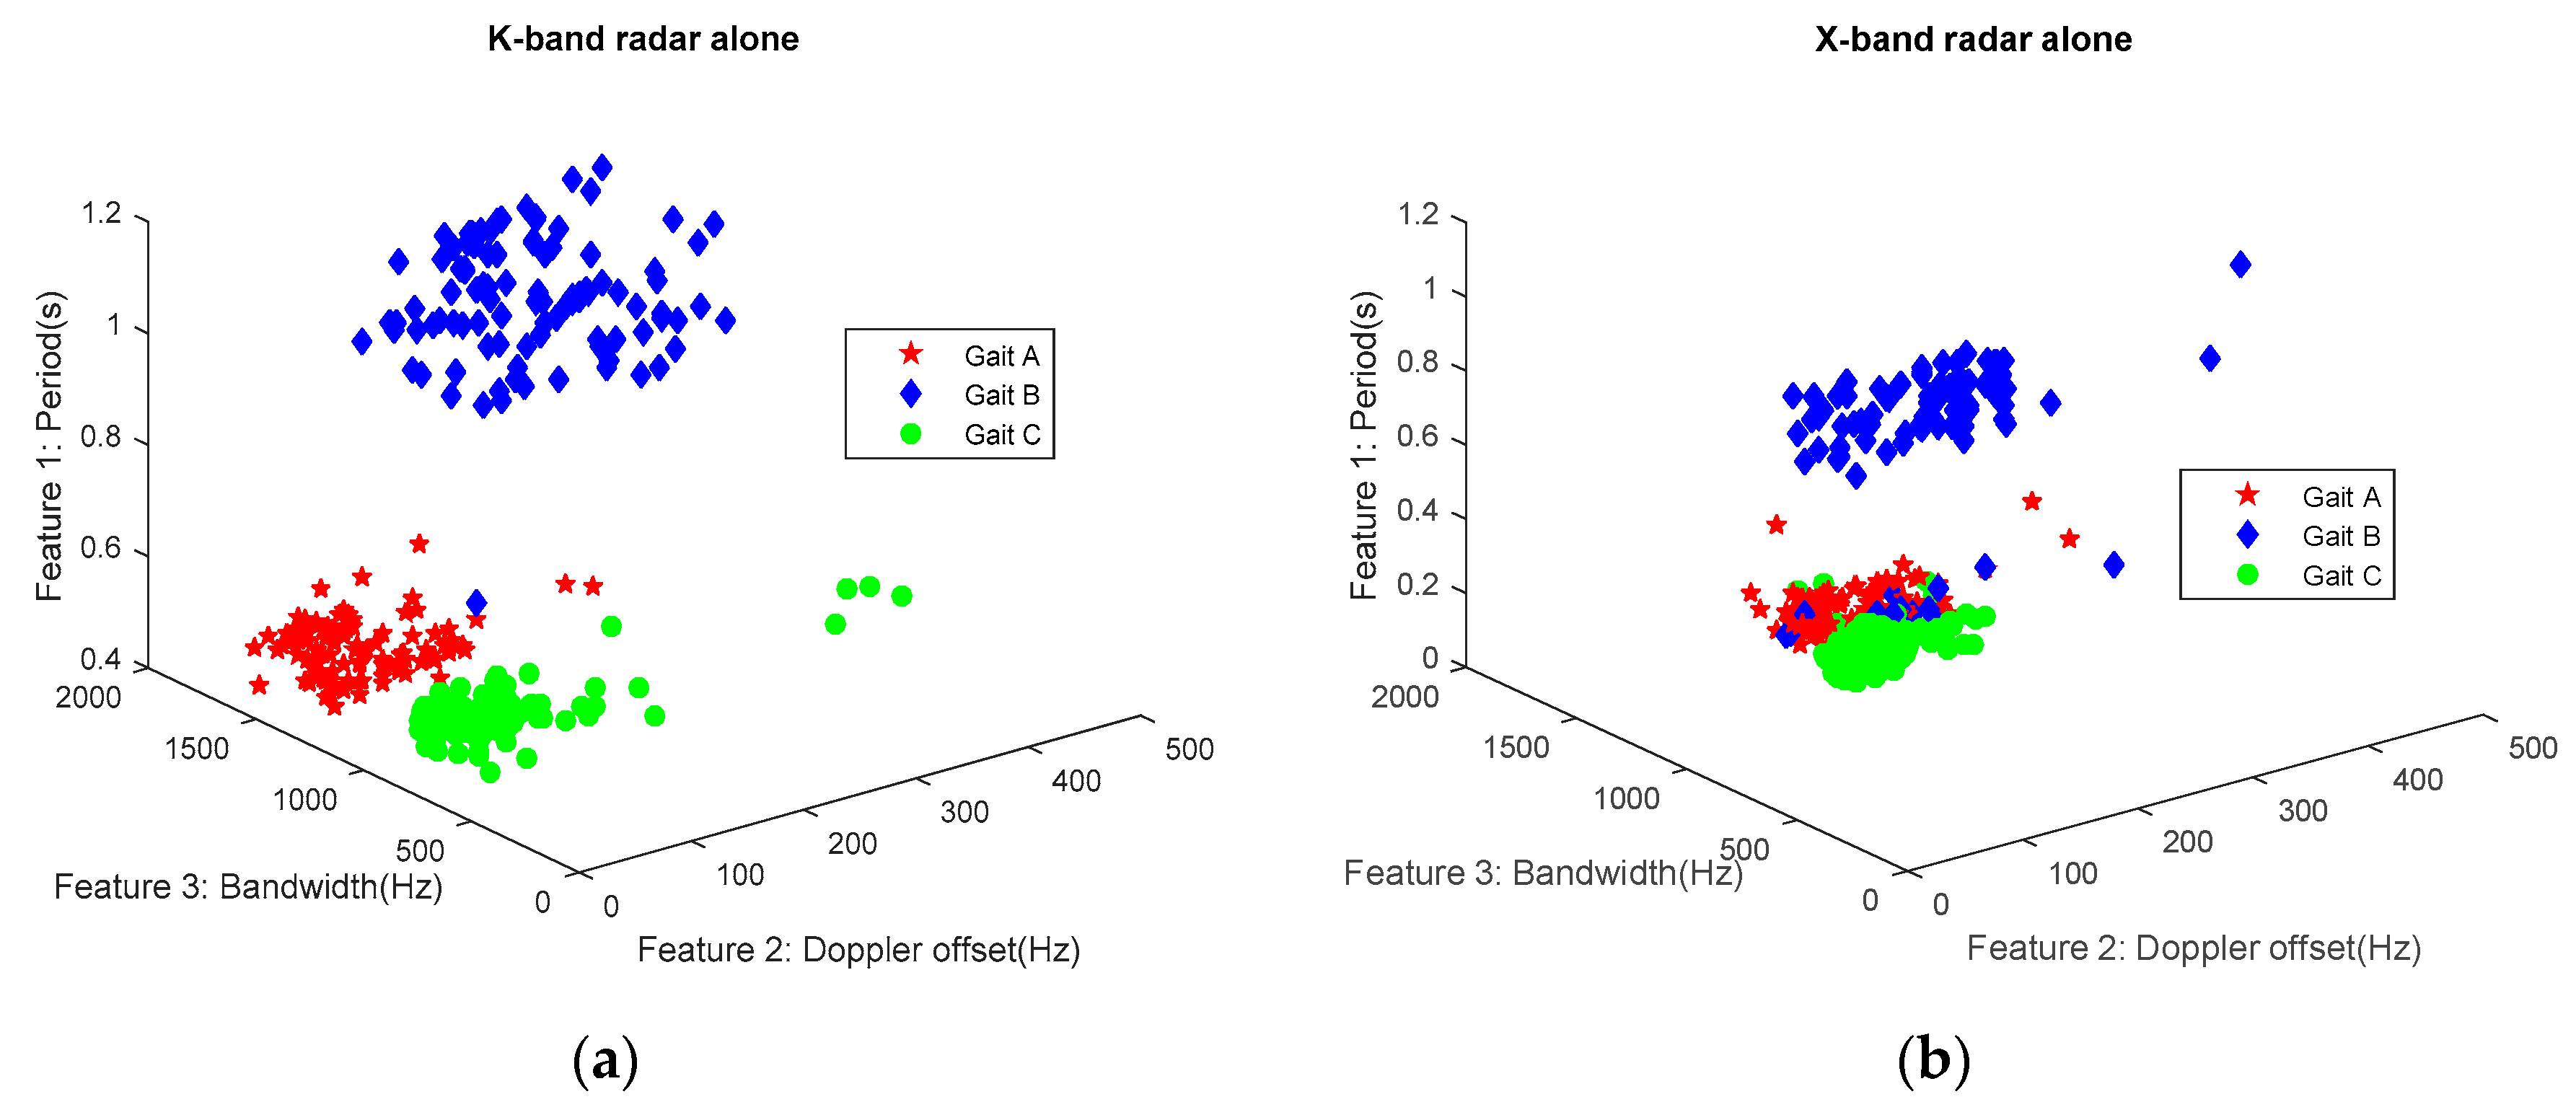
3.3. Classification
4. Classification Results
5. Conclusions
Acknowledgments
Author Contributions
Conflicts of Interest
References
- Bouisser, J.F. Security technologies and techniques: Airport security systems. J. Test. Eval. 1994, 22, 247–250. [Google Scholar]
- Babu, V.L.; Batta, R.; Lin, L. Passenger grouping under constant threat probability in an airport security system. Eur. J. Oper. Res. 2006, 168, 633–644. [Google Scholar] [CrossRef]
- Fiondella, L.; Gokhale, S.S.; Lownes, N.; Accorsi, M. Security and performance analysis of a passenger screening checkpoint for mass-transit systems. In Proceedings of the 2012 IEEE Conference on Technologies for Homeland Security (HST), Waltham, MA, USA, 13–15 November 2012. [Google Scholar]
- Fioranelli, F.; Ritchie, M.; Griffiths, H. Bistatic human micro-Doppler signatures for classification of indoor activities. In Proceedings of the 2017 IEEE Radar Conference, Seattle, WA, USA, 8–12 May 2017. [Google Scholar]
- Parashar, K.N.; Oveneke, M.C.; Rykunov, M.; Sahli, H.; Bourdoux, A. Micro-Doppler feature extraction using convolutional auto-encoders for low latency target classification. In Proceedings of the 2017 IEEE Radar Conference, Seattle, WA, USA, 8–12 May 2017. [Google Scholar]
- Kwon, J.; Kwak, N. Human detection by neural networks using a low-cost short-range Doppler radar sensor. In Proceedings of the 2017 IEEE Radar Conference, Seattle, WA, USA, 8–12 May 2017. [Google Scholar]
- Chen, V.C.; Li, F.; Ho, S.S.; Wechsler, H. Micro-Doppler effect in radar: phenomenon, model, and simulation study. IEEE Trans. Aerosp. Electron. Syst. 2006, 42, 2–21. [Google Scholar] [CrossRef]
- Tahmoush, D. Review of micro-Doppler signatures. IET Radar Sonar Navig. 2015, 9, 1140–1146. [Google Scholar] [CrossRef]
- Chen, V.C.; Li, F.; Ho, S.S.; Wechsler, H. Analysis of micro-Doppler signatures. IEEE Proc. Radar Sonar Navig. 2003, 150, 271–276. [Google Scholar] [CrossRef]
- Kim, Y.; Ha, S.; Kwon, J. Human detection using Doppler radar based on physical characteristics of targets. IEEE Geosci. Remote Sens. Lett. 2015, 12, 289–293. [Google Scholar]
- Tahmoush, D.; Silvious, J. Remote detection of humans and animals. In Proceedings of the 2009 IEEE Applied Imagery Pattern Recognition Workshop (AIPR 2009), Washington, DC, USA, 14–16 October 2009. [Google Scholar]
- Narayanan, R.M.; Zenaldin, M. Radar micro-Doppler signatures of various human activities. IET Radar Sonar Navig. 2015, 9, 1205–1215. [Google Scholar] [CrossRef]
- Otero, M. Application of a continuous wave radar for human gait recognition. Proc. SPIE 2005, 5809, 538–548. [Google Scholar]
- Hornsteiner, C.; Detlefsen, J. Characterization of human gait using a continuous-wave radar at 24 GHz. Adv. Radio Sci. 2008, 6, 67–70. [Google Scholar] [CrossRef]
- Kim, Y.; Ling, H. Human activity classification based on micro-Doppler signatures using a support vector machine. IEEE Trans. Geosci. Remote Sens. 2009, 47, 1328–1337. [Google Scholar]
- Tahmoush, D.; Silvious, J. Radar micro-Doppler for long range front-view gait recognition. In Proceedings of the 2009 IEEE 3rd International Conference on Biometrics: Theory, Applications, and Systems, Washington, DC, USA, 28–30 September 2009. [Google Scholar]
- Fioranelli, F.; Ritchie, M.; Griffiths, H. Aspect angle dependence and multistatic data fusion for micro-Doppler classification of armed/unarmed personnel. IET Radar Sonar Navig. 2015, 9, 1231–1239. [Google Scholar] [CrossRef]
- Qi, F.; Lv, H.; Liang, F.; Li, Z.; Yu, X.; Wang, J. MHHT-based method for analysis of micro-Doppler signatures for human finer-grained activity using through-wall SFCW radar. Remote Sens. 2017, 9, 260. [Google Scholar] [CrossRef]
- Gennarelli, G.; Ludeno, G.; Soldovieri, F. Real-time through-wall situation awareness using a microwave Doppler radar sensor. Remote Sens. 2016, 8, 621. [Google Scholar] [CrossRef]
- Tahmoush, D.; Silvious, J. Radar microDoppler for security applications: Modeling men versus women. In Proceedings of the 2009 IEEE Antennas and Propagation Society International Symposium, Charleston, SC, USA, 1–5 June 2009. [Google Scholar]
- Javier, R.J.; Kim, Y. Application of linear predictive coding for human activity classification based on micro-Doppler signatures. IEEE Trans. Geosci. Remote Sens. Lett. 2014, 11, 1831–1834. [Google Scholar] [CrossRef]
- Kim, Y. Detection of eye blinking using Doppler sensor with principal component analysis. IEEE Antennas Wirel. Propag. Lett. 2015, 14, 123–126. [Google Scholar] [CrossRef]
- Fioranelli, F.; Ritchie, M.; Griffiths, H. Classification of unarmed/armed personnel using the NetRAD multistatic radar for micro-Doppler and singular value decomposition features. IEEE Geosci. Remote Sens. Lett. 2015, 12, 1933–1937. [Google Scholar] [CrossRef]
- Fairchild, D.P.; Narayanan, R.M. Classification of human motions using empirical mode decomposition of human micro-Doppler signatures. IET Radar Sonar Navig. 2014, 8, 425–434. [Google Scholar] [CrossRef]
- Tivive, F.H.C.; Bouzerdoum, A.; Amin, M.G. Automatic human gait classification from Doppler spectrograms. In Proceedings of the 2010 2nd International Workshop on Cognitive Information Processing, Elba, Italy, 14–16 June 2010. [Google Scholar]
- Kim, Y.; Moon, T. Human detection and activity classification based on micro-Doppler signatures using deep convolutional neural networks. IEEE Geosci. Remote Sens. Lett. 2016, 13, 8–12. [Google Scholar] [CrossRef]
- Kim, Y.; Toomajian, B. Hand gesture recognition using micro-Doppler signatures with convolutional neural network. IEEE Access 2016, 4, 7125–7130. [Google Scholar] [CrossRef]
- Skriver, H. Crop classification by multitemporal C- and L-band single- and dual-polarization and Fully Polarimetric SAR. IEEE Trans. Geosci. Remote Sens. 2012, 50, 2138–2149. [Google Scholar] [CrossRef]
- Lei, P.; Wang, J.; Sun, J. A dual-radar system based estimation algorithm of 3D scatterer distribution with micro-motions. In Proceedings of the 2011 8th European Radar Conference, Manchester, UK, 12–14 October 2011. [Google Scholar]
- Keller, D.J.; Franke, F.S. Envelope reconstruction of probe microscope images. Surf. Sci. 1993, 294, 409–419. [Google Scholar] [CrossRef]
- D’Alessio, T.; Conforto, S. Extraction of the envelope from surface EMG signals. IEEE Eng. Med. Biol. Mag. 2001, 20, 55–61. [Google Scholar] [CrossRef] [PubMed]
- Cohen, L. Time-frequency distributions—A review. Proc. IEEE 1989, 77, 941–981. [Google Scholar] [CrossRef]
- Vapnik, V.N. An overview of statistical learning theory. IEEE Trans. Neural Netw. 1999, 10, 988–999. [Google Scholar] [CrossRef] [PubMed]
- Lin, W.M.; Wu, C.H.; Lin, C.H.; Cheng, F.S. Classification of multiple power quality disturbances using support vector machine and one-versus-one approach. In Proceedings of the 2006 International Conference on Power System Technology, Chongqing, China, 22–26 October 2006. [Google Scholar]


| Gait A | Gait B | Gait C | |
|---|---|---|---|
| Gait A | 92.46% | 0.63% | 6.91% |
| Gait B | 15.41% | 81.77% | 2.82% |
| Gait C | 10.30% | 0.50% | 89.20% |
| Gait A | Gait B | Gait C | |
|---|---|---|---|
| Gait A | 98.51% | 0.23% | 1.26% |
| Gait B | 1.01% | 98.99% | 0.00% |
| Gait C | 1.68% | 0.91% | 97.41% |
| Gait A | Gait B | Gait C | |
|---|---|---|---|
| Gait A | 99.41% | 0.30% | 0.42% |
| Gait B | 1.00% | 99.00% | 0.00% |
| Gait C | 1.55% | 1.01% | 97.44% |
| Gait A | Gait B | Gait C | |
|---|---|---|---|
| Gait A | 97.00% | 0.00% | 0.00% |
| Gait B | 17.00% | 82.00% | 1.00% |
| Gait C | 12.00% | 0.00% | 88.00% |
| Gait A | Gait B | Gait C | |
|---|---|---|---|
| Gait A | 99.00% | 0.00% | 1.00% |
| Gait B | 1.00% | 99.00% | 0.00% |
| Gait C | 0.00% | 0.00% | 100% |
| Gait A | Gait B | Gait C | |
|---|---|---|---|
| Gait A | 100% | 0.00% | 0.00% |
| Gait B | 1.00% | 99.00% | 0.00% |
| Gait C | 0.00% | 0.00% | 100% |
© 2017 by the authors. Licensee MDPI, Basel, Switzerland. This article is an open access article distributed under the terms and conditions of the Creative Commons Attribution (CC BY) license (http://creativecommons.org/licenses/by/4.0/).
Share and Cite
Yang, L.; Chen, G.; Li, G. Classification of Personnel Targets with Baggage Using Dual-band Radar. Remote Sens. 2017, 9, 594. https://doi.org/10.3390/rs9060594
Yang L, Chen G, Li G. Classification of Personnel Targets with Baggage Using Dual-band Radar. Remote Sensing. 2017; 9(6):594. https://doi.org/10.3390/rs9060594
Chicago/Turabian StyleYang, Le, Gao Chen, and Gang Li. 2017. "Classification of Personnel Targets with Baggage Using Dual-band Radar" Remote Sensing 9, no. 6: 594. https://doi.org/10.3390/rs9060594
APA StyleYang, L., Chen, G., & Li, G. (2017). Classification of Personnel Targets with Baggage Using Dual-band Radar. Remote Sensing, 9(6), 594. https://doi.org/10.3390/rs9060594