
Quantifying the Spatiotemporal Trends of Canopy Layer Heat Island (CLHI) and Its Driving Factors over Wuhan, China with Satellite Remote Sensing


Abstract
:1. Introduction
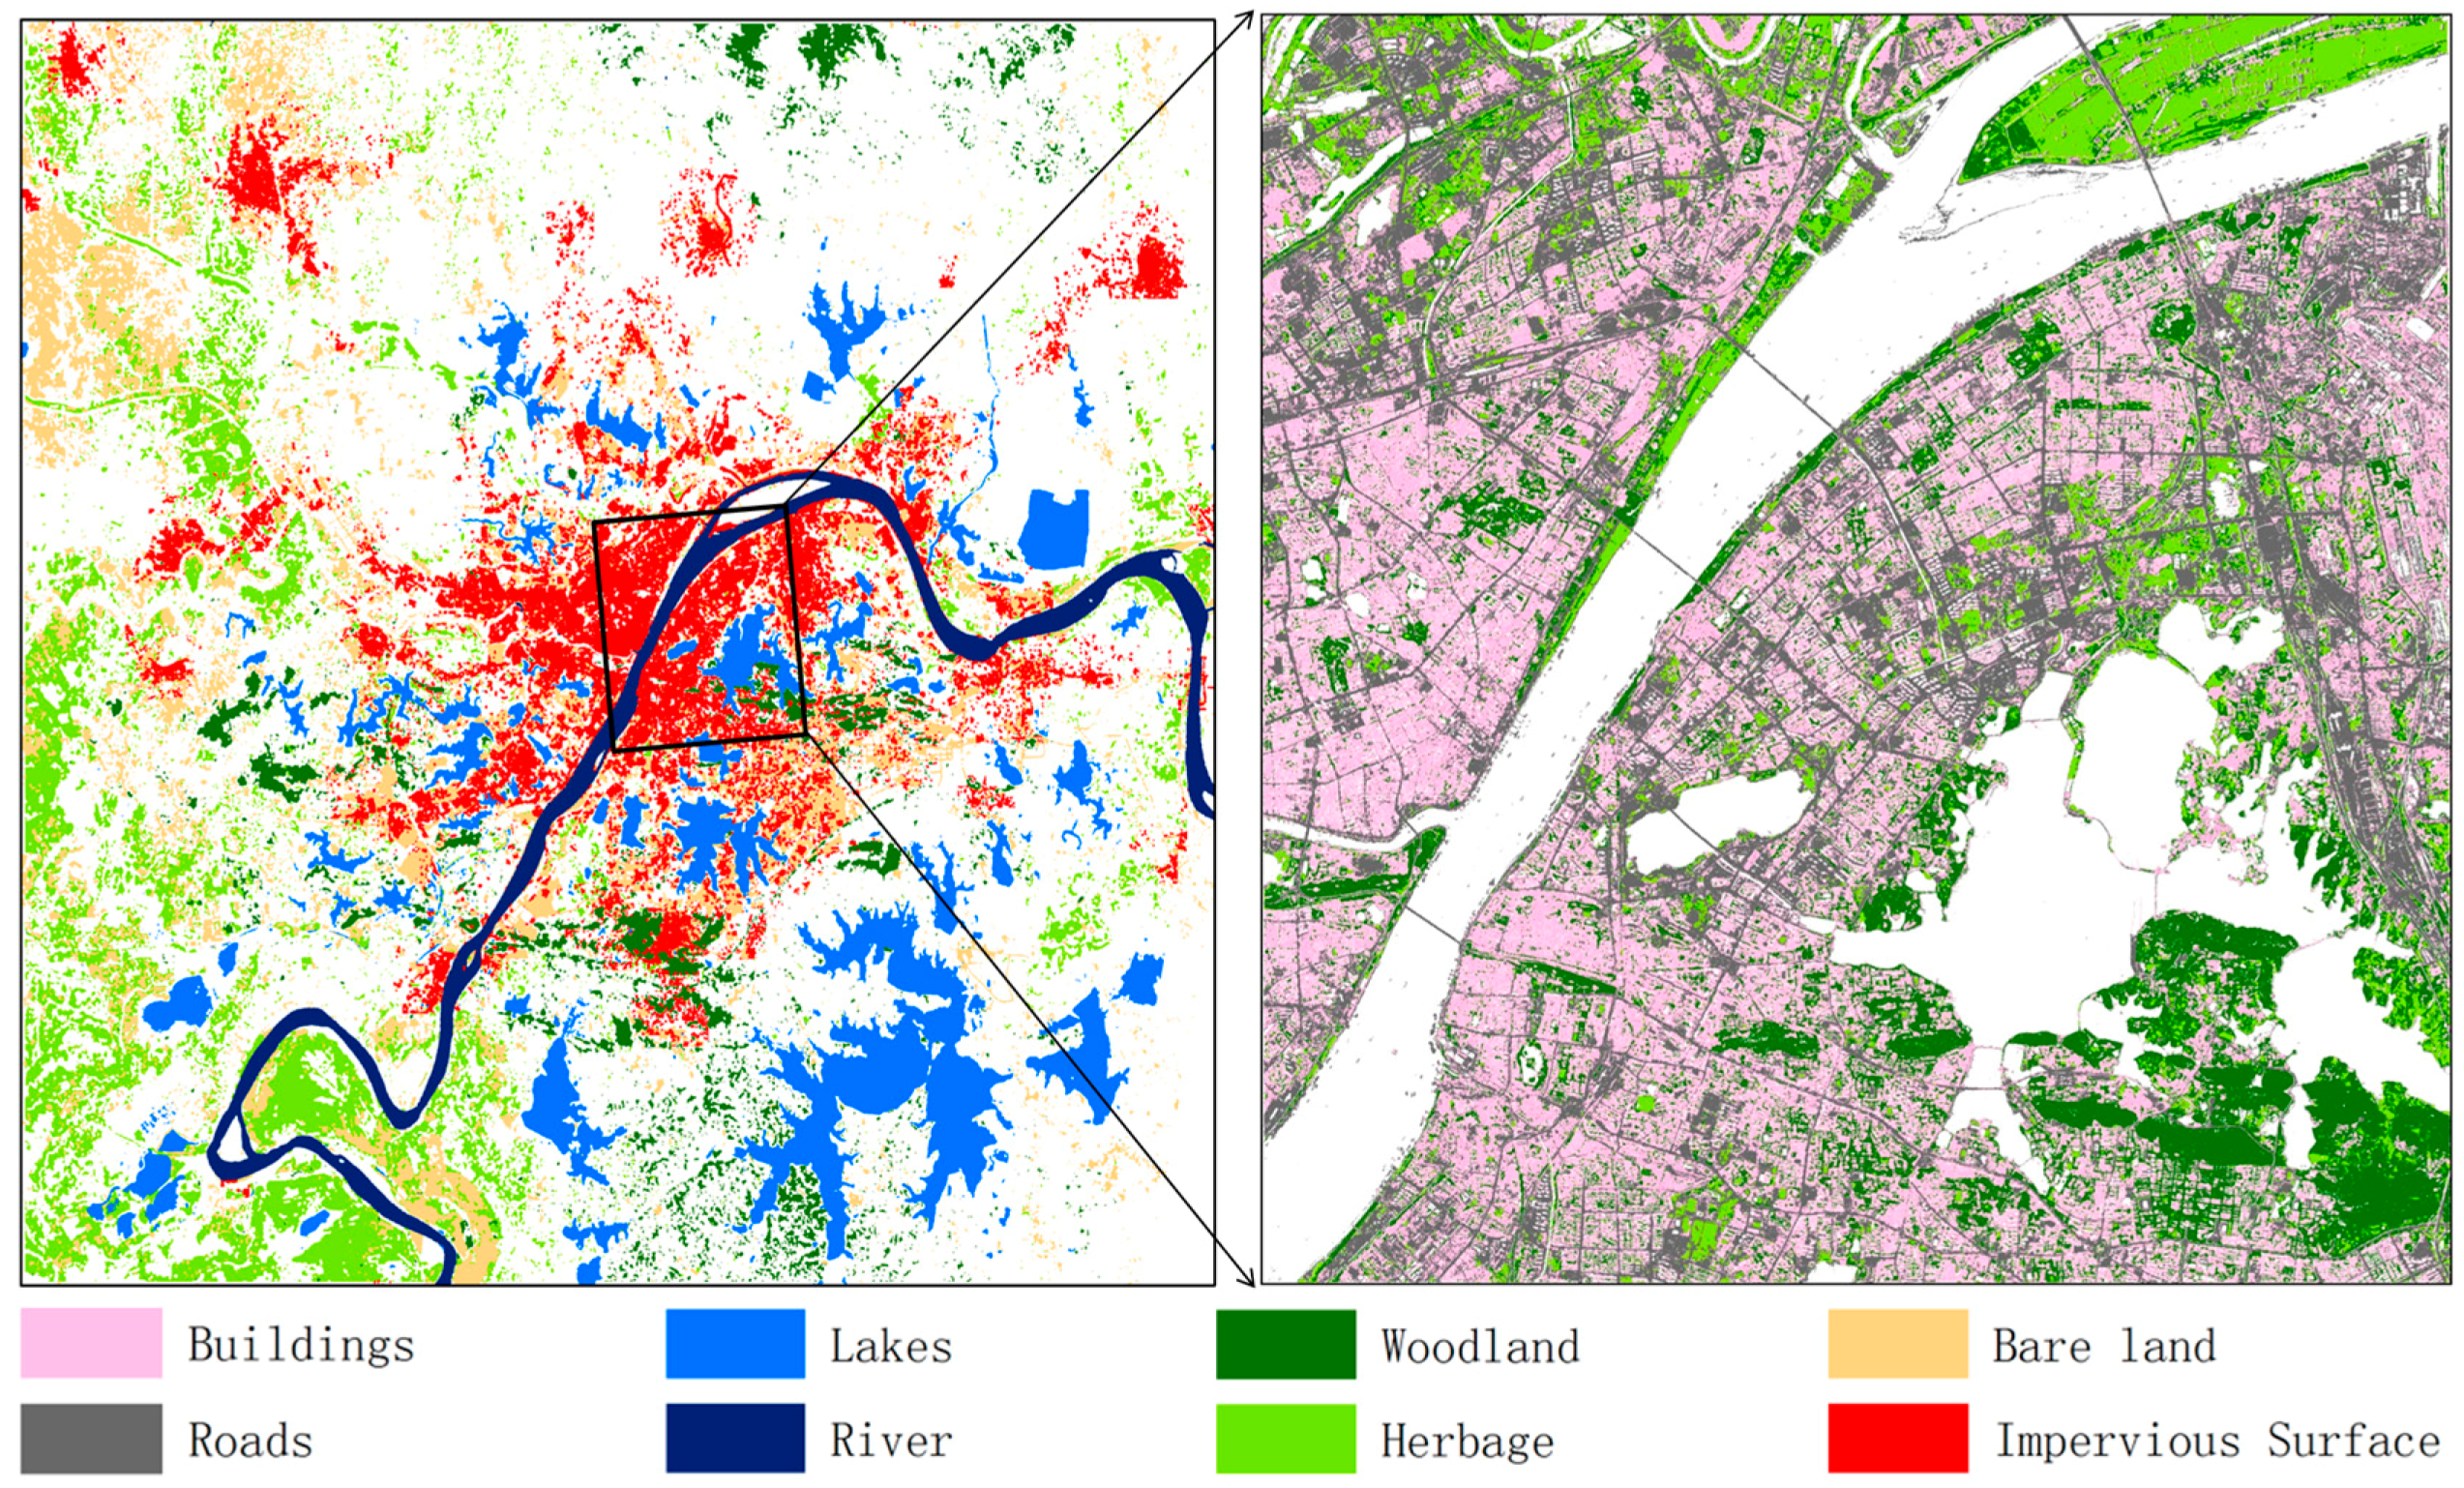
2. Study Area
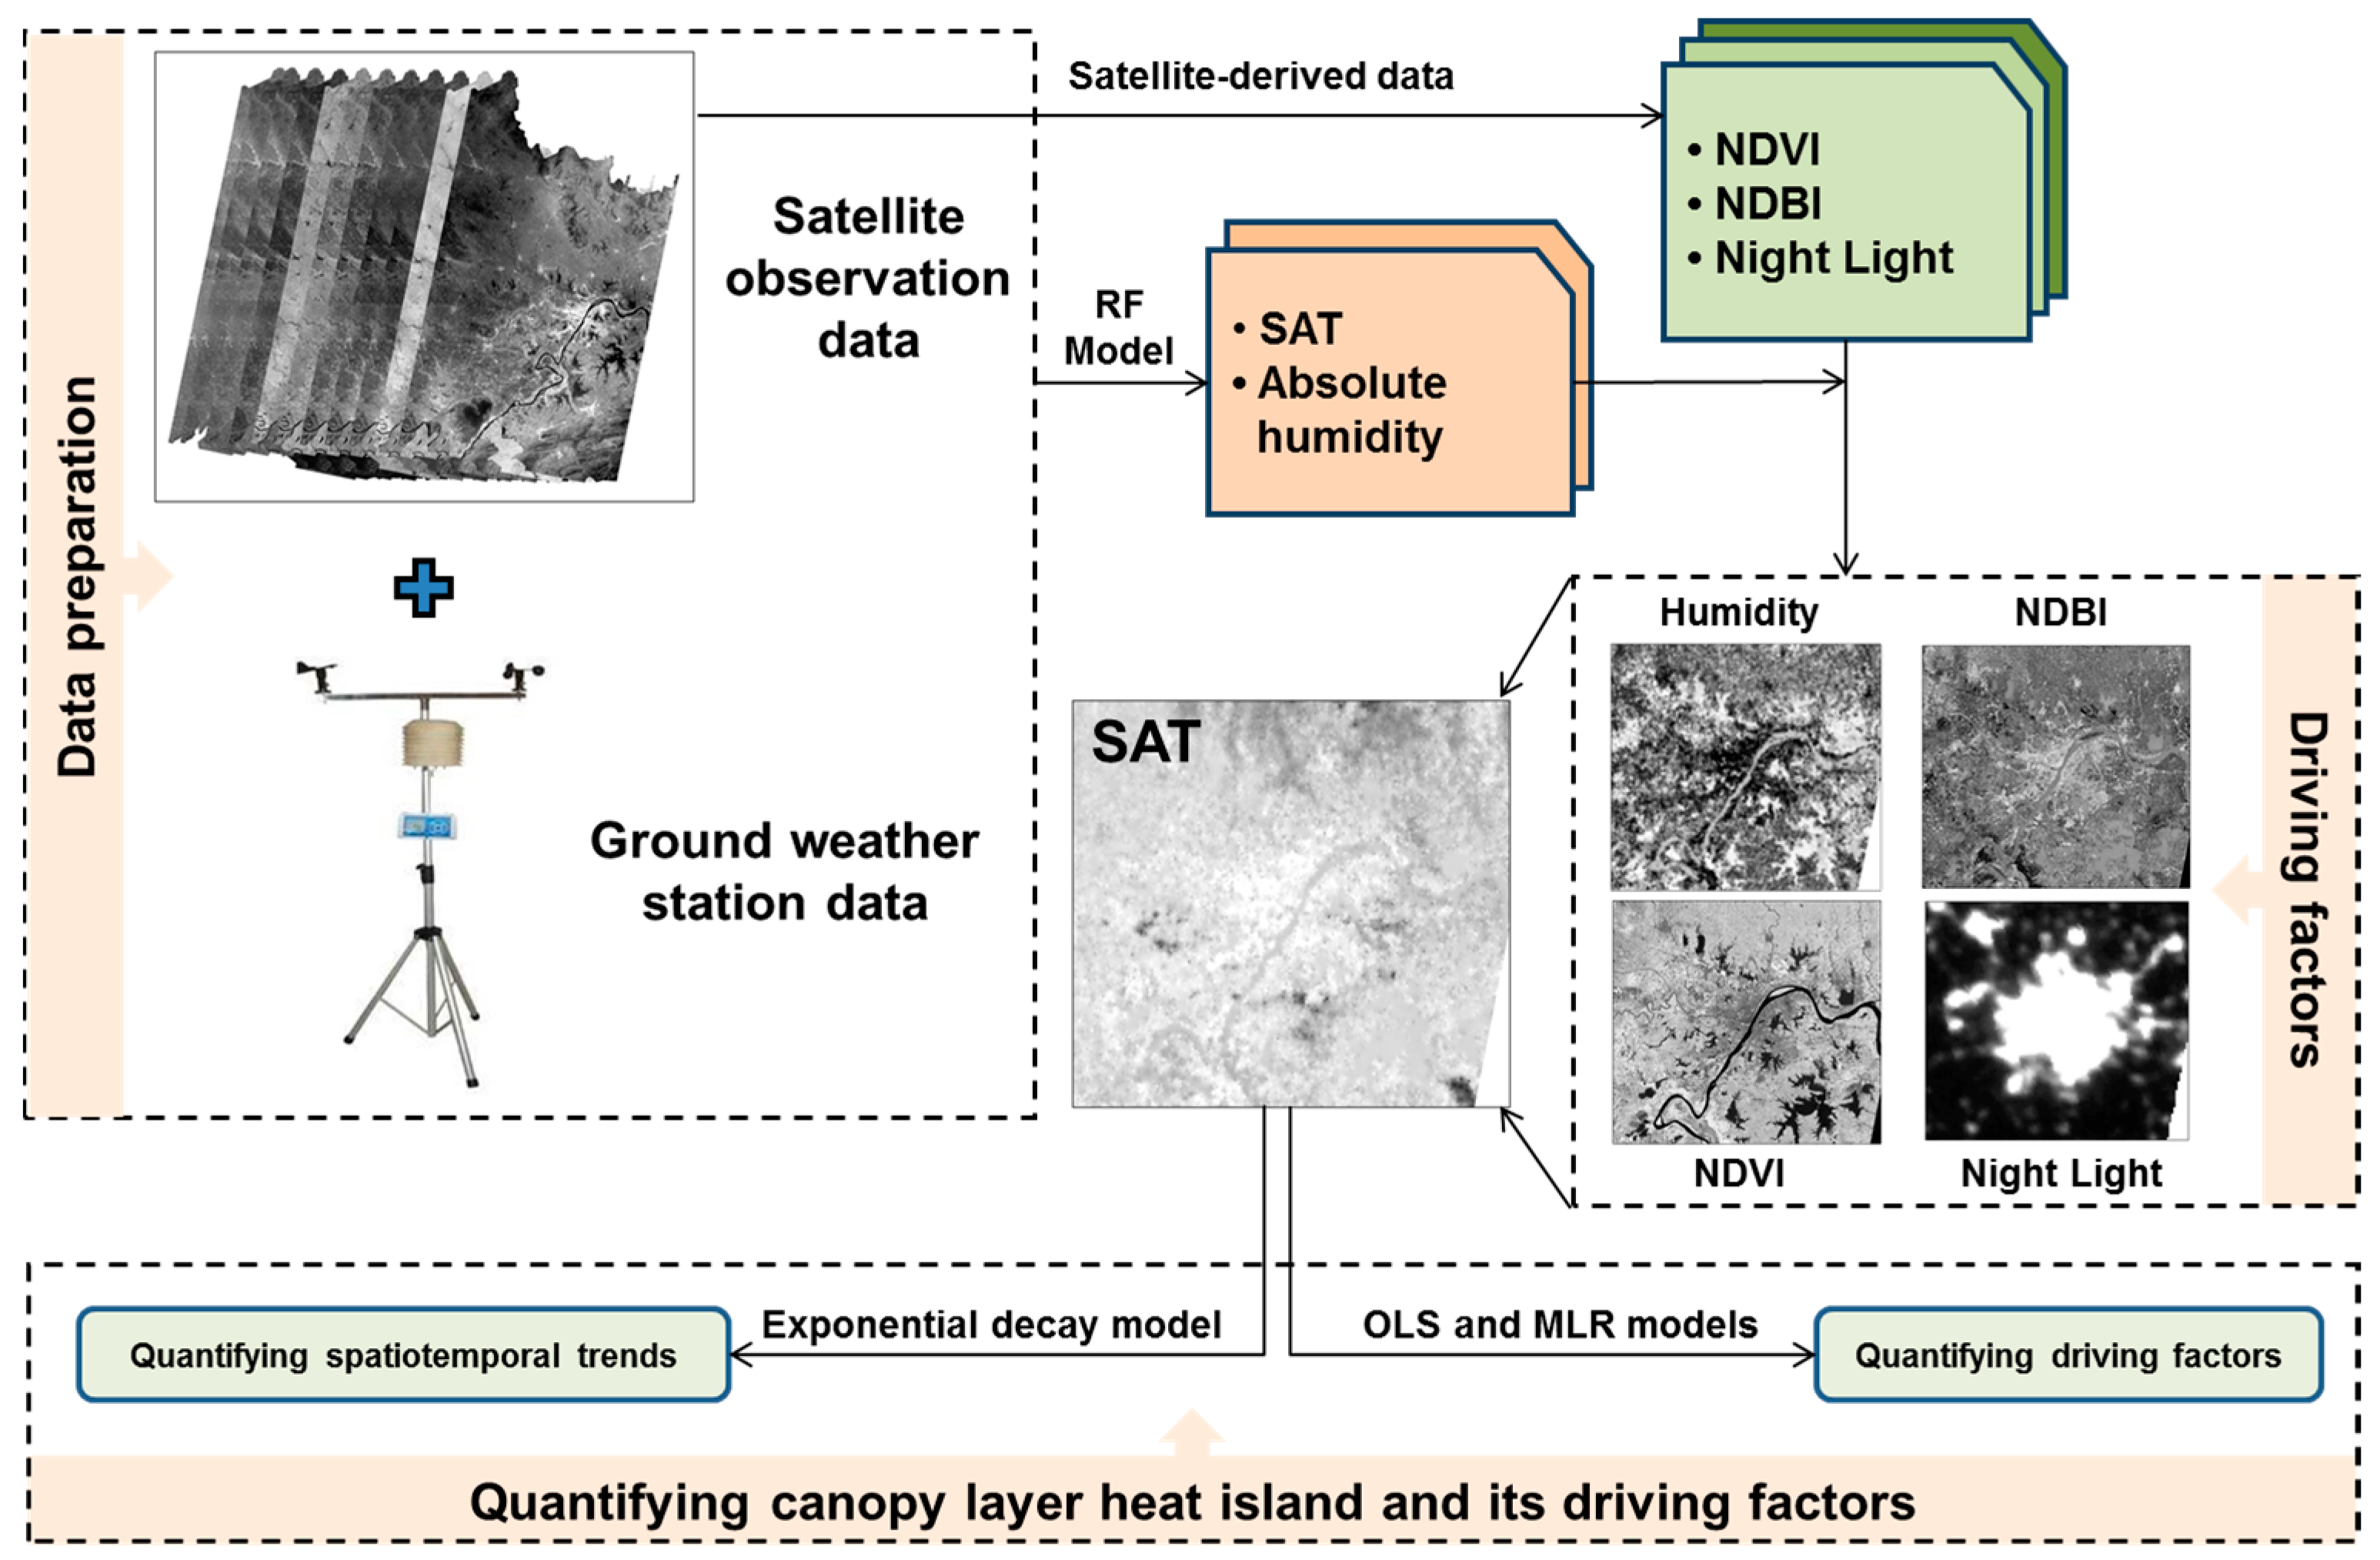
3. Materials and Methods
3.1. Data Preparation
3.2. Predicting SAT and Absolute Humidity
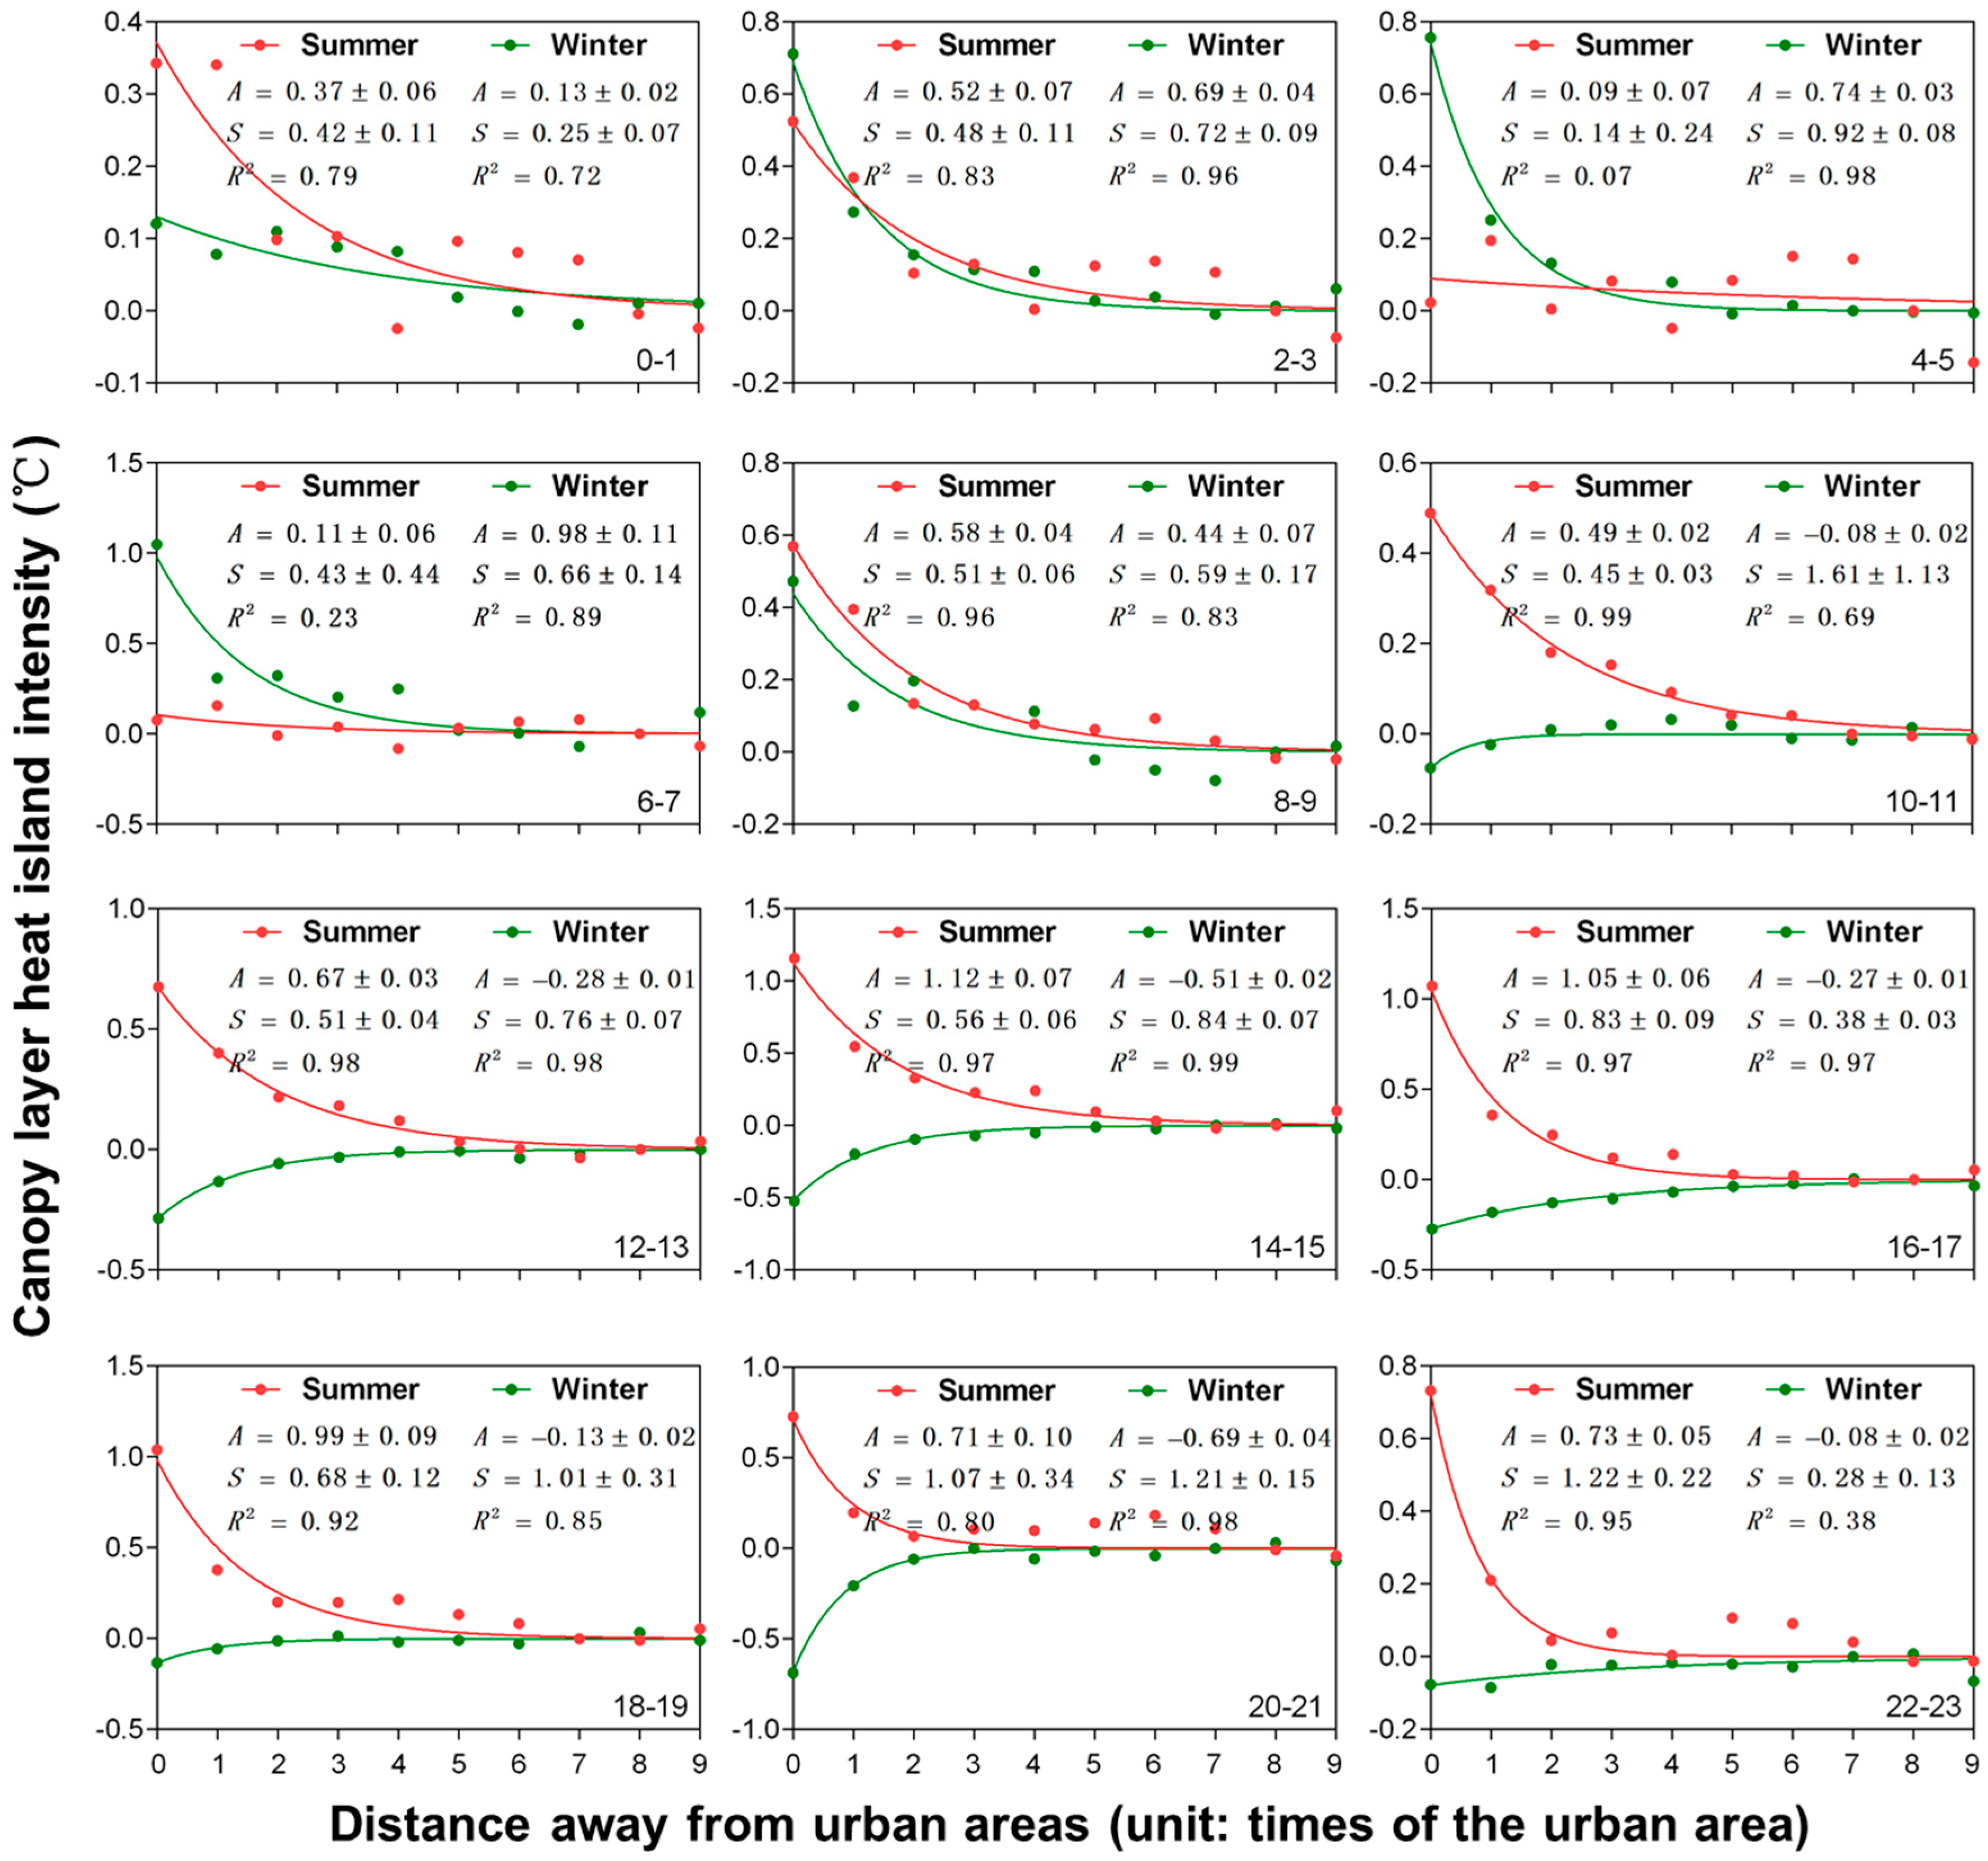
3.3. Quantifying the CLHII and Footprint
3.4. Quantifying Potential Drivers of the CLHI
4. Results
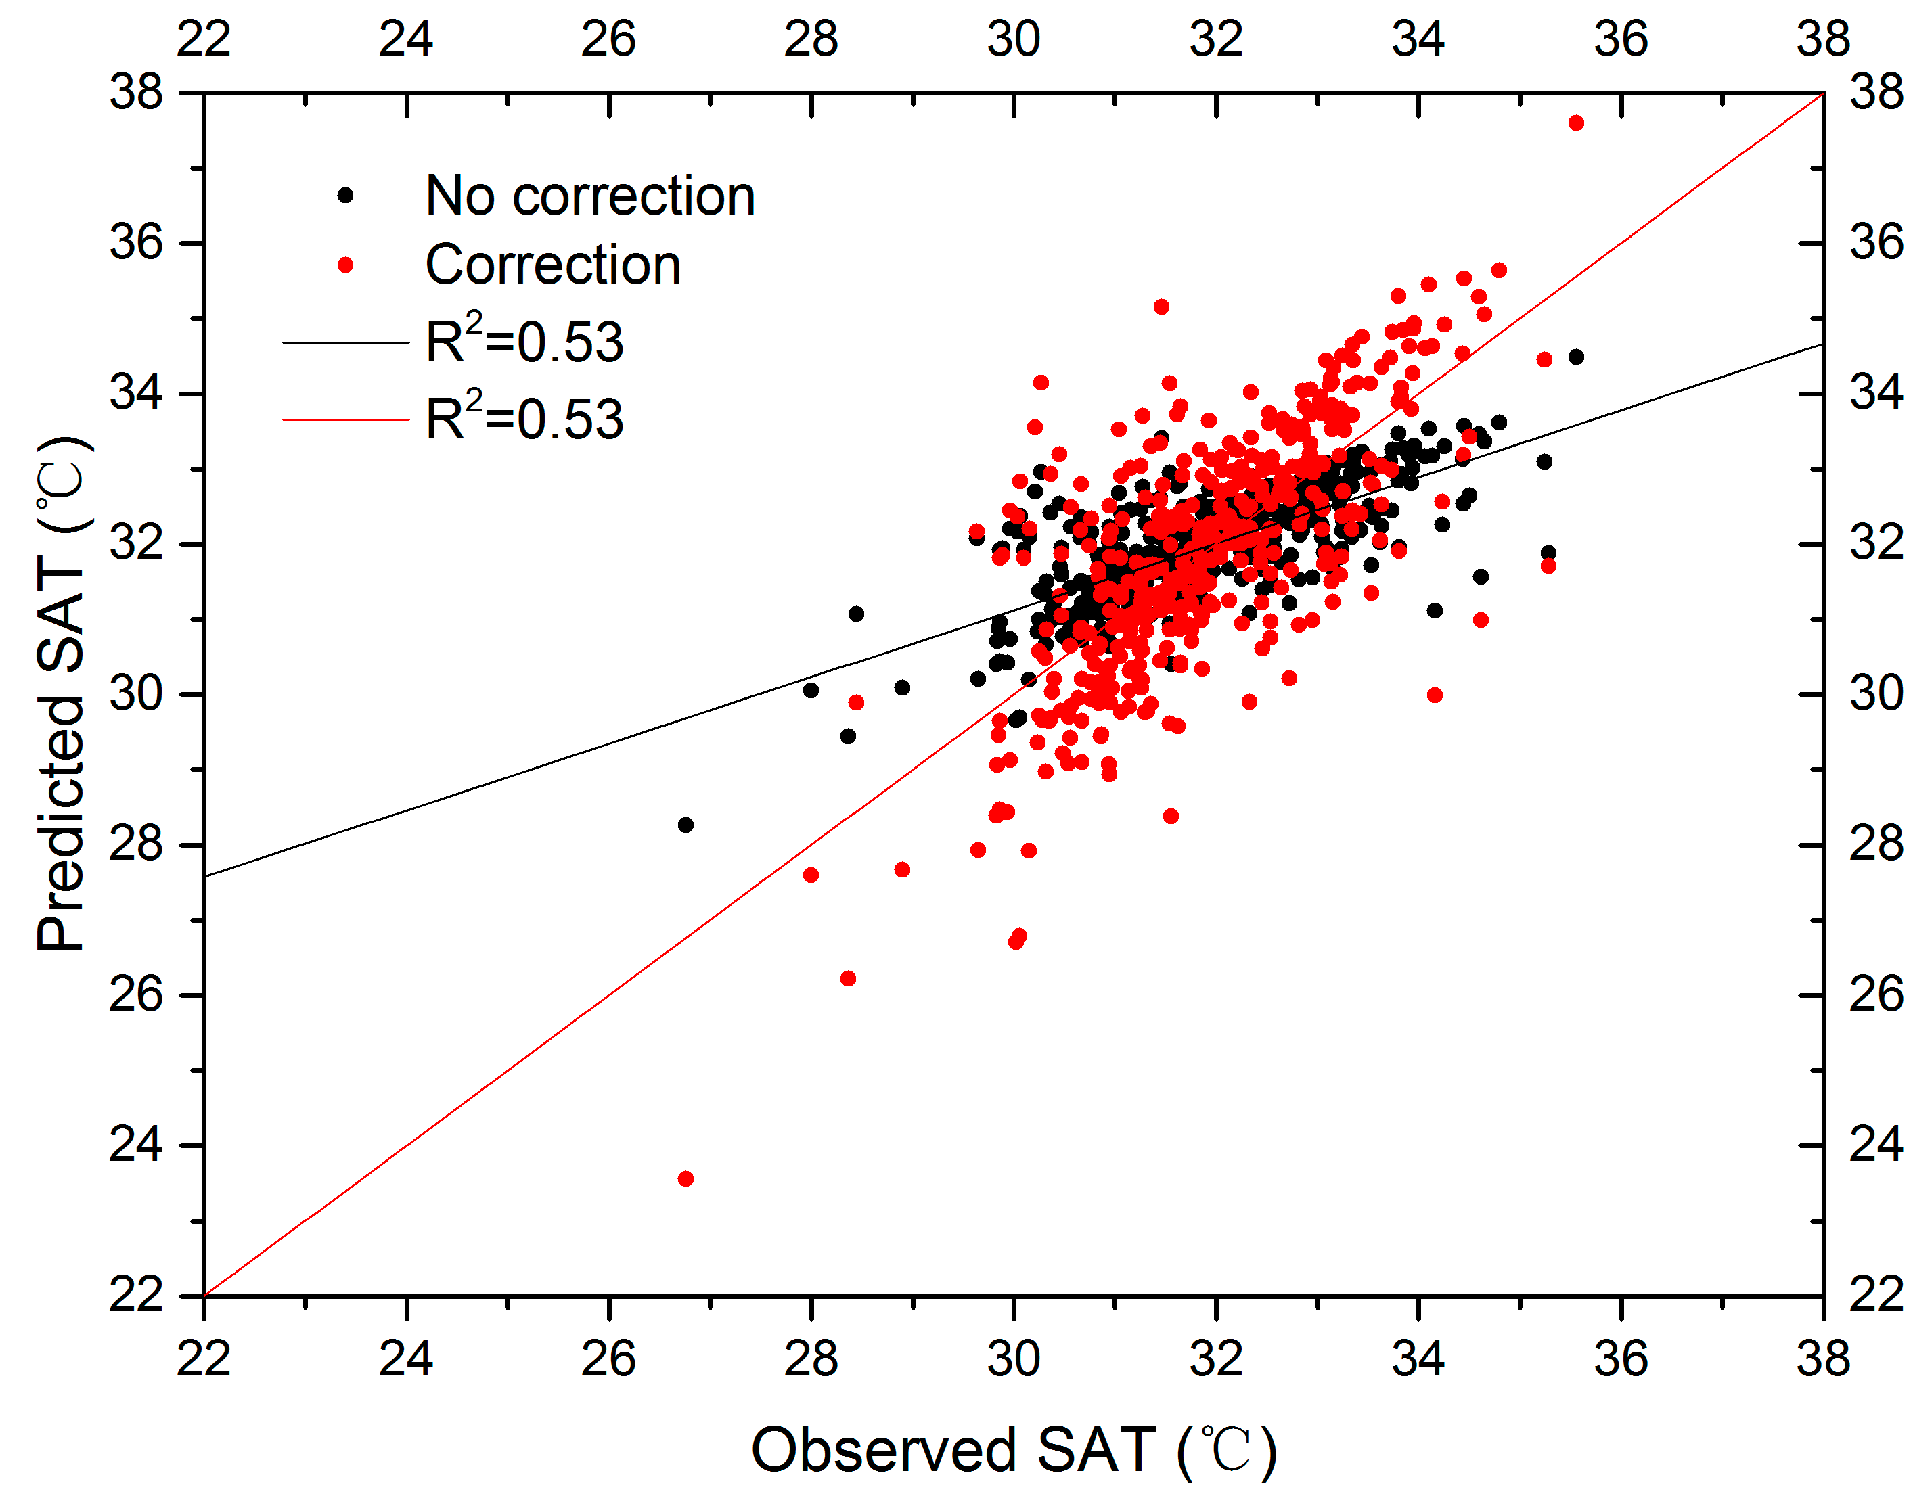
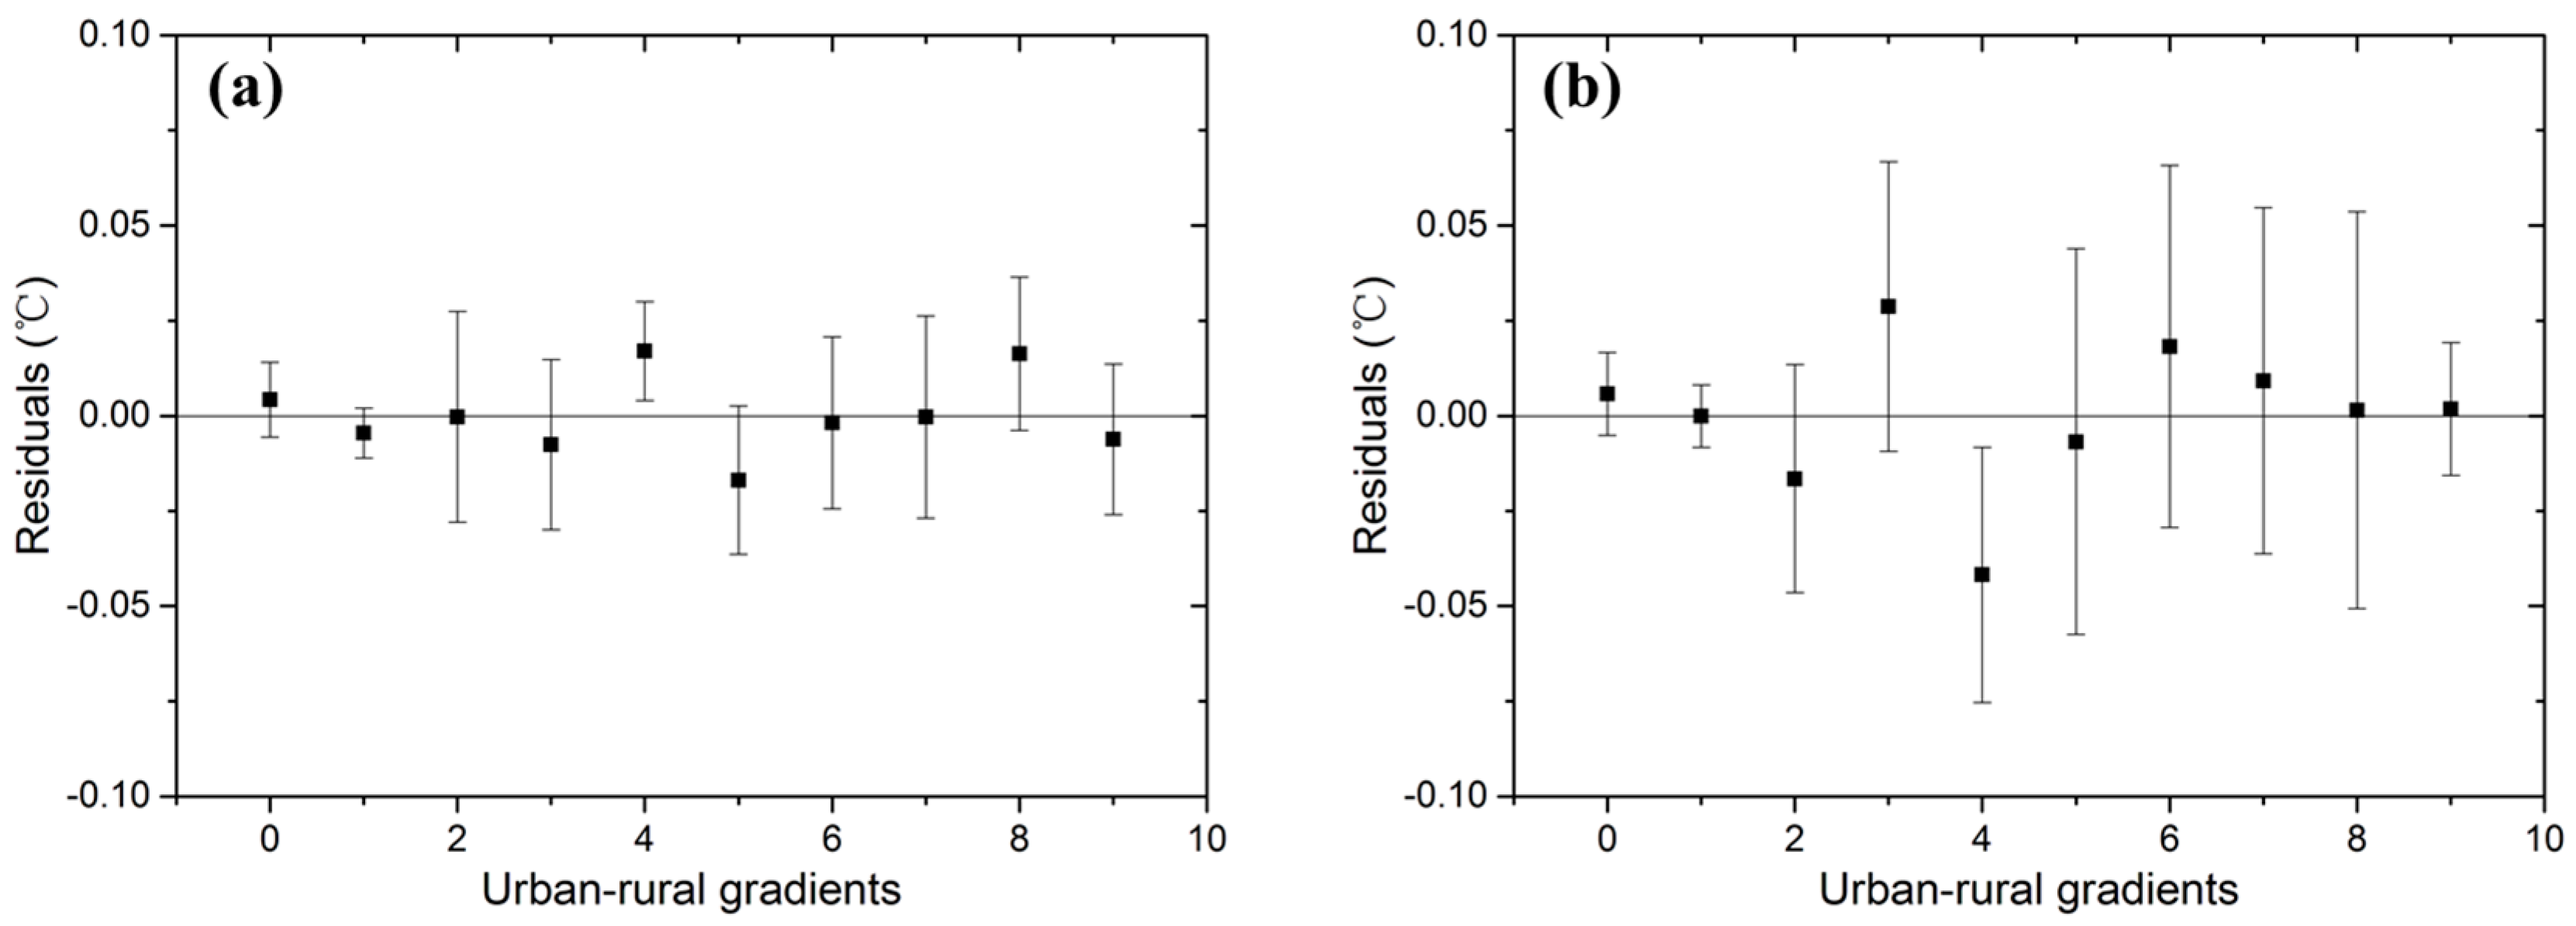
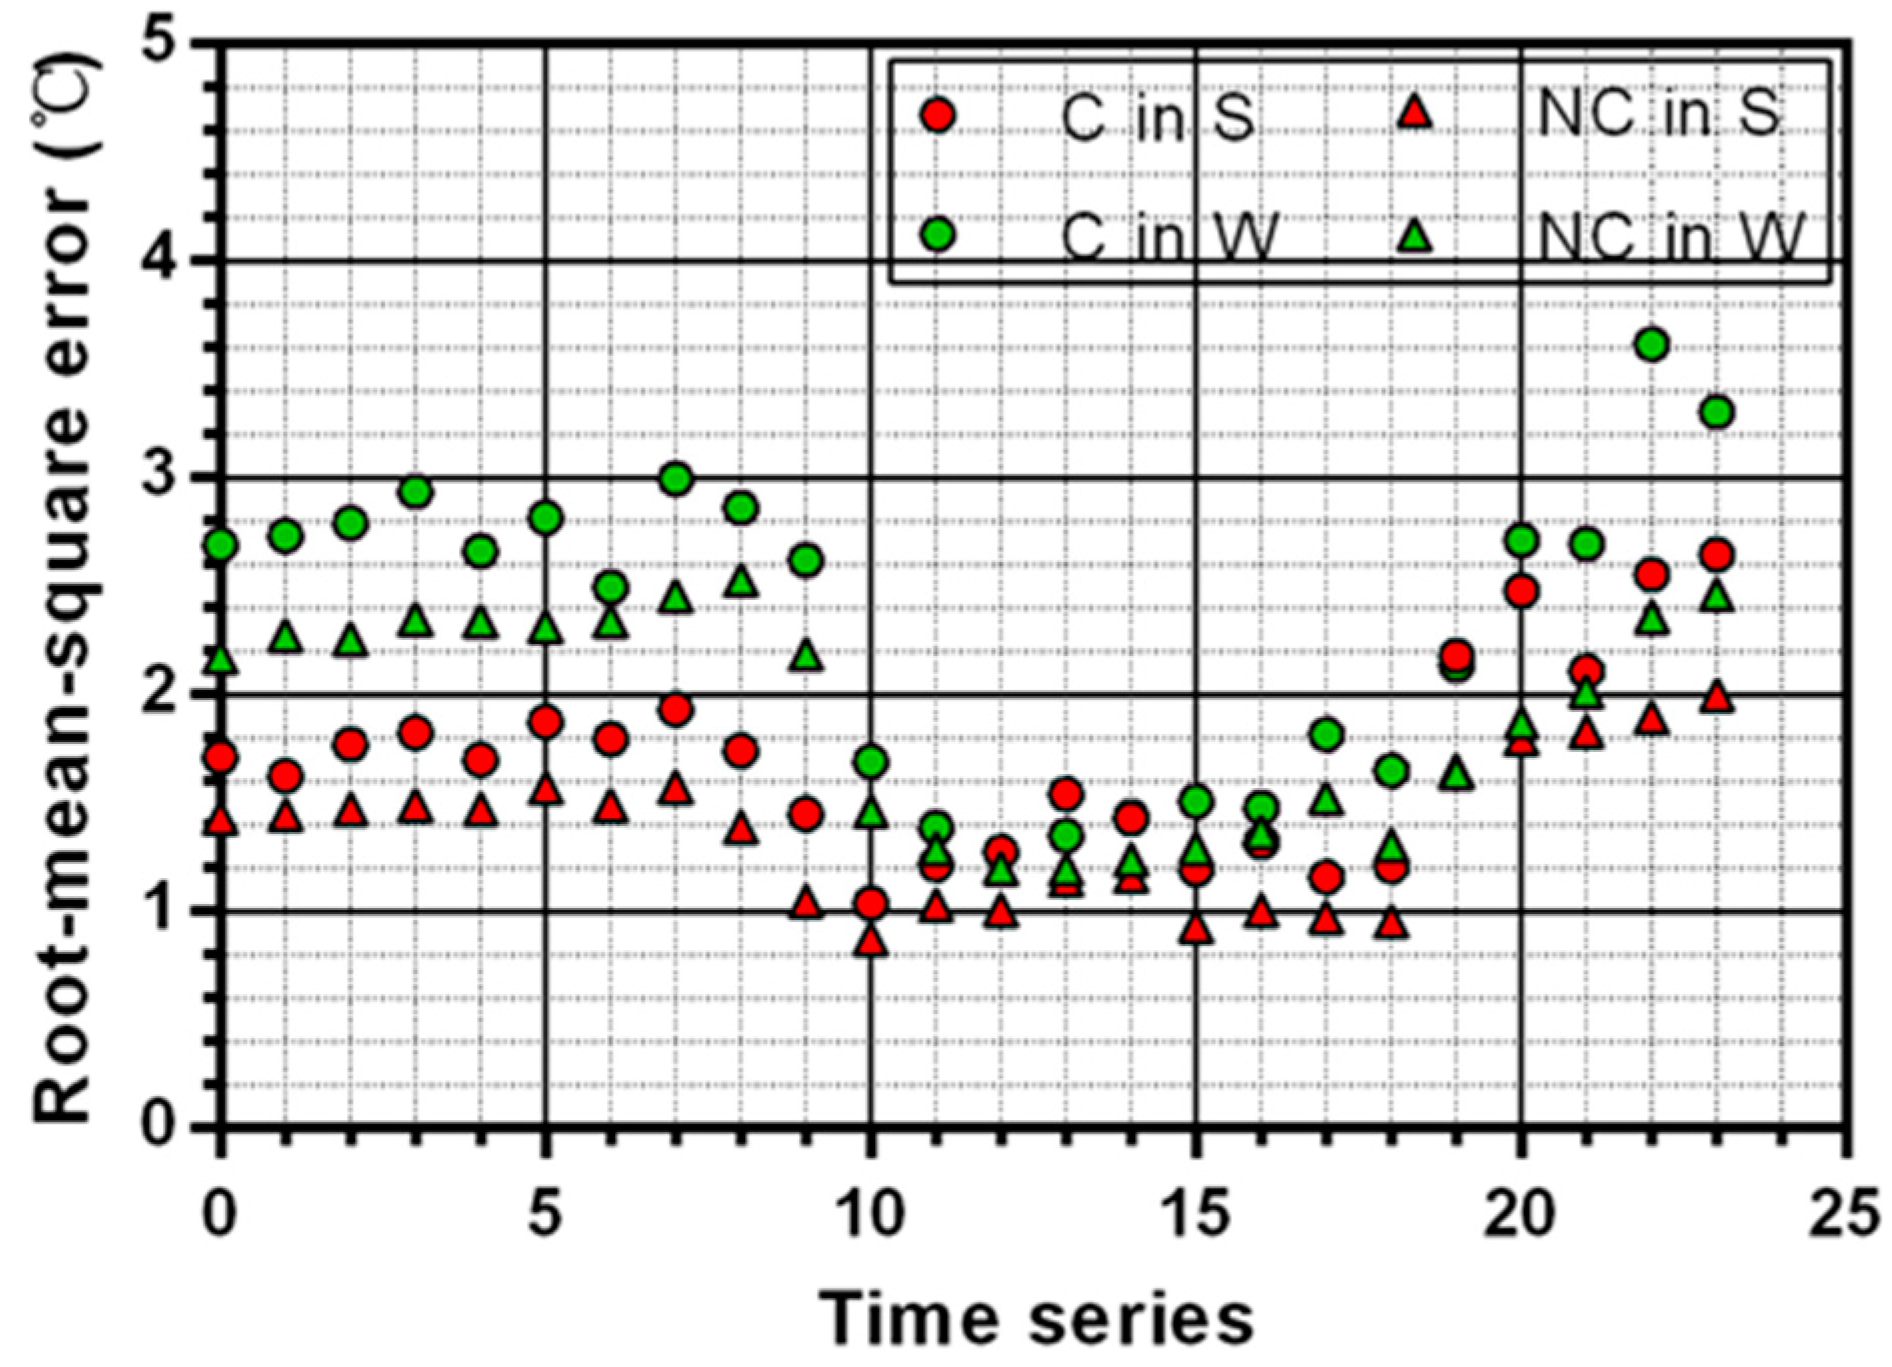
4.1. Data Processing Performance
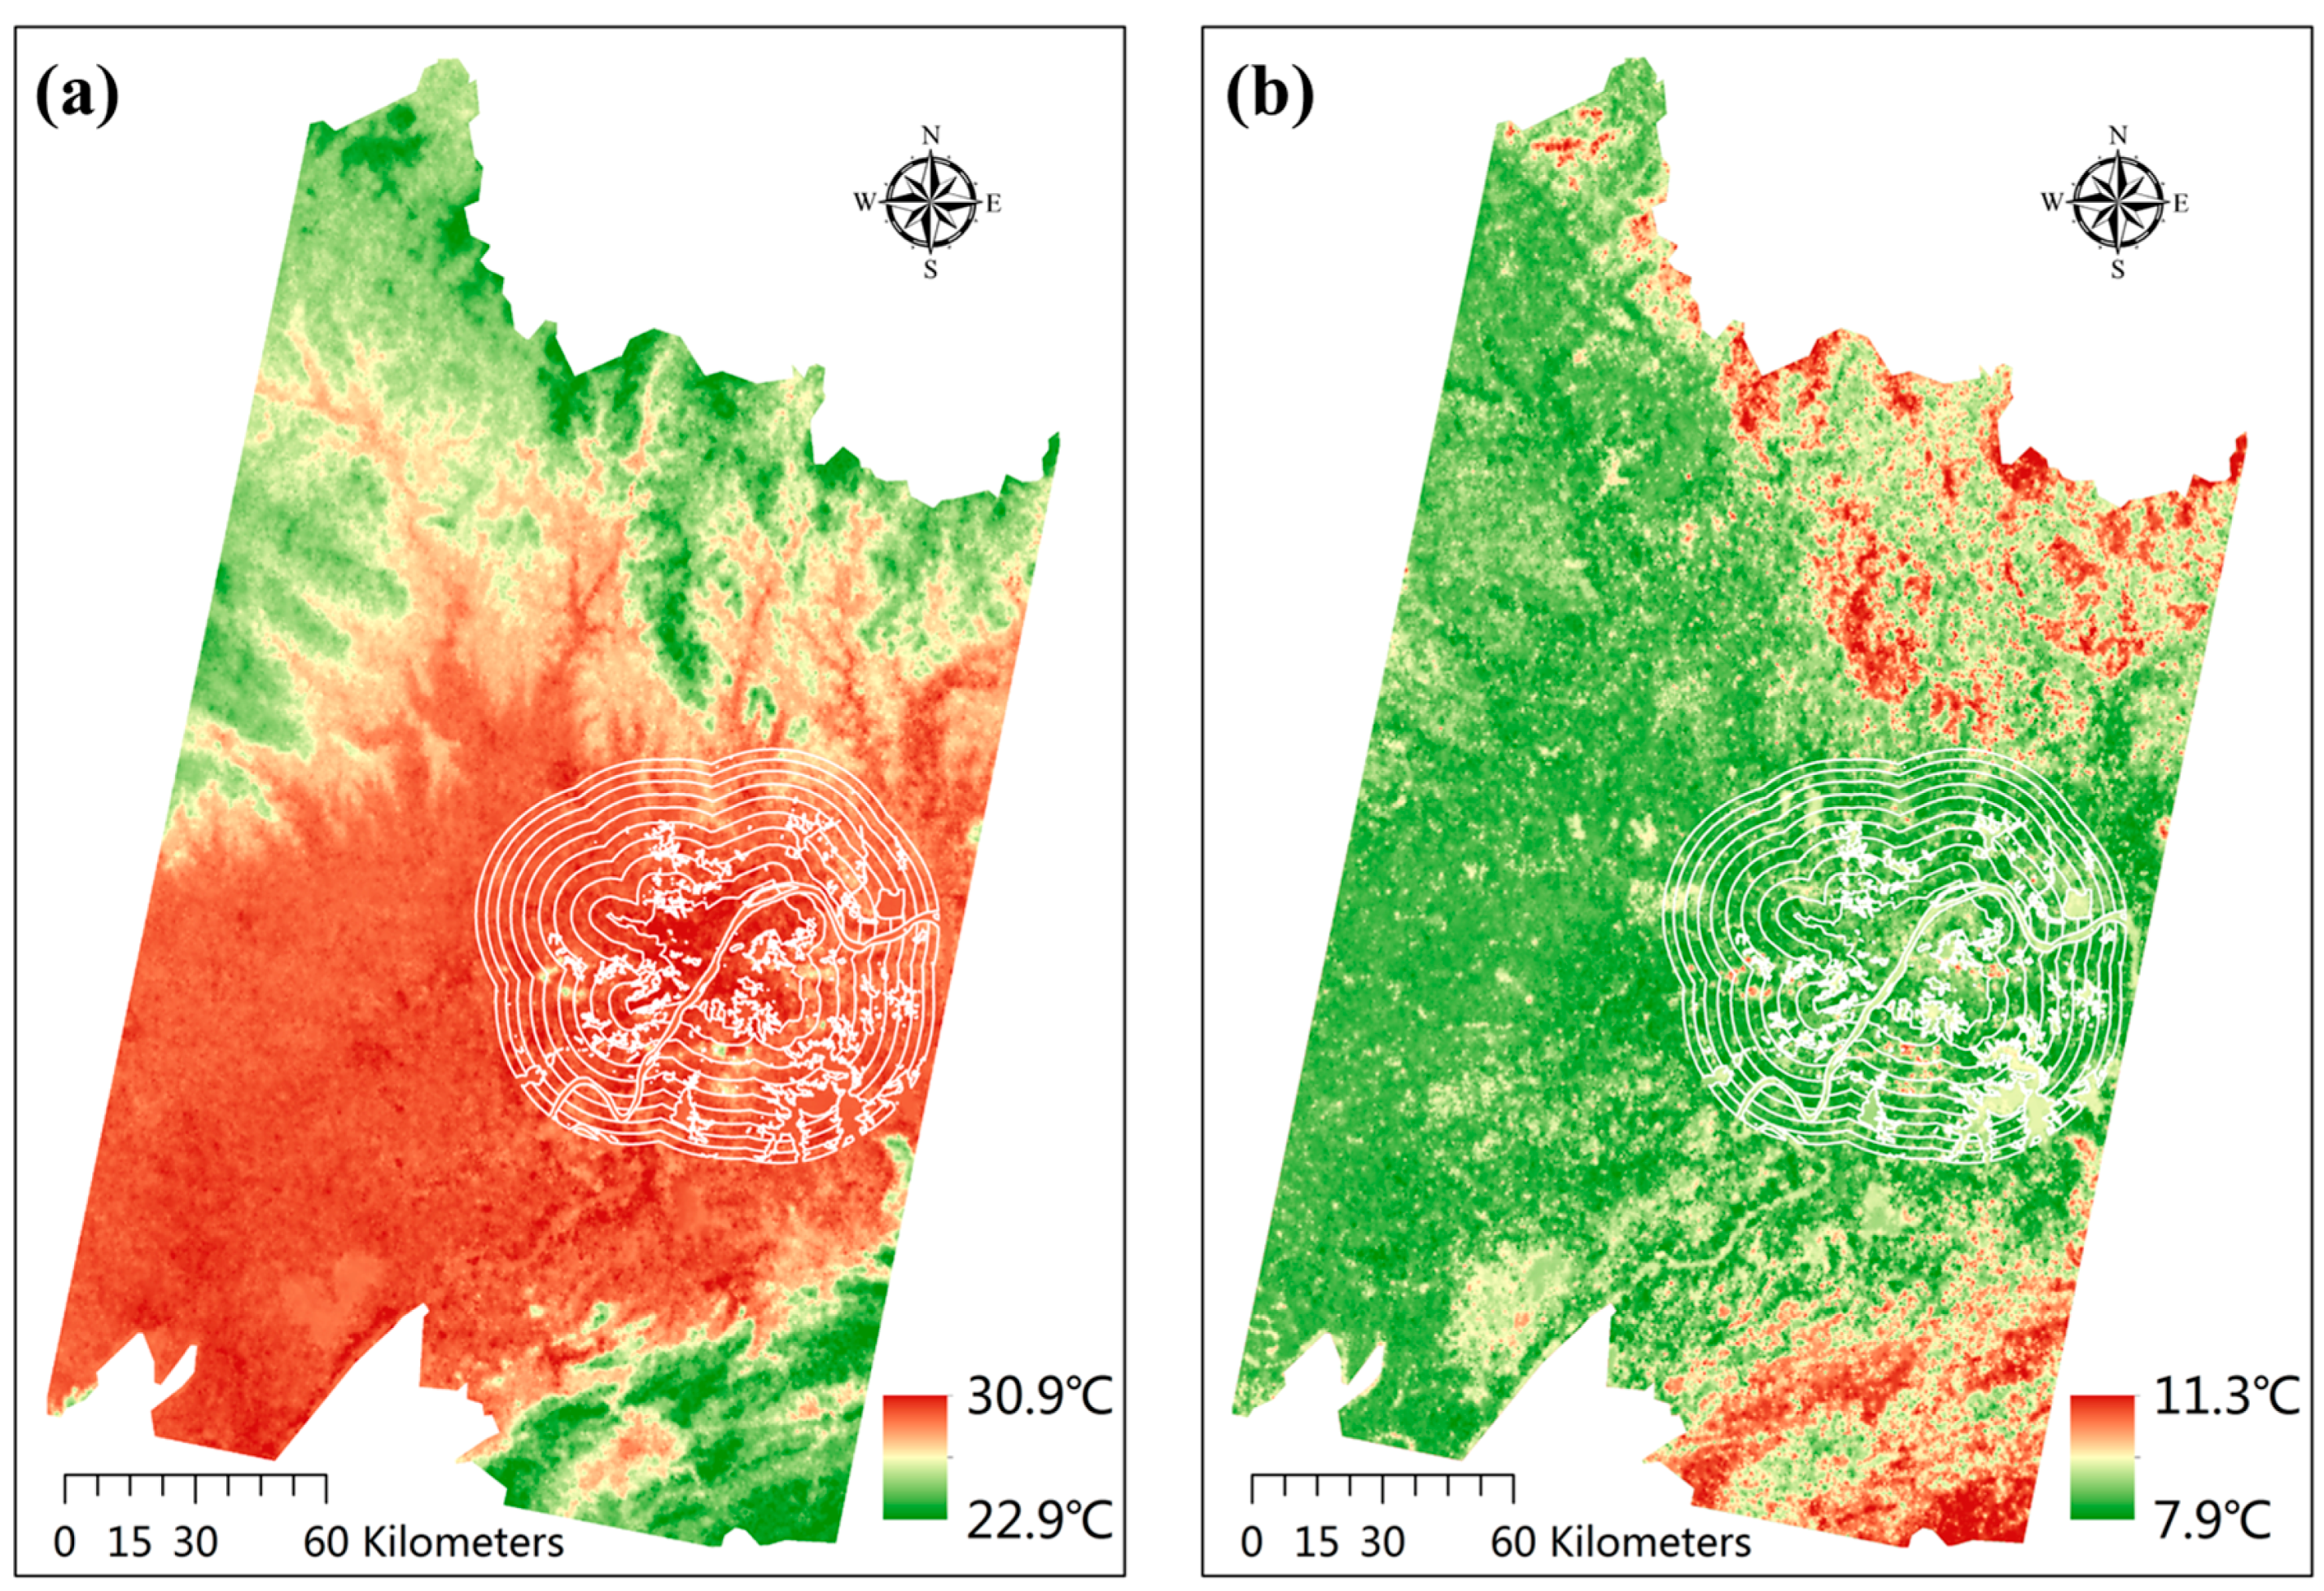
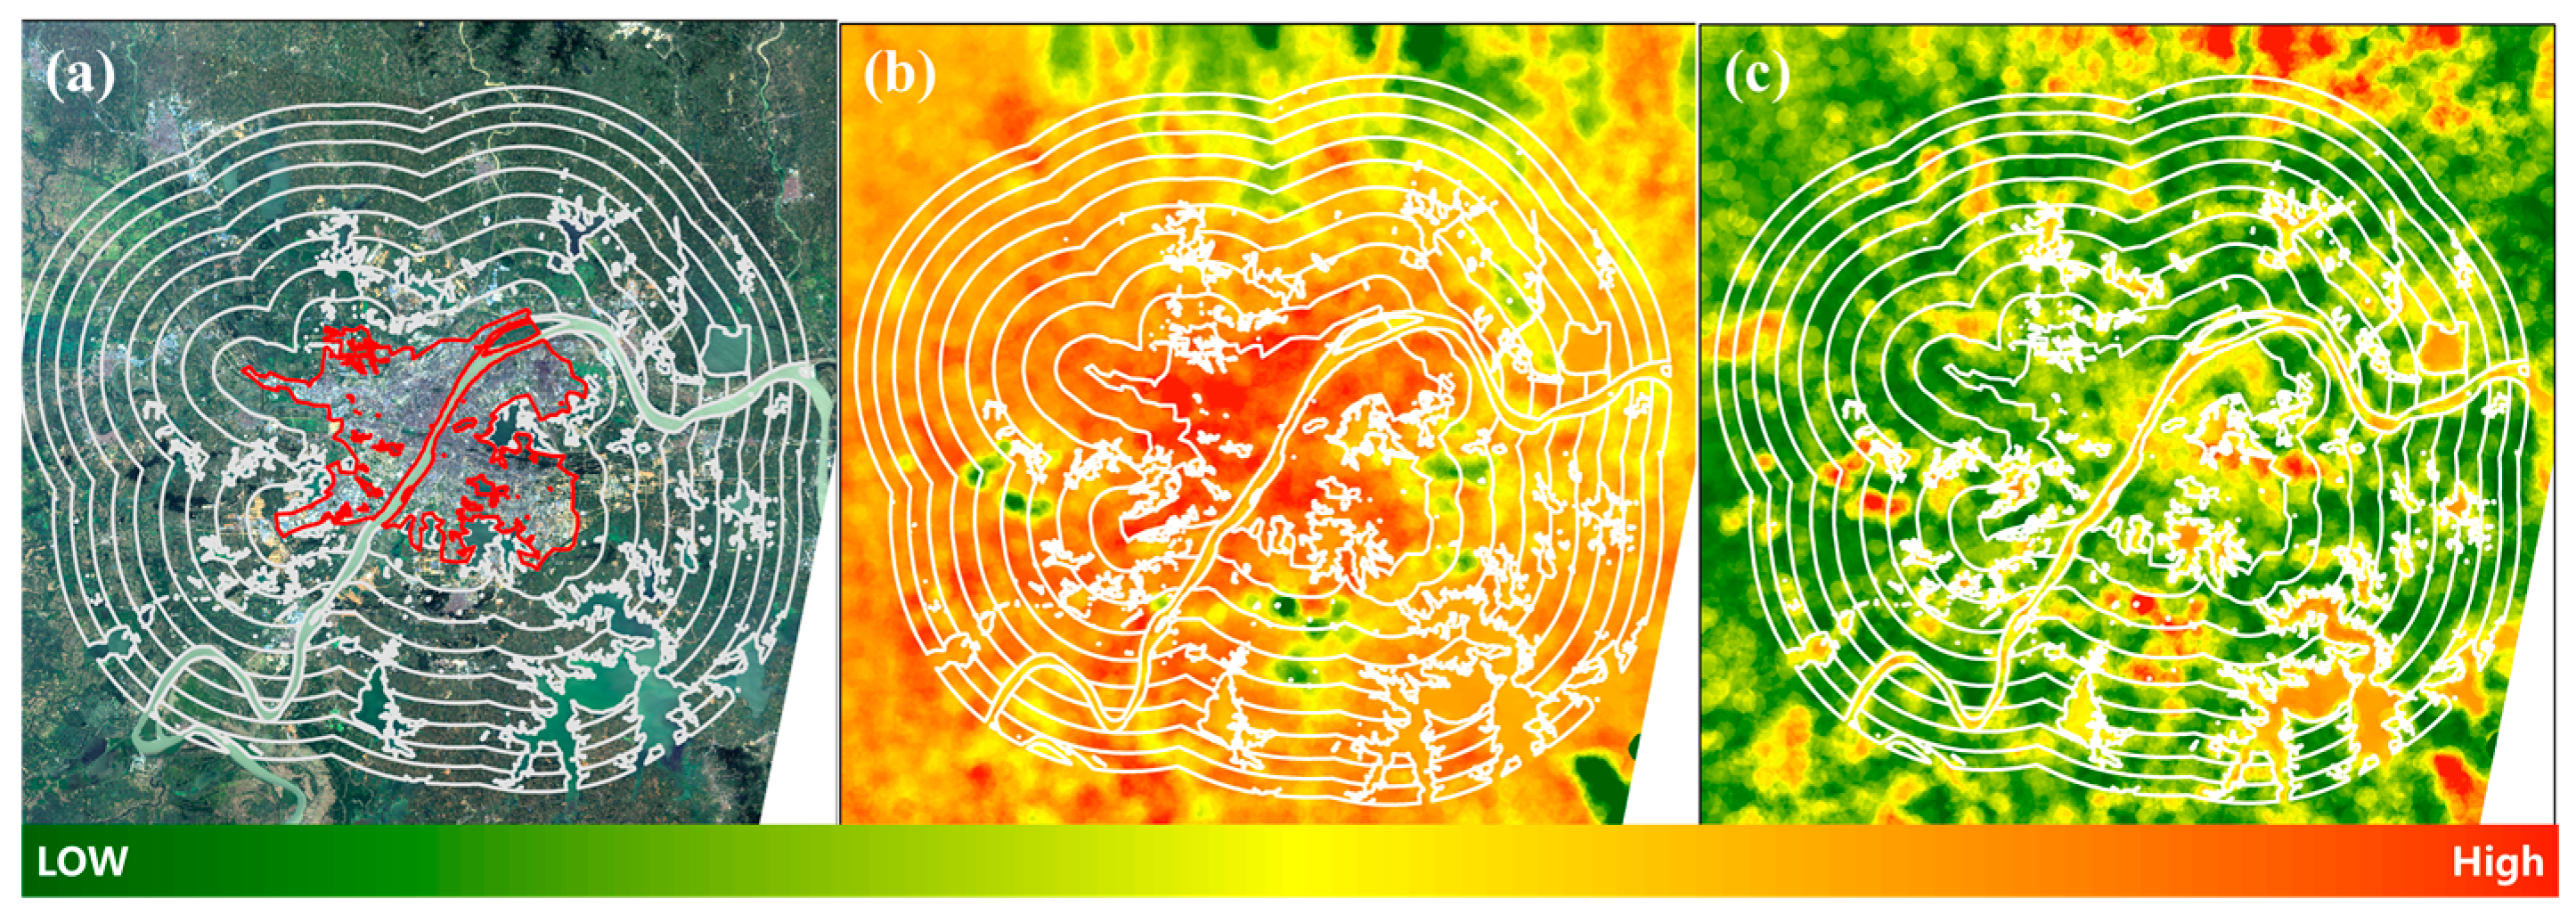
4.2. CLHI and SUHI
4.3. Relationships between CLHI and Potential Drivers
5. Discussion
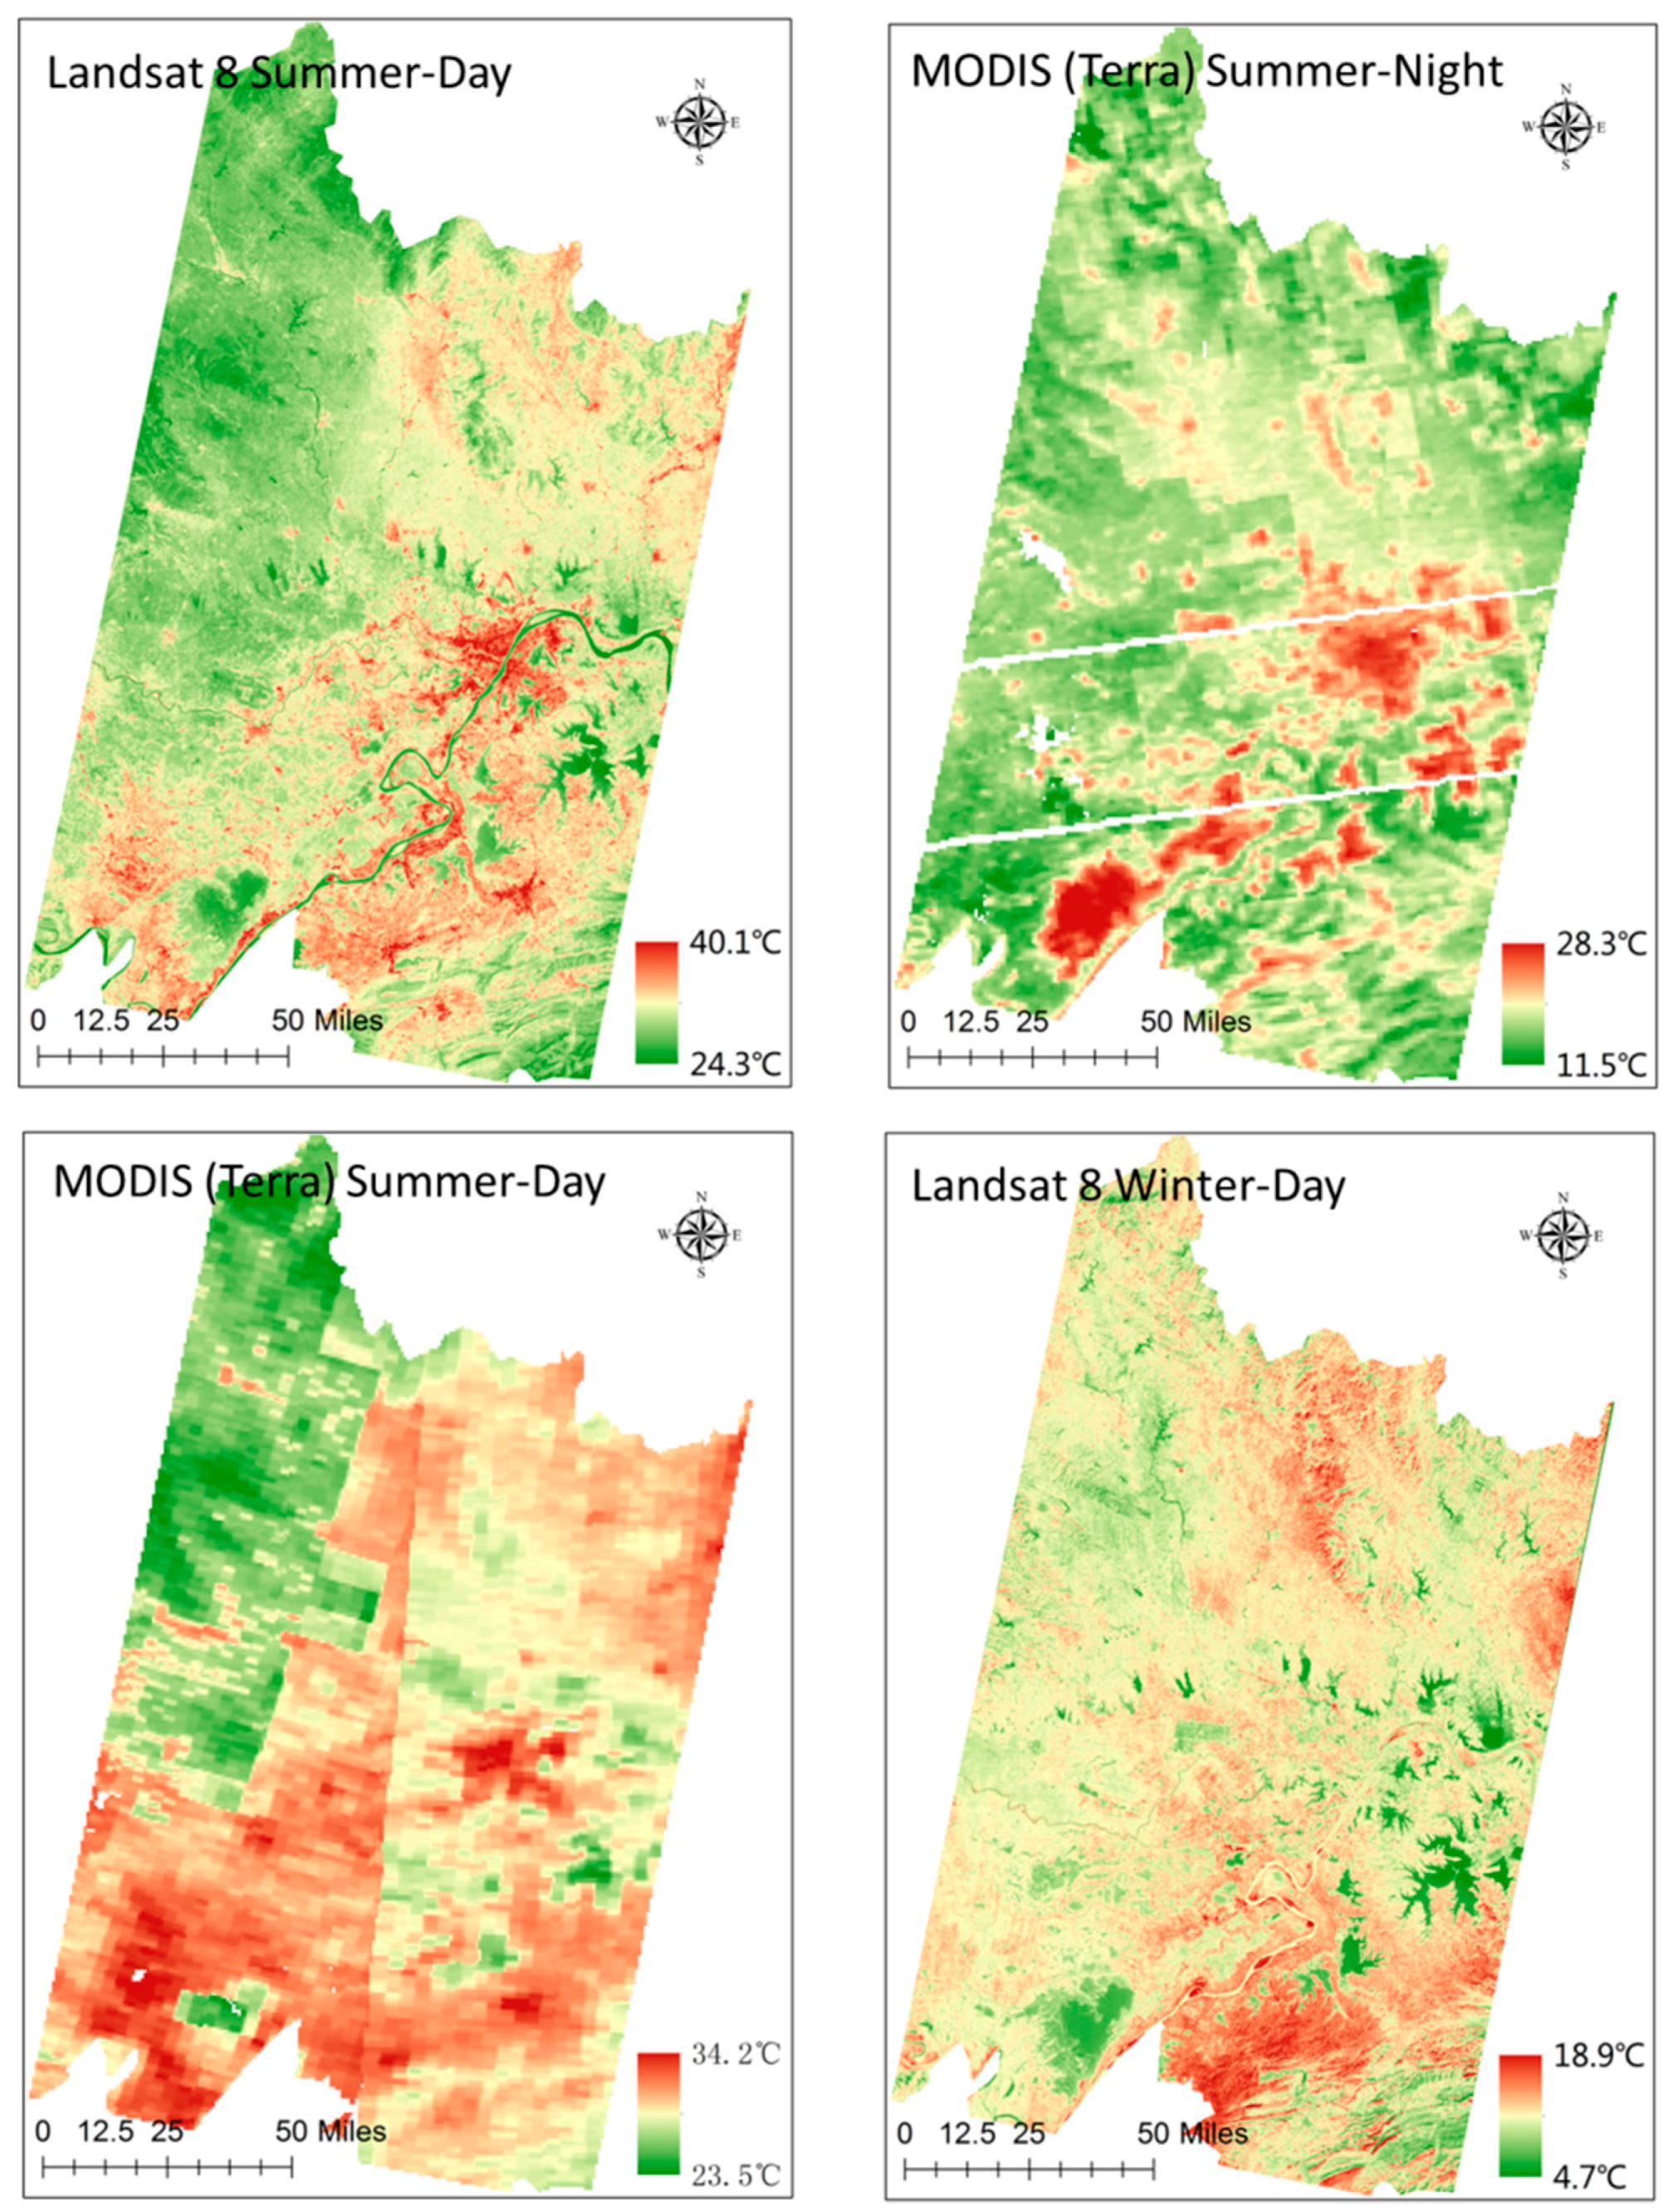
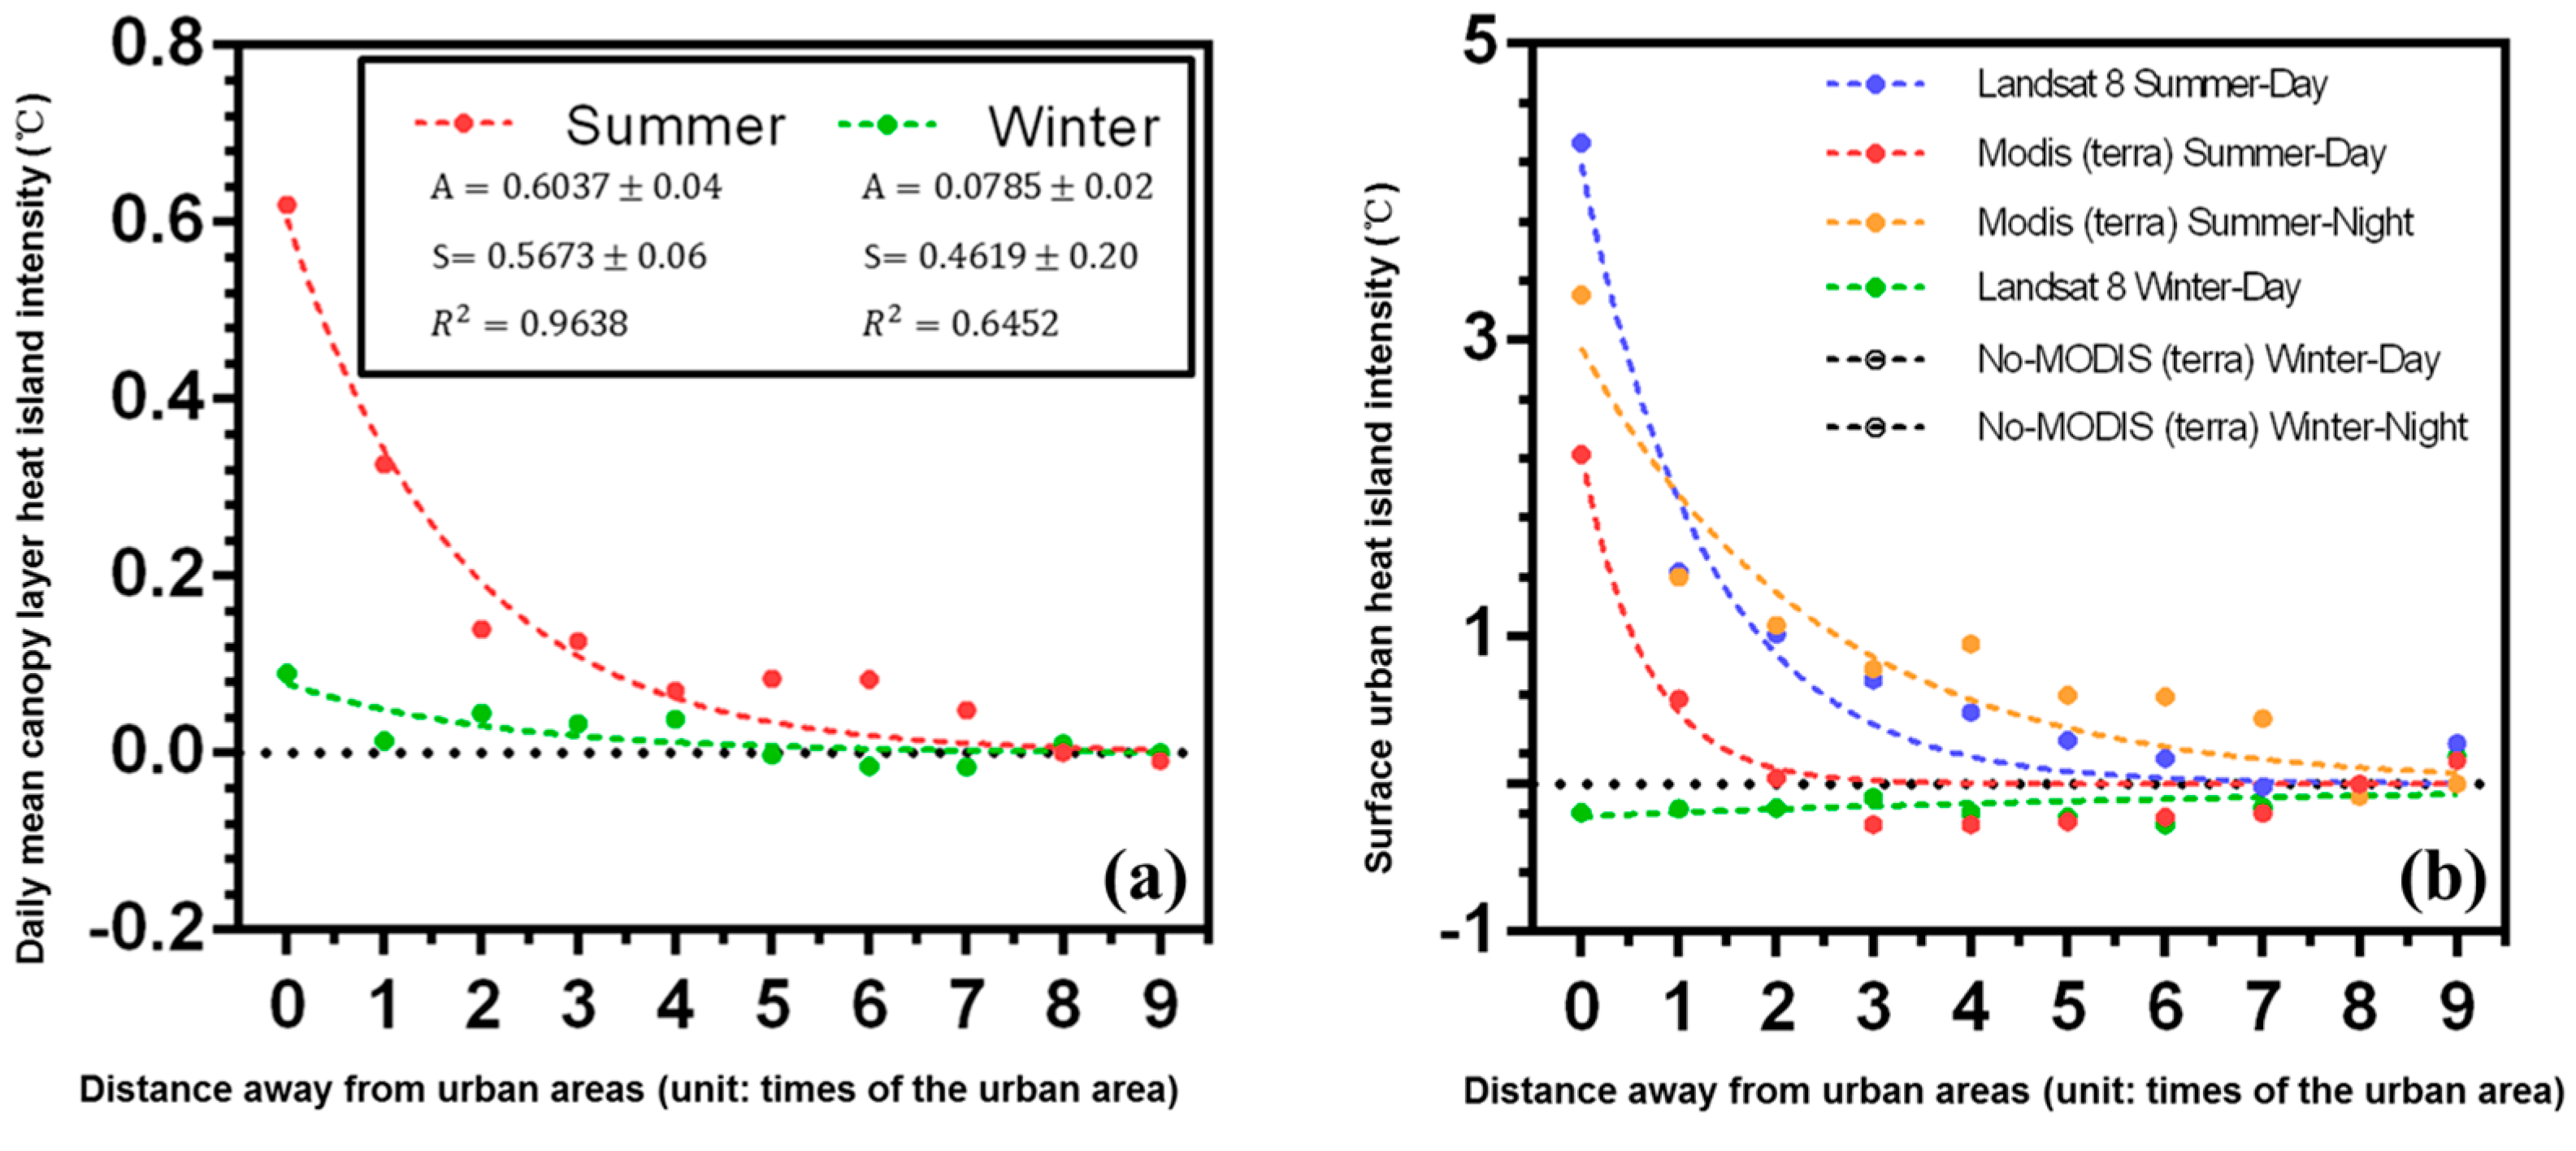
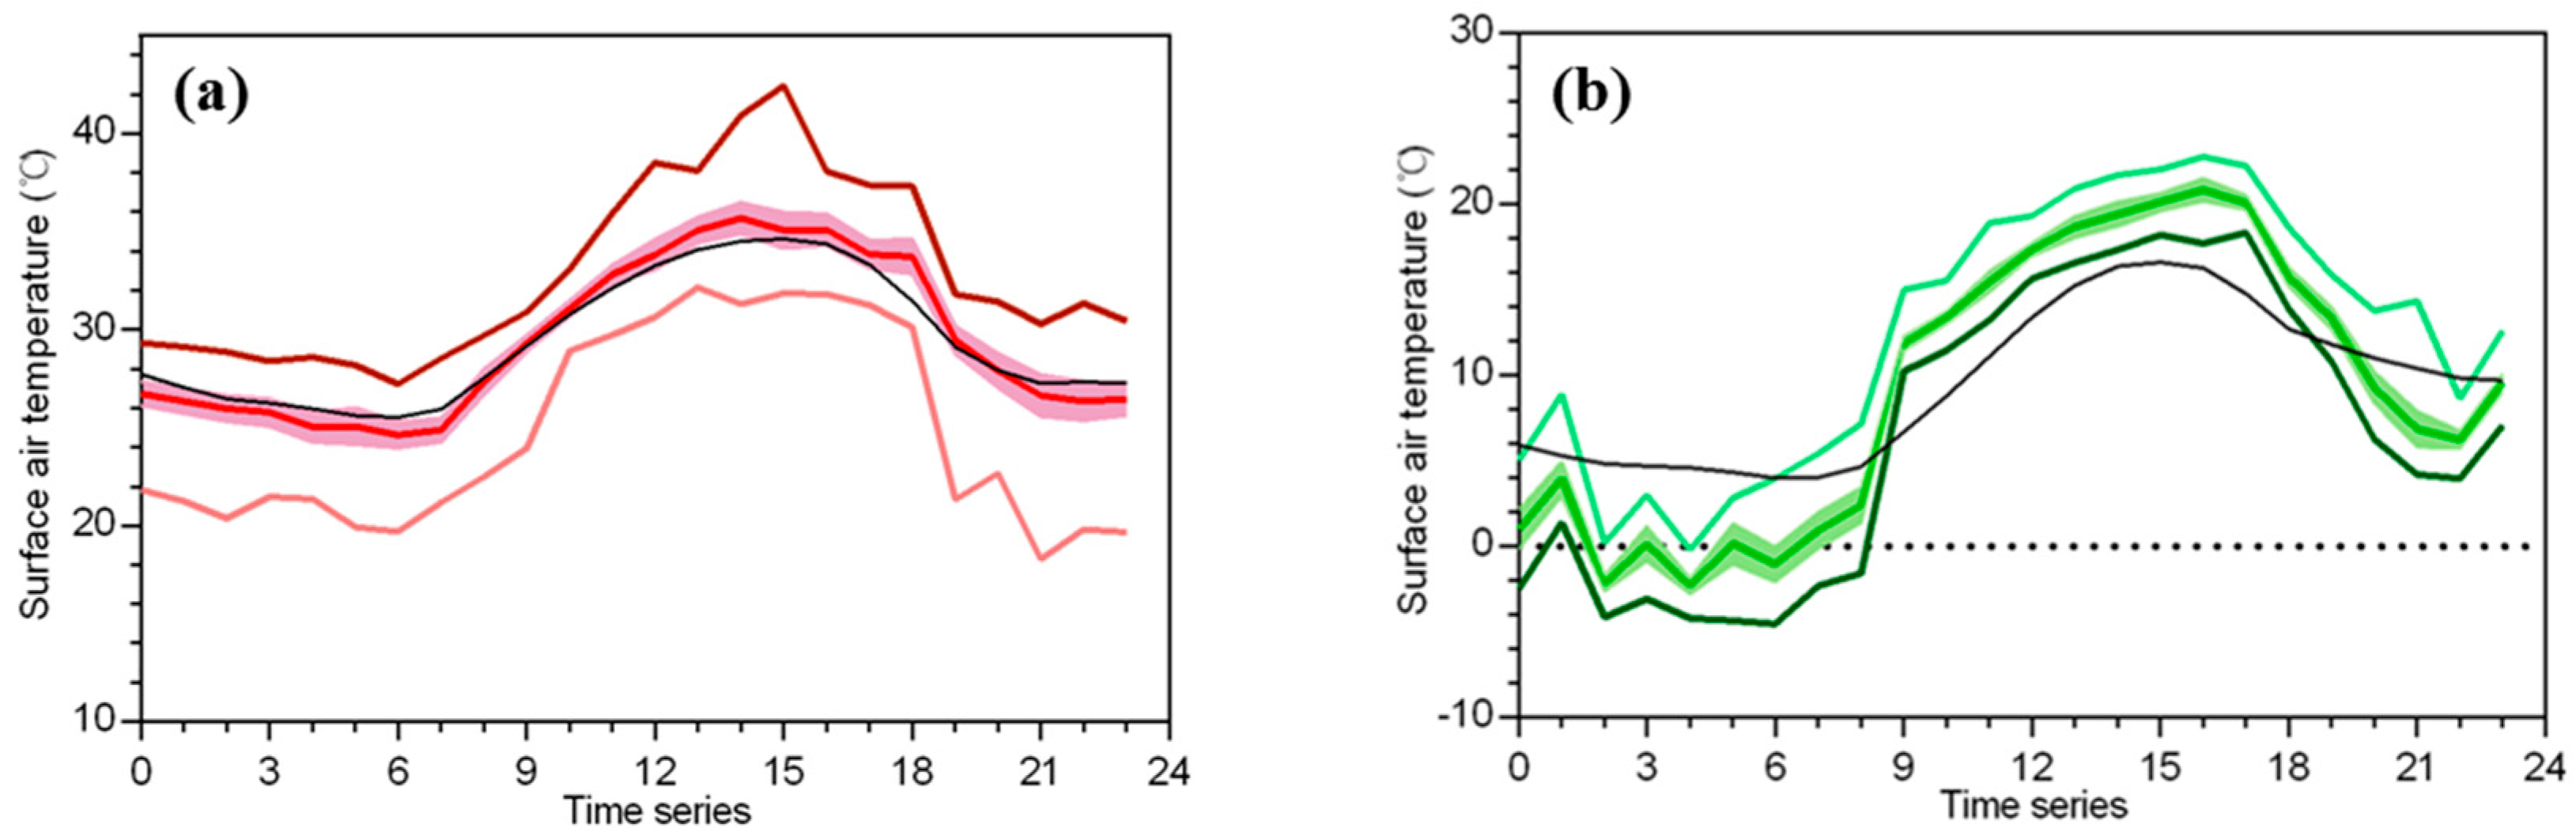
5.1. Comparison between SUHII and CLHII
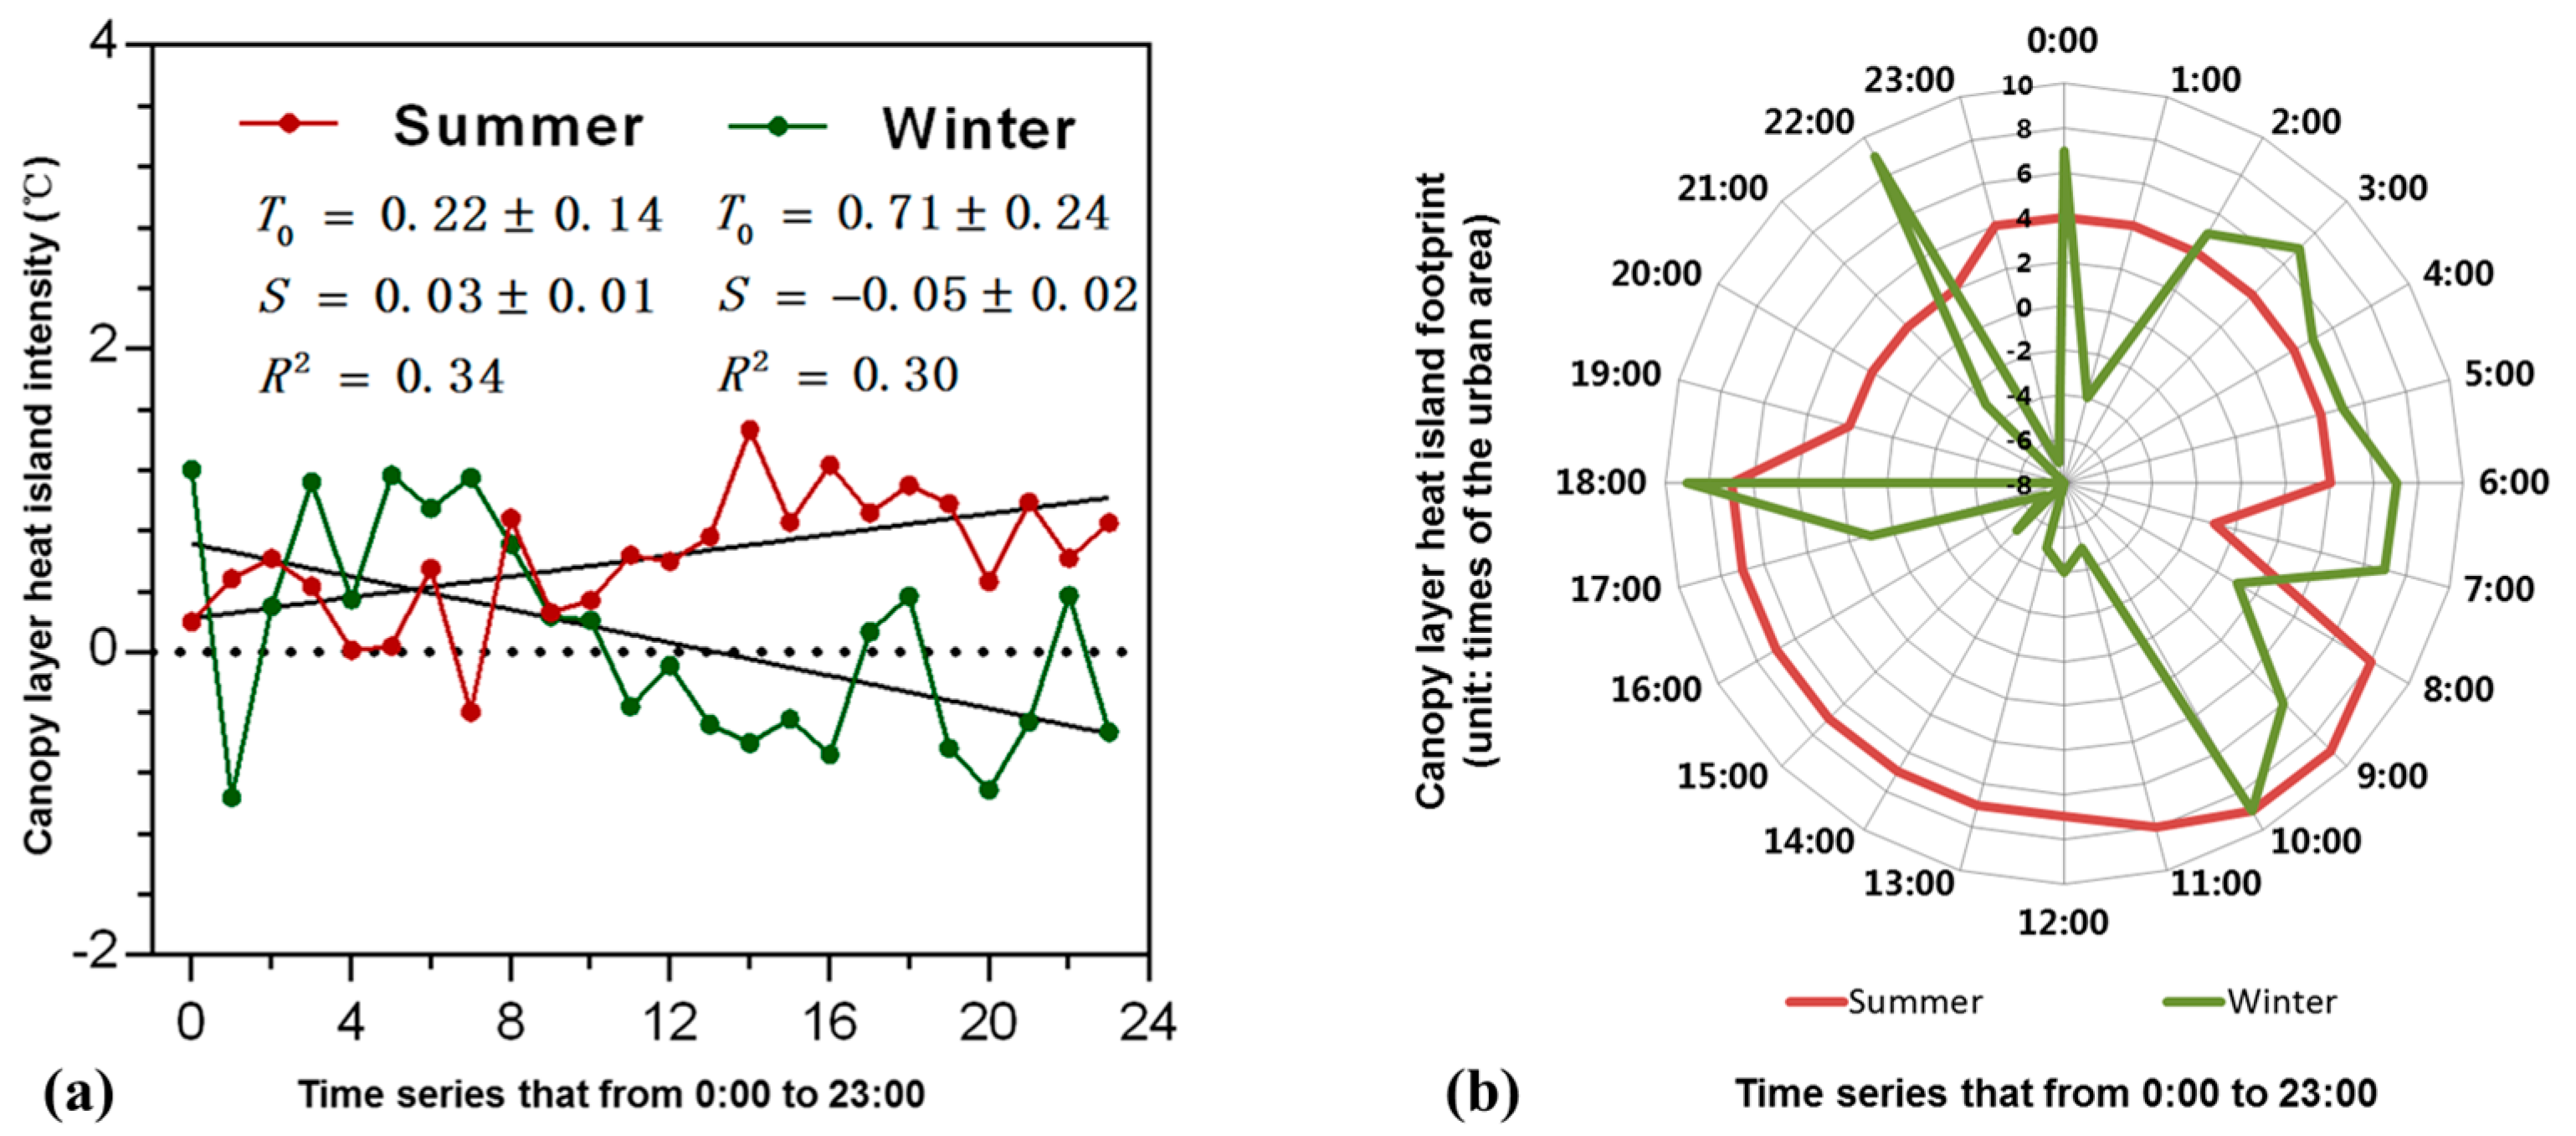
5.2. Spatiotemporal Trends of the CLHI
5.3. Single-Level Relationships Quantified with the OLS Model
5.4. Interacting Effects Quantified with the MLR Model
6. Conclusions
Acknowledgments
Author Contributions
Conflicts of Interest
Abbreviations
| UHI | Urban heat island |
| CLHI | Canopy layer heat island |
| CLHII | Canopy layer heat island intensity |
| SUHI | Surface urban heat island |
| SUHII | Surface urban heat island intensity |
| CLCI | Canopy layer cool island |
| SUCI | Surface urban cool island |
| SAT | Surface air temperature |
| LST | Land surface temperature |
| NDVI | Normalized difference vegetation index |
| NDBI | Normalized difference built-up index |
| NDWI | Normalized difference water index |
| DEM | Digital elevation model |
| DN | Digital number |
| MLR | Multiple linear regression |
| OLS | Ordinary least squares |
References
- Bai, X.; Shi, P.; Liu, Y. Realizing China’s urban dream. Nature 2014, 509, 158–160. [Google Scholar] [CrossRef] [PubMed]
- Angel, S.; Parent, J.; Civco, D.L.; Blei, A.; Potere, D. The dimensions of global urban expansion: Estimates and projections for all countries, 2000–2050. Prog. Plan. 2011, 75, 53–107. [Google Scholar] [CrossRef]
- Heilig, G.K. World Urbanization Prospects: The 2011 Revision; United Nations: New York, NY, USA, 2012. [Google Scholar]
- Elvidge, C.D.; Tuttle, B.T.; Sutton, P.S.; Baugh, K.E.; Howard, A.T.; Milesi, C. Global distribution and density of constructed impervious surfaces. Sensors 2017, 7, 1962–1979. [Google Scholar] [CrossRef]
- Valerio, Q.; Anna, B.; Francesco, C.; Diego, G.; Dalila, R.; Piermaria, C. Monitoring land take by point sampling: Pace and dynamics of urban expansion in the metropolitan city of Rome. Landsc. Urban Plan. 2015, 143, 126–133. [Google Scholar] [CrossRef]
- Grimm, N.B.; Faeth, S.H.; Golubiewski, N.E.; Redman, C.L.; Wu, J.; Bai, X. Global change and the ecology of cities. Science 2008, 319, 756–760. [Google Scholar] [CrossRef] [PubMed]
- Platt, R.H.; Rowntree, R.A.; Muick, P.C. The Ecological City: Preserving and Restoring Urban Biodiversity; University of Massachusetts Press: Amherst, MA, USA, 1994. [Google Scholar]
- Gober, P.; Wentz, E.A.; Lant, T.; Tschudi, M.K.; Kirkwood, C.W. Watersim: A simulation model for urban water planning in phoenix, Arizona, USA. Environ. Plan. B Plan. Des. 2011, 38, 197–215. [Google Scholar] [CrossRef]
- Zhang, X.; Friedl, M.A.; Schaaf, C.B.; Strahler, A.H.; Schneider, A. The footprint of urban climates on vegetation phenology. Geophys. Res. Lett. 2004, 31, 179–206. [Google Scholar] [CrossRef]
- Harvell, C.D.; Mitchell, C.E.; Ward, J.R.; Altizer, S.; Dobson, A.P.; Ostfeld, R.S. Climate warming and disease risks for terrestrial and marine biota. Science 2002, 296, 2158–2162. [Google Scholar] [CrossRef] [PubMed]
- Schwarz, N.; Lautenbach, S.; Seppelt, R. Exploring indicators for quantifying surface urban heat islands of European cities with MODIS land surface temperatures. Remote Sens. Environ. 2011, 115, 3175–3186. [Google Scholar] [CrossRef]
- Weng, Q.; Lu, D.; Schubring, J. Estimation of land surface temperature—Vegetation abundance relationship for urban heat island studies. Remote Sens. Environ. 2004, 89, 467–483. [Google Scholar] [CrossRef]
- Xiong, Y.; Huang, S.; Chen, F.; Ye, H.; Wang, C.; Zhu, C. The impacts of rapid urbanization on the thermal environment: A remote sensing study of Guangzhou, South China. Remote Sens. 2012, 4, 2033–2056. [Google Scholar] [CrossRef]
- Guo, G.; Wu, Z.; Xiao, R.; Chen, Y.; Liu, X.; Zhang, X. Impacts of urban biophysical composition on land surface temperature in urban heat island clusters. Landsc. Urban Plan. 2015, 135, 1–10. [Google Scholar] [CrossRef]
- Zheng, B.; Myint, S.W.; Fan, C. Spatial configuration of anthropogenic land cover impacts on urban warming. Landsc. Urban Plan. 2014, 130, 104–111. [Google Scholar] [CrossRef]
- Connors, J.P.; Galletti, C.S.; Chow, W.T.L. Landscape configuration and urban heat island effects: Assessing the relationship between landscape characteristics and land surface temperature in phoenix, Arizona. Landsc. Ecol. 2013, 28, 271–283. [Google Scholar] [CrossRef]
- Du, S.; Xiong, Z.; Wang, Y.C.; Guo, L. Quantifying the multilevel effects of landscape composition and configuration on land surface temperature. Remote Sens. Environ. 2016, 178, 84–92. [Google Scholar] [CrossRef]
- Chun, B.; Guldmann, J.M. Spatial statistical analysis and simulation of the urban heat island in high-density central cities. Landsc. Urban Plan. 2014, 125, 76–88. [Google Scholar] [CrossRef]
- Yuan, F.; Bauer, M.E. Comparison of impervious surface area and normalized difference vegetation index as indicators of surface urban heat island effects in Landsat imagery. Remote Sens. Environ. 2007, 106, 375–386. [Google Scholar] [CrossRef]
- Sobrino, J.A.; Oltra-Carrió, R.; Sòria, G.; Bianchi, R.; Paganini, M. Impact of spatial resolution and satellite overpass time on evaluation of the surface urban heat island effects. Remote Sens. Environ. 2012, 117, 50–56. [Google Scholar] [CrossRef]
- Fabrizi, R.; Santis, A.D.; Gomez, A. Satellite and ground-based sensors for the urban heat island analysis in the city of Madrid. Remote Sens. 2011, 2, 349–352. [Google Scholar]
- Pichierri, M.; Bonafoni, S.; Biondi, R. Satellite air temperature estimation for monitoring the canopy layer heat island of Milan. Remote Sens. Environ. 2012, 127, 130–138. [Google Scholar] [CrossRef]
- Anniballe, R.; Bonafoni, S.; Pichierri, M. Spatial and temporal trends of the surface and air heat island over Milan using MODIS data. Remote Sens. Environ. 2014, 150, 163–171. [Google Scholar] [CrossRef]
- Koken, P.J.; Piver, W.T.; Ye, F.; Elixhauser, A.; Olsen, L.M.; Portier, C.J. Temperature, air pollution, and hospitalization for cardiovascular diseases among elderly people in Denver. Environ. Health Perspect. 2003, 111, 1312–1317. [Google Scholar] [CrossRef] [PubMed]
- Chen, K.; Huang, L.; Zhou, L.; Ma, Z.; Bi, J.; Li, T. Spatial analysis of the effect of the 2010 heat wave on stroke mortality in Nanjing, China. Sci. Rep. 2015, 5, 10816. [Google Scholar] [CrossRef]
- Xu, Z.; Liu, Y.; Ma, Z.; Sam, T.G.; Hu, W.; Tong, S. Assessment of the temperature effect on childhood diarrhea using satellite imagery. Sci. Rep. 2014, 4, 5389. [Google Scholar] [CrossRef]
- Ren, G.Y.; Chu, Z.Y.; Chen, Z.H.; Ren, Y.Y. Implications of temporal change in urban heat island intensity observed at Beijing and Wuhan stations. Geophys. Res. Lett. 2007, 34, 89–103. [Google Scholar] [CrossRef]
- Sun, Y.; Zhang, X.; Ren, G.; Zwiers, F.W.; Hu, T. Contribution of urbanization to warming in China. Nat. Clim. Chang. 2016, 6, 706–709. [Google Scholar] [CrossRef]
- Campra, P.; Millstein, D. Mesoscale climatic simulation of surface air temperature cooling by highly reflective greenhouses in se Spain. Environ. Sci. Technol. 2013, 47, 12284–12290. [Google Scholar] [CrossRef] [PubMed]
- Parker, D.E. Urban heat island effects on estimates of observed climate change. Wiley Interdiscip. Rev. Clim. Chang. 2010, 1, 123–133. [Google Scholar] [CrossRef]
- Zhao, L.; Lee, X.; Smith, R.B.; Oleson, K. Strong contributions of local background climate to urban heat islands. Nature 2014, 511, 216–219. [Google Scholar] [CrossRef] [PubMed]
- Li, Q.; Zhang, H.; Liu, X.; Huang, J. Urban heat island effect on annual mean temperature during the last 50 years in China. Theor. Appl. Clim. 2004, 79, 165–174. [Google Scholar] [CrossRef]
- Ren, G.; Zhou, Y.; Chu, Z.; Zhou, J.; Zhang, A.; Guo, J. Urbanization effects on observed surface air temperature trends in north China. J. Clim. 2008, 21, 1333–1348. [Google Scholar] [CrossRef]
- Yang, X.; Hou, Y.; Chen, B. Observed surface warming induced by urbanization in east China. J. Geophys. Res. Atmos. 2011, 116, 263–294. [Google Scholar] [CrossRef]
- Sobrino, J.A.; Jiménez-Muñoz, J.C.; Paolini, L. Land surface temperature retrieval from Landsat TM 5. Remote Sens. Environ. 2004, 90, 434–440. [Google Scholar] [CrossRef]
- Wan, Z.; Dozier, J. A generalized split-window algorithm for retrieving land-surface temperature from space. IEEE Trans. Geosci. Remote Sens. 1996, 34, 892–905. [Google Scholar]
- Wan, Z. New refinements and validation of the MODIS land-surface temperature/emissivity products. Remote Sens. Environ. 2008, 140, 59–74. [Google Scholar] [CrossRef]
- Wang, A.S.; He, L. Practical split-window algorithm for retrieving land surface temperature over agricultural areas from aster data. J. Appl. Remote Sens. 2014, 8, 5230–5237. [Google Scholar] [CrossRef]
- Li, Z.L.; Tang, B.H.; Wu, H.; Ren, H.; Yan, G.; Wan, Z.; Trigo, I.F.; Sobrino, J.A. Satellite-derived land surface temperature: Current status and perspectives. Remote Sens. Environ. 2013, 131, 14–37. [Google Scholar] [CrossRef]
- Cai, G.; Xue, M.D.Y. Monitoring of urban heat island effect in Beijing combining aster and tm data. Int. J. Remote Sens. 2011, 32, 1213–1232. [Google Scholar] [CrossRef]
- Shen, H.; Huang, L.; Zhang, L.; Wu, P.; Zeng, C. Long-term and fine-scale satellite monitoring of the urban heat island effect by the fusion of multi-temporal and multi-sensor remote sensed data: A 26-year case study of the city of Wuhan in China. Remote Sens. Environ. 2016, 172, 109–125. [Google Scholar] [CrossRef]
- Peng, S.; Piao, S.; Ciais, P.; Friedlingstein, P.; Ottle, C.; Bréon, F.M.; Nan, H.; Zhou, L.; Myneni, R.B. Surface urban heat island across 419 global big cities. Environ. Sci. Technol. 2012, 46, 696–703. [Google Scholar] [CrossRef] [PubMed]
- Ho, H.C.; Knudby, A.; Sirovyak, P.; Xu, Y.; Hodul, M.; Henderson, S.B. Mapping maximum urban air temperature on hot summer days. Remote Sens. Environ. 2014, 154, 38–45. [Google Scholar] [CrossRef]
- Han, Y.H.; Li, S.J.; Zheng, Y.L. Predictors of nutritional status among community-dwelling older adults in Wuhan, China. Public Health Nutr. 2009, 12, 1189–1196. [Google Scholar] [CrossRef] [PubMed]
- Qian, Z.; He, Q.; Lin, H.M.; Kong, L.; Liao, D.; Dan, J. Association of daily cause-specific mortality with ambient particle air pollution in Wuhan, China. Environ. Res. 2007, 105, 380–389. [Google Scholar] [CrossRef] [PubMed]
- Wu, H.; Ye, L.P.; Shi, W.Z.; Clarke, K.C. Assessing the effects of land use spatial structure on urban heat islands using HJ-1b remote sensing imagery in Wuhan, China. Int. J. Appl. Earth Obs. Geoinf. 2014, 32, 67–78. [Google Scholar] [CrossRef]
- Meteorological Bureau of Hubei Province. Available online: http://www.hbqx.gov.cn/index.action (accessed on 26 May 2017).
- USGS (United States Geological Survey). Available online: http://glovis.usgs.gov/ (accessed on 26 May 2017).
- The CGIAR Consortium for Spatial Information (CGIAR-CSI) SRTM 90m DEM Digital Elevation Database. Available online: http://srtm.csi.cgiar.org/SELECTION/inputCoord.asp (accessed on 26 May 2017).
- NOAA (National Oceanic and Atmospheric Administration). Version 4 DMSP-OLS Nighttime Lights Time Series. Available online: http://ngdc.noaa.gov/eog/dmsp/downloadV4composites.html (accessed on 26 May 2017).
- LAADS DAAC. Available online: https://ladsweb.nascom.nasa.gov/ (accessed on 26 May 2017).
- Tomasi, C.; Petkov, B.H.; Benedetti, E. Annual cycles of pressure, temperature, absolute humidity and precipitable water from the radiosoundings performed at dome c, antarctica, over the 2005–2009 period. Antarct. Sci. 2012, 24, 637–658. [Google Scholar] [CrossRef]
- Zha, Y.; Gao, J.; Ni, S. Use of normalized difference built-up index in automatically mapping urban areas from tm imagery. Int. J. Remote Sens. 2003, 24, 583–594. [Google Scholar] [CrossRef]
- Maki, M.; Ishiahra, M.; Tamura, M. Estimation of leaf water status to monitor the risk of forest fires by using remotely sensed data. Remote Sens. Environ. 2004, 90, 441–450. [Google Scholar] [CrossRef]
- Barsi, J.A.; Schott, J.R.; Palluconi, F.D.; Hook, S.J. Validation of a web-based atmospheric correction tool for single thermal band instruments. Proc. SPIE 2005. [Google Scholar] [CrossRef]
- Zhou, D.; Zhao, S.; Liu, S.; Zhang, L.; Chao, Z. Surface urban heat island in China’s 32 major cities: Spatial patterns and drivers. Remote Sens. Environ. 2014, 152, 51–61. [Google Scholar] [CrossRef]
- Zhou, D.; Zhao, S.; Liu, S.; Zhang, L. Spatiotemporal trends of terrestrial vegetation activity along the urban development intensity gradient in China’s 32 major cities. Sci. Total Environ. 2014, 488–489, 136–145. [Google Scholar] [CrossRef] [PubMed]
- Zhou, D.; Zhao, S.; Zhang, L.; Sun, G.; Liu, Y. The footprint of urban heat island effect in China. Sci. Rep. 2015, 5, 11160. [Google Scholar] [CrossRef] [PubMed]
- Ren, G.; Zhou, Y. Urbanization effect on trends of extreme temperature indices of national stations over mainland China, 1961–2008. J. Clim. 2014, 27, 2340–2360. [Google Scholar] [CrossRef]
- Batty, M. Rank clocks. Nature 2006, 444, 592–596. [Google Scholar] [CrossRef] [PubMed]
- Zhou, W.; Qian, Y.; Li, X.; Li, W.; Han, L. Relationships between land cover and the surface urban heat island: Seasonal variability and effects of spatial and thematic resolution of land cover data on predicting land surface temperatures. Landsc. Ecol. 2014, 29, 153–167. [Google Scholar] [CrossRef]
- Zhou, W.; Huang, G.; Cadenasso, M.L. Does spatial configuration matter? Understanding the effects of land cover pattern on land surface temperature in urban landscapes. Landsc. Urban Plan. 2011, 102, 54–63. [Google Scholar] [CrossRef]
- Sailor, D.J. A review of methods for estimating anthropogenic heat and moisture emissions in the urban environment. Int. J. Clim. 2011, 31, 189–199. [Google Scholar] [CrossRef]
- Huang, X.; Lu, Q.; Zhang, L. A multi-index learning approach for classification of high-resolution remotely sensed images over urban areas. ISPRS J. Photogramm. Remote Sens. 2014, 90, 36–48. [Google Scholar] [CrossRef]
- Huang, X.; Lu, Q.; Zhang, L.; Plaza, A. New postprocessing methods for remote sensing image classification: A systematic study. IEEE Trans. Geosci. Remote Sens. 2014, 52, 7140–7159. [Google Scholar] [CrossRef]


| Metric | NDBI | NDVI | Absolute Humidity (g/m3) | |||
|---|---|---|---|---|---|---|
| Summer | Winter | Summer | Winter | Summer | Winter | |
| Building | −0.04 | −0.02 | 0.13 | 0.03 | 17.25 | 3.75 |
| Road | −0.05 | −0.01 | 0.13 | 0.03 | 17.25 | 3.75 |
| Woodland | −0.14 | −0.05 | 0.26 | 0.08 | 21.34 | 4.09 |
| Herbage | −0.16 | −0.02 | 0.31 | 0.07 | 20.84 | 3.79 |
| Metric | Constant | Absolute Humidity | |||
| Summer | Winter | Summer | Winter | ||
| Coefficients | 6.19 | −3.21 | −0.26 | 0.90 | |
| Confidence Interval (90%) | [−2.75, 15.13] | [−5.55, −0.87] | [−0.71, 0.19] | [0.23, 1.57] | |
| NDBI | NDVI | DN of Nighttime Lights | |||
| Summer | Winter | Summer | Winter | Summer | Winter |
| −10.83 | 3.04 | −8.13 | −4.56 | 0.003 | 0.001 |
| [−22.98, 1.32] | [−10.06, 3.98] | [−13.26, −3.00] | [−9.67, 0.55] | [−0.001, 0.007] | [−0.001, 0.003] |
| Summer (17 September 2013) | Winter (23 January 2014) | ||||
|---|---|---|---|---|---|
| Event | Time | Magnitude | Event | Time | Magnitude |
| Maximum CLCI effect | 7:00 | −0.39 °C | Maximum CLCI effect | 1:00 | −0.95 °C |
| Lowest SAT | 7:00 | 24.88 °C | Maximum CLHI effect | 5:00 | 1.15 °C |
| Maximum CLHI effect | 14:00 | 1.42 °C | Lowest SAT | 6:00 | −4.52 °C |
| Mean SAT | 14:00 | 35.69 °C | Highest mean SAT | 16:00 | 20.84 °C |
| Highest SAT | 15:00 | 42.27 °C | Highest SAT | 16:00 | 22.77 °C |
| MODIS-SUHI | 10:30 | 3.3 °C | ~ | ~ | ~ |
| Landsat 8-SUHI | 10:58 | 4.3 °C | Landsat 8-SUHI | 10:58 | −0.19 °C |
| MODIS-SUHI | 22:30 | 2.2 °C | ~ | ~ | ~ |
© 2017 by the authors. Licensee MDPI, Basel, Switzerland. This article is an open access article distributed under the terms and conditions of the Creative Commons Attribution (CC BY) license (http://creativecommons.org/licenses/by/4.0/).
Share and Cite
Li, L.; Huang, X.; Li, J.; Wen, D. Quantifying the Spatiotemporal Trends of Canopy Layer Heat Island (CLHI) and Its Driving Factors over Wuhan, China with Satellite Remote Sensing. Remote Sens. 2017, 9, 536. https://doi.org/10.3390/rs9060536
Li L, Huang X, Li J, Wen D. Quantifying the Spatiotemporal Trends of Canopy Layer Heat Island (CLHI) and Its Driving Factors over Wuhan, China with Satellite Remote Sensing. Remote Sensing. 2017; 9(6):536. https://doi.org/10.3390/rs9060536
Chicago/Turabian StyleLi, Long, Xin Huang, Jiayi Li, and Dawei Wen. 2017. "Quantifying the Spatiotemporal Trends of Canopy Layer Heat Island (CLHI) and Its Driving Factors over Wuhan, China with Satellite Remote Sensing" Remote Sensing 9, no. 6: 536. https://doi.org/10.3390/rs9060536
APA StyleLi, L., Huang, X., Li, J., & Wen, D. (2017). Quantifying the Spatiotemporal Trends of Canopy Layer Heat Island (CLHI) and Its Driving Factors over Wuhan, China with Satellite Remote Sensing. Remote Sensing, 9(6), 536. https://doi.org/10.3390/rs9060536