
Assessing Uncertainty in LULC Classification Accuracy by Using Bootstrap Resampling

Abstract
:
1. Introduction
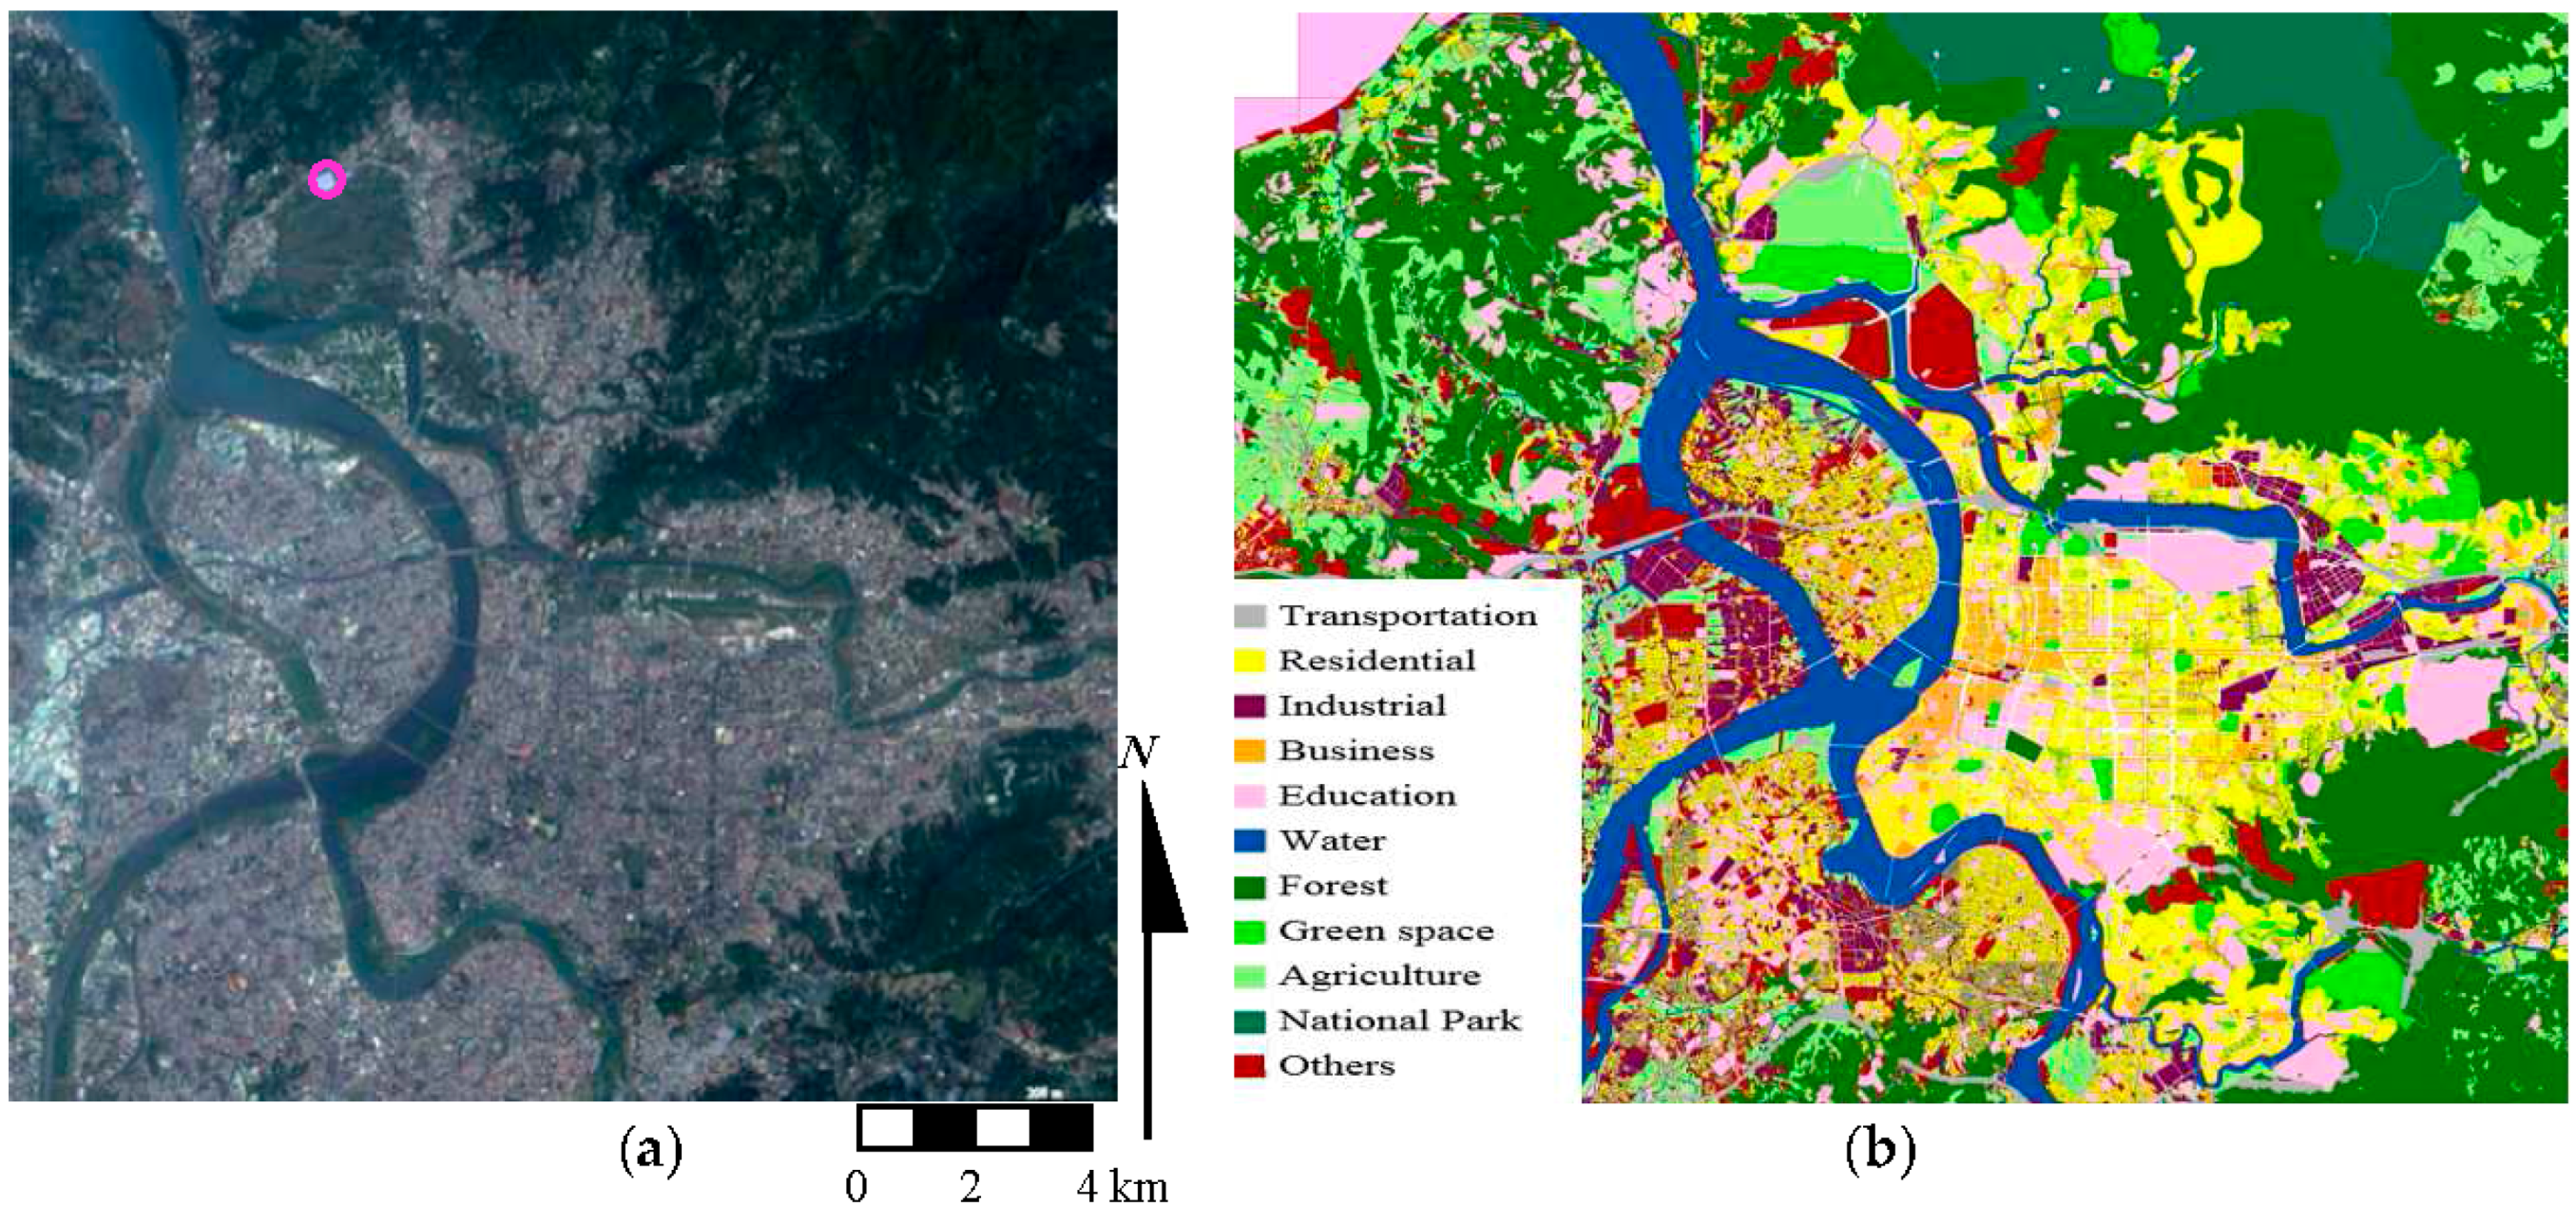
2. Study Area and Data
3. Methods
3.1. Bayes Classification
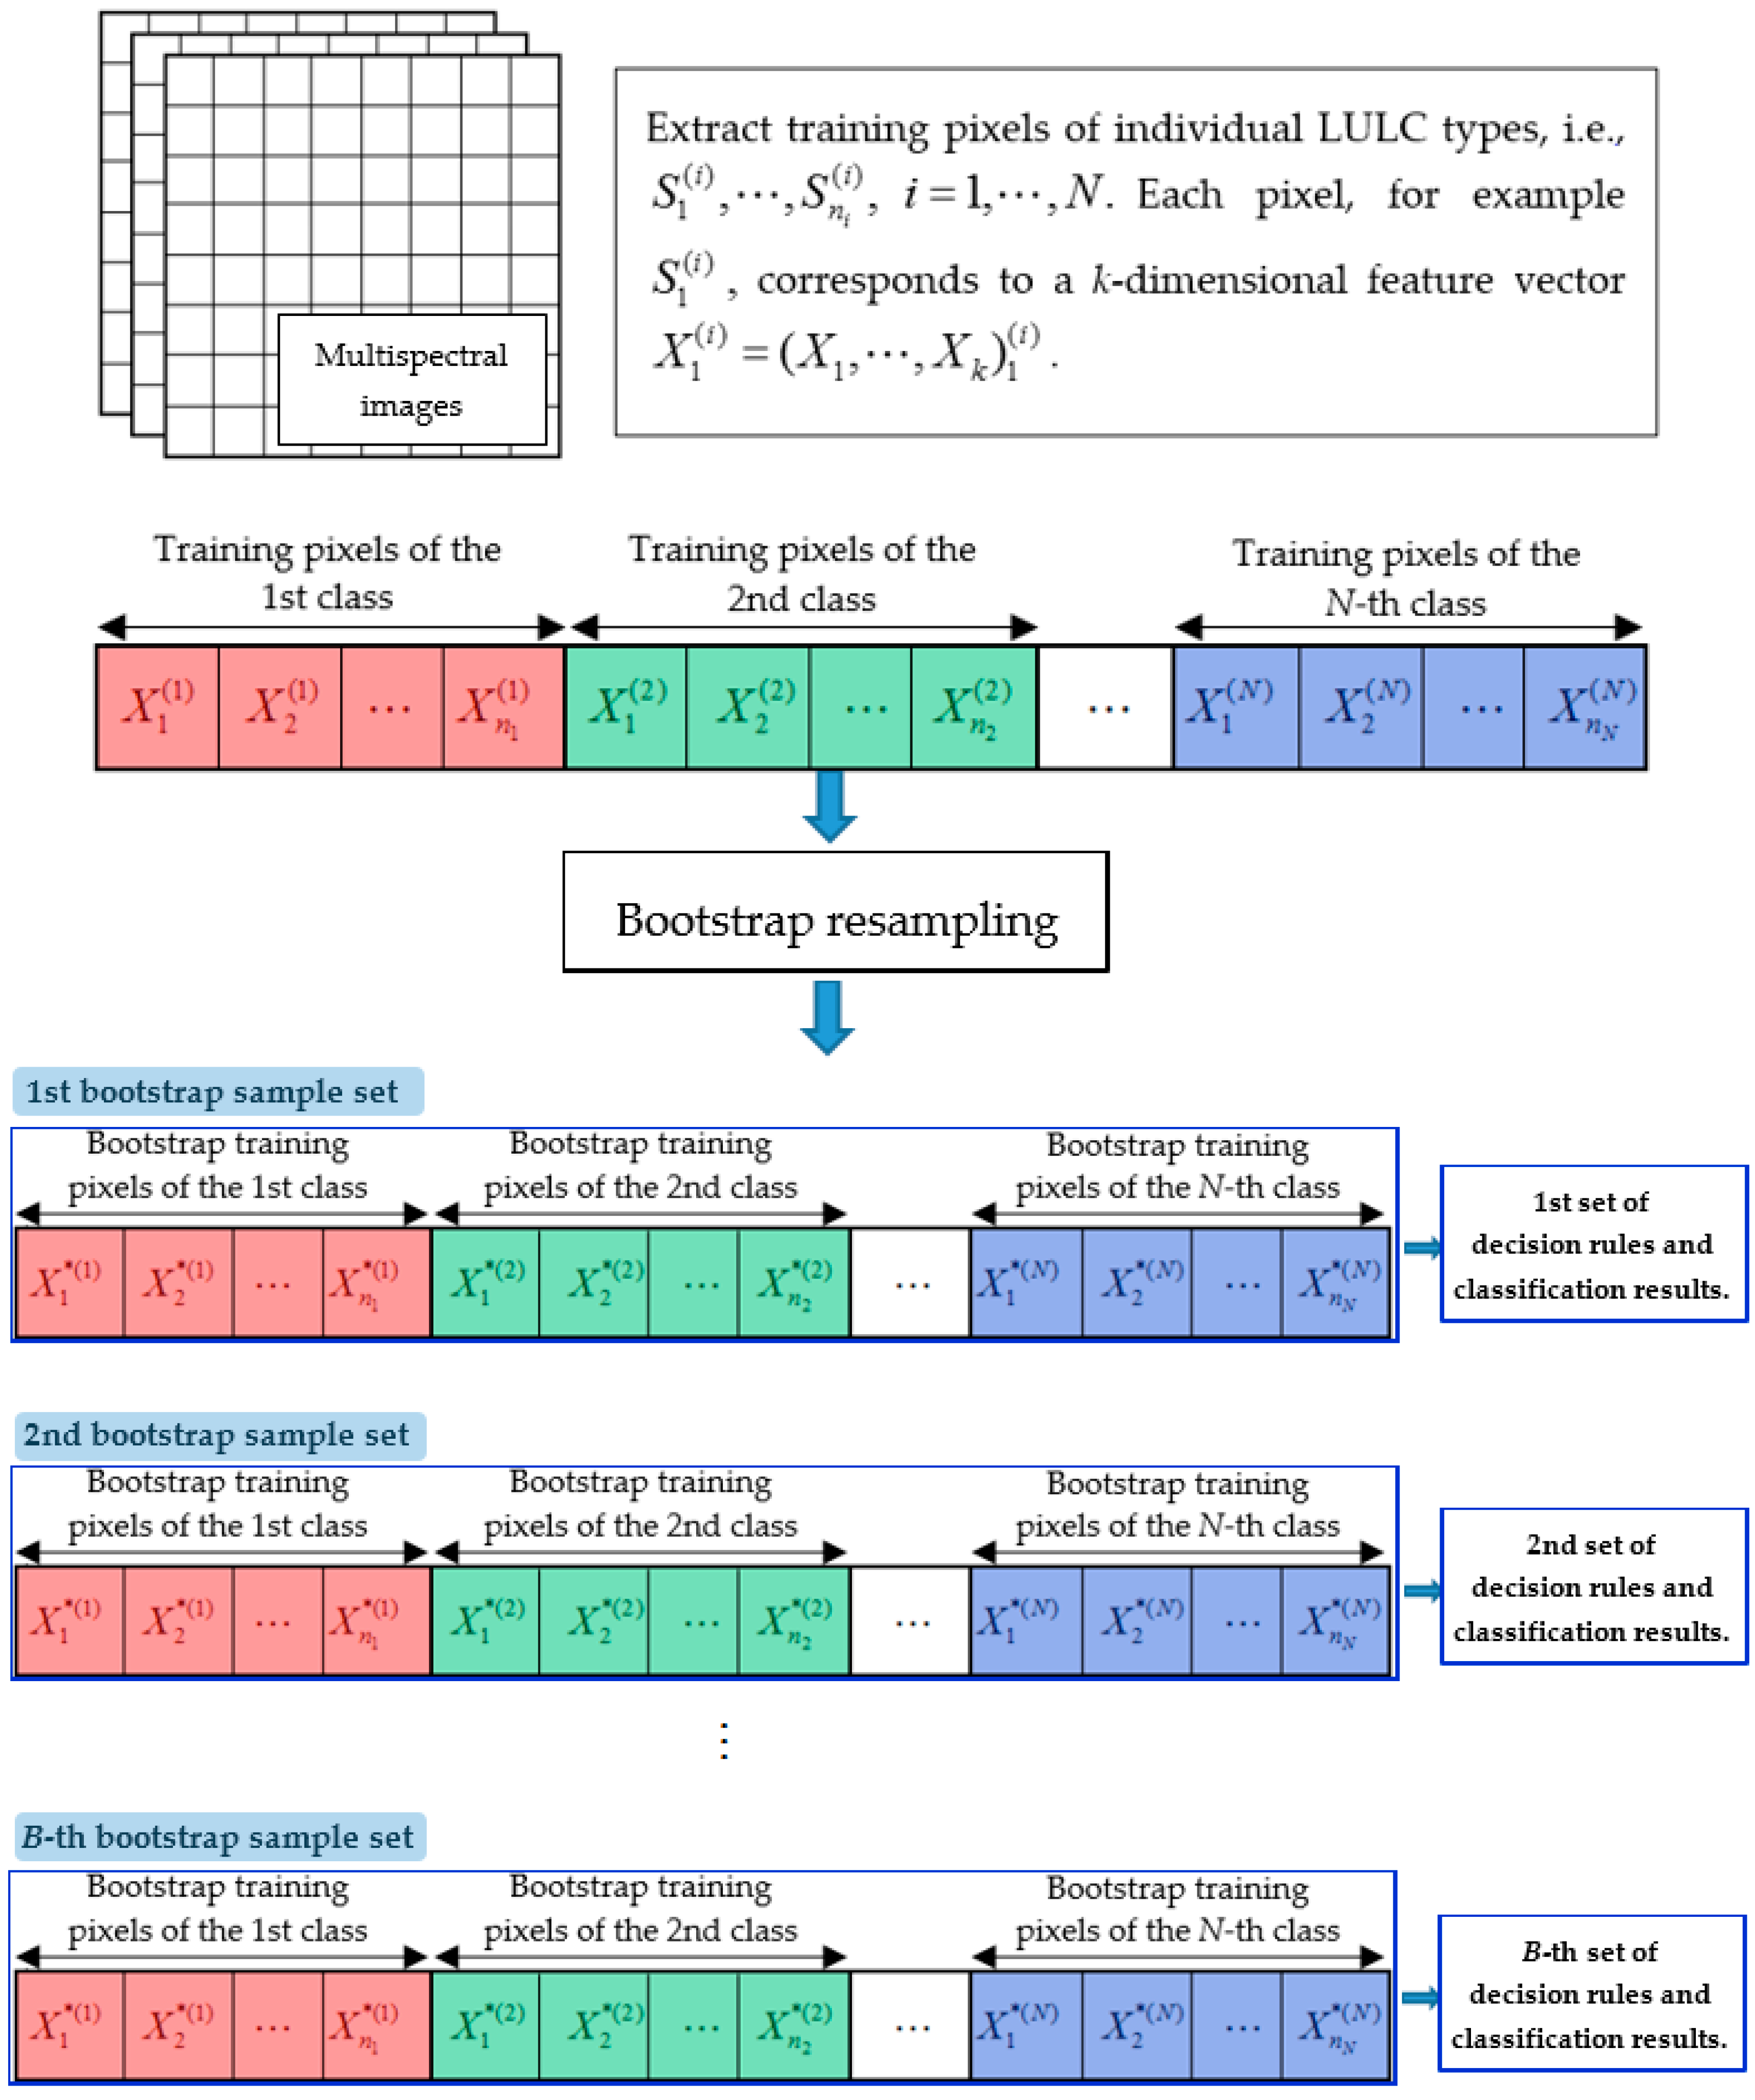
3.2. Bootstrap Resampling and Its Application to Multispectral Remote Sensing Images
- Generate a bootstrap sample of size n, by sampling with replacement from the random sample . Note that using an asterisk to indicate bootstrap samples is customary.
- Calculate .
- Repeat Steps 1 and 2 many times and use the resultant to derive the empirical CDF of ; that is,
- Obtain the bootstrap training samples by sampling with replacement from the original training samples of the individual land-cover classes (i.e., ).
- Collect the corresponding multispectral feature vectors with . Note that represents feature vectors of one set of multispectral and multiclass bootstrap training samples.
- Repeat Steps 1 and 2 to obtain B sets of multispectral and multiclass feature vectors of bootstrap training samples; that is, .
- Estimate the parameters of the multivariate Gaussian distribution for every set of multispectral and multiclass feature vectors of the bootstrap training samples. Let estimates of the mean vector and covariance matrix of the multispectral and multiclass feature vectors be represented by and , respectively.
- For every set of multispectral and multiclass bootstrap training samples, calculate the class-dependent discriminant functions (Equation (2)) of the individual land-cover classes by using the parameters estimates from Step 4 and perform LULC classification for all pixels in the study area. Note that all bootstrap training samples are associated with known LULC classes and are treated as training data in the bootstrap-sample-based LULC classification. However, in contrast to the original training samples, these bootstrap samples are not associated with specific geographic locations in the study area.
3.3. Assessing Classification Uncertainty by using Bootstrap Samples
- What is the probability that a pixel that is randomly and equally likely to be selected from the set of all pixels in the study area is correctly classified? This probability is referred to as the global OA (as opposed to the OA of the training data set).
- Let the set of all pixels that are assigned to the i-th class be denoted as . What is the probability that a pixel that is randomly and equally likely to be selected from is correctly classified? This probability is referred to as the class-specific global UA.
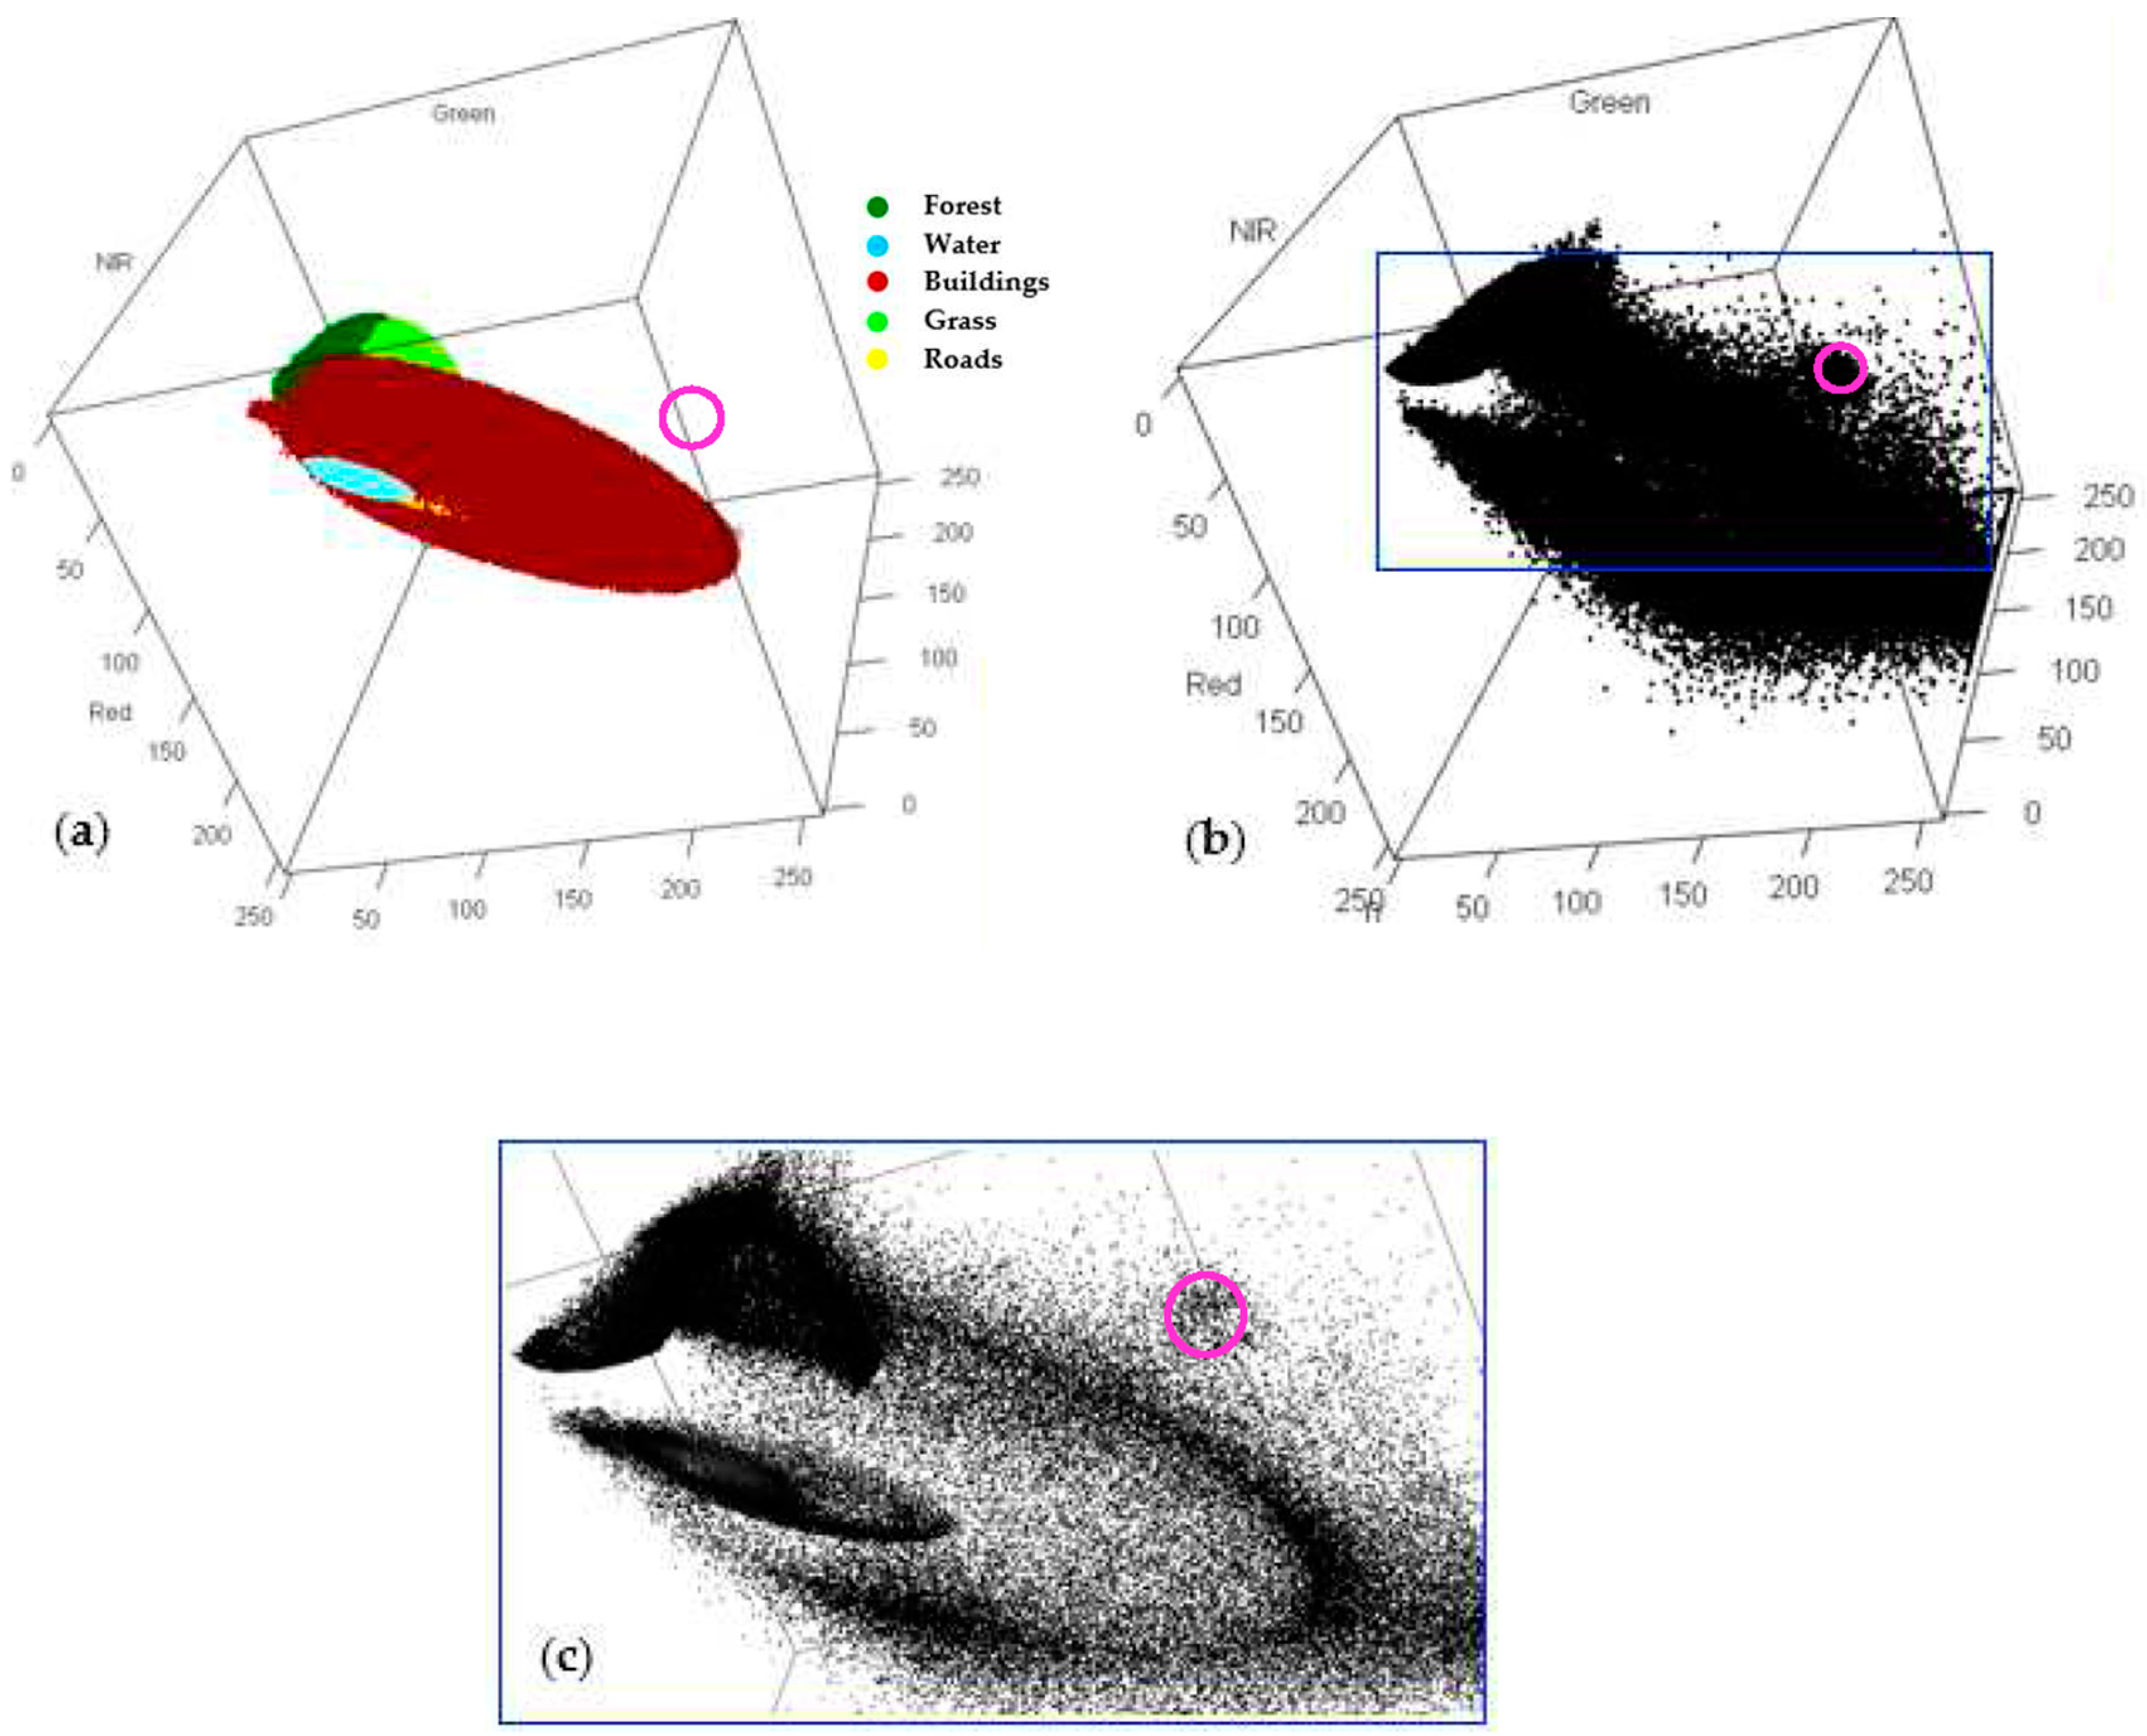
- For any specific pixel in the study area, what are the probabilities of that pixel being classified into individual LULC classes when various sources of uncertainty are considered? These probabilities are referred to as the pixel-specific (or location-specific) class probabilities.
- Determine the a priori probabilities of individual LULC classes; that is, . These probabilities are estimated on the basis of ancillary data or the investigator’s knowledge of the study area.
- Collect training data of individual LULC classes. The proportions of training pixels of the individual LULC classes in the training data set should be consistent with the a priori probabilities of the individual LULC classes for the training-data-based classification accuracy and uncertainty to be representative of the entire study area or be considered estimates of the classification accuracy and uncertainty for the entire study area.
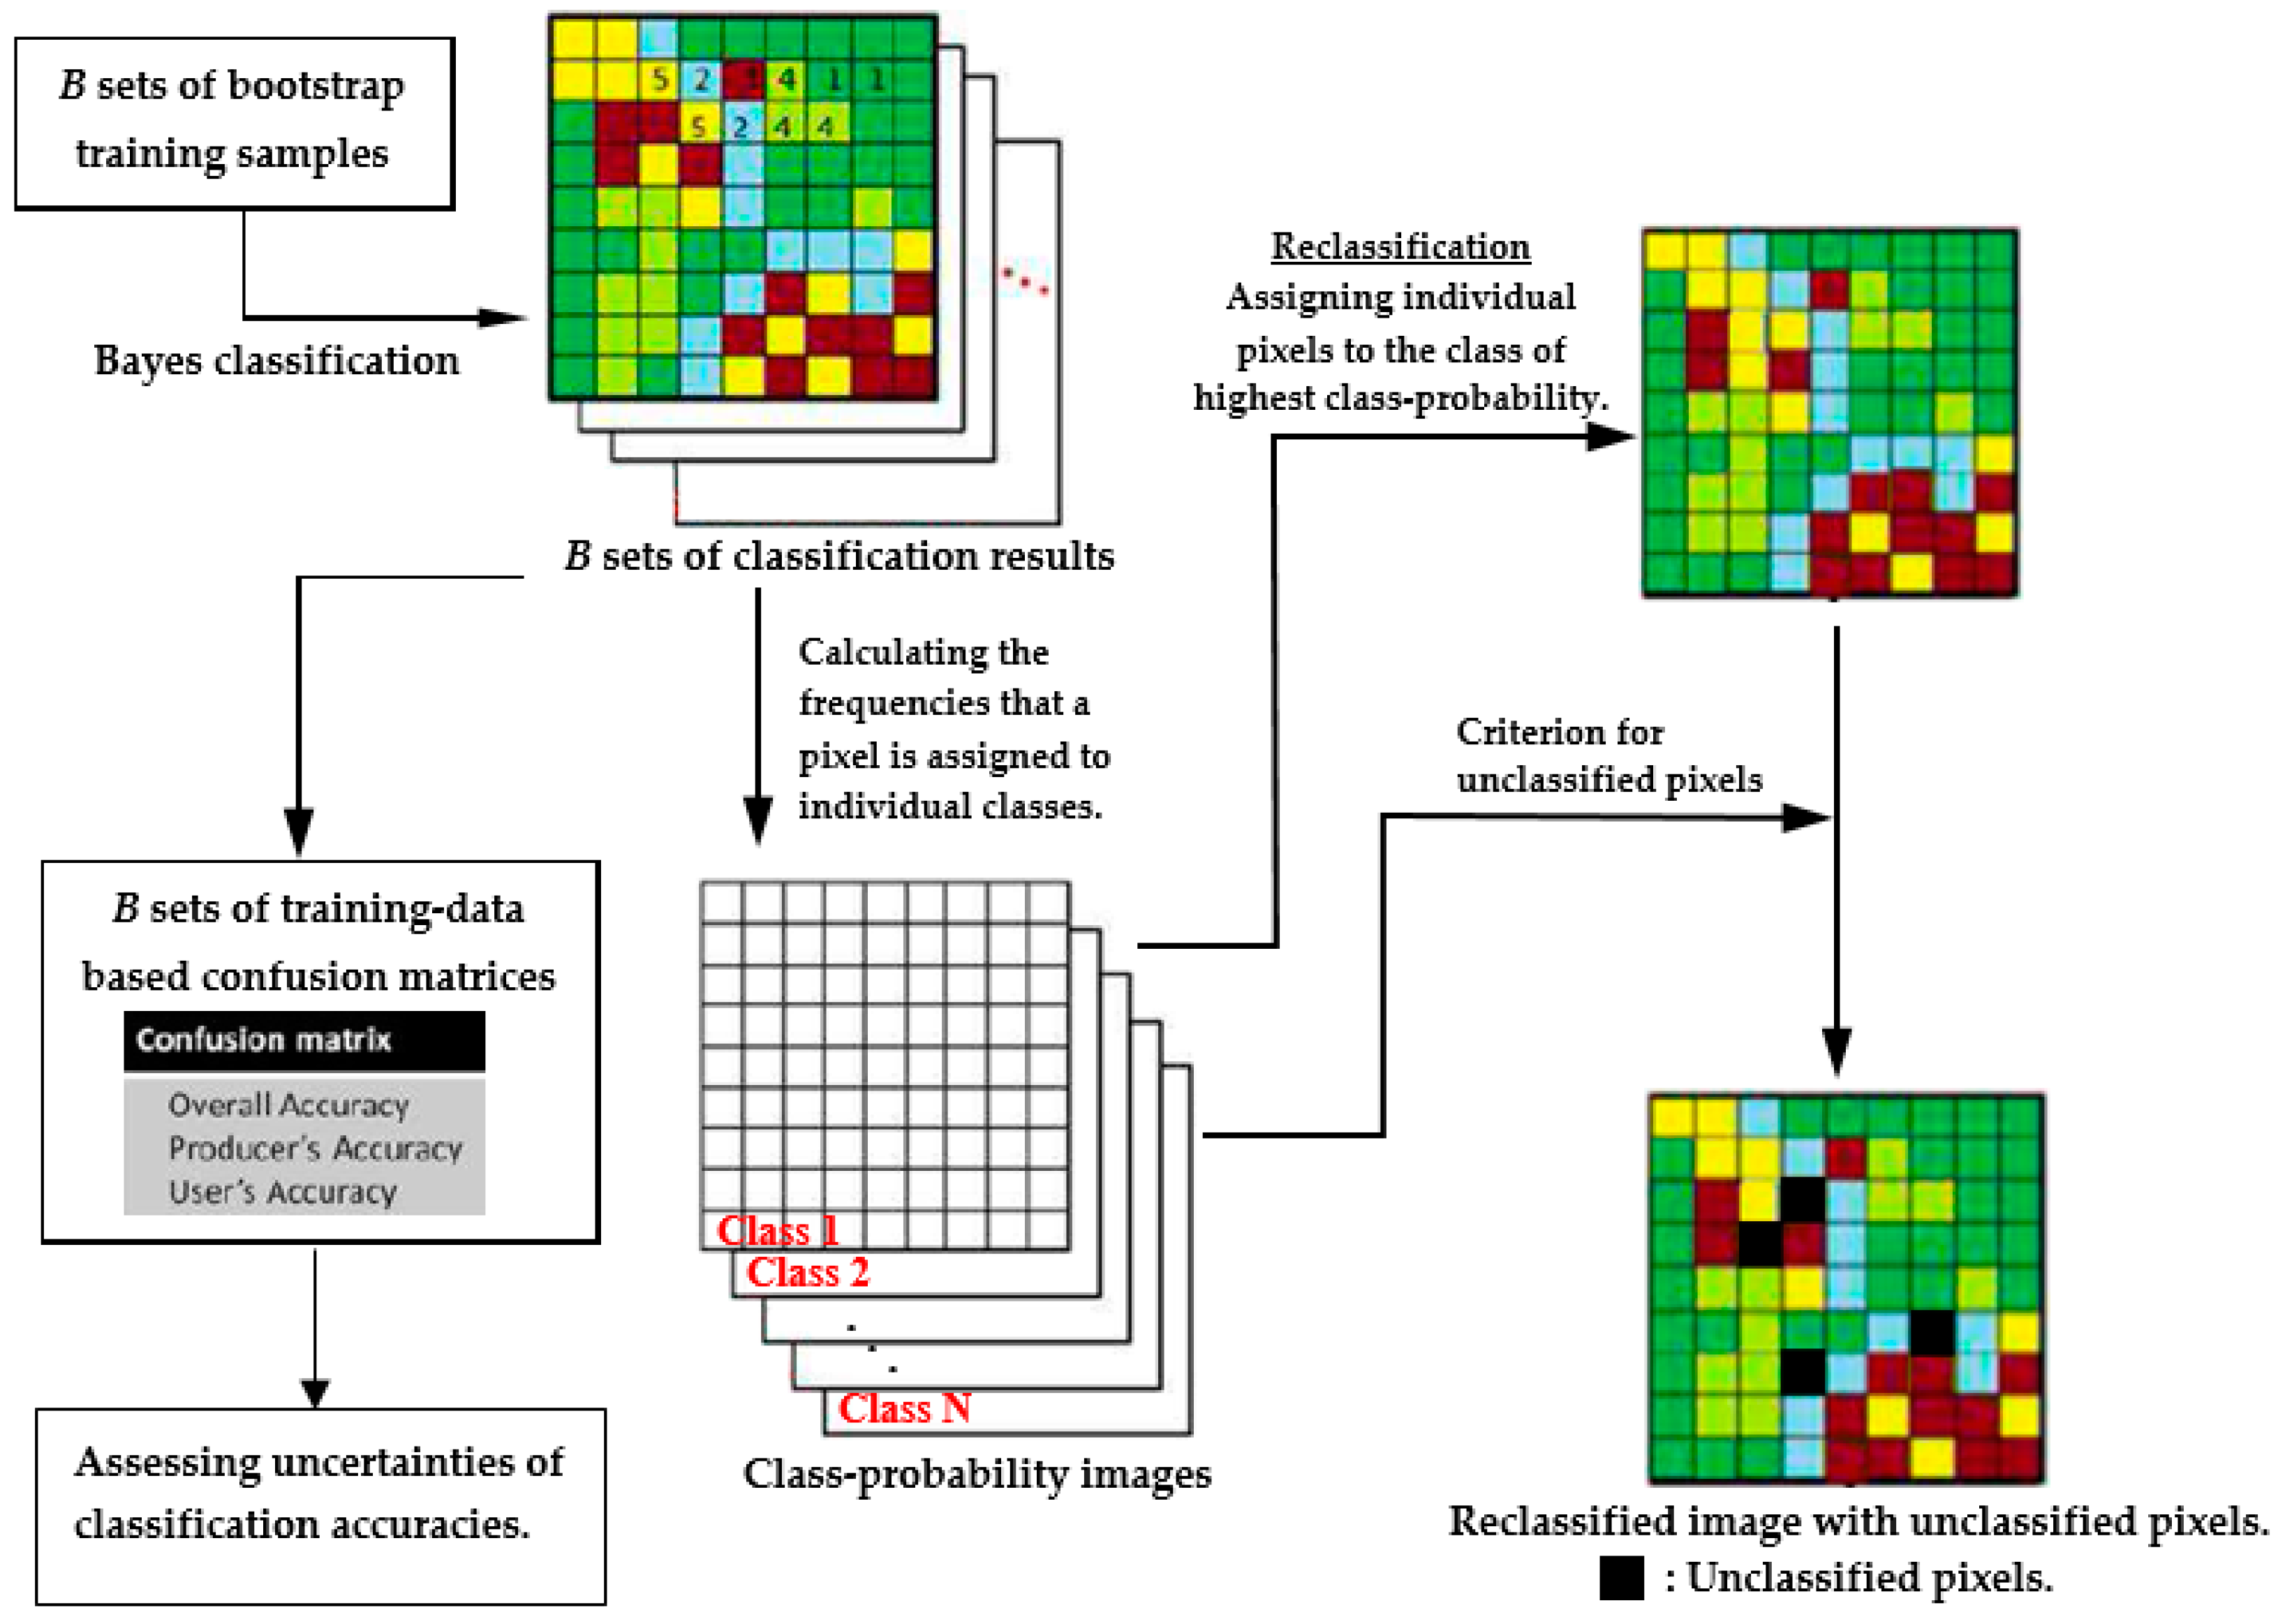
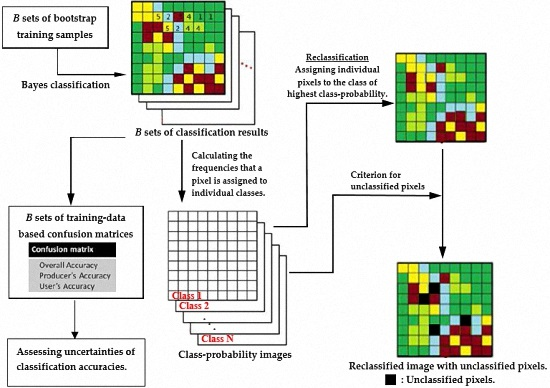
- Conduct bootstrap resampling to obtain B sets of bootstrap training samples.
- For each set of the bootstrap training samples, determine the Bayes classification decision rules of the individual LULC classes and conduct LULC classification for the entire study area. Subsequently, establish the corresponding bootstrap-training-sample-based confusion matrices. Because bootstrap samples have different distribution parameter estimates and class-dependent discriminant functions, their confusion matrices vary among different bootstrap samples, enabling the assessment of the uncertainty in the classification accuracy.
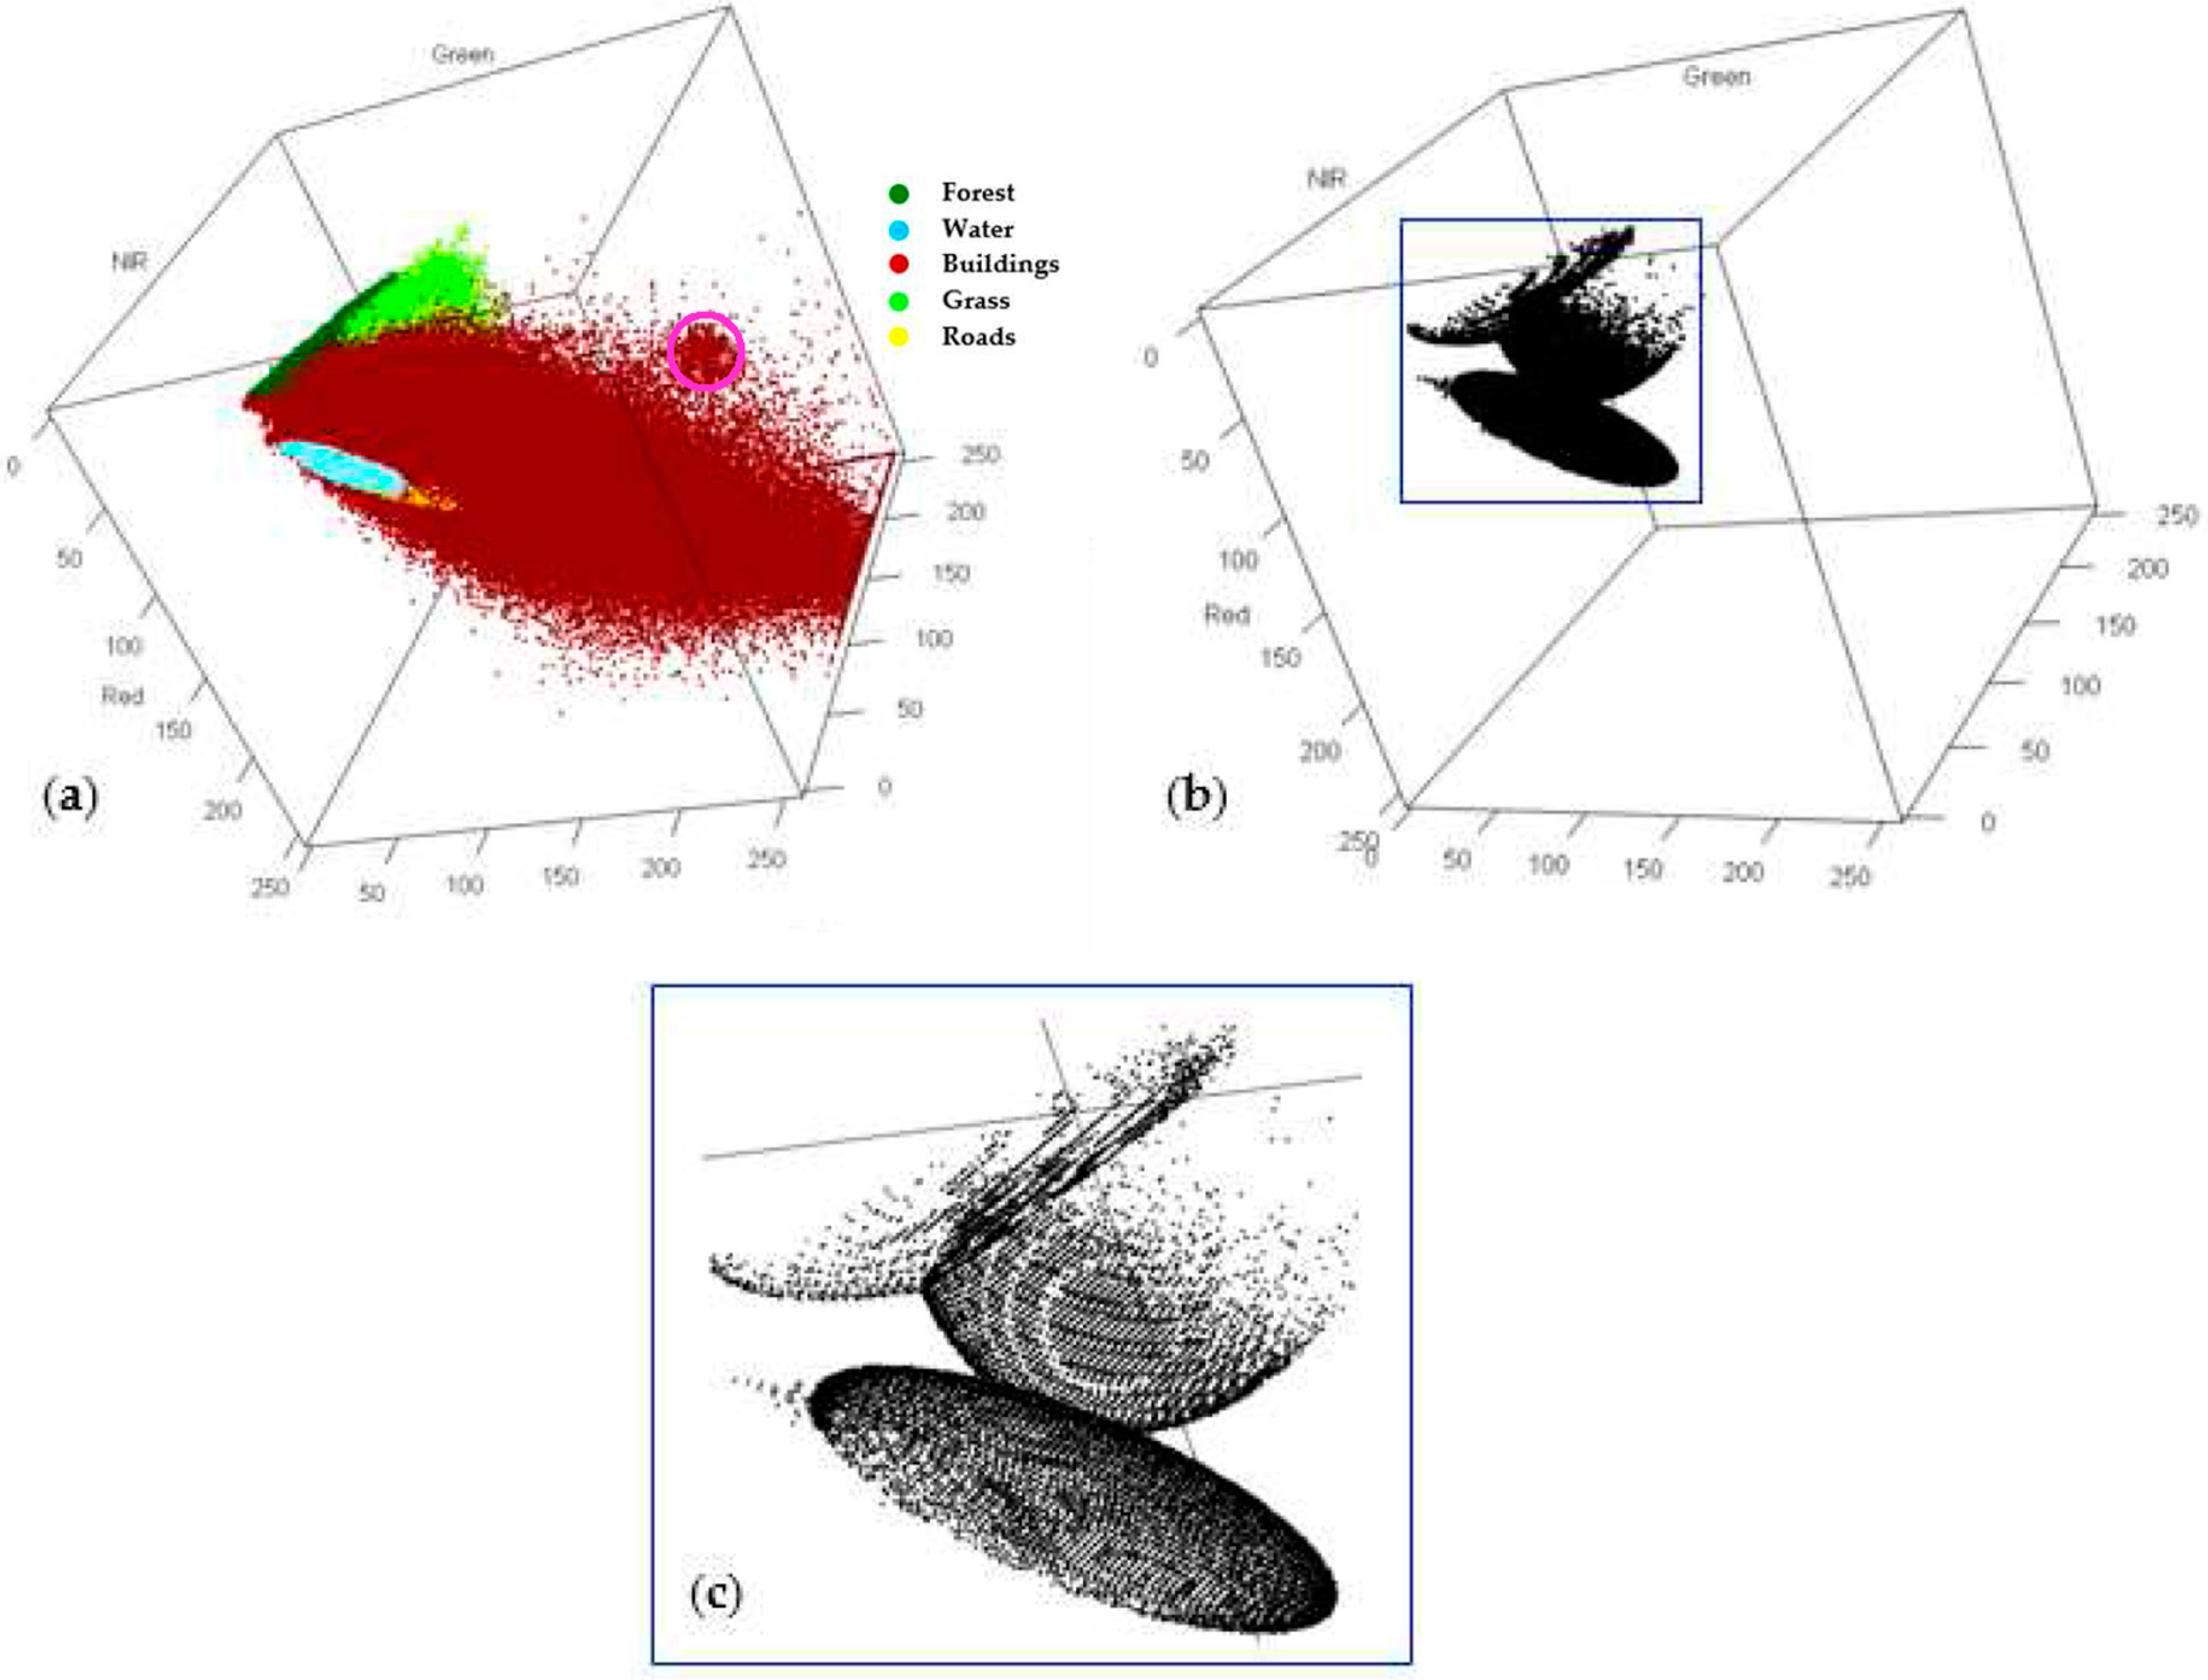
- For any pixel in the study area, calculate the frequency it is assigned to an individual LULC class. Let represent the frequency that a particular pixel is assigned to ; then, its class probability vector (CPV) is defined as . The pixel-specific CPV represents the probabilities that a pixel will be assigned to individual LULC classes (i.e., pixel-specific class probabilities). These probabilities can then be used to characterize the location-specific classification uncertainty and generate a set of class-probability images.
- Reclassify the study area by assigning individual pixels to the class of the highest class probability. In this study, this process is referred to as bootstrap-based LULC reclassification.
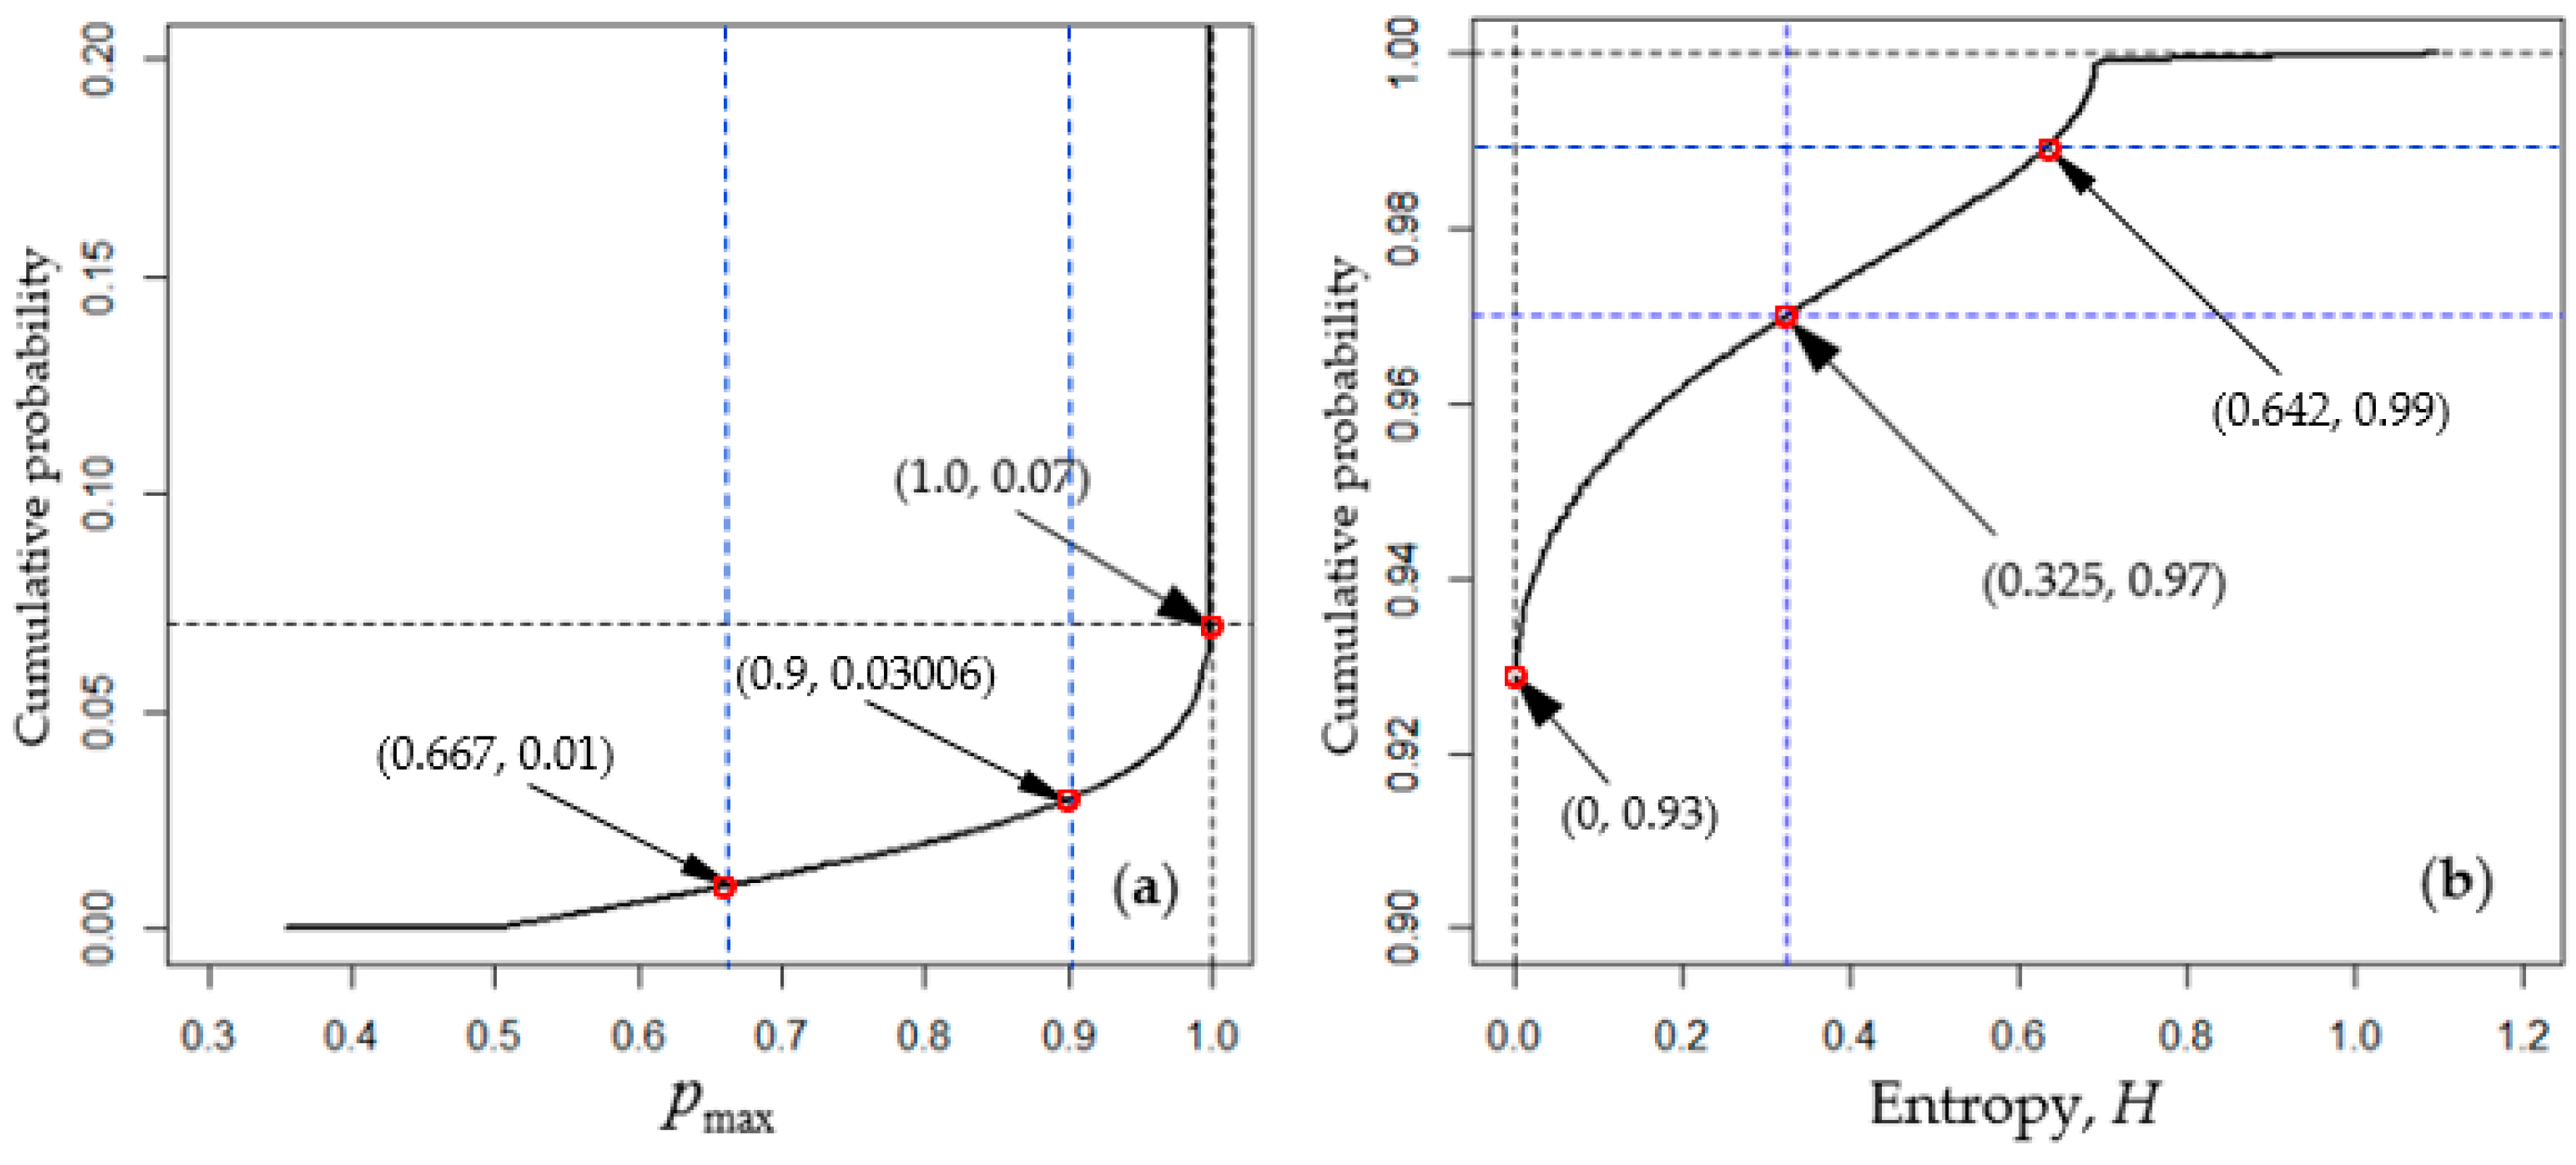
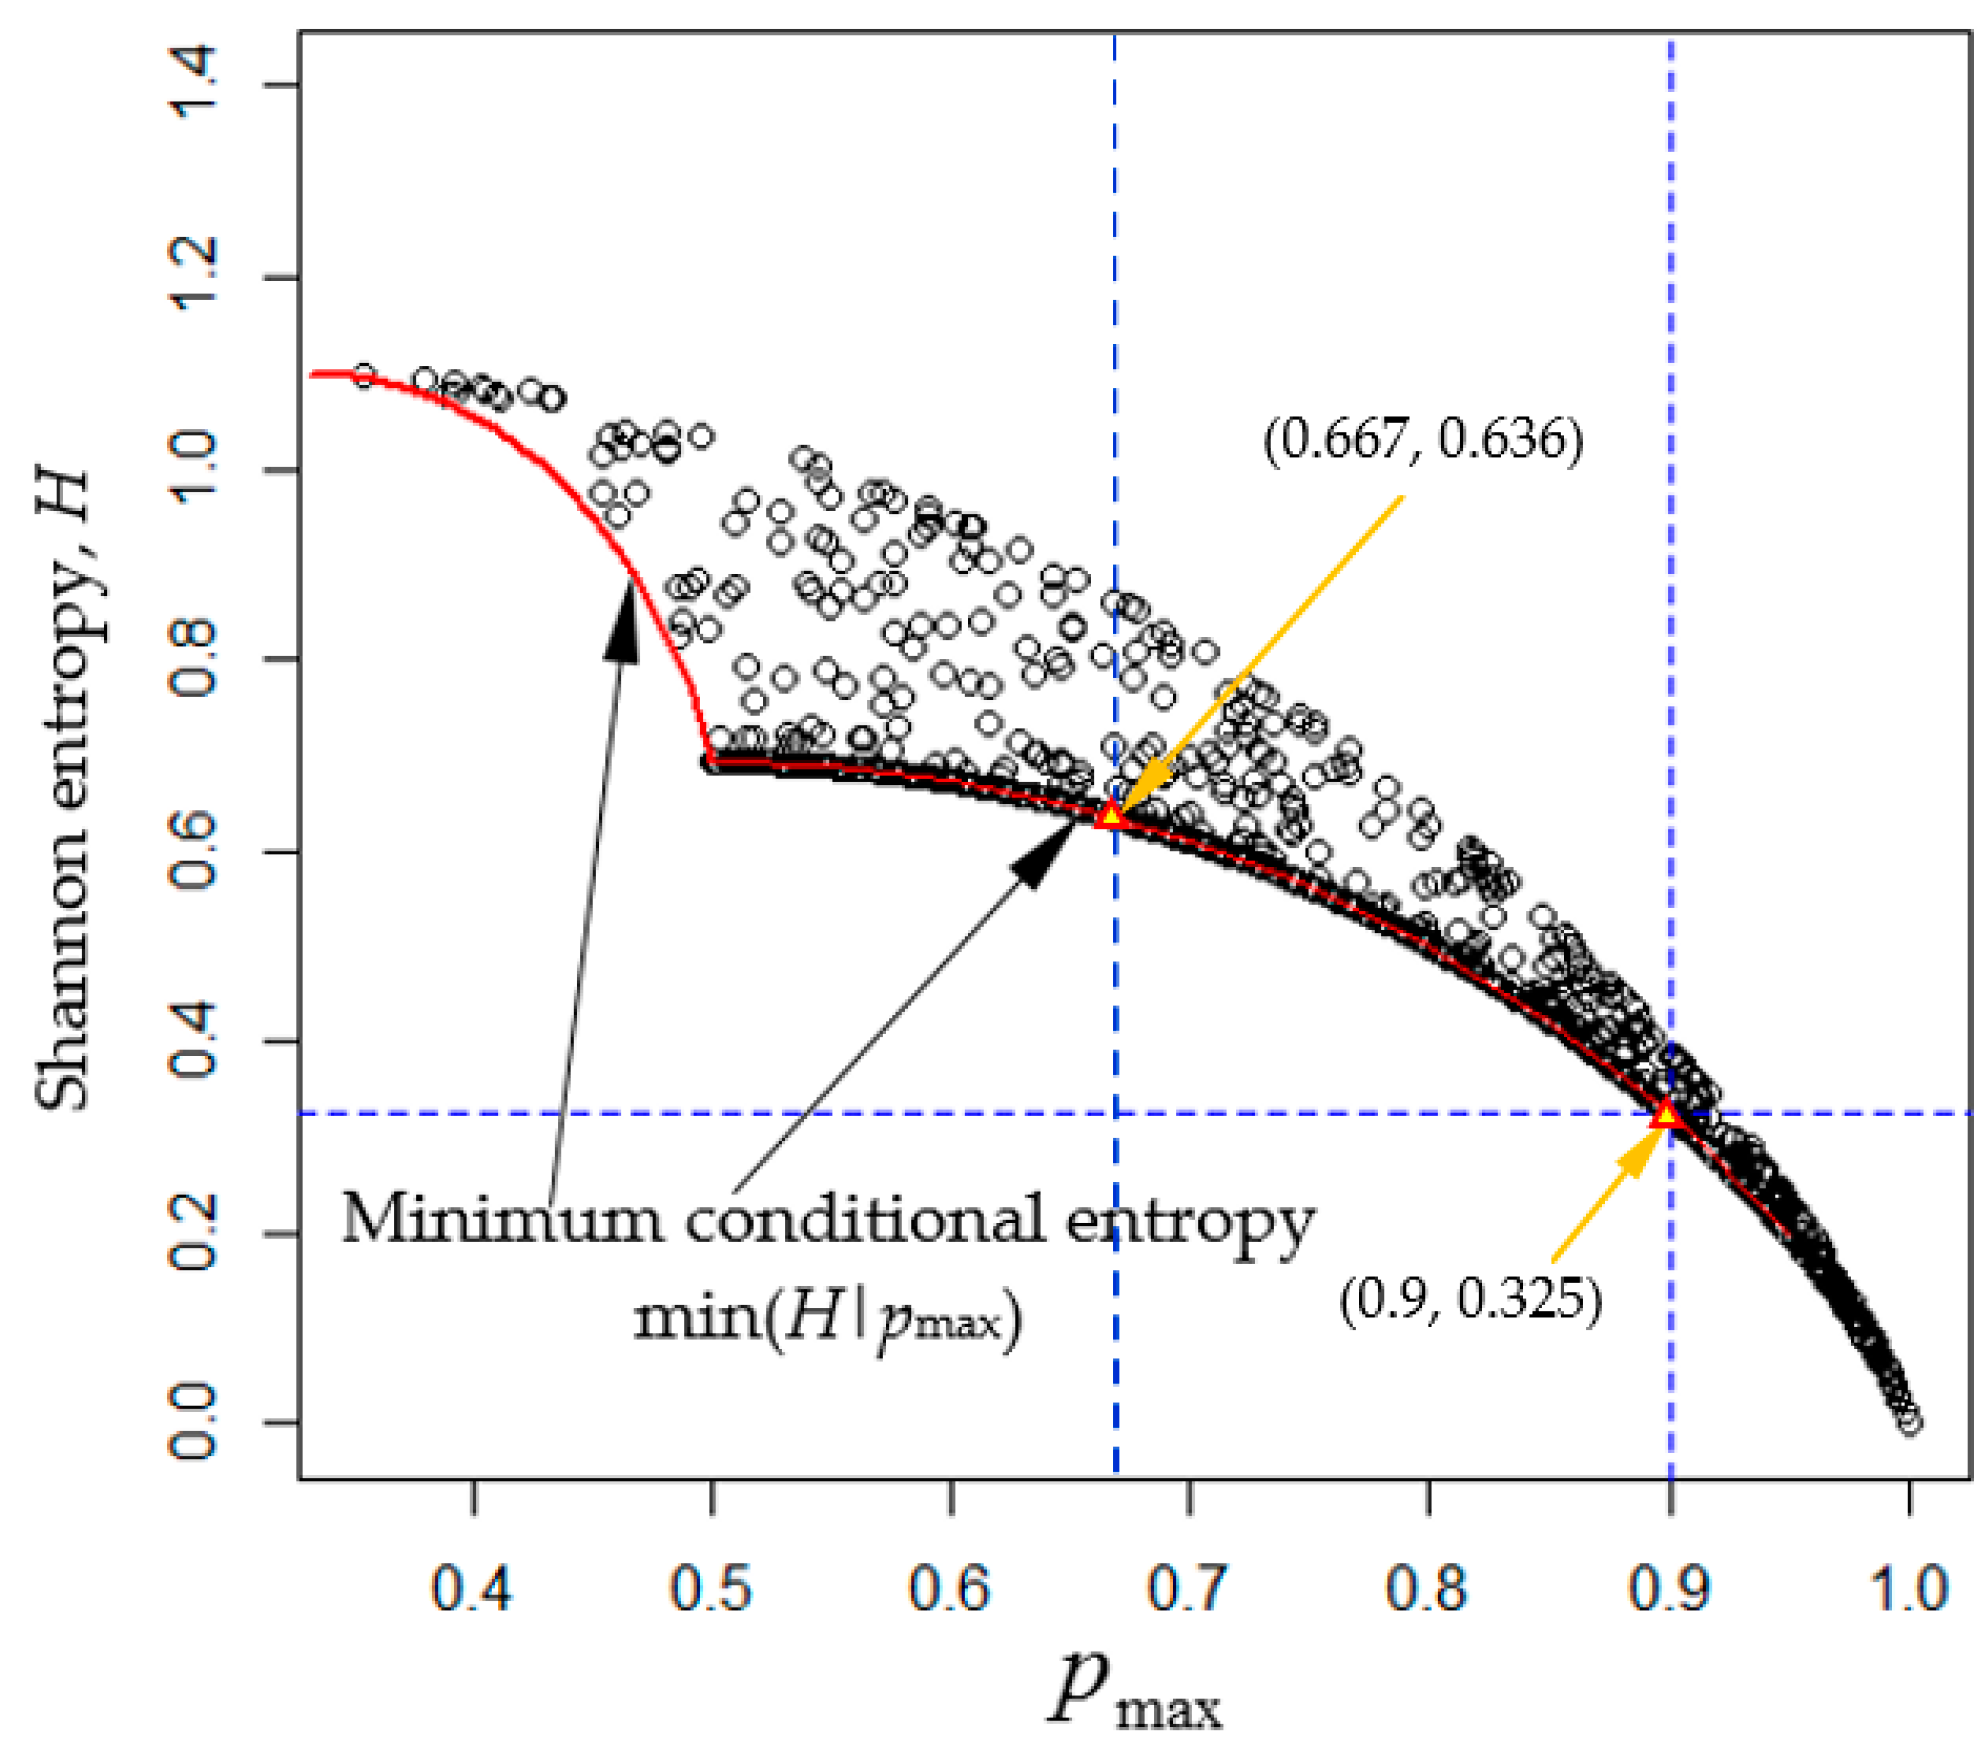
- Identify unclassified pixels by using the predetermined threshold (for example, ) for the highest class probability. A pixel with class probabilities is identified as unclassified if .
4. Results and Discussion
4.1. LULC Classification Results Based on the Original Training Data Set
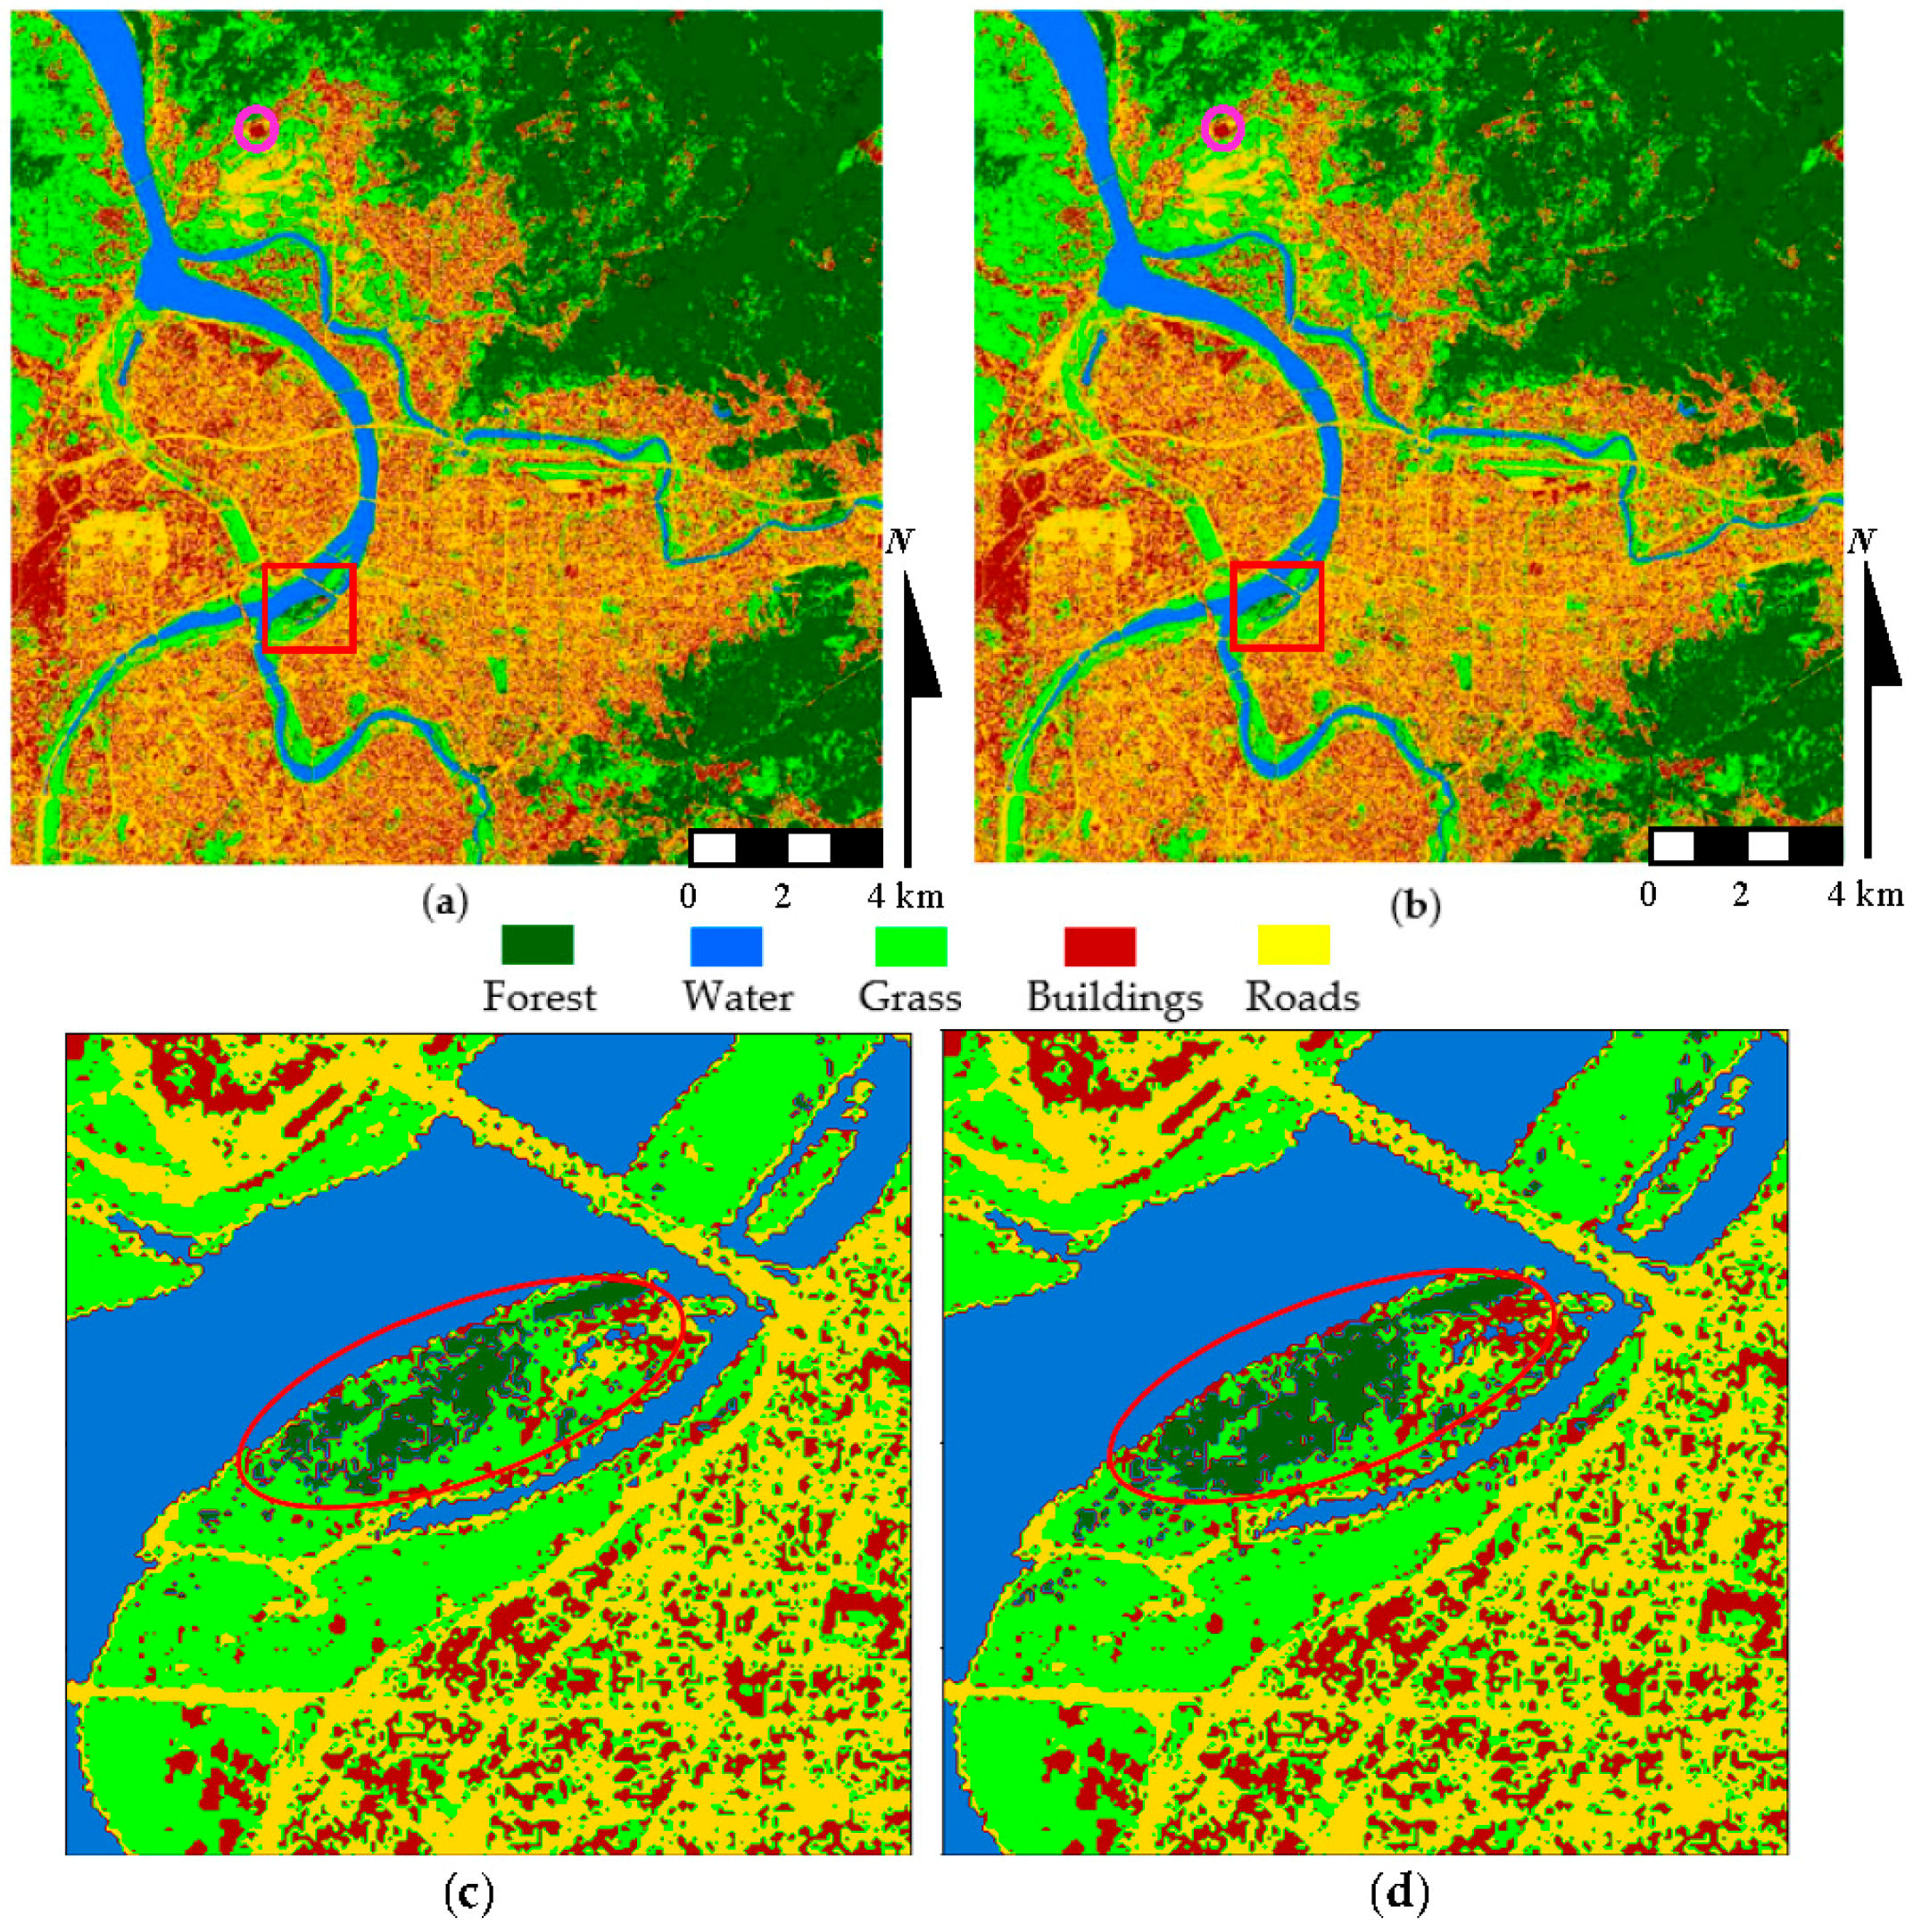
4.2. Bootstrap-Based LULC Reclassification Results
4.2.1. LULC Reclassification and Uncertainty of the Classification Accuracy
4.2.2. Pixel-Specific Classification Uncertainty and Identification of Unclassified Pixels
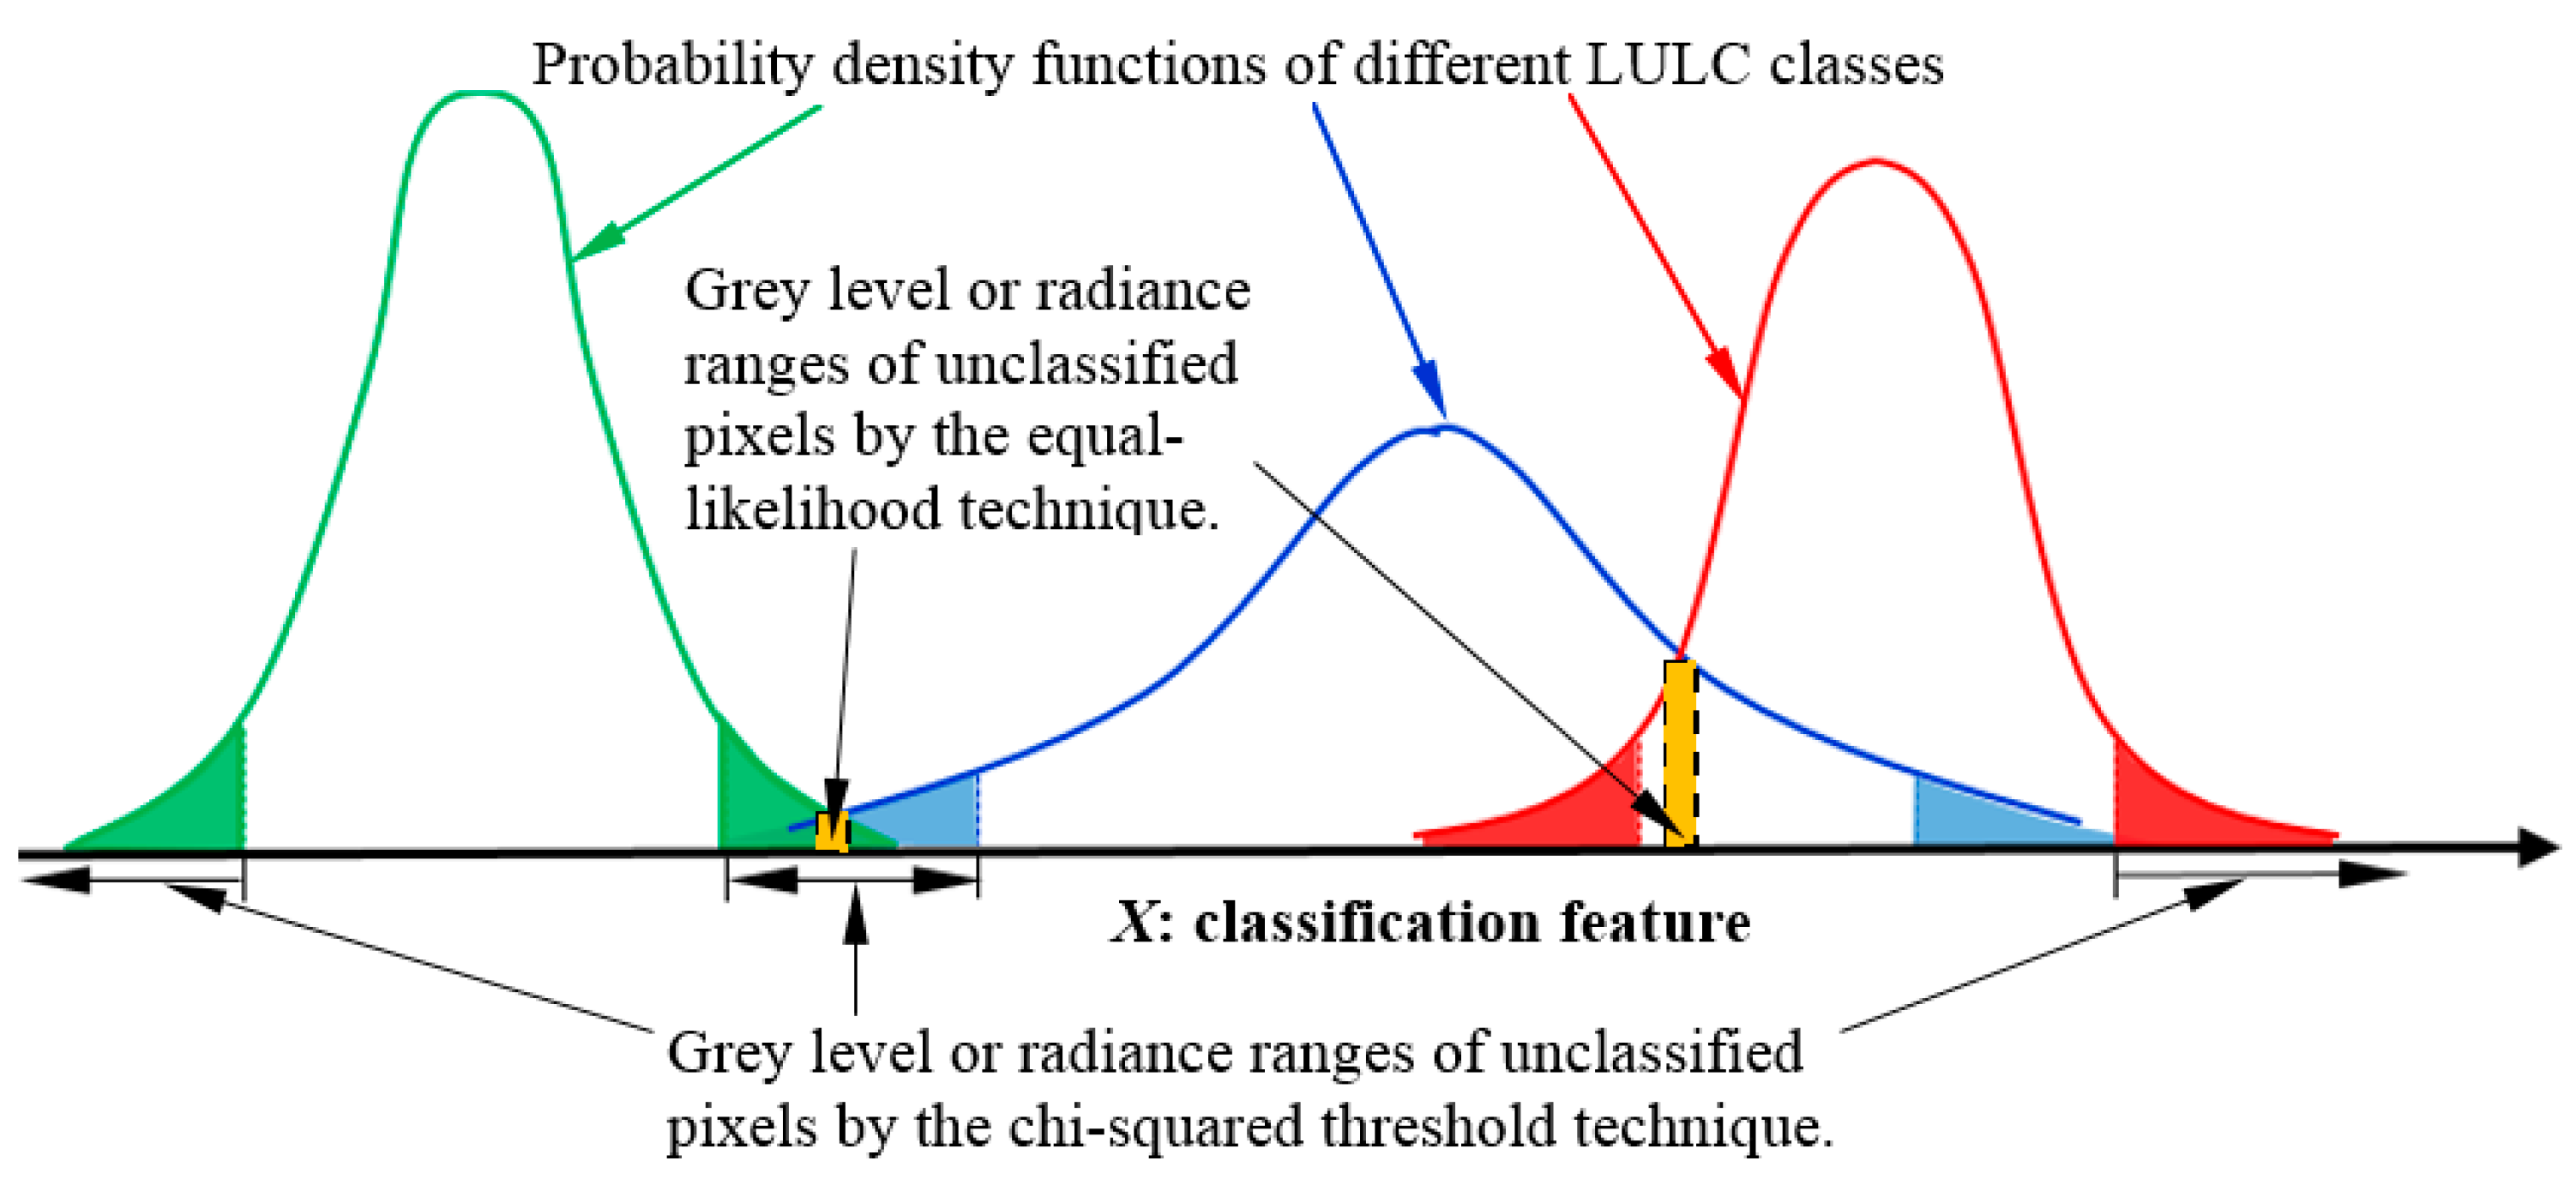
4.2.3. Comparison of Unclassified Pixels Identified Using the Chi-square Threshold Technique and Equal-Likelihood Technique
5. Conclusions
- The bootstrap resampling technique can be used to generate multispectral and multiclass bootstrap training data sets.
- The proposed bootstrap resampling and reclassification approach can be applied for assessing not only the classification uncertainty of bootstrap training samples, but also the class assignment uncertainty of individual pixels.
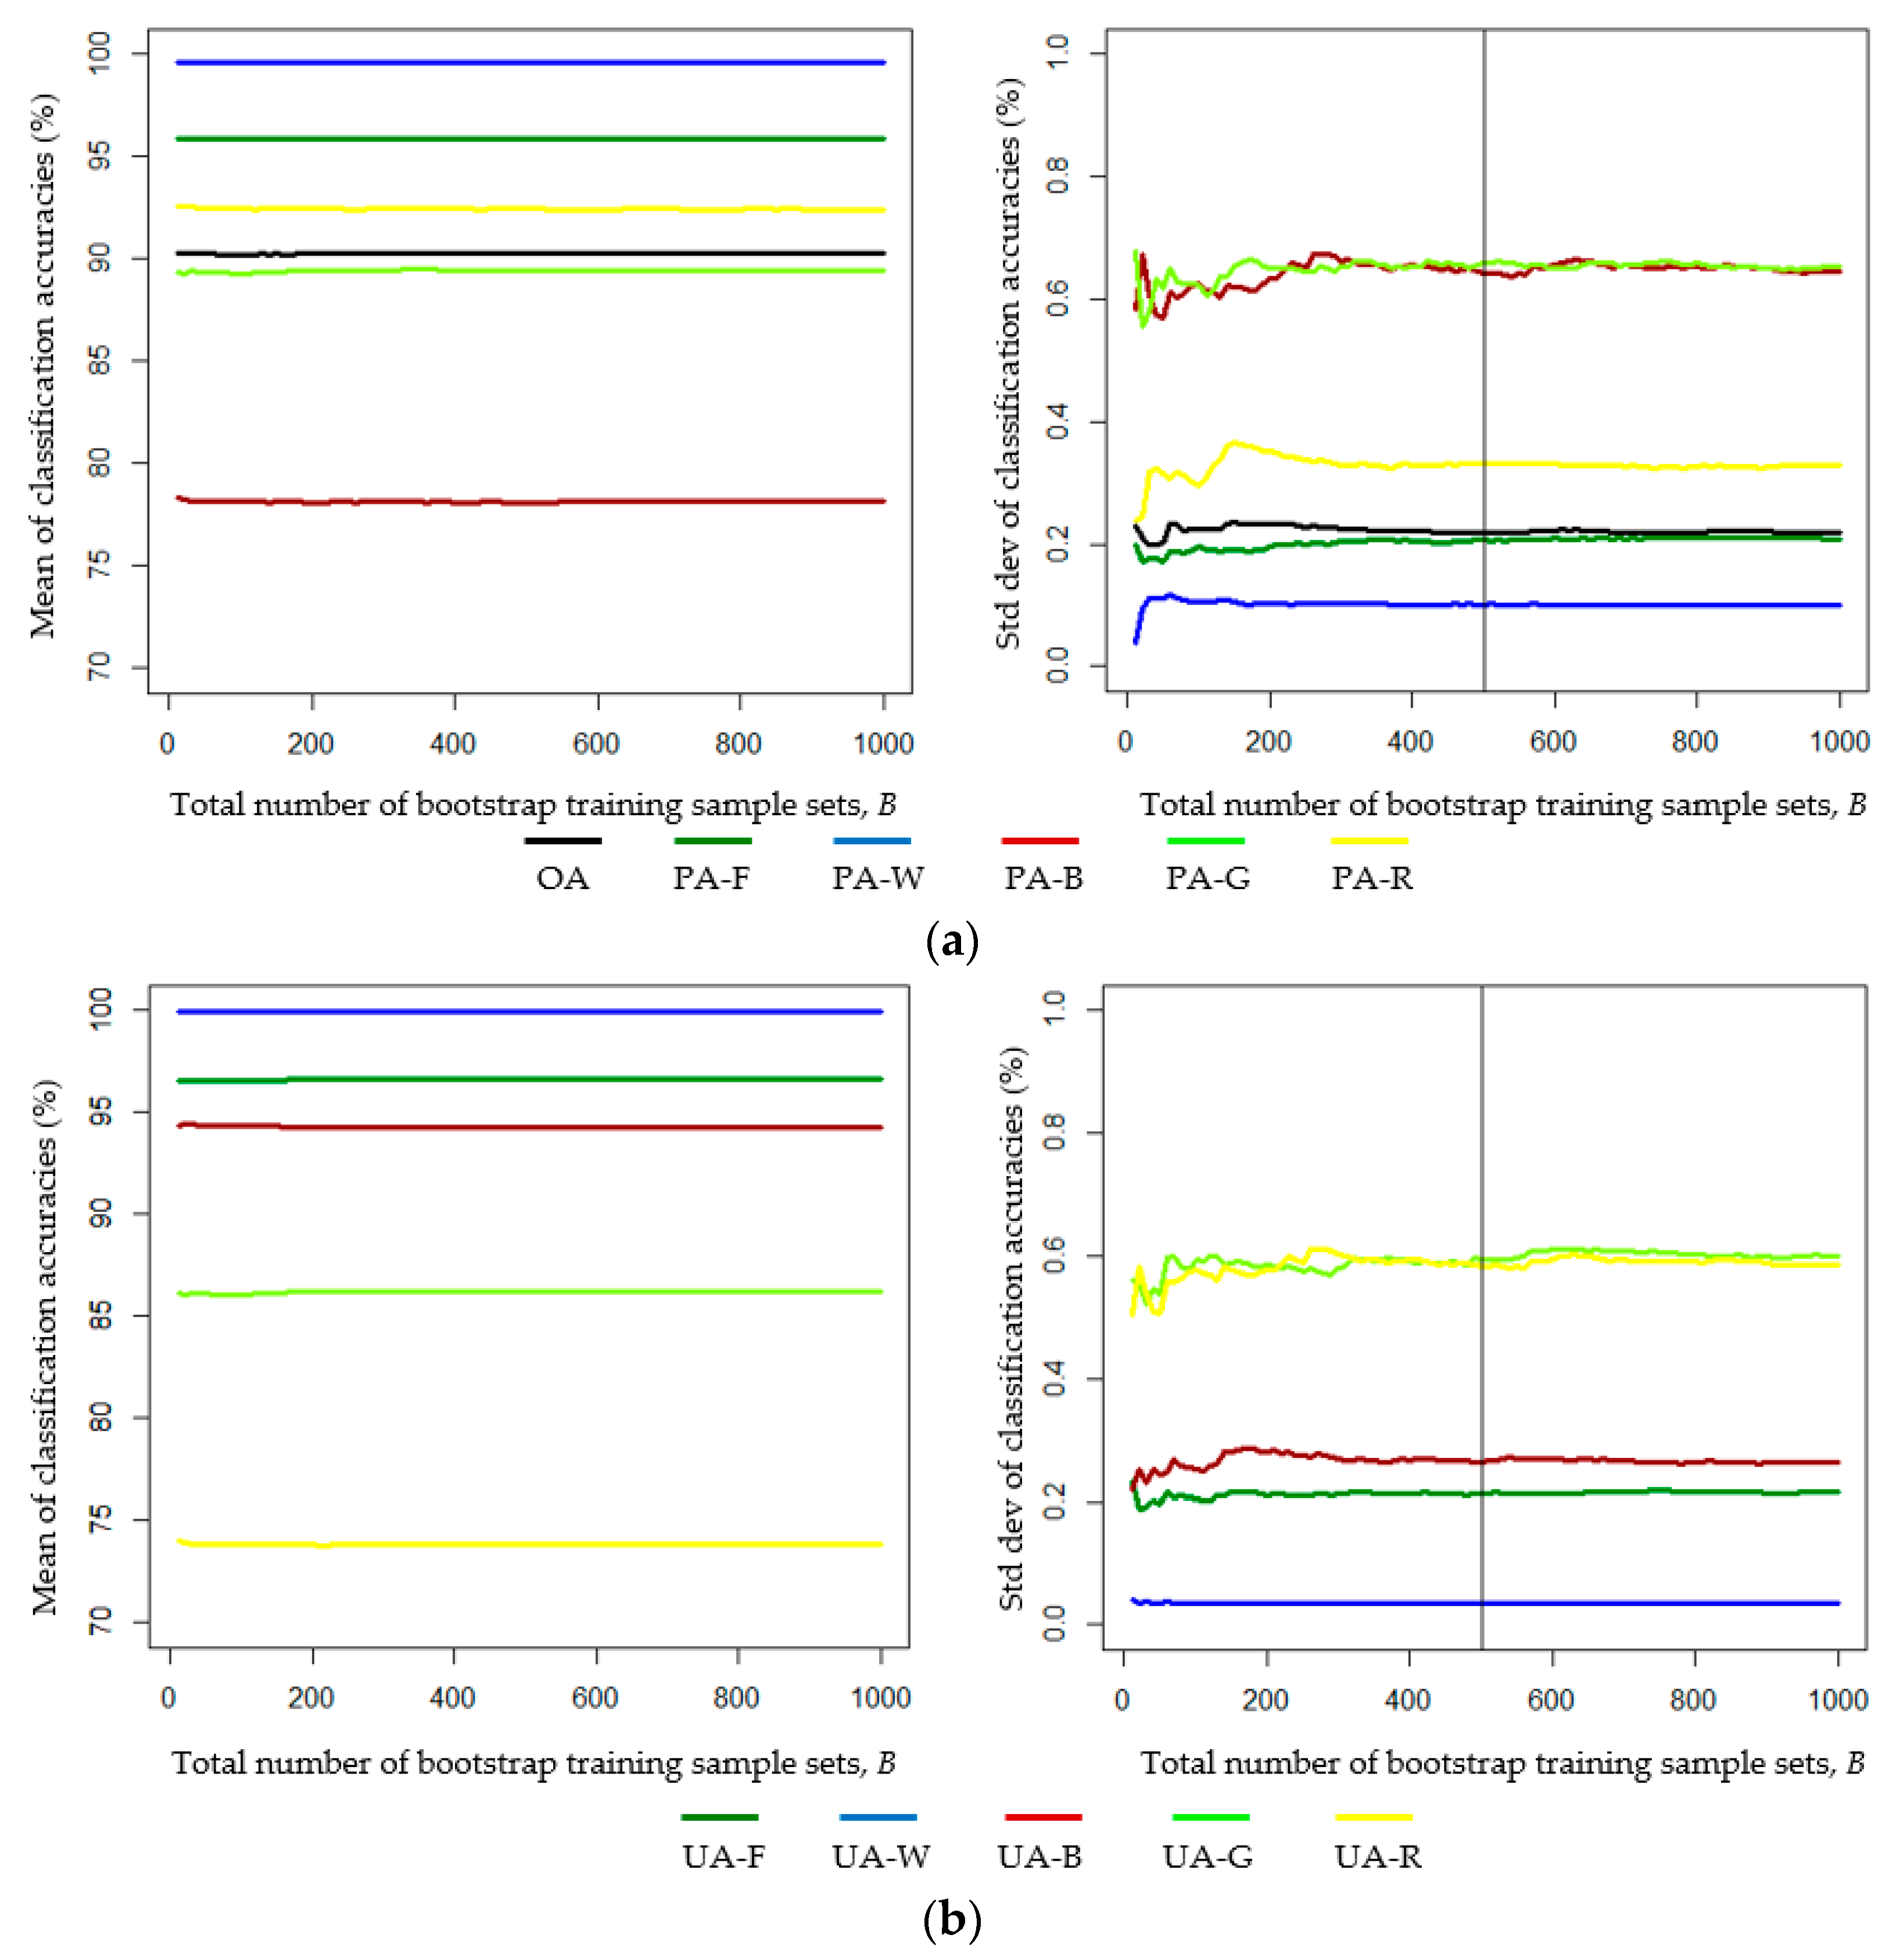
- Investigating the effect of the number of bootstrap samples on uncertainty in LULC classification accuracy is advantageous. In our study, 500 sets of bootstrap training samples were sufficient for assessing the uncertainty in the classification accuracy.
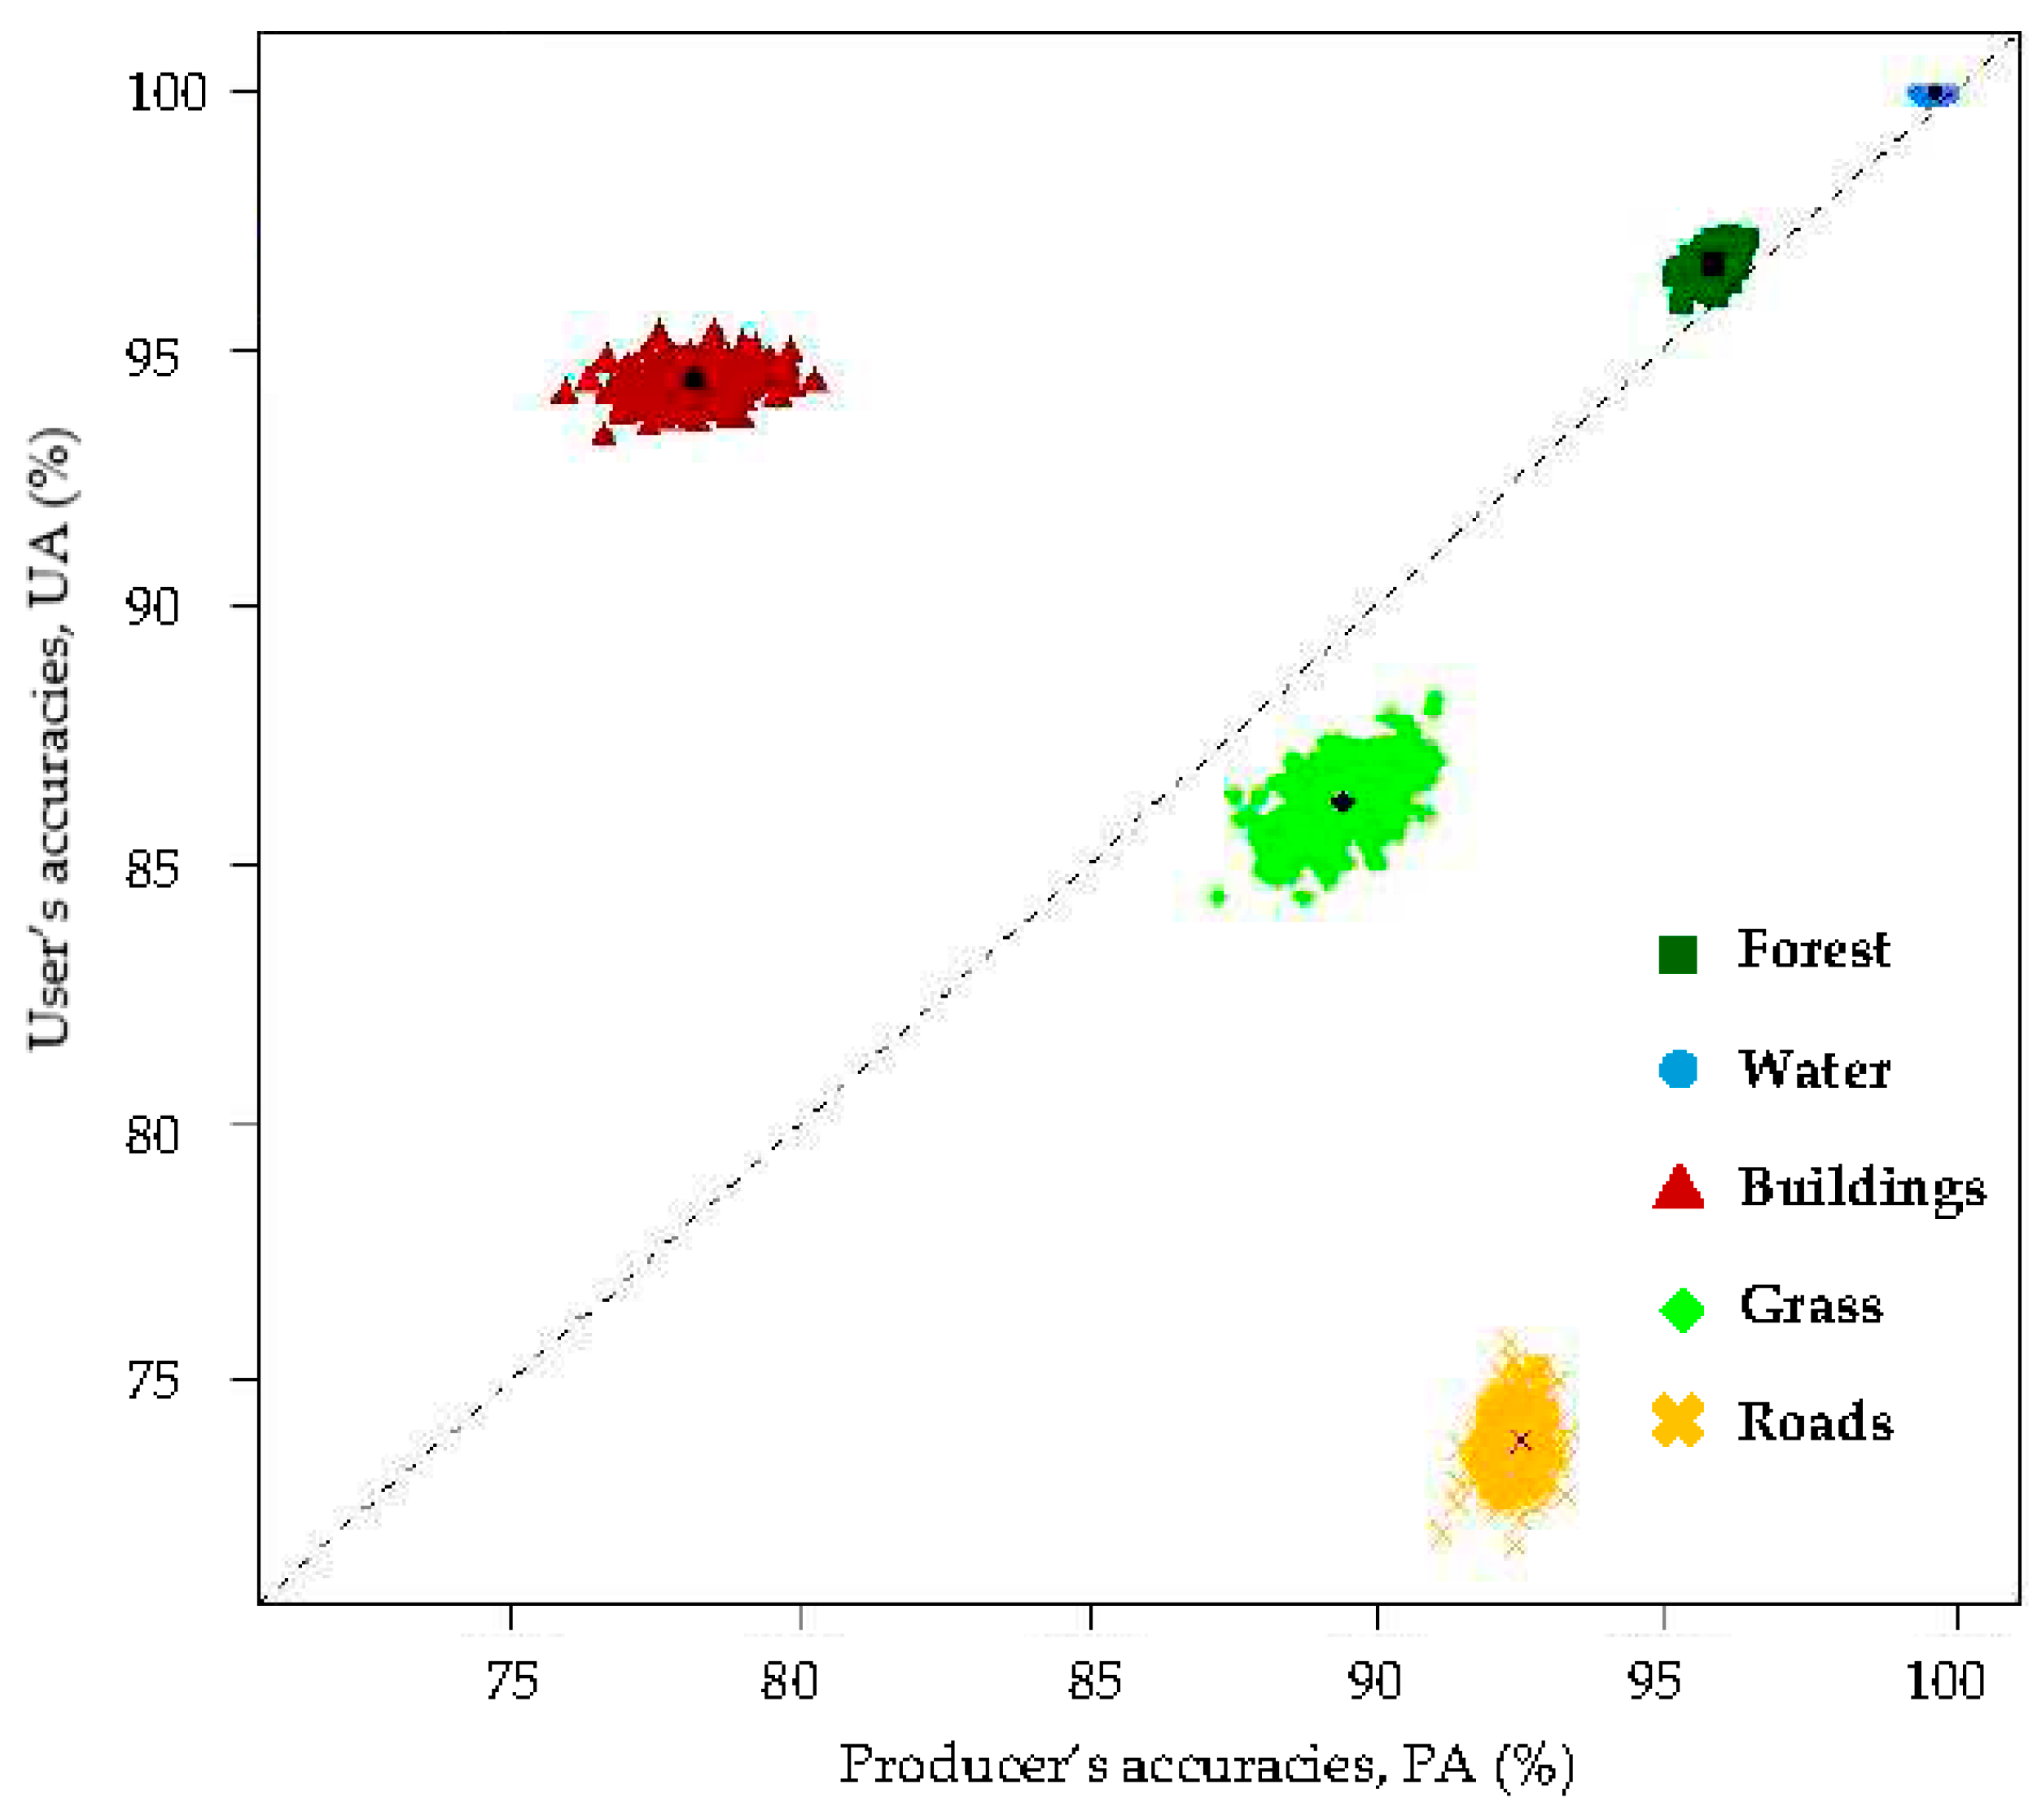
- From the results of the Bayes LULC classification based on 500 sets of bootstrap training samples, the global OA and the class-specific global UA can be estimated as the mean values of the OA and class-specific UA of the 500 bootstrap-training-samples-based confusion matrices, respectively.
- Changing the proportions of training pixels of individual LULC classes can affect the UA and the OA. The proportions of training pixels of the individual LULC classes should be consistent with the class-specific a priori probabilities. Training samples that over- or underrepresent certain LULC classes may result in errors in the accuracy of the global UA and OA estimates.
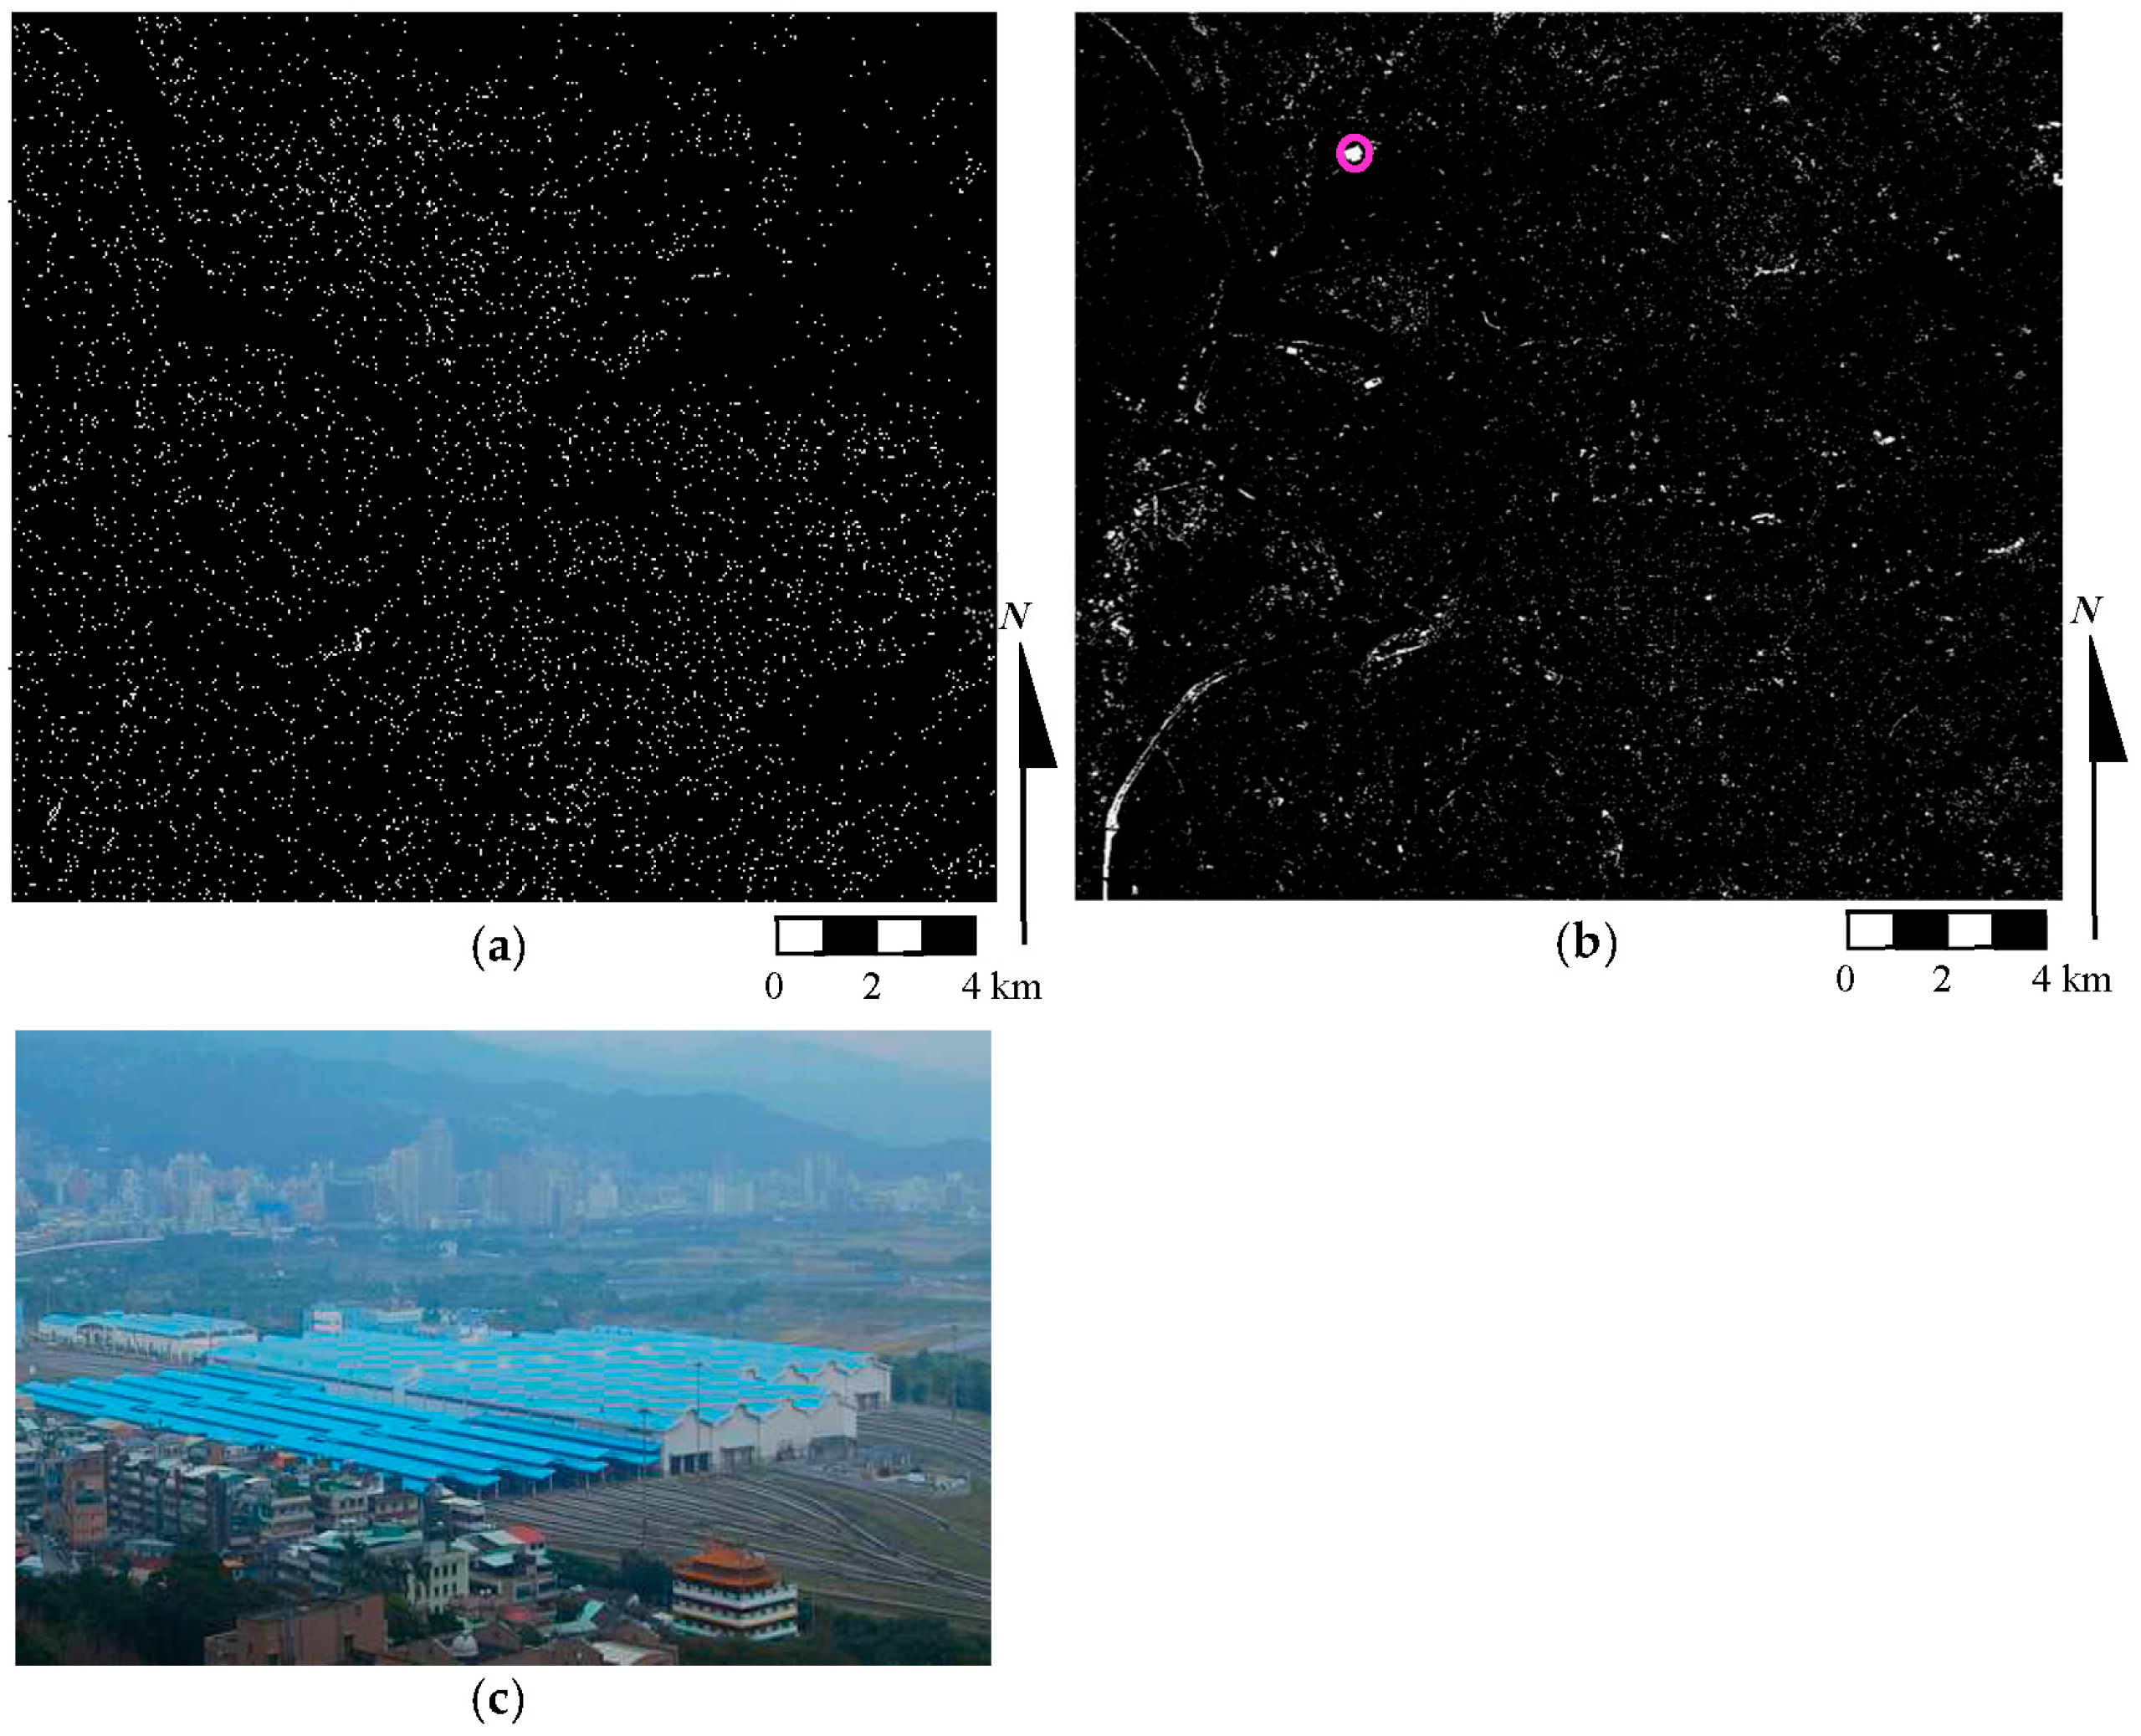
- Unclassified pixels identified using the chi-square threshold technique represent the outliers of individual LULC classes but are not necessarily associated with higher classification uncertainty.
- Unclassified pixels identified using the equal-likelihood technique are associated with higher classification uncertainty and they mostly occur on or near the borders of different land-cover types.
Acknowledgments
Author Contributions
Conflicts of Interest
Abbreviations
| LULC | Land-use/land-cover |
| CPV | Class-probability vector |
| ALOS | Advanced Land Observing Satellite |
| NIR | Near infrared |
| CDF | Cumulative distribution function |
| UA | User accuracy |
| PA | Producer accuracy |
| OA | Overall accuracy |
References
- Price, J.C. Land surface temperature measurements from the split window channels of the NOAA 7 advanced very high-resolution radiometer. J. Geophys. Res. 1984, 89, 7231–7237. [Google Scholar] [CrossRef]
- Kerr, Y.H.; Lagouarde, J.P.; Imbernon, J. Accurate land surface temperature retrieval from AVHRR data with use of an improved split window algorithm. Remote Sens. Environ. 1992, 41, 197–209. [Google Scholar] [CrossRef]
- Gallo, K.P.; McNab, A.L.; Karl, T.R.; Brown, J.F.; Hood, J.J.; Tarpley, J.D. The use NOAA AVHRR data for assessment of the urban heat island effect. J. Appl. Meteorol. 1993, 32, 899–908. [Google Scholar] [CrossRef]
- Wan, Z.; Li, Z.L. A Physics-based algorithm for retrieving land-surface emissivity and temperature from EOS/MODIS data. IEEE Trans. Geosci. Remote Sens. 1997, 35, 980–996. [Google Scholar]
- Florio, E.N.; Lele, S.R.; Chang, Y.C.; Sterner, R.; Glass, G.E. Integrating AVHRR satellite data and NOAA ground observations to predict surface air temperature: a statistical approach. Int. J. Remote Sens. 2004, 25, 2979–2994. [Google Scholar] [CrossRef]
- Cheng, K.S.; Su, Y.F.; Kuo, F.T.; Hung, W.C.; Chiang, J.L. Assessing the effect of landcover on air temperature using remote sensing images—A pilot study in northern Taiwan. Landsc. Urban Plan. 2008, 85, 85–96. [Google Scholar] [CrossRef]
- Chiang, J.L.; Liou, J.J.; Wei, C.; Cheng, K.S. A feature-space indicator Kriging approach for remote sensing image classification. IEEE Trans. Geosci. Remote Sens. 2014, 52, 4046–4055. [Google Scholar] [CrossRef]
- Parinussa, R.M.; Lakshmi, V.; Johnson, F.; Sharma, A. Comparing and combining remotely sensed land surface temperature products for improved hydrological applications. Remote Sens. 2016, 8, 162. [Google Scholar] [CrossRef]
- Cheng, K.S.; Wei, C.; Chang, S.C. Locating landslides using multi-temporal satellite images. Adv. Space Res. 2004, 33, 296–301. [Google Scholar] [CrossRef]
- Teng, S.P.; Chen, Y.K.; Cheng, K.S.; Lo, H.C. Hypothesis-test-based landcover change detection using multi-temporal satellite images–A comparative study. Adv. Space Res. 2008, 41, 1744–1754. [Google Scholar] [CrossRef]
- Hung, W.C.; Chen, Y.C.; Cheng, K.S. Comparing landcover patterns in Tokyo, Kyoto, and Taipei using ALOS multispectral images. Landsc. Urban Plan. 2010, 97, 132–145. [Google Scholar] [CrossRef]
- Chen, Y.C.; Chiu, H.W.; Su, Y.F.; Wu, Y.C.; Cheng, K.S. Does urbanization increase diurnal land surface temperature variation? Evidence and implications. Landsc. Urban Plan. 2017, 157, 247–258. [Google Scholar] [CrossRef]
- Ridd, M.K.; Liu, J.A. Comparison of four algorithms for change detection in an urban environment. Remote Sens. Environ. 1998, 63, 95–100. [Google Scholar] [CrossRef]
- Sinha, P.; Kumar, L.; Reid, N. Rank-based methods for selection of landscape metrics for land cover pattern change detection. Remote Sens. 2016, 8, 107. [Google Scholar] [CrossRef]
- Cheng, K.S.; Lei, T.C. Reservoir trophic state evaluation using Landsat TM images. J. Am. Water Resour. Assoc. 2001, 37, 1321–1334. [Google Scholar] [CrossRef]
- Ritchie, J.C.; Zimba, P.V.; Everitt, J.H. Remote sensing techniques to assess water quality. Photogramm. Eng. Remote Sens. 2003, 69, 695–704. [Google Scholar] [CrossRef]
- Su, Y.F.; Liou, J.J.; Hou, J.C.; Hung, W.C.; Hsu, S.M.; Lien, Y.T.; Su, M.D.; Cheng, K.S.; Wang, Y.F. A multivariate model for coastal water quality mapping using satellite remote sensing images. Sensors 2008, 8, 6321–6339. [Google Scholar] [CrossRef]
- Giardino, C.; Bresciani, M.; Villa, P.; Martinelli, A. Application of remote sensing in water resource management: The case study of Lake Trasimeno, Italy. Water Resour. Manag. 2010, 24, 3885–3899. [Google Scholar] [CrossRef]
- Joshi, I.; D’Sa, E.J. Seasonal variation of colored dissolved organic matter in Barataria Bay, Louisiana, using combined Landsat and field data. Remote Sens. 2015, 7, 12478–12502. [Google Scholar] [CrossRef]
- Kong, J.L.; Sun, X.M.; Wong, D.W.; Chen, Y.; Yang, J.; Yan, Y.; Wang, L.X. A semi-analytical model for remote sensing retrieval of suspended sediment concentration in the Gulf of Bohai, China. Remote Sens. 2015, 7, 5373–5397. [Google Scholar] [CrossRef]
- Yang, K.; Li, M.; Liu, Y.; Cheng, L.; Huang, Q.; Chen, Y. River detection in remotely sensed imagery using Gabor filtering and path opening. Remote Sens. 2015, 7, 8779–8802. [Google Scholar] [CrossRef]
- Zheng, Z.; Li, Y.; Guo, Y.; Xu, Y.; Liu, G.; Du, C. Landsat-based long-term monitoring of total suspended matter concentration pattern change in the wet season for Dongting Lake, China. Remote Sens. 2015, 7, 13975–13999. [Google Scholar] [CrossRef]
- Qiu, F.; Jensen, J.R. Opening the black box of neural networks for remote sensing image classification. Int. J. Remote Sens. 2004, 25, 1749–1768. [Google Scholar] [CrossRef]
- Han, M.; Zhu, X.; Yao, W. Remote sensing image classification based on neural network ensemble algorithm. Neurocomputing 2012, 78, 133–138. [Google Scholar] [CrossRef]
- Mitra, P.; Shankar, B.U.; Pal, S.K. Segmentation of multispectral remote sensing images using active support vector machines. Pattern Recognit. Lett. 2004, 25, 1067–1074. [Google Scholar] [CrossRef]
- Foody, G.M.; Mathur, A. The use of small training sets containing mixed pixels for accurate hard image classification: Training on mixed spectral responses for classification by a SVM. Remote Sens. Environ. 2006, 103, 179–189. [Google Scholar] [CrossRef]
- Mountrakis, G.; Im, J.; Ogole, C. Support vector machines in remote sensing: A review. ISPRS J. Photogramm. Remote Sens. 2011, 66, 247–259. [Google Scholar] [CrossRef]
- Mellor, A.; Haywood, A.; Stone, C.; Jones, S. The performance of random forests in an operational setting for large area sclerophyll forest classification. Remote Sens. 2013, 5, 2838–2856. [Google Scholar] [CrossRef]
- Belgiu, M.; Drăguţ, L. Random forest in remote sensing: A review of applications and future directions. ISPRS J. Photogramm. Remote Sens. 2016, 114, 24–31. [Google Scholar] [CrossRef]
- Congalton, R.G. A review of assessing the accuracy of classifications of remotely sensed data. Remote Sens. Environ. 1991, 37, 35–46. [Google Scholar] [CrossRef]
- Foody, G.M. Thematic map comparison: Evaluating the statistical significance of differences in classification accuracy. Photogramm. Eng. Remote Sens. 2004, 70, 627–634. [Google Scholar] [CrossRef]
- Foody, G.M. Harshness in image classification accuracy assessment. Int. J. Remote Sens. 2008, 29, 3137–3158. [Google Scholar] [CrossRef]
- Foody, G.M. Status of land cover classification accuracy assessment. Remote Sens. Environ. 2002, 80, 185–201. [Google Scholar] [CrossRef]
- Richards, J.A. Remote Sensing Digital Image Analysis, 2nd ed.; Springer-Verlag: New York, NY, USA, 1995; pp. 185–186. [Google Scholar]
- Calibration Result of JAXA Standard Products (As of March 29, 2007). Available online: http://www.eorc.jaxa.jp/en/hatoyama/satellite/data_tekyo_setsumei/alos_hyouka_e.html (accessed on 22 August 2016).
- Ministry of Interior, Taiwan. Landuse Map, 2009 (A report in Chinese). Available online: http://www.moi.gov.tw/english/ (accessed on 22 August 2016).
- Efron, B. Bootstrap methods: Another look at the jackknife. Ann. Stat. 1979, 7, 1–26. [Google Scholar] [CrossRef]
- Horowitz, J.L. The bootstrap. In Handbook of Econometrics; Heckman, J.J., Leamer, E., Eds.; North Holland Publishing Company: New York, NY, USA, 2001; Volume 5, pp. 3160–3228. [Google Scholar]
- Weber, K.T.; Langille, J. Improving classification accuracy assessments with statistical bootstrap resampling techniques. GISci. Remote Sens. 2007, 44, 237–250. [Google Scholar] [CrossRef]
- Bo, Y.; Wang, J. A General Method for Assessing the Uncertainty in Classified Remotely Sensed Data at Pixel Scale. In Proceedings of the 8th International Symposium on Spatial Accuracy Assessment in Natural Resources and Environmental Sciences, Shanghai, China, 25–27 June 2008.
- Loosvelt, L.; Peters, J.; Skriver, H.; Lievens, H.; Van Coillie, F.M.B.; De Baets, B.; Verhoest, N.E.C. Random forests as a tool for estimating uncertainty at pixel-level in SAR image classification. Int. J. Appl. Earth Obs. Geoinf. 2012, 19, 173–184. [Google Scholar] [CrossRef]
- Liou, J.J.; Wu, Y.C.; Cheng, K.S. Establishing acceptance regions for L-moments based goodness-of-fit tests by stochastic simulation. J. Hydrol. 2008, 355, 49–62. [Google Scholar] [CrossRef]


| LULC Classes | Forest | Water | Buildings | Grass | Roads |
|---|---|---|---|---|---|
| Number of training pixels | 7005 | 2771 | 5956 | 2445 | 3924 |
| Proportions (%) | 31.70 | 12.54 | 26.95 | 11.06 | 17.75 |
| Parameters for Figure 4a | Parameters for Figure 4b | |||||
|---|---|---|---|---|---|---|
| Class 1 | Class 2 | Class 3 | Class 1 | Class 2 | Class 3 | |
| Mean vector | ||||||
| Covariance matrix | ||||||
| A priori probability | 0.25 | 0.45 | 0.3 | 0.25 | 0.45 | 0.3 |
| Assigned Classes | Referenced Classes | ||||||
|---|---|---|---|---|---|---|---|
| Forest | Water | Buildings | Grass | Roads | Sum | User’s Accuracy (%) | |
| Forest | 6676 | 0 | 1 | 167 | 0 | 6844 | 97.55 |
| Water | 0 | 2763 | 1 | 0 | 0 | 2764 | 99.96 |
| Buildings | 2 | 3 | 4595 | 19 | 225 | 4844 | 94.86 |
| Grass | 327 | 0 | 28 | 2259 | 49 | 2663 | 84.83 |
| Roads | 0 | 5 | 1331 | 0 | 3650 | 4986 | 73.20 |
| Sum | 7005 | 2771 | 5956 | 2445 | 3824 | 22,101 | |
| Producer’s accuracy (%) | 95.30 | 99.71 | 77.15 | 92.39 | 93.02 | Overall accuracy 90.24 | |
| Forest | Water | Building | Grass | Roads | |
|---|---|---|---|---|---|
| Original classification | |||||
| No. of pixels | 965,039 | 163,544 | 927,127 | 701,231 | 860,663 |
| Areal percentage | 26.68 | 4.52 | 25.63 | 19.38 | 23.79 |
| Reclassification | |||||
| No. of pixels | 945,607 | 164,173 | 873,766 | 749,180 | 884,878 |
| Areal percentage | 26.14 | 4.54 | 24.15 | 20.71 | 24.46 |
| Areal Coverage difference (in km2) | 1.9432 | −0.0629 | 5.3361 | −4.7949 | −2.4215 |
© 2016 by the authors; licensee MDPI, Basel, Switzerland. This article is an open access article distributed under the terms and conditions of the Creative Commons Attribution (CC-BY) license (http://creativecommons.org/licenses/by/4.0/).
Share and Cite
Hsiao, L.-H.; Cheng, K.-S. Assessing Uncertainty in LULC Classification Accuracy by Using Bootstrap Resampling. Remote Sens. 2016, 8, 705. https://doi.org/10.3390/rs8090705
Hsiao L-H, Cheng K-S. Assessing Uncertainty in LULC Classification Accuracy by Using Bootstrap Resampling. Remote Sensing. 2016; 8(9):705. https://doi.org/10.3390/rs8090705
Chicago/Turabian StyleHsiao, Lin-Hsuan, and Ke-Sheng Cheng. 2016. "Assessing Uncertainty in LULC Classification Accuracy by Using Bootstrap Resampling" Remote Sensing 8, no. 9: 705. https://doi.org/10.3390/rs8090705
APA StyleHsiao, L.-H., & Cheng, K.-S. (2016). Assessing Uncertainty in LULC Classification Accuracy by Using Bootstrap Resampling. Remote Sensing, 8(9), 705. https://doi.org/10.3390/rs8090705