Abstract
In the present paper, a methodological scheme, bringing together common Acoustic Seabed Classification (ASC) systems and a powerful data decomposition approach, called Independent Component Analysis (ICA), is demonstrated regarding its suitability for detecting small targets in Side Scan Sonar imagery. Traditional ASC systems extract numerous texture descriptors, leading to a large feature vector, the dimensionality of which is reduced by means of data decomposition techniques, usually Principal Component Analysis (PCA), prior to classification. However, in the target detection issue, data decomposition should point towards finding components that represent sub-ordinary image information (i.e., small targets) rather than a dominant one. ICA has long been proved to be suitable for separating targets from a background, and this study represents a novel exhibition of its applicability to Side Scan Sonar (SSS) images. The present study attempts to build a fully automated target detection approach that combines image based feature extraction, ICA, and unsupervised classification. The suitability of the proposed approach has been demonstrated using an SSS data-set containing more than 70 manmade targets, most of them metallic, validated through a marine magnetic survey or ground truthing inspection. The method exhibited very good performance as it was able to detect more than 77% of the targets and it produced less than seven false alarms per km2. Moreover, it was compared to cases where, in the exact same methodological scheme, no decomposition technique is used, or PCA is employed instead of ICA, achieving the highest detection rate, but, more importantly, producing more than six times less false alarms, thus proving that ICA successfully manages to maximize target to background separation.
1. Introduction
In the field of Underwater Acoustic Imaging a large number of Automatic Target Detection (ATD) systems have long since been developed concerning image-based procedures [1,2,3,4] or other techniques [5]. The present study aims to test the potentiality of using common image based acoustic classification approaches against small targets detection in Side Scan Sonar (SSS) images by combining them with powerful data mining techniques. Small targets in this study are defined as ones that their extent and shape can barely be distinguished due to the system's resolution and setup. Those targets most often appear in the image scene as local ambiguous anomalies rather than as distinct objects. Common image based ASC start by extracting numerous features from sliding image windows throughout the image and forming large Feature Vectors (FVs) [6,7,8,9]. In view of the FVs’ high dimensionality, prior to unsupervised classification, a component analysis technique, typically Principal Component Analysis (PCA), is performed in most of the cases to decompose them into a few un-correlated features that explain the majority of the image’s variance. However, small targets belong to subordinary image information and do not contribute significantly to the total information variance of the SSS image. In this study, a well-established technique, called Independent Component Analysis (ICA) [10], which decomposes the FVs into independent sources, is tested against its ability to separate SSS images into targets and background and lead to accurate target classification.
The proposed methodological scheme consists of the following stages: (1) windowed feature extraction; (2) ICA decomposition; (3) selection of certain components that enhance potential targets through a maximum kurtosis criterion; (4) decision of the number of classes that the selected components need to be clustered into so that they are optimally separated in the Euclidean space through internal evaluation techniques and specifically cluster validation indexes utilization; (5) unsupervised classification; and (6) selection of the class or classes that most possibly correspond to areas containing potential targets via a minimum area definition. The above stages are implemented through the SonarClass Matlab software tool [11,12,13,14,15,16].
The classification performance of the proposed system is demonstrated using an SSS dataset from Alexandroupolis Harbor, N.E. Greece, including more than 70 manmade targets, most of them being metallic, all detected manually by expert interpreters through coupling SSS and Marine magnetometry data and most of them having been visually ground-truthed. The method exhibited promising results, achieving high detection accuracy rate with a few false positive detections. When in the exact same methodological scheme ICA was replaced by PCA or by no decomposition technique at all, the overall detection performance was severely degraded and the system’s complexity was increased as cluster validation indexes suggested that the FVs should be classified in more classes. Figure 1 illustrates an overview of the proposed methodological scheme while in Section 2 it is provided in detail.
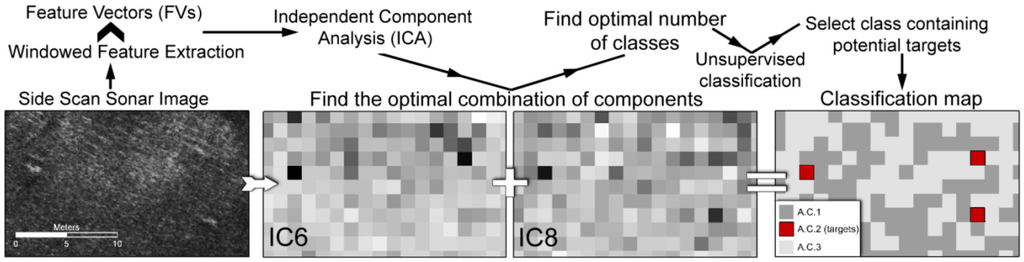
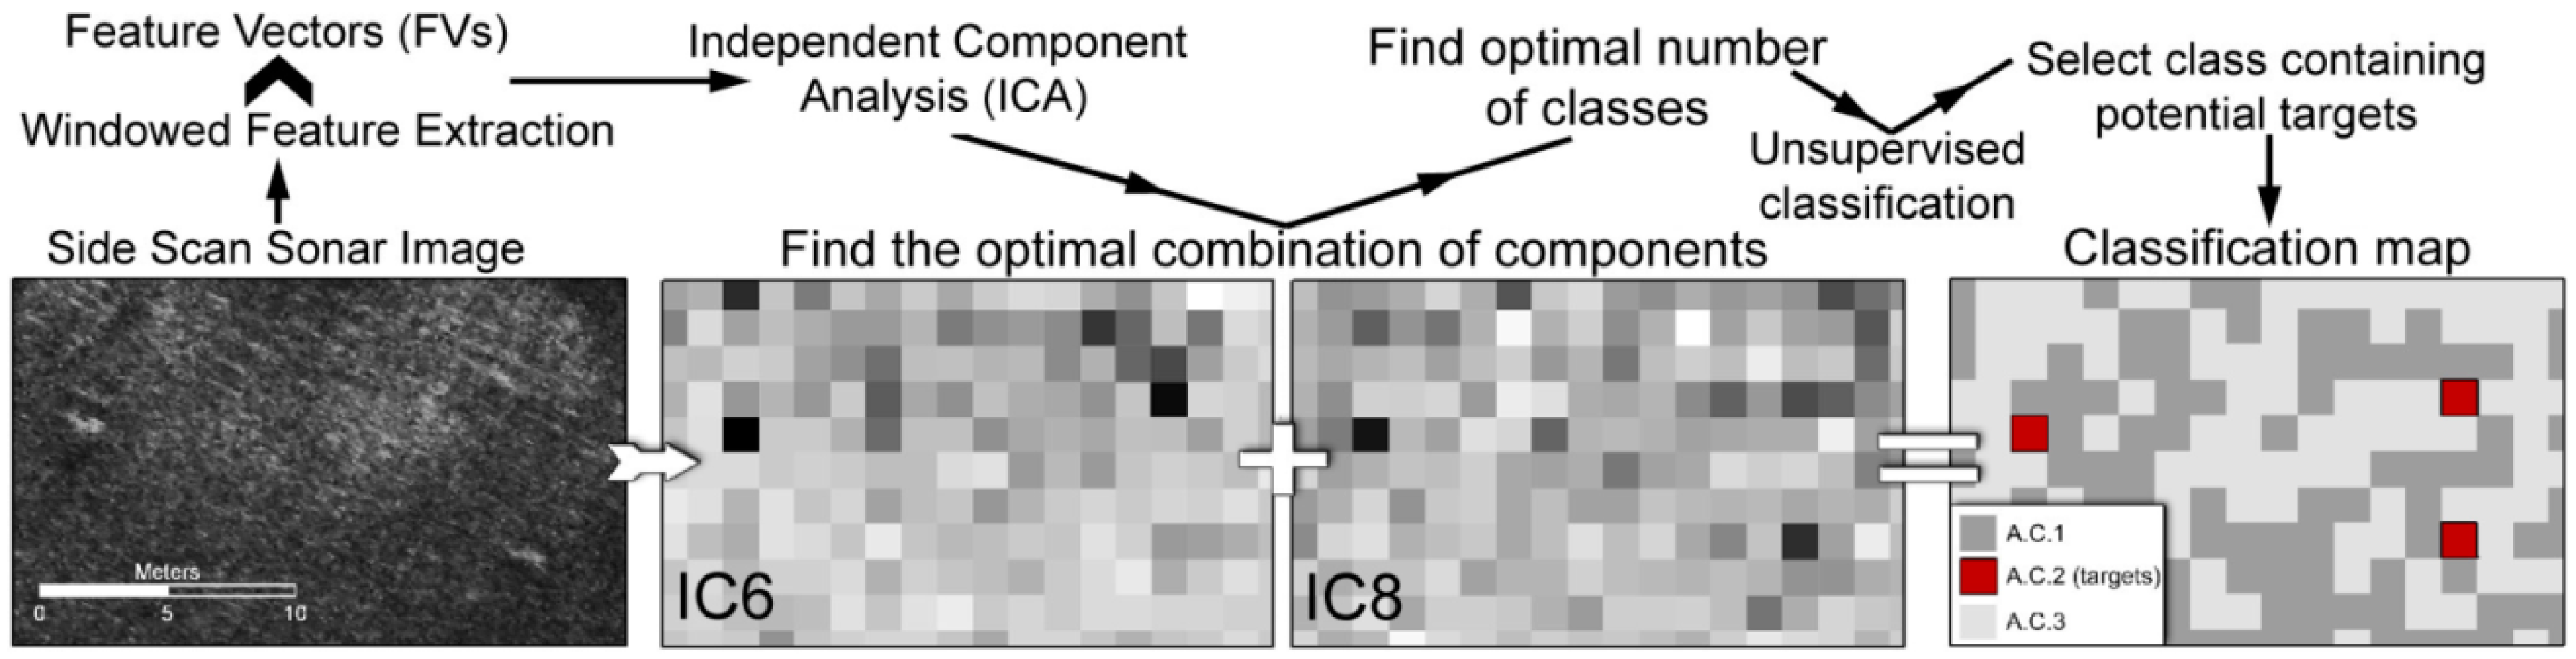
Figure 1.
Overview of the proposed methodological scheme for automatic target detection in Side Scan Sonar (SSS) imageries using feature based acoustic classification and Independent Component Analysis (ICA). IC6 and IC8 correspond to the 6th and 8th Independent Components of the Feature Vectors (FVs).
2. Methodology Overview
2.1. Feature Extraction
Feature extraction stage was realized through SonarClass [11,12,13,14,15,16] tool for Matlab [17], utilizing three feature extraction algorithms, namely first order grey-level statistics, Grey Level Co-occurrence Matrices (GLCMs) and 2D power spectrum specifications, leading to a total number of 11 texture descriptors (FVs). A brief description of these features is provided in the following paragraphs, but a more in depth description is given in [18].
The first order statistics provide information about the variability of grey-levels inside each image window and the following four features are considered: (1) Grey Mean; (2) Standard Deviation; and (3) Kurtosis which are elementary statistics that quantify reflectivity intensity, contrast and existence of outliers (tailedness of the grey levels distribution), respectively; and (4) the 3rd order Invariant Moment which is a measure based on central moments that is invariant to translation, rotation and scale changes of the image [19].
GLCMs are among the methodologies that have mostly been used for textural analysis and image classification. Statistics over GLCMs are very powerful texture descriptors and are used in many software applications for swath sonar image classification [6,8]. SonarClass software extracts five GLCM properties out of the 11 that Haralick [20] first described namely: (1) Contrast; (2) Correlation; (3) Energy; (4) Entropy and (5) Homogeneity, using an offset of 1 pixel and 4 look directions (average results of four directions), as described in Reference [11].
The 2D Fourier spectrum descriptives are (1) Directionality and (2) Texture Spacing. They are based on Bajcsy and Lieberman [21] approach according to which the power spectrum of a square image is expressed in a polar coordinate system (S(r,θ)) of radius r versus angle θ and decompressed into two independent one-dimensional functions of r (Sr(θ)) and θ (Sθ(r) ). Peaks in the Sr(θ) indicate directional texture while peaks in the Sθ(r) mean periodical texture. Analyzing Sr(θ) and Sθ(r) for a fixed value of r and θ yields the behavior of the spectrum along a circle centered on its origin or a cross section passing through its origin. High “Directionality” values imply directionally regulated textures while high “Texture Spacing” values periodical ones. Fakiris and Papatheodorou [11] suggested a simplified computational approach for Bajcsy and Lieberman descriptors for the needs of SonarClass.
In the case of the proposed methodological scheme where the detection of potential targets in SSS images is considered, image windows should have dimensions at least 1.5 times the maximum expected ones of the targets to be detected. They should also be sliding, with an overlap half the size of the image window, to ensure that any target will be included in just a single image window.
2.2. Component Analysis Towards Maximizing Targets' Separation. ICA vs. PCA
The purpose of using a component analysis technique in the context of target extraction, is to transform the FVs into a few meaningful components that maximize the difference between the targets and the background. PCA is a commonly used feature reduction method in image based ASCs [8]. It decomposes the NxM FVs (with N indicating number of features and M number of image window samples) in N linearly uncorrelated components so that the majority of the features’ information can be projected into a few of them and reduces data quantity. However, small targets might not show up from the surrounding background of the highest variance after conventional PCA, as they belong to sub ordinary image information. A probable solution would be to find which principal component or combination of components (out of the 11 available ones in our study) correspond to the contribution of the targets to the FVs’ variance. Normally those principal components would be among the ones contributing in the smallest amount to the total variance of the feature space.
However, research on hyperspectral imagery suggests that gaussianity, as assumed in PCA, is not the case in target extraction and small targets in a natural background can be seen as independent anomalies [10,22,23]. The same statement can be extended to marine remote sensing data, as for instance in SSS sonographs. A more sophisticated multivariate data analysis method, seeking for independent rather than uncorrelated components of the data, also described as project pursuit or blind source separation, is ICA. ICA assumes that the observed multivariate data are linear or non-linear mixtures of some unknown non-Gaussian and mutually independent latent variables, called independent components, which are attempted to be determined. ICA decomposes the NxM FVs into N independent sources and can be seen as an extension of PCA and Factor Analysis (FA).
The main difference between PCA and ICA is that PCA is seeking for orthogonal projections that best explain (maximize) the variance of the data, while ICA for random projections that maximize higher order statistical criteria, such as absolute normalized kurtosis, a 4th order statistic, yielding non Gaussianity. More generally, PCA is finding the direction of space (basis vector) with the highest sample variance, moving on to finding the next highest variance in an orthogonal subspace of the first direction, and iterates until discovering all N ordered orthogonal basis vectors of the data. The analytic solution to finding those basis vectors is the eigenvectors of the data’s covariance matrix. PCA is suitable for data describing normal (Gaussian) processes, as their covariance is indeed diagonal in an orthogonal basis. An advantage of PCA is that the resulting vectors come with a “PCA score”, i.e., the variance of the data projected along the direction they define. In ASC literature, after using PCA for dimension reduction, the subspace defined by the first three PCA vectors with the highest scores is chosen, on the basis that they usually explain the largest possible fraction of the total variance.
However for strongly non-Gaussian mixing sources (processes), separating them should be done by looking at fine details of the data distribution, such as its tails, rather than just their variance. In the case where data anomalies (outliers) are of interest, such as targets in a smoothly varying background, those tails are that contain the majority of the information needed. ICA makes a convenient simplification that finding the independent sources out of such data can be reduced to finding maximally non-Gaussian ones. The projections maximizing nongaussianity of data is pursued in an optimization manner by trying to maximize kurtosys or other higher order statistical criteria. The first basis vector is changed until data shape a least-Gaussian PDF, the data explained by this vector are subtracted from the initial signal and this sequence iterates until all basis vectors have been found. In the context of the present study, the widely used FastICA implementation for Matlab [24] has been employed. Evidence on FastICA efficiency and computational complexity can be found in Reference [25].
Conclusively, although both PCA and ICA aim to linearly decompose the original data into a set of meaningful, mutually independent, underlying processes, it is the definition of independency and the way that it is pursued that makes ICA more appealing for separating targets from the image background. Firstly ICA is unhooked from pursuing orthogonal projections and secondly it is using optimization criteria that maximize non-Gaussianity rather than just covariance. Targets’ information is inherently highly non-Gaussian as they are outliers and an ideal component highlighting only them and flattening the background would have heavy tails, deviating severely from the normal distribution.
No matter which data decomposition technique is used, there still is the problem of automatically defining the components that most likely reflect the targets’ contribution to the FVs. A common practice to determine the optimal components for target detection is to rank them according to their kurtosis and use the ones with the highest values [23]. As mentioned above, Kurtosis, considered an outlier indicator (related to the tailedness of the distribution), should be much higher for components that emphasize small targets than for components reflecting larger scale seafloor characteristics (e.g., seafloor dynamics, morphology or sedimentology) or systematic ambient and self noises (e.g., caused by the sea column stratification or SSS platform movements).
2.3. Unsupervised Classification
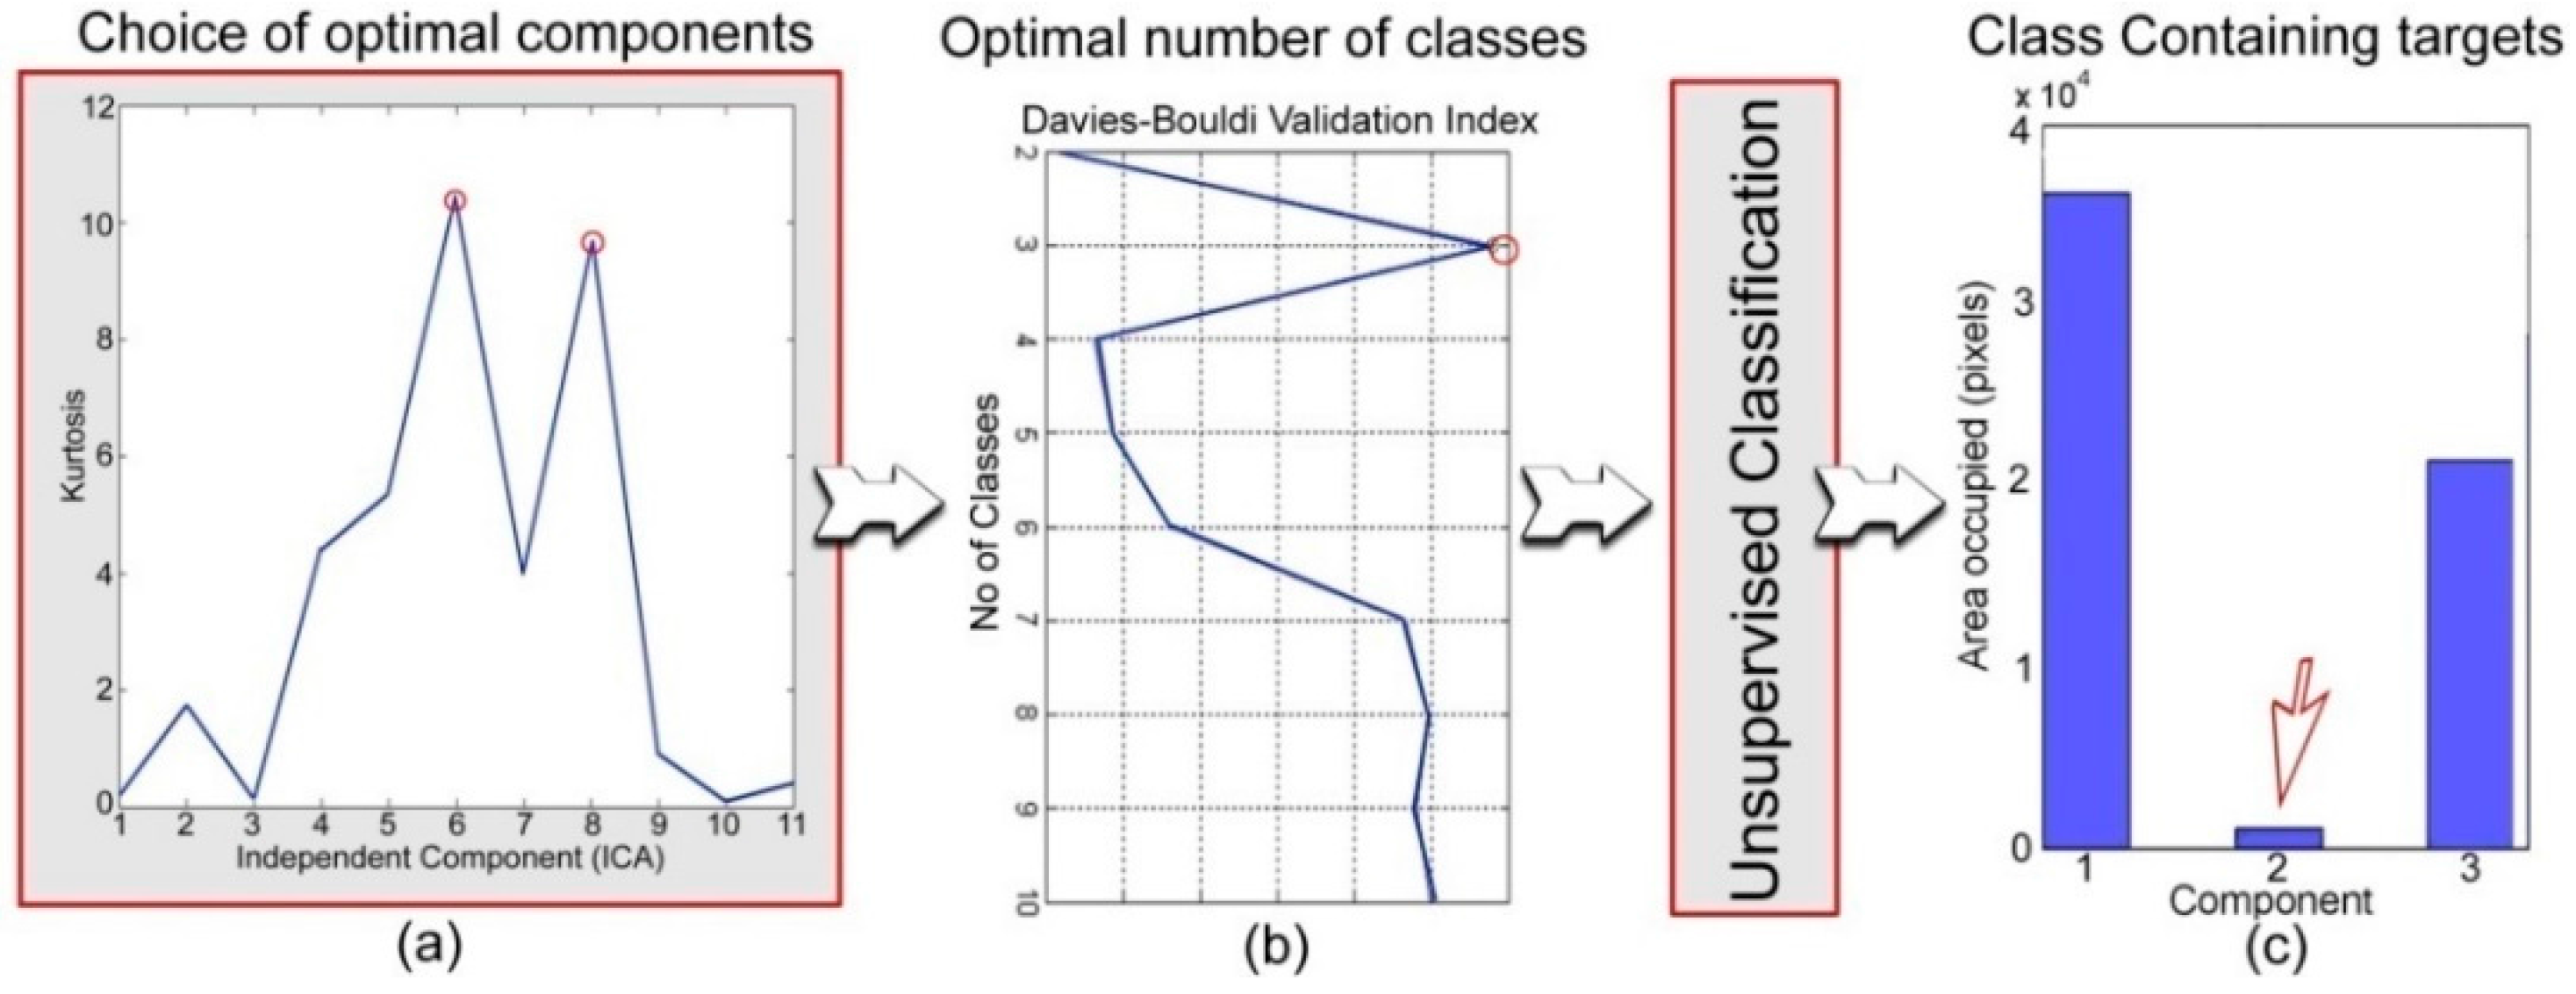
After the components that highlight targets have been determined, unsupervised classification (clustering) is performed to them so that the reduced feature space is partitioned in meaningful clusters. Although simple thresholding techniques could be able to detect the targets in the reduced feature space, using unsupervised classification is more robust (assuming that targets are well represented), especially when more than one component has been selected. After ICA, generating just a few clusters should be enough to ensure that at least one of them will correspond to areas that include potential targets. SonarClass image based ASC software provides a large list of available unsupervised classification algorithms, including Gaussian Mixture Models, k-means, k-medoids, Fuzzy C-means, Fuzzy Gustafson-Kessel and Fuzzy Gath-Geva classifiers. Gaussian mixture models (distribution-based algorithm) and k-means (centroid-based algorithm) classifiers are the ones more often used is image based ASCs [3,8] owing to that the former uses the Expectation Maximization (EM) algorithm that allows the calculation of posterior probabilities for each class and the latter is the least computationally expensive one. A main drawback of most centroid and distribution based clustering algorithms is that the number of classes must be a priori determined manually or through some criterion optimization techniques. The use of cluster validation indexes that quantify the discrimination of the specified data clusters in the Euclidean space is a common practice among statisticians towards determining the optimal number of classes. Specifically, the FVs are repetitively clustered (using a certain classifier) by sequentially increasing the number of clusters, the validation index is estimated for each attempt and finally the number of clusters providing the maximum discrimination between them is determined (see Figure 2). Although many cluster validation indexes are available in SonarClass software, the Davies-Bouldin index is proposed due to its computational speed and efficiency [26].

Figure 2.
Details of the proposed automatic target detection system concerning: (a) choosing the optimal combination of components; (b) choosing the optimal number of classes and (c) selecting the class that most probably corresponds to seafloor targets.
After the FVs have been clustered into the specified number of classes, the question is which class or classes refer to image windows containing potential targets. An obvious solution would be to visualize their spatial distribution in conjunction to the SSS imagery and manually judge which ones do correspond to image windows with targets, but this does not conform to the aspect of completely automated detection of potential targets. Tian [3] performed hierarchical analysis to the posterior probabilities of the generated classes in order to detect the most uncorrelated ones and associate them to SSS targets (coral reefs in that case). The proposed methodology in the present study does no restriction about exclusively using Bayesian classifiers and, thus, the above approach is not always feasible. Instead, the following approach is proposed as an alternative: the class occupying the least area (smallest number of raster cells) in the sonar images can be safely considered as the one representing potential targets (Figure 2).
3. Method Validation
3.1. Case Study, Data Acquisition and Pre-Processing
The dataset used for the validation of the proposed methodological scheme was collected in 2008 from the Alexandroupolis Harbor, NE Greece (Figure 3), where a marine geophysical survey utilizing an EG&G model 272-TD [27] sidescan sonar and a SeaSpy [28] Marine Magnetometer and intended to detect all objects on the seafloor that could be hazardous during a dredging procedure, was conducted. The sidescan sonar survey consisted of 10 survey lines with a total length of 13.2 km, while the marine magnetic survey consisted of 104 ones having a total length of 106 km, both covering a total surface of 0.73 km2. The height of the SSS towfish about the seabed was approximately 7 m and the pulse frequency and slant range were set to 100 kHz and 100 m respectively. The spacing between survey lines was 75 m, ensuring a 25 m wide overlapping strip between parallel tracks. The above set-up is not considered optimal for target detection surveys, where higher frequency systems, lower heights of the towfish about the seabed and closer proximity of sequential survey lines are preferred, in order to achieve maximum target to background contrast levels, well developed acoustic shadows and larger (preferably >100%) overlapping areas to ensure that all targets have been recorded at least twice through different views and incidence angles.
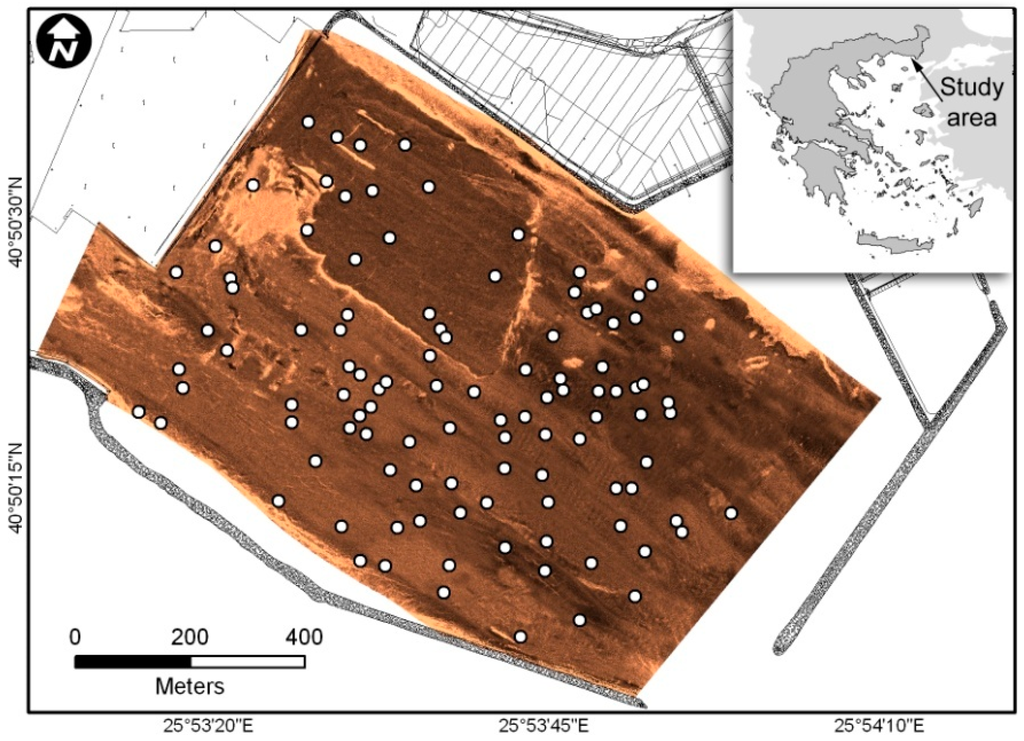
Figure 3.
Map showing the Alexandoupolis Harbor, NE Greece, and the mosaic of the SSS imagery that has been used for the validation of the proposed automatic target detection system. The 71 small man made targets that have been manually detected are indicated with white circles.
The raw SSS records underwent suitable radiometric and geometric corrections, the former ones including beam-pattern correction and ping energy level normalization while the latter onesslant range correction and ping by ping spatial registration, leading to 10 georeferenced images (one for each survey line, in GeoTiff format) each having 6 × 6 cm pixel sizing. Figure 3 illustrates the final seafloor backscatter map after a mosaicking stage of the SSS images took place. The marine magnetic data underwent advance processing [29] including deculturing, despiking, spline smoothing and tie-line leveling, to finally produce a fully corrected magnetic map of the area.
Combining SSS and Marine magnetic data offered means of cross-checking all metallic targets lying on the seafloor (Figure 4). Buried metallic targets have also been detected but no reference needs to be made to them in the context of the present study. Proud targets were manually detected by expert interpreters on the basis of their backscatter intensity and shape, as well as their magnetic responses (small scale magnetic anomalies). A total number of 71 small (<1.5 m) proud targets have been detected in the survey area (Figure 3), all of them being clearly discrete in the SSS imagery. A large proportion of them were metallic, having a strong magnetic signature (magnetic dipole) and leading the interpreters to the safe assumption that they are man-made ones. Non-magnetic targets have been ground truthed by divers and their human origination was also validated.
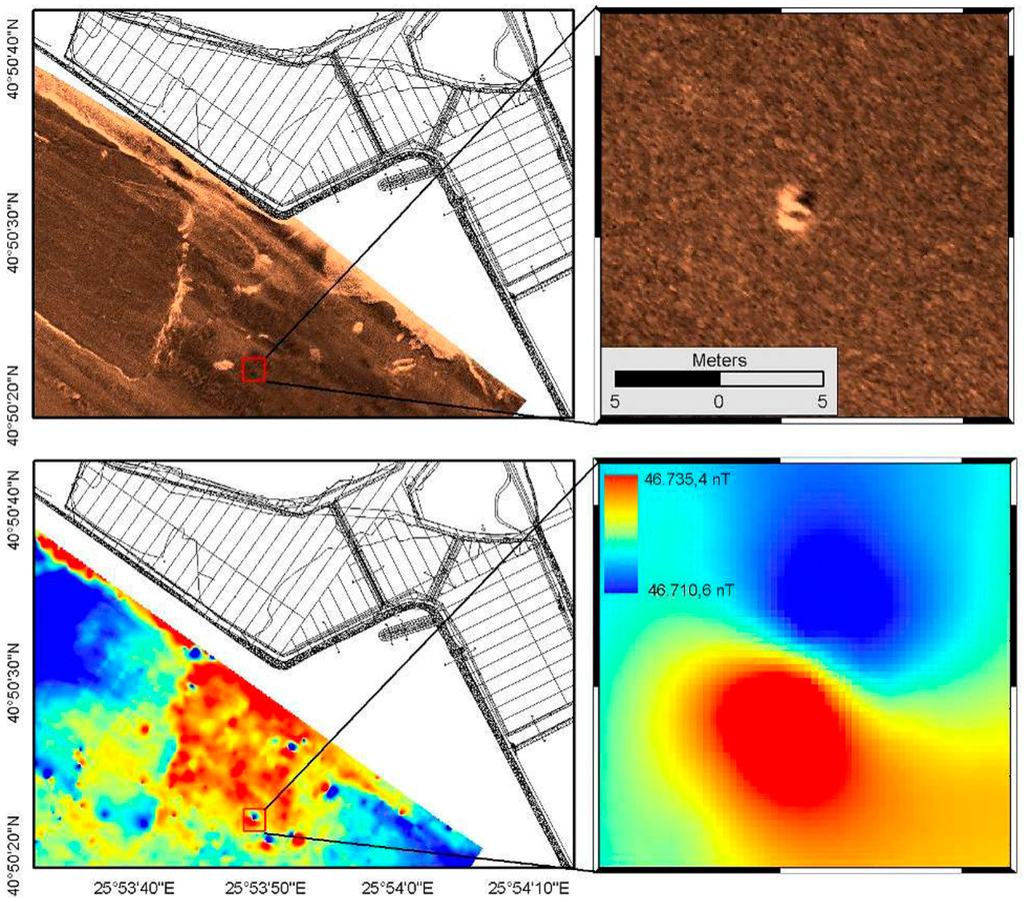
Figure 4.
Example of manual target detection of manmade proud targets through SSS and marine magnetic data interpretation.
3.2. Automatic Target Detection: Target Detection Models
The promise of the proposed system is sought not only through its target detection accuracy but also regarding whether or not improvement is gained against similar procedures not utilizing ICA or component analyses at all. In view of the above, three more target detection methodological schemes, now on called “models”, all being modifications of the proposed model, are validated and compared to it.
The feature extraction stage is the same for all models, during which the 11 first and second order image descriptive are extracted from sliding windows throughout the sonar images, forming the FVs. Another common stage in all models is the Davies-Bouldin validation index utilization towards automatic selection of the number of classes the feature space should be optimally clustered into and Gaussian mixture models utilization. All models, except for the first one, involves component analysis prior to the clustering procedure; PCA in the Models 2 and 3 and ICA in the Model 4. The exact components to be used are automatically selected through the kurtosis criterion in Models 3 and 4, while, in Model 2, the first three principal components (explaining the most of the FVs variance) are chosen, following the most common practice about principal components met in the ASC literature. The main characteristics of the models are summarized in Table 1. The concept behind those models is that:
- Model 1 is the base for comparisons as it uses all the available information extracted without any decomposition or interfering between feature extraction and clustering stages;
- Model 2 represents a common practice met in the literature of texture based ASC [8] and it is intriguing to exploit how well it performs in the case of separating small targets from the environment in an unsupervised way;
- Model 3 includes all the proposed stages described in this work but utilizing PCA for decomposing the FVs in a few meaningful data representations. That are chosen through the Kurtosis criterion.
- Model 4 is the proposed one, making use of all stages described in the context of this work and ICA consideration.

Table 1.
Details and detection accuracy statistics regarding the 4 automatic target detection models considered here, as applied to the case study of Alexandroupolis Harbor. The 4th model corresponds to the proposed approach in this study.
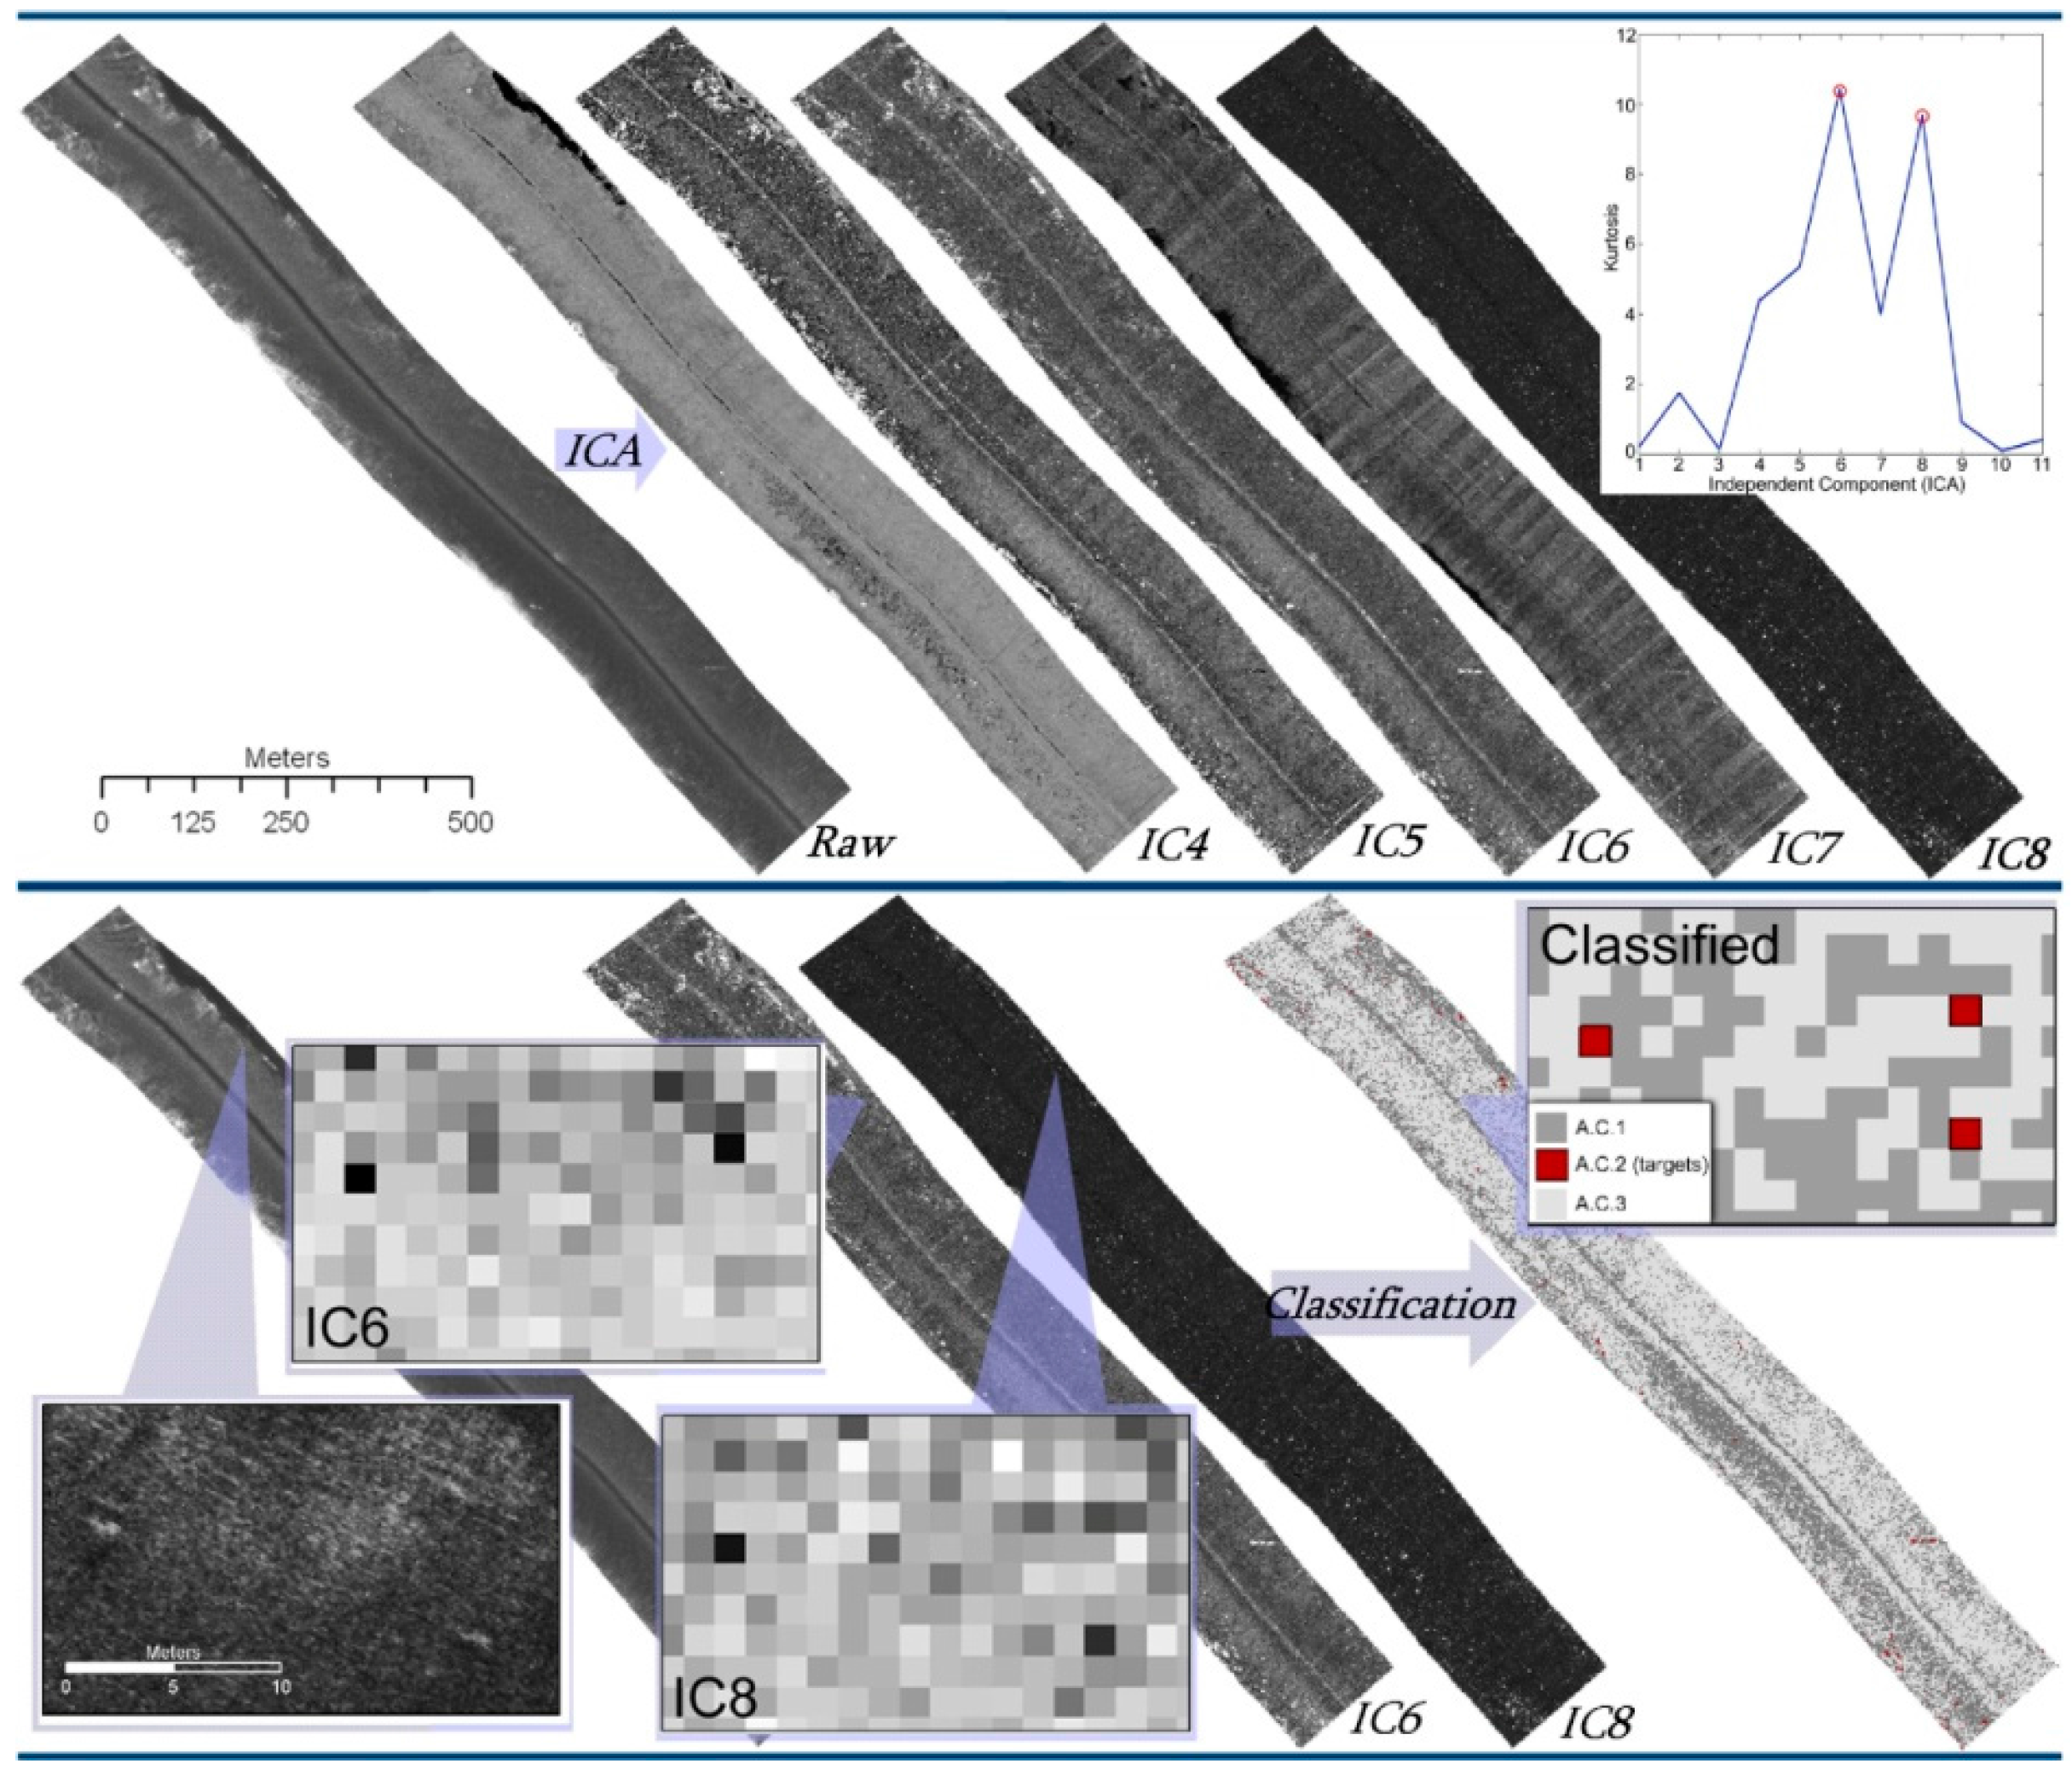
The feature extraction stage in all models took place for each individual SSS record and before any stitching (mosaicking) has been applied. This is to ensure that any target recorded twice in overlapping records will have double possibility to be detected. Bottom ranges with incidence angles (under the implicit flat seabed assumption) less than 15° or more than 80° have been excluded from the analysis to avoid areas where high rates of artifacts (e.g., in the nadir zone and at the far slant ranges) is present. The size of the sliding window, which textural features were extracted from, has been set to 3 m (50 × 50 pixels) and the slide step (windows overlap) to 1.5 m (25 × 25 pixels). An illustration of the 4th model (proposed one) as applied in the context of the present case study is given in Figure 5.

Figure 5.
Illustration of the SSS image decomposition, component selection and clustering stages, as applied in a single sonograph of the case study.
3.3. Detection Accuracy Metrics and Results
The detection accuracy for each model considered was assessed in the context of the number of its true positive (tp), false positive (fp) (else false alarms) and false negative (fn) detections, using the following, widely used in binary classification, metrics:
- Precision, else termed Positive Predictive Values (PPV), is given as tp/(tp + fp). Values close to one indicate that the detector managed to detect most ground truthed targets, making no mention about the ones that it did not manage to detect.
- Recall, also called sensitivity, Possibility Of Detection (POD) or Hit Rate, is defined as tp/(tp + fn). It quantifies the ability of the system to detect all existent targets in the dataset, independently on how many false detection it has made.
- F-Measure combines the above metrics in a more robust one taking in account the overall performance of a detector. It is defines as 2 × (Precision × Recall/(Prediction + Recall)) and it gives means of a robust evaluation for each model.
- False Alarms/km2 is the number of false alarms (positives) per area unit (set to 1 km2).
To simplify accuracy metrics calculation, no special treatment has been made to multiple detection instances of the same target in overlaping records, i.e., two detection instances of the same target in overlapping SSS records were considered as two different targets. This way, the accuracy metrics should be interpreted as indicators about the overall models’ efficiency, not accounting for any performance gain that fusion of results from multi-aspect target views would offer. This way, False Alarms/km2 for instance were not estimated using the true insonified area but rather the sum of the areas of all individual swaths, ignoring if they have overlaps or not.
The accuracy results for the four models considered are given in Table 1. It is proved that the proposed methodological scheme (Model 4) outperformed the others considering all detection accuracy metrics. An additional interesting finding is that by using component analysis methods, the targets’ information is concentrated in just a couple of components that need no more than three to four classes to be optimally separated in the Euclidean space through clustering. On the other hand, using PCA with the common handle about principal components (i.e., using just the first three ones that contain the majority of the image information) performed even worse than using no decomposition at all. The above confirms that targets, being sub ordinary image information, cannot be captured in the first few principal components that describe prevailing mechanisms that control the image scene and not randomly induced seabed features, but they are rather included in one or more of the last ones. Model 3, concerning PCA utilization (instead of ICA) and component selection, gave better overall results than Models 1 and 2, indicating that appropriate component selection is essential for successful target detection.
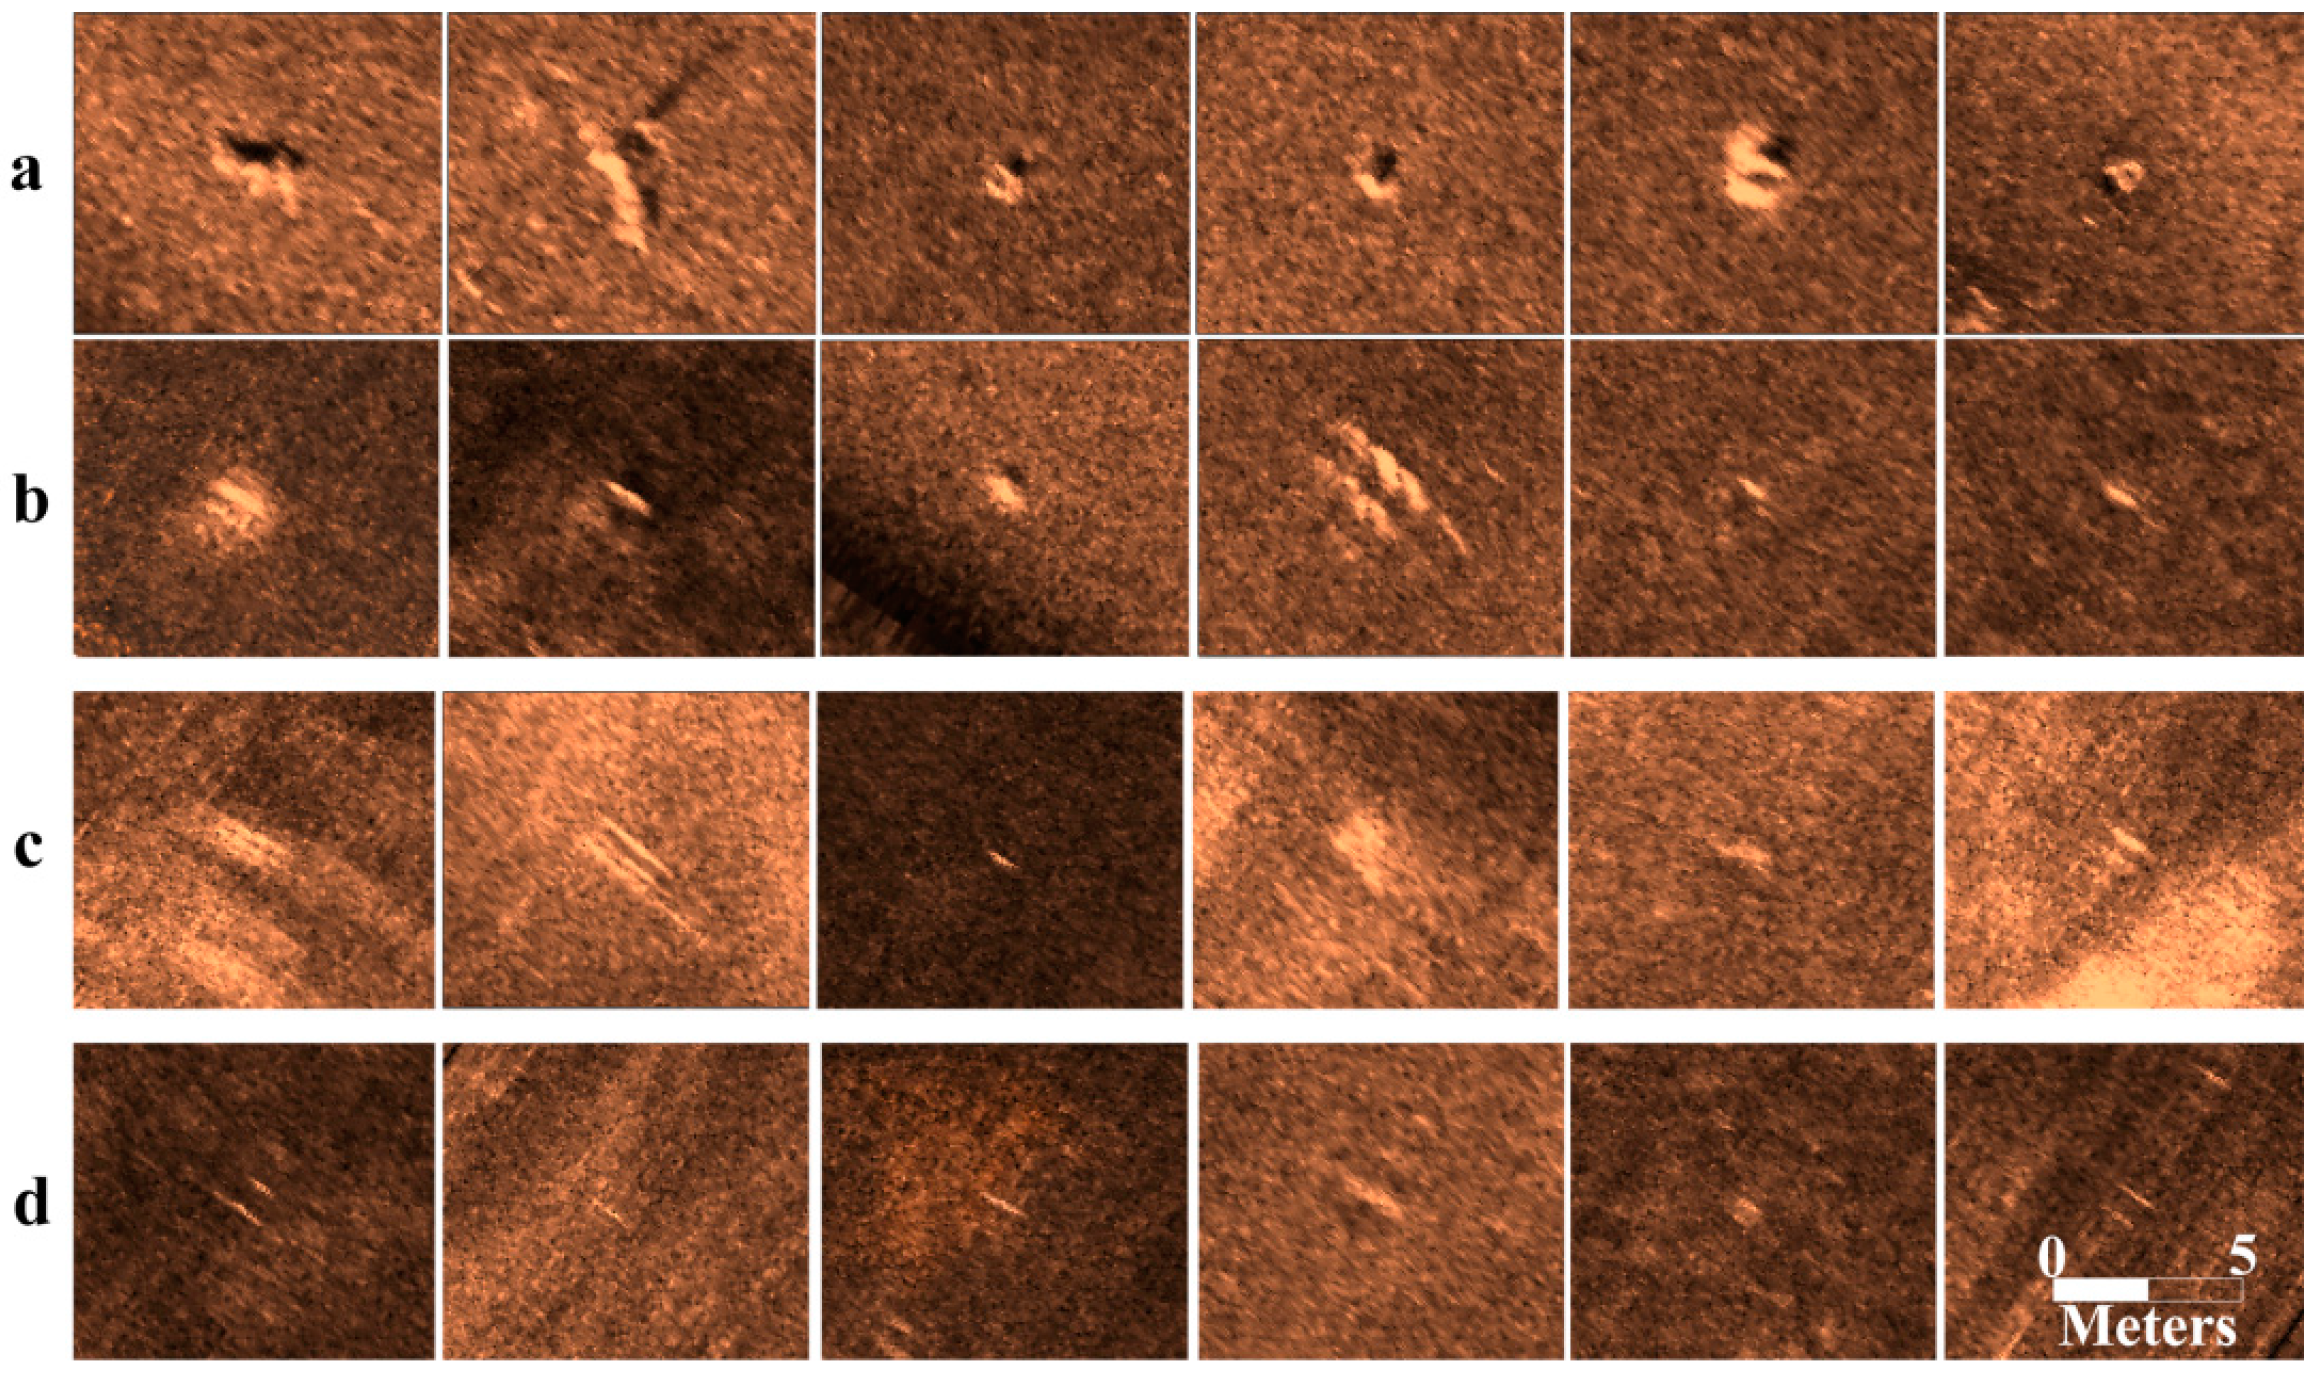
Figure 6 shows examples of true positive detections that have been made by each model. Typical targets, posing clear shapes and shadows, have been detected by all models and some examples are provided in Figure 6a. Figure 6b–d regard some less typical targets, having preserved no clear shape or shadow details due to radiometric and geometric distortions caused by ambient and self noises. Some of them, being metallic (strong acoustic reflectors) and recorded at far slant ranges (high incidence angles), were distorted by acoustic “ringing”, seen as multiples parallel to the survey track-lines, induced by the sea-level. Figure 6b regards targets that have been detected by all models as they are clearly separated from a relatively uniform background. Detection of very small targets on a uniform background or average sized ones lying on a background with higher backscatter variability was only feasible through the models concerning component analysis coupled with component selection (Figure 6c). Very small targets (<1 m) on a rougher background and targets not well separated from the background have exclusively been detected by the proposed model (4th) that makes use of ICA (Figure 6d), signifying its suitability for target extraction applications even under non-favorable conditions.

Figure 6.
Examples of true positive detections that have been made by: (a,b) all models; (c) Models 3 and 4 employing component analysis and component selection and (d) exclusively Model 4, which applies the proposed method using ICA.
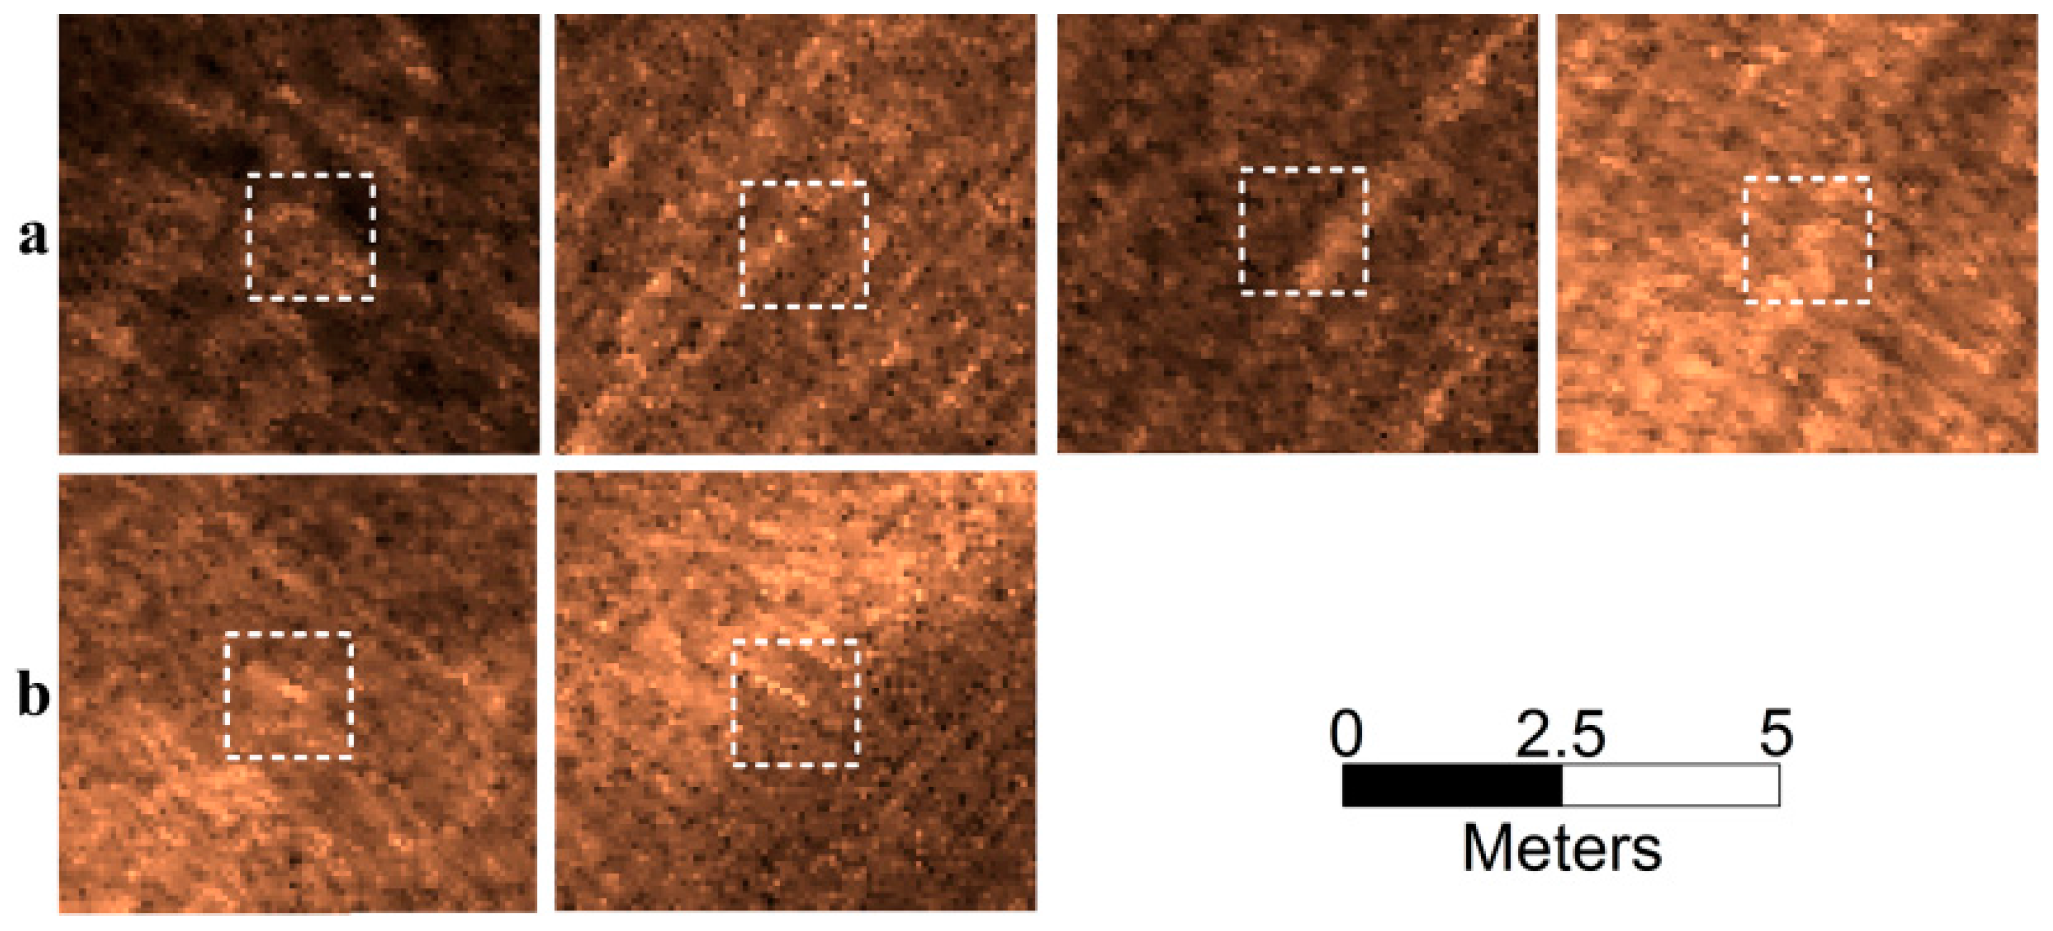
At the same time, Model 4 showed even higher superiority in minimizing false alarms. This is evident through the high precision values it provided but mainly through the False Alarms/km2 metric that is 7 to 10 times lower than that of the other models. Regarding Model 3, even though its recall is quite high, signifying that most of the ground truthed targets have been detected, its precision is low, which means that a lot of false detections have been made. This is due to the high amount of image ambient or self noise that has been misclassified as targets (false alarms) through PCA utilization. Examples of such false alarms are presented in Figure 7a, along with their corresponding image windows that the FVs have been extracted from. On the other hand, Figure 7b regards characteristic false alarms generated by Model 4 (employing ICA). Those, in some cases regard minor but still distinct seabed anomalies, that might be targeted that had been missed or evaluated as very low significance, during the manual detection stage.

Figure 7.
Examples of false positive detections (false alarms) regarding: (a) Model 3 and (b) Model 4.
4. Discussion
A common problem in analyzing measurements in the natural environment is searching for suitable representations of the multivariate data. Towards this, linear decomposition methods become natural choice due to their computational and implementational simplicity. PCA is an established method for reducing large datasets, and earth scientists often tend to use it without realizing its limitations. When subordinal phenomena are sough through measurements, PCA seems not to be the ideal decomposition method, as it is inherently designed to identifying components that include the dominant information of the environment, rather than separating irregular or subordinal elements from their natural background. Manmade targets are small-scale anomalies that usually represent a negligible portion of the overall scene that is under analysis. Being different, not only from the background, but also from each other, they cannot be all included just in one or in a few uncorrelated components. Small man made targets in an image scene of the natural environment are by definition artificially introduced anomalies. Thus, they represent absolutely separate in-natural processes; inducing random features in the environment, and this separation is reflected in their statistical independence.
In the present study that small man made targets were sought in the natural seafloor through sonar images, target detection methods based on the assumption of gaussianity (i.e., PCA) were quite unsuccessful. ICA, making no assumption of gaussianity and maximizing independencies in the natural background seemed to be a very capable tool about reducing the sonar information in just a few components that contain the most subordinal (and not the most prevailing) information of the image scene.
Even though PCA utilization (instead of ICA) in the context of the present study, gave a high rate of true positive detections, the false positives were also unacceptably high. This is because PCA was unable to separate noise from other irregularities, as they were all the least uncorrelated features of the image (they explained a very small proportion of the image variance), and they were dropped all together in the last few principal components. However, although small irregular targets are not the most uncorrelated features on the SSS imagery (ambient noise should be equally or more uncorrelated), they are the most independent ones. While ambient noise is usually governed by some natural mechanisms, creating correlated features in the scene, small targets are introduced to the background in a truly independent way, without any mechanism to control their characteristics.
Not conforming to common target detection survey setups (i.e., higher frequency SSS systems, closer proximity to the seabed and >100% overlapping between sequential records) the SSS dataset of the selected case study made automatic small target detection a very challenging task. Under the present SSS survey set-up (intended for low resolution–high coverage surveying), the shapes of very small targets are often severely distorted, their appearance is vague and target shadows rarely are extended enough to be reliable indicators of the targets’ existence and shape. Thus, seeking for random irregularities in the image scene, as by utilizing ICA, rather than trying to quantify target characteristics, seems much more realistic and appealing when dealing with data retrieved from more general-purpose surveys.
5. Conclusions
In this paper, an attempt to detect targets in Side Scan Sonar (SSS) imagery by coupling traditional feature based Acoustic Seabed Classification (ASC) systems and Independent Component Analysis (ICA) has been presented and validated for one dataset concerning a harbor floor containing more than 70 validated manmade small targets. The core of the implemented system combines texture based unsupervised classification and a well-validated approach in anomaly detection and blind source separation studies, called ICA. ICA is a powerful data decomposition technique able to separate the image information into anomalies (i.e., targets) and background. An efficient technique based on the kurtosis of the independent components is utilized so that only those independent components that emphasize targets are used, leading to more accurate and unbiased classification results. The validation of the proposed approach was conducted on the basis of comparing its effectiveness to automatically detect the ground truthed targets against using PCA or no decomposition method instead. Although coupling PCA with the same component selection criterion has also proved to be an acceptable approach, detecting more than 71% of the targets (against more than 77% in the case of ICA), the superiority of utilizing ICA is evident through managing to reduce false alarms by more than 6 times. Despite methodological and computational improvements that the presented method may need, it represents a considerable demonstration of using ICA towards finding meaningful representations of the swath images that could be the basis for similar future work in the fields of target detection and habitat mapping. Future improvement to this work should regard performance assessment, algorithm optimization, extensive validation using different datasets and comparison to other available target detection algorithms for swath sonars.
Acknowledgments
We would like to thank Dimitris Christodoulou for his important contribution in field work and data processing during the marine remote sensing survey project at Alexandroupolis Harbor, in 2008.
Author Contributions
All authors have contributed equally in this work.
Conflicts of Interest
The authors declare no conflict of interest.
References
- Groen, J.; Coiras, E.; Williams, D. Detection rate statistics in synthetic aperture sonar images. In Proceedings of the 3rd International Conference and Exhibition on Underwater Acoustic Measurements, Nafplion, Greece, 21–26 June 2009.
- Petillot, Y.; Pailhas, Y.; Capus, C.; Sawas, J.; Valerie, N.; Bell, J. Target recognition in synthetic aperture and high resolution side-scan sonar. In Proceedings of the European Conference on Underwater Acoustics, ECUA 2010, Istanbul, Turkey, 21 November 2006.
- Tian, W.M. Automatic target detection and analyses in side scan sonar imagery. In Proceedings of the Global Congress on Intelligent Systems, IEEE Computer Society, Washington, DC, USA, 19–21 May 2009.
- Williams, D.P.; Fakiris, E. Exploiting environmental information for improved underwater target classification in sonar imagery. IEEE Trans. Geosci. Remote Sens. 2013, 52, 6284–6297. [Google Scholar] [CrossRef]
- Eldar, Y.C.; Kutyniok, G. Compressed Sensing: Theory and Applications; Cambridge University Press: Cambridge, UK, 2012. [Google Scholar]
- Blondel, P.; Gómez Sichi, O. Textural analyses of multibeam sonar imagery from Stanton Banks, Northern Ireland continental shelf. Appl. Acoust. 2009, 70, 1288–1297. [Google Scholar] [CrossRef]
- McGonigle, C.; Brown, C.; Quinn, R.; Grabowski, J. Evaluation of image-based multibeam sonar backscatter classification for benthic habitat discrimination and mapping at Stanton Banks, UK. Estuar. Coast. Shelf Sci. 2009, 81, 423–437. [Google Scholar] [CrossRef]
- Preston, J. Automated acoustic Seabed Classification of multibeam images of Stanton Banks. Appl. Acoust. 2008, 70, 1277–1287. [Google Scholar] [CrossRef]
- Fawcett, J.; Myers, V.; Hopkin, D.; Crawford, A.; Couillard, M.; Zerr, B. Multiaspect classification of sidescan sonar images: Four different approaches to fusing single-aspect information. IEEE J. Ocean. Eng. 2010, 35, 863–876. [Google Scholar] [CrossRef]
- Robila, S.A.; Varshney, P.K. Target detection in hyperspectral images based on Independent Component Analysis. Proc. SPIE Automat. Target Recog. 2002, 4726, 173–182. [Google Scholar]
- Fakiris, E.; Papatheodorou, G. Calibration of textural analysis parameters towards a valid side-scan sonar imagery classification. In Proceedings of the 2nd International Conference and Exhibition on Underwater Acoustic Measurements, Crete, Greece, 21–26 June 2007.
- Fakiris, E.; Papatheodorou, G. Sonar Class: A MATLAB toolbox for the classification of side scan sonar imagery, using local textural and reverberational characteristics. In Proceedings of the 3rd International Conference and Exhibition on Underwater Acoustic Measurements, Nafplion, Greece, 21–26 June 2009.
- Papatheodorou, G.; Avramidis, P.; Fakiris, E.; Christodoulou, D.; Kontopoulos, N. Bed diversity in the shallow water environment of Pappas lagoon in Greece. Int. J. Sediment Res. 2012, 27, 1–17. [Google Scholar] [CrossRef]
- Fakiris, E.; Rzhanov, Y.; Zoura, D. On importance of acoustic backscatter corrections for texture-based seafloor characterization. In Proceedings of the 11th European Conference on Underwater Acoustics, ECUA 2012, Edinburgh, UK, 2–6 July 2012.
- Geraga, M.; Papatheodorou, G.; Ferentinos, G.; Fakiris, E.; Christodoulou, D. The study of an ancient shipwreck using marine remote sensing techniques, in Kefalonia Island (Ionian Sea), Greece. Archaeol. Mariti. Mediterr. 2015, 12, 183–200. [Google Scholar]
- Porpilho, D.; Klein, A.H.F.; de Camargo, R.S.V.; Prado, M.F.V.; Bonetti, J.; Short, A.; Fakiris, E. Automatic classification of bedforms using phase differencing bathymetric sonar. In Proceedings of the 2nd International Conference and Exhibition on Underwater Acoustics, Rhodes, Greece, 22–27 June 2014.
- Mathworks. Available online: http://www.mathworks.com/ (accessed on 21 January 2016).
- Fakiris, E.; Papatheodorou, G. Quantification of regions of interest in swath sonar backscatter images using grey-level and shape geometry descriptors: The TargAn software. Mar. Geophys. Res. 2012, 33, 169–183. [Google Scholar] [CrossRef]
- Pratt, W.K. Digital Image Profiguecessing, 4th ed.; University of Southern California; John Wiley & Sons: Los Angeles, CA, USA, 2007; p. 500. [Google Scholar]
- Haralick, R.M. Statistical and structural approaches to texture. Proc. IEEE 1979, 67, 786–804. [Google Scholar] [CrossRef]
- Bajcsy, R.; Lieberman, L. Texture gradient as a depth cue. Comput. Graph. Image 1976, 5, 52–67. [Google Scholar] [CrossRef]
- Wang, C.; Zhang, J.; Gu, Y. Target detection for hyperspectral images using ICA-based feature extraction. In Proceedings of the IEEE International Conference on Geoscience and Remote Sensing Symposium, Denver, CO, USA, 31 July–4 August 2006.
- Wang, C.; Zhang, J.; Gu, Y. Small target extraction based on Independent Component Analysis for hyperspectral imagery. Geo. Spat. Inf. Sci. 2006, 9, 103–107. [Google Scholar]
- Hyvarinen, A. Fast and robust fixed-point algorithms for Independent Component Analysis. IEEE Trans. Neural Netw. 1999, 10, 626–634. [Google Scholar] [CrossRef] [PubMed]
- Zarzoso, V.; Comon, P. Comparative speed analysis of fastica. Lect. Notes Comput. Sci. 2007, 4666, 293–300. [Google Scholar]
- Davies, D.L.; Bouldin, D.W. A cluster separation measure. IEEE Trans. Pattern Anal. Mach. Intell. 2000, 1, 224–227. [Google Scholar] [CrossRef]
- Model 272-TD Dual-Frequency Tow Fish; Instruction manual; Edge Tech: West Wareham, MA, USA, August 2003.
- SeaSPY Technical Application Guide. Available online: http://www.docfoc.com/seaspy-technical-application-guide-rev15 (accessed on 28 April 2016).
- Nabighian, M.N.; Grauch, V.J.S.; Hansen, R.O.; Lafehr, T.R.; Li, Y.; Peirce, J.W.; Phillips, J.D.; Ruder, M.E. The historical development of the magnetic method in exploration. Geophysics 2005, 70, 33ND–61ND. [Google Scholar] [CrossRef]


© 2016 by the authors; licensee MDPI, Basel, Switzerland. This article is an open access article distributed under the terms and conditions of the Creative Commons Attribution (CC-BY) license (http://creativecommons.org/licenses/by/4.0/).