Abstract
Aerial reconnaissance continues to be a vital tool for landscape-oriented archaeological research. Although a variety of remote sensing platforms operate within the earth’s atmosphere, the majority of aerial archaeological information is still derived from oblique photographs collected during observer-directed reconnaissance flights, a prospection approach which has dominated archaeological aerial survey for the past century. The resulting highly biased imagery is generally catalogued in sub-optimal (spatial) databases, if at all, after which a small selection of images is orthorectified and interpreted. For decades, this has been the standard approach. Although many innovations, including digital cameras, inertial units, photogrammetry and computer vision algorithms, geographic(al) information systems and computing power have emerged, their potential has not yet been fully exploited in order to re-invent and highly optimise this crucial branch of landscape archaeology. The authors argue that a fundamental change is needed to transform the way aerial archaeologists approach data acquisition and image processing. By addressing the very core concepts of geographically biased aerial archaeological photographs and proposing new imaging technologies, data handling methods and processing procedures, this paper gives a personal opinion on how the methodological components of aerial archaeology, and specifically aerial archaeological photography, should evolve during the next decade if developing a more reliable record of our past is to be our central aim. In this paper, a possible practical solution is illustrated by outlining a turnkey aerial prospection system for total coverage survey together with a semi-automated back-end pipeline that takes care of photograph correction and image enhancement as well as the management and interpretative mapping of the resulting data products. In this way, the proposed system addresses one of many bias issues in archaeological research: the bias we impart to the visual record as a result of selective coverage. While the total coverage approach outlined here may not altogether eliminate survey bias, it can vastly increase the amount of useful information captured during a single reconnaissance flight while mitigating the discriminating effects of observer-based, on-the-fly target selection. Furthermore, the information contained in this paper should make it clear that with current technology it is feasible to do so. This can radically alter the basis for aerial prospection and move landscape archaeology forward, beyond the inherently biased patterns that are currently created by airborne archaeological prospection.
1. Introduction
Even though numerous aerial and spaceborne remote sensing systems have the capacity to offer new archaeologically-relevant imagery acquired in very narrow to very broad bands of the electromagnetic spectrum (both visible and invisible to the human eye), few of them (if any) generate images in the same flexible way as a low-flying manned approach to aerial photography does. Despite their advantage in the frequency by which they can systematically cover large areas of interest and the relatively low-cost per unit area of coverage, spaceborne optical imagery is by default less suited for the discovery and detailed recording of small (i.e., with a maximum extent of 50 cm) landscape features. As a result, satellite reconnaissance is better suited for mapping larger features such as palaeochannels or detecting upstanding monuments in semi-arid environments, while airborne imaging remains the commonly preferred approach for a detailed study of past human activity in a landscape. In contrast, cameras on-board Unmanned Aerial Systems (UASs) are capable of generating imagery with a sufficient ground sampling distance. As a result, numerous archaeological surveying applications have surfaced in which these unmanned, motorised aerial platforms have played an important role [1,2]. Their unavoidable growth in archaeological research notwithstanding, non-military and affordable UASs currently still suffer from too many restrictions (in terms of payload, allowable heights, flying time and flight-specific permissions) to consider them a viable alternative for large-area archaeological prospection from a low-flying manned aircraft.
However, the manner in which most manned aerial archaeological survey is carried out can be inherently limiting due to the specific nature of target identification and acquisition. Given this, it is striking to notice that more than a century after aerial archaeological photography was initiated, the basic routines of this type of archaeological reconnaissance are still largely identical to those of the true pioneers [3,4]. Roughly eighty years ago, this fact was already noted by Reeves, who mentioned that aerial archaeology “will increase in scientific value” once “its methods and technique are improved” [5]. Only a decade ago, Palmer again noticed that nothing had really changed, stating that “observer-directed photography may have suited archaeology practice in the 1930s but I question whether it fits our current archaeological directions” [6]. Furthermore, it can be argued that we lose valuable information and waste limited resources nearly every moment we are not taking pictures during any given flight. Of course, continuous acquisition of imagery during even a single aerial survey flight can quickly generate a massive amount of data that must subsequently be sorted, processed and interpreted in an efficient manner if it is to be of any functional use. Therefore, means must be found to maximize the data acquired by this common observer-directed approach as well as routines to optimally extract archaeologically relevant information of those photographic data (a theme that is related to the current on-going debate about automatic feature detection in the aerial archaeological community, exemplified by the special sessions led by Cowley, Traviglia and Lambers at the Computer Applications and Quantitative Methods in Archaeology (CAA) 2016 and Aerial Archaeological Research Group (AARG) 2016 annual conferences).
Although the observer-led approach of the early years was entirely appropriate, as “the imperative then was to record as many previously unknown monuments as quickly as possible” [7], the fact that most archaeological prospection sorties often result in a few new archaeological “hits” too easily allowed for this reconnaissance strategy to become self-reinforcing. This methodology is also at odds with many current core conceptions of landscape archaeology and the emphasis placed not only on known monuments but on the people and spaces in between [8] and on the ways in which people, past and present, have perceived these spaces [9,10]. If, by extension, archaeological resources can be seen as a more-or-less dynamic continuous coverage, whose tangible and intangible remains were produced by people and are woven into the very fabric of the environment [11,12], the essentially “point-based” methodology of the observer-led aerial reconnaissance approach would thus seem contrary to the “area-based” approach of most current landscape archaeological research. Instead of filling in the gaps between dots on the map, current observer-led approaches focus on adding more dots. The identification of more sites is by no means bad, however, in the meantime, the “empty” spaces between archaeological sites remain empty due to lack of data rather than lack of evidence.
This paper builds upon the earlier comments of Reeves and Palmer and argues that there has indeed been a more-or-less methodological status-quo concerning image acquisition strategies for the past hundred years. Aerial archaeologists have long reflected on their own discipline, more recently trying to critically assess the ways in which remote sensing data sources can contribute to landscape archaeology identifying the pitfalls that lurk around the corner and questioning why things are done the way they are done (e.g., [13,14,15,16,17]). However, the extremely biased, observer-led reconnaissance approach has nevertheless persisted [4,7,15]. Thus, we continue to use the “ways of seeing” (to borrow a very apt concept from Bradley [18]) inherited from an earlier generation of aerial archaeologists, in spite of the arrival of theoretical and methodological advancements that can allow us to move beyond such views. Despite the incorporation of better cameras, new film technology, digital sensors, on-board geographical information systems, enhanced exterior camera positioning, and even fundamental shifts in the way we interpret archaeological landscapes, archaeological aerial photography still seems bent on intentionally crippling itself through its stubborn refusal to adhere to the data acquisition approaches that are self-evident in all other disciplines that rely on aerial data.
Very often, critical discussions on the matter have quickly devolved into the vertical versus oblique debate. However, not only do both imaging geometries have their strengths and weaknesses (cf. the revival of oblique imagery in the mapping community [19]), the typical archaeological usage of this terminology (as shorthand for geographical total coverage versus observer-directed reconnaissance) is highly inaccurate since both vertical and oblique photographs can be acquired in either reconnaissance approach (see [4] for examples). That being said, vertical photographs do have various benefits over oblique ones and some of the arguments promoting the archaeological advantages of oblique photographs (such as their cost effectiveness or superiority for rendering shadow- and colour-difference-based marks) have, in the last decades, lost a good deal of their validity [4,6,20,21,22,23].
Despite such specific (dis)advantages, it still is of lesser concern if a photograph is vertical or slightly oblique. What truly matters is the survey methodology: is basically everything recorded (that was rendered visible by the spectral sensitivities of the imager at the time of exposure) or only those features that the flying observer noticed and deemed interesting enough to be photographed? At the turn of the 21st century, Bewley and Rączkowski stated that “in examining future developments it is becoming clear that we must hold on to the best of the old and embrace the best of the new” [24]. Although their statement was followed by several suggestions for the future development of archaeological aerial survey, a new and less biased data acquisition approach was not among them. More than a decade later, this paper therefore proposes a practical implementation of a novel airborne imaging system for blanket and archaeologically-relevant vertical photography in selected spectral bands, together with the complete processing and management back-ends that should deal with the large amounts of acquired data. While no data collection methodology can be truly bias-free, a continuous coverage approach to archaeological aerial photographic documentation can at least mitigate the geospatial bias inherent in and reinforced by the selective coverage approach of current observer-led approaches.
While the solution presented here is not singular, this system was not put together lightly. In [4], most solutions that have been used in the past decades to obtain archaeologically-relevant optical imagery from the air (such as multispectral photography and hyperspectral scanning) were assessed in terms of several key concepts: spatial and spectral resolution, cost, instrument availability, geographical acquisition bias and processing complexity. At that time, it became clear that normal digital cameras, albeit very cost-effective, simply have spectral shortcomings that hamper an ideal archaeological airborne prospection. In addition, hyperspectral (or conventional multispectral) systems are, for various reasons, also anything but ideal imaging solutions (although they are by default generating geographically unbiased data products). From these observations, and after carefully considering the state-of-the-art in other airborne remote sensing fields, a new data acquisition system is proposed and technically described in the second part of this text. Not only does it have the potential to enable a new and more rewarding way of archaeological airborne reconnaissance, it also can serve as an open and expandable imaging platform for use by researchers in diverse fields, so that even archaeologists can help in answering the growing need for accurate and precise geo-data.
Since it must be stressed that a drastically new approach to archaeological airborne data acquisition alone cannot be the solution, parts three to five will focus on easily implementable methods for aerial photo orthorectification and image enhancement as well as data management and post-processing routines for interpretative mapping. These aspects are paramount to a new archaeological airborne reconnaissance approach as well, given the enormous amount of valuable data on geo-archaeological landscapes that will become accessible when the proposed image acquisition approach is put to use. On top of that, current single-image-based workflows are simply too slow and cumbersome to deal with the large amounts of aerial imagery that are constantly generated and the millions of aerial photographs that are already stored in archives, where they are at risk of loss or obscurity. In essence, the remainder of the text will argue in favour of processing and interpretation pipelines that can deal with a multitude of images at once, thereby saving on the demands for skill, money and time while maximising the archaeological usability of aerial archaeological photographs. Given the current inability to do so, the latter three are also often quoted as reasons to leave total area coverage aside [25]. Finally, an outlook discussing the proposed system in the light of landscape archaeology and tackling its potential to break new ground in various aspects of aerial archaeology concludes this article.
2. Image Acquisition
2.1. State-of-the-Art
Aerial photography captures data about the earth’s surface through the use of an optical system coupled to a dedicated sensitised surface. Although medium and large format cameras are also equipped with digital sensors, 35 mm-like (called small format in the digital world) or smaller digital cameras are still favoured by aerial archaeologists for reasons of cost and ease of use in a small, turbulent aeroplane. Although incorrect from a photographic terminological point-of-view, note that some authors also consider 70 mm film to be small-format [26,27]. Regardless of the type of small format Digital Still Camera (DSC), all feature a silicon-based imaging sensor consisting of a two-dimensional photosite array. By default, this array is covered with a blocking filter (often denoted hot mirror) that only transmits visible electromagnetic radiation (i.e., light) (Figure 1A). Without this filter, the sensor has a cut-on imaging wavelength in the 320 nm-370 nm Near-UltraViolet (NUV) range, while the cut-off wavelength falls in the Near-InfraRed (NIR) at circa 1100 nm [28,29] (Figure 1B). Due to a Colour Filter Array (CFA) of thin optical filters [30], only one—although broad—particular range of incident radiant energy is captured per photosite. Generally, DSCs use a Red-Green-Blue (RGB) Bayer pattern (Figure 1) [31] and create a triplet of integer digital numbers for every pixel by interpolating the two missing components from neighbouring pixels.
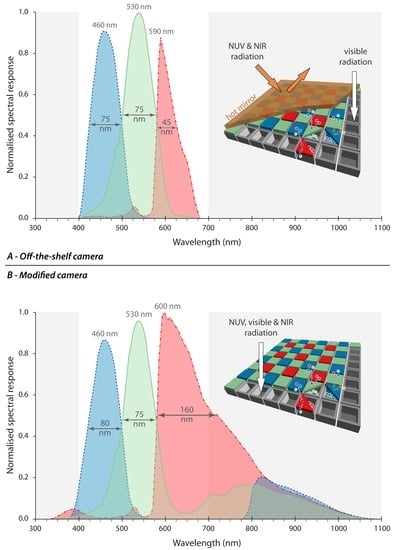
Figure 1.
The spectral responses and layout of a typical DSC image sensor with Bayer CFA. (A) shows the relative spectral response curves from an off-the-shelf model (i.e., with its hot mirror in place); (B) indicates the camera’s spectral sensitivity in the invisible NUV and NIR regions (both indicated in grey) upon removing this internal blocking filter. For every channel, the wavelength of maximum transmission and the bandpass in terms of full-width at half-maximum are indicated.
During the last decade, silicon imagers also began to replace analogue film cameras in vertical, spatially unbiased imaging applications. Large format digital frame cameras such as Microsoft’s/Vexcel’s UltraCam series [32] and Intergraph’s Z/I Digital Mapping Camera II [33], pushbroom line scanning cameras like the Leica ADS100 [34] or medium format imagers such as the Phase One iXU 1000A [35] or the Trimble Aerial Camera [36], have by now completely replaced—even surpassed—film cameras. As these imagers are built to satisfy the mapping community, they utilise only high-end components and deliver stunning multispectral images with extremely good image geometry [37]. However, these multi-megapixel imagers are neither cheap, small nor light (most large format cameras weigh over 75 kg and cost several hundred thousand euro) while the spectral resolution is generally limited to four broad channels (Red, Green, Blue and NIR). Channel range is often further limited to three in medium format solutions, as they still have the NUV-NIR blocking filter in place.
Along with small format cameras, these medium format imagers are often used in multiple camera systems (see [38] for an older, but foundational overview or Rupnik et al. [39] and Lemmens [40,41] for a more up-to-date list). Although they offer the advantage that imagery is simultaneously acquired from different angles, these heavy camera systems are again generally limited to three broad bands in the visible range. Imaging systems in this class that do deliver a wider selection of bands tend to deliver rather small images (e.g., the multi-spectral camera arrays from Tetracam [42]). Moreover, those camera arrays often consist of four, five or more identical imagers. Changing to a new camera type means that all imagers have to be changed. This is not only costly, but in the process one might even need to completely redesign the camera mount. Thus, these solutions tend to lack a certain degree of flexibility in both spectral bandwidth as well as upgradability.
Lastly, a number of complete, commercially available turnkey solutions for creating a bespoke airborne imaging platform based on a small aircraft are offered as well. Examples are the Finnish EnsoMOSAIC aerial mapping system [43], the American Aerial Imaging Pod [44], the Slovene Geoniss [45] and the Australian Klau Geomatics Aerial Mapping System [46]. However, these systems often demand specific aircraft adaptations and feature broad-band imaging instruments. Additionally, they are less expandable and adaptable than the platform that will be proposed here. Finally, creating a system based on individual components from different manufacturers makes it easier to upgrade certain components to ensure that the imaging solution can stay current with technological evolutions.
2.2. Multispectral Nadir Image Acquisition
It has already been mentioned that both observer-directed and total coverage photography are characterised by one or more drawbacks that hamper optimal archaeological aerial prospection. As this paper seeks solutions to remedy this, the data acquisition pillar is fundamental. Therefore, the starting point is the premise that archaeological aerial photographic reconnaissance with unsystematically taken oblique photographs by conventional three-band still cameras is sub-optimal in many aspects. In essence, this paper proposes a new digital image acquisition system that enables high-end geographically unbiased surveys, while also being very portable in order to allow for easy transport to diverse research areas. Additionally, straightforward mounting and demounting on an aircraft is a fundamental prerequisite of such a system. Moreover, the imaging components should provide data that are of the highest quality (radiometrically, spectrally and spatially). Furthermore, the proposed airborne digital imaging system should not need hard-to-get certificates for installation, while its modular design should allow for the easy replacement of parts and keeping up with advances in imaging technology. The following section will detail all components of such a system. It should be noted that the authors are not affiliated with any of the companies or products mentioned, but that the presented solution is just based on components that deliver—according to the authors—top notch performance anno 2016.
2.2.1. ALPA 12 FPS Achromatic Imaging
The high-resolution imaging system proposed here could be built around the IQ260 achromatic imager, built by Phase One. This high-end medium format digital back holds an achromatic 60 megapixel sensor of 53.9 mm by 40.4 mm [47], indicating that the CCD sensor lacks both the NUV-NIR blocking filter and the CFA. As a result, the Phase One IQ260 is not prone to various interpolation issues commonly found in CFA-type sensors, while also yielding a NUV to NIR spectral response. Moreover, the deployment of a separate digital sensor back makes the camera system very easy to upgrade. When a better digital sensor hits the market, it becomes only a matter of switching the sensor, while all the other parts of the complete imaging chain (camera body and lens) would remain unaltered.
This back could be attached to the Swiss-made ALPA 12 FPS, as this camera body offers a truly unique imaging solution (Figure 2). Its integrated Focal Plane Shutter (FPS) allows exposure times of up to 1/4000 s, while complete remote access to the camera is also possible. This feature is very important, as imaging beyond the visible spectrum necessitates manual exposure control that is ideally set by the camera operator during the flight. The scriptable integrated microcomputer of the FPS can also control external accessories such as filter sliders [48]. The ALPA 12 system is thus a sturdy, completely open and modular camera [49] that has already been successfully used for the highest quality photogrammetry [50,51].
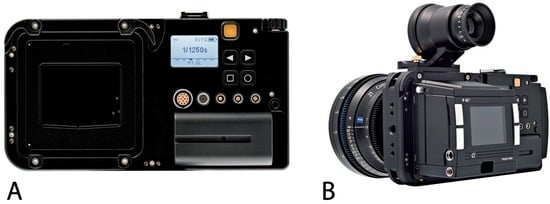
Figure 2.
(A) The rear of the ALPA 12 FPS; and (B) The ALPA 12 FPS with a Zeiss Distagon T* CP 2 21 mm T/2.9 lens and a P45+ digital back of Phase One. All images courtesy of ALPA of Switzerland.
Due to the modular idea behind the ALPA FPS, the system accepts modern and classic-design lenses from dozens of different manufacturers (with or without electronic or manual aperture control and with or without a central shutter), limited only by the image circles of the lens. To complement the body, Rodenstock/ALPA HR Alpagon 4.0/40 mm FPS SB17 and Schneider/ALPA Apo-Helvetar 5.6/60 mm XL SB17 lenses can be chosen. Featuring a 40 mm and 60 mm focal length, respectively, this pair of lenses allow for greater flexibility in flight height (e.g., 40 mm for flights restricted to a certain altitude or when more image overlap might prove beneficial). Both lenses feature a very high contrast transfer and resolving power, while ALPA manages their calibration and adaptation. When comparing the proposed imaging solution to the Phase One and Trimble medium format imagers mentioned before, the ALPA 12 FPS has two advantages: cost and size. Since it is also produced at a small company, the ALPA is much easier to expand with customised solutions such as triggering options and a filter slider (see the next section).
2.2.2. Filters
As the digital back is a monochrome device, optical filters would be necessary in order to enable imaging in separate spectral bands. By mounting an external filter slider to the ALPA 12 FPS, it becomes possible to shoot separate images through a specific selection of alternating narrowband filters during the time needed by the aircraft to reach the next image position. Ideally, the slider would be equipped with three filters, whose specific data can be found in Table 1. These three spectral bands have repeatedly been shown to be strongly related to biophysical changes caused by plant stress (see Table 1 for some core references and compare the spectral responses of a normal digital camera in Figure 3A to the spectral bands proposed here and depicted in Figure 3B). They are therefore optimal for assessing crop (and by extension vegetation) characteristics, while the combination of the 820 nm NIR band and the 705 nm Red Edge band has already proven its potential in archaeological research [52,53,54]. Additionally, the information captured in the NIR band is not solely restricted to vegetation marks. Since water heavily absorbs NIR [55] and existing soil moisture differences are often characteristic of soil marks [56,57], discerning the latter becomes easier in the NIR as compared to the visible range [58,59] (Figure 3B). Moreover, all three bands have been shown to exhibit relatively low Bidirectional Reflectance Distribution Function (BRDF) effects [60]. However, the strong multiple scattering effects in these wavebands (certainly the 550 nm and 820 nm band) diminish the contrast between shadowed and illuminated canopy components [60]. Although they might not be optimal for imaging shadow marks, this is a non-issue given the fact that new digital approaches give us the ability to artificially reveal shadow marks in an interactive and much more rigorous way than any type of aerial photography can [4].

Table 1.
Three optimal wavebands for vegetation mark detection and some references supporting this claim.
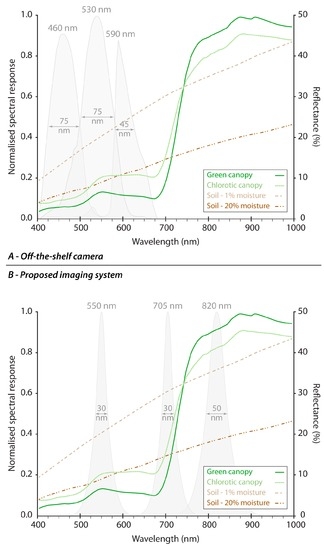
Figure 3.
The spectral reflectance curves of a green and a chlorotic vegetation canopy along with those of a soil (circa 20% sand, 70% silt, 10% clay) with varying degrees of moisture: (A) How a common DSC would sample these curves, while the lower part; and (B) The spectral transmission of the proposed interference filters in relation to these spectral reflectances. All spectral channels have their wavelength of maximum transmission and their bandwidth in terms of full-width at half-maximum indicated.
The filters to be used are custom-made dichroic/interference filters whose spectral properties result from wavelength interference rather than absorption [75]. Due to its working principles, such a filter easily allows the transmission of a well-defined waveband (Table 1, Figure 3) and rejects all other unwanted wavelengths. The use of such interference filters for wavelength specific airborne imaging is not new and positive results have already been reported on many occasions [52,76,77].
In the end, the image acquisition through the proposed device would be as follows: initially, the first image in the green waveband is taken. While the airplane cruises to the next position from which a green waveband image should be acquired, a Red Edge and NIR image are collected. Since the distance between consecutive Red Edge and NIR images would be identical to those in the green waveband, all three spectral image sets would be characterised by the same amount of overlap. Subsequent orthophoto production would then be executed per spectral set, so that three orthophoto mosaics are produced. This allows additional processing methods, detailed in Section 3.
2.2.3. Conventional Still and Video Imaging
Although the ALPA-based solution is perfectly suited for the imaging of vegetation and soil marks (compare Figure 3B with Figure 3A), the interpretation of this imagery will greatly benefit from accompanying visible imagery [3]. Therefore, a normal state-of the-art full-format (i.e., 36 mm by 24 mm) digital reflex camera (e.g., Nikon D810) would be flown alongside the ALPA to measure only the incoming visible light. Due to the recent deluge of smartphone and tablet applications that allow such cameras to be remotely controlled from the cockpit, one device can be used to command both cameras (Figure 4). To generate images with approximately the same field of view as those generated by the ALPA 12 FPS, the Zeiss Distagon T 25 mm f/2 ZF.2 Nikon and the Zeiss Distagon T 35 mm f/1.4 ZF2 Nikon can complement the Nikon body. Combining these technologically-diverse but complementary imaging solutions thus allows for a complete data acquisition by capturing spectral information in small, crop and soil mark-sensitive spectral bands as well as in the common broad wavebands of the visible spectrum. Moreover, the Nikon D810 (and its future successors) produces an uncompressed high-definition video stream. Although video is currently seldom used for mapping purposes for a number of reasons [78,79], this video output could constitute a unique data set that opens the door to the wider scientific geo-community to compare video-based orthophoto solutions with the conventional workflows centred around still images. Moreover, the recent release of ArcGIS Full Motion Video [80] indicates that the geo-community is beginning to take video data more seriously.
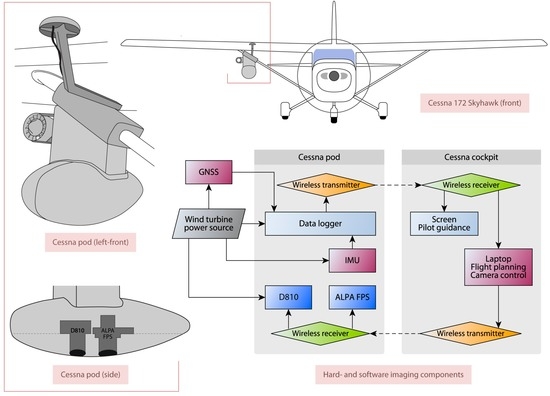
Figure 4.
The proposed mobile camera pod for common Cessna types and a scheme outlining all the soft- and hardware components of the complete aerial image acquisition system.
2.2.4. GNSS/IMU
A Global Navigation Satellite System (GNSS) receiver on-board the aircraft is also essential for the proposed system as its output guides the pilot to fly exactly on the predefined flight path. Moreover, the airplane’s location will define when the camera has to be triggered. This GNSS receiver needs, however, to be complemented by an Inertial Measurement Unit (IMU) that records the camera rotation angles which define the direction into which the camera is pointed. They form, together with the three camera coordinates delivered by the GNSS receiver, the exterior image orientation. Approximate exterior orientation parameters are very important in the initial phase of the orthophoto production (see Section 3). To accomplish this, a small and light device like the SBG Systems Ellipse-N [81] or the Xsens MTi-G-710 [82] would be well suited for the proposed platform.
2.2.5. Camera Pod
As cameras will not be hand-held, a dedicated camera mount needs to be developed. More specifically, the whole imaging system must be easily attachable to (and detachable from) a two-to four-seat, single-engine, high-wing airplane. Since the Cessna 152, Cessna 162 Skycatcher, Cessna 172 Skyhawk and Cessna 182 Skylane [83] can be found abundantly worldwide (and are therefore used by aerial archaeologists all over the world), the mount could be specifically designed for these aircrafts. Additionally, the mount should be light, to put minimal strain on the airplane, and minimal certification (a so-called supplemental type certificate) should be needed for its operation.
Although Cessna-approved camera pods exist (e.g., [44]), a possible design for a carbon fibre camera pod that is optimally suited for the proposed reconnaissance approach is depicted in Figure 4. This design is inspired by the ADAM (Airborne Data Acquisition Module) platform of the Johanneum Research [84]. As is the case with ADAM, our proposed aerodynamic pod is connected to one of the wing struts, while its volume easily encompasses and shields the proposed camera systems and all necessary accessories. The imaging platform is also expandable, since the pod still provides some space for one or two optional additional sensors (such as a short wavelength infrared sensor and a thermal imager). Communication between the pod and the cockpit can be conducted via wireless connections. Not only does this make the solution independent of specific aircraft type, it also avoids special certifications which would be needed in the case of additional wiring inside the aircraft. Finally, a separate wind turbine could function as an autonomous power supply so that specific (or even all) devices can be powered completely independent of external power sources.
This platform would also omit the immense costs of flying a dedicated mapping plane with all of the necessary equipment from one country to another. As the cameras, logger, GNSS/IMU and screens or laptops can easily be packed as hand-luggage in two hard-cover cases, only the pod needs to be transported separately. This would not only immensely reduce costs, but would additionally offer local researchers the chance to have a high-end imaging system flown by their preferred aircraft and pilot.
2.2.6. Flight Management Software
Automatic image acquisition with different cameras shooting at diverse moments necessitates three software components: flight planning, navigation and camera control software [85]. First, a fully three-dimensional flight planning software is essential. Ideally, the software is interactive and allows easy adaptation of flight plans based on local topography and camera systems used. Therefore, the inclusion of Digital Terrain and Surface Models (DTM and DSM, respectively) is of the utmost importance. Since the system must be easy to deploy in different regions of the world, the software should also support hundreds of different coordinate reference systems.
Although several software companies deliver complete navigation bundles (with a GNSS/IMU, screens, etc.), opting for such a solution is not ideal. These solutions only use high-end components, which means that cost, dimensions and weight are high. Given that the proposed orthorectification (Section 3) software can compensate for the slight inaccuracy of the IMU and the fact that only smaller and lighter components can be attached to a Cessna 152, 162, 172 or 182, opting for an individual piece of software, coupled with individual hardware components, not only allows to build a cheaper solution, but also one that is less closed and easier to expand. To this end, TopoFlight [86] is proposed as the flight planning software. TopoFlight 7 has been tested under the most difficult conditions in the Swiss Alps. Moreover, it uses a DSM or DTM for full 3D flight planning, to omit gaps in the image coverage and still acquire adequate but not excessive frames. To execute the tasks of navigation and camera control, it should be rather straightforward to program small bespoke software, although one could also build a solution around the existing TopoFlight Navigator [86].
2.2.7. Costs
Thus far, we have refrained from attaching a specific price tag to all of these components. This is because the paper aims at presenting a general concept rather than a singular, pre-defined solution, and also since some of the proposed components (like the camera pod and the filter slider) have to be developed from scratch. As such, it is very hard to estimate their final cost. In addition, prices of hard- and software are also subject to serious change due to market fluctuations and may or may not be lower than any price quoted at the moment of publication. Nevertheless, we budgeted the costs of the above-listed components together with all the development and integration costs to come up with a rough estimate of € 200,000. Obviously, this cost would only apply to the very first imaging system, with subsequent units most likely being cheaper.
Of course, provisions will also have to be made for the storage of the data, although this should not be a real issue due to the continually decreasing prices for storage space. The following example illustrates the amount of imagery that will be acquired for a 700 km2 study area. Using the imaging system proposed in the paper, a region of this size could easily be covered in 1 flight. When aiming for a standard ground sampling distance of 15 cm, the number of photographs generated with an ALPA 12 FPS and 60 mm lens amounts to 3000 when taking a forward and side overlap of respectively 70% and 40% into account. In the end, these figures have to be quadrupled to account for the three different filters used and the Nikon D810.
3. Image Correction and Contrast Optimisation
3.1. Orthorectification
Too often, aerial archaeological photography is limited to the acquisition phase and many images are never properly georeferenced and interpreted. The neglect of this interpretative mapping may have multiple reasons, and the time-consuming georeferencing process is most often one of them [87]. Although it is sensu stricto not covered by its definition, georeferencing often also removes the optical distortions as well as tilt and relief displacements of the aerial image so that each image pixel is put on its true location on the Earth’s surface [88]. To execute this process of (ortho)rectification, advanced expert packages such as the Trimble INPHO Photogrammetric System [89] or PCI Geomatics’ Geomatica [90] had commonly to be used. However, the last decade has witnessed new insights in the geometry of multiple images and powerful image orientation techniques such as Structure from Motion (SfM) from the field of computer vision have started to emerge as viable alternatives [91,92,93]. Using an SfM output, which holds the interior and exterior image orientations, it is possible to compute orthophotographs by projecting the images onto a detailed DSM from the observed scene. Since this DSM can be extracted from the imagery itself via dense image matching techniques such as a multi-view stereo algorithm (MVS) [94,95,96], a true orthophoto can be created from a series of overlapping images. Moreover, such SfM-MVS processing chains also enable a proper orthorectification of image collections consisting of randomly acquired oblique photographs.
Although many SfM-based packages are in existence today, one likely solution could be OrientAL [97], a free image orientation package developed with the financial support of the Austrian Science Fund (FWF P24116-N23, “Automated georeferencing and orthorectification of archaeological aerial photographs”). Aside from the relative image orientation, OrientAL also aims to automate the process of absolute orientation by semi-automatically extracting GCPs from existing datasets (details can be found in [97,98]). The importance of these GCPs should not be underestimated, because an SfM output is equivalent to the real-world scene up to a global scaling, rotation and translation. These parameters can only be recovered via the use of additional data such as Ground Control Points (GCPs). Although the potential of this new approach to orthorectification has been used in aerial archaeology [87,99,100,101,102,103] the recurring steps of visualizing the images, selecting the essential GCPs and setting all the parameters for the subsequent execution of the algorithms is currently still a big bottleneck for large-scale archaeological projects with thousands of oblique and/or vertical images. Automated georeferencing in a manner such as that provided by OrientAL would thus remove such a bottleneck from the processing chain.
Although direct georeferencing of large image sets with minimal ground control is also possible through the use of exterior orientation values from high-end GNSS/IMU units like the Applanix POS AVX 210 [104] or IGI AEROcontrol [105], such solutions are too costly and cumbersome to mount inside light aircraft. On the other hand, cheaper and thus less accurate devices like the Xsens MTi-G-710 (proposed in Section 2.2.4) have been proven more than sufficient for effective image inventorying by automatic footprint computation [106]. Although the orientation values of these lower-end solutions cannot solely be relied upon when high-accuracy mapping is the expected end-product, they can be taken into account during the SfM step in OrientAL, thereby significantly accelerating the image orientation.
Accelerating the image orientation as well as reducing the need for many GCPs could also be possible using a device such as the Applanix APX-15 UAV solution [107]. Although the results from initial UAS (Unmanned Aerial System) tests demonstrated the capabilities of this small but expensive piece of hardware for direct georeferencing of airborne cameras [108], it still remains to be seen how it performs inside the more dynamic environment of a manned aircraft. Independent of the final GNSS/IMU solution, the proposed orthorectification procedure will provide georeferenced spectral information in six bands for the entirety of the imaged ground surface, regardless of the fact that the images have not been shot from the exact same position.
3.2. Radiometric Correction
In addition to geometric distortion, when imaging an object with an airborne sensor the radiometry of the captured data is also distorted due to the intervening atmosphere, scene characteristics (such as topography) and properties of the sensor and optics [109,110]. Since archaeologists want to infer information about plant stress and soil colour, the Digital Numbers (DNs) of the pixels should be recalculated to accurately reflect the quantitative reflectance of those features across the whole image frame. This recalculation, which first characterises and then compensates these radiometric modulations, is denoted radiometric correction in optical remote sensing. In essence, one needs to compute pixel-specific reflectance values from the generated DNs to relate the signals extracted from the images with those captured on the ground or to compare the temporality of features (change detection, etc.). Note that the absolute reflectance might seem to be less important and that archaeologists would only need the relative reflectance to be accurate across the whole frame. However, inter-sensor data comparison, relating the image data to laboratory data sets or assess surface feature reflectance over time might prove very beneficial in archaeological imaging as well. As such, all radiometric modulations should be taken into account.
Many approaches have been developed [111] to perform a proper radiometric correction. First, one could easily use the ATCOR-4 protocol on thousands of aerial images [109]. Additionally, the straightforward empirical line, QUick Atmospheric Correction (QUAC) and Fast Line-of-sight Atmospheric Analysis of Spectral Hypercubes (FLAASH) modules are available in the ENVI (Environment for Visualizing Images) geospatial software [112].
3.3. Contrast Optimisation
Improving the visualisation of the information encoded in airborne data can be achieved with image enhancement techniques [113,114]. In general, contrast enhancement can be very beneficial for aerial image interpretation as the data regularly suffer from a lack of contrast. This often arises from the fact that the digitised reflectance values do not cover the sensor’s full dynamic and tonal range (due to poor illumination conditions, a scene with quite similar reflectance properties or scattering of the solar electromagnetic radiation, often perceived as haze). As the human visual system relies on contrast for the detection of geo-archaeological features, contrast restoration is one of the most useful steps in the image processing of aerial archaeological imagery, even if the image was already radiometrically corrected.
Contrast optimisation can be achieved in many ways, but the proposed data acquisition pipeline allows for a specific approach. In a first stage, Vegetation Indices (VIs) can be computed with the spectrally varying data. These commonplace tools for vegetation assessment are mathematical waveband operations (ratioing, differencing, summing, ratioing differences or linear combinations) that try to relate particular spectral reflectances in two or more wavebands from leaves or complete canopies to specific vegetation characteristics (such as chlorophyll content, biomass, crop water stress and nutrient deficiency). In the past decades, a very large range of VIs have been proposed, all varying in sophistication, spectral information needed and effectiveness [115,116]. Most of these VIs have shown to go beyond the detection possibilities of the human eye, and are able to visualise plant-related information (such as stress) if the right combination of spectral bands is applied. Since the spectral bands that are captured in this approach are optimally placed to assess small variations in the plants’ physiology [117,118] and general soil reflectance, several indices can be tested.
Afterwards, global and local contrast enhancement techniques such as piecewise linear contrast stretch [119] or the Contrast Limited Adaptive Histogram Equalization (CLAHE; [120]) can be applied onto those newly derived data layers to further maximise the difference between the geo-archaeological interesting features and their surroundings. In aerial archaeology, the only clear-cut performance criterion is that the image is able to convey its geo-archaeological information better, if not as a whole than in certain parts of the image. Since there is no generic image enhancement method which works in all cases and no solid measure to quantify the output image quality for a certain aim, a wide variety of contrast enhancement algorithms need to be assessed.
The essential automation of the combined contrast optimisation strategy can be programmed in ENVI [121], which has been one of the preferred tools for remote sensing image processing and analysis for two decades [122]. ENVI has many powerful processing tools as standard implementations, while there is also a seamless integration with ESRI’s ArcGIS platform that is lacked by many open source tools (see the next Section on data management for the importance of this integration). Although most routines are already built-in, new functionality can be implemented in ENVI using the scientific programming language IDL (Interactive Data Language). Therefore, it is an excellent choice for the fast and customisable execution of the image processing algorithms proposed in this section (and some of the following sections).
4. Data Management
4.1. Status Quaestionis
Collecting and processing data without a good data management system is an irresponsible but all-too-common practice. Not only does a good management system maintain the integrity of the data, it also enables and supports easy retrieval, versioning and advanced spatial analyses. As a result, the development of a spatial database should be a critical component of every archaeological project. As the complexity of a spatial database grows with increasing and diverse data sets, it is very important to create a well-documented conceptual and logical data model, in which the terminology used and the classification rules applied are properly described, to avoid further evidence gaps and unreliable data entries (see Cowely [123] for some examples of the latter). That is why any project or institute should reserve a significant amount of time for the data model development before its implementation.
Although many books have been written on the use of GIS (Geographic(al) Information Systems) in archaeology [124,125,126], all of them focus extensively on the analytical applications of GIS and rarely address the management and structure of the archaeological spatial database [127]. This lack of modelling-focused activity seems strange, as databases are a ubiquitous part of archaeological research. More than a decade ago, the ISO certified CIDOC Conceptual Reference Model (CRM) (ISO 21127:2006) established guidelines to optimise and unify the information exchange between cultural heritage parties. Although initially aimed at museum collections, libraries and archives [128,129,130,131], the use of the CIDOC CRM gradually grew in the archaeological sector to structure data as data that are mapped to this formal CRM ontology seemed to enable a greater semantic depth to searches than just simple keywords [132]. However, the CIDOC CRM does not come with an easy “user guide”, forcing one to implement various additional methodological and technical developments before it can be really applied and disseminated. Despite some initial attempts (e.g., [133]), a CIDOC CRM-compliant object-oriented spatial database is thus still a distant reality. On top of this, most archaeological database solutions are mainly limited to regular geospatial data (i.e., data without a proper third geometrical dimension, nor a time component). Since archaeological data are much more complex, the spatial database should also take fuzziness, temporal values and the third spatial dimension (3D) into account. Despite three decades of research, current GIS platforms still lack the ability to deal with full 3D topology [134]. The same goes for the management of the temporal dimension, although a few inventive academic tools (e.g., [135]) offset this to a certain extent.
The academic and commercial efforts that really do take data modelling and spatiotemporal data management more seriously mainly target excavation archaeology. Recent examples are CRM-EH [132] and IntraSIS [136]. Aside from these, there are only a few attempts that specifically target archaeological remote sensing data. These include ORSAIS [137], the Archaeological Prospection Information System (APIS) [138] and the MORPH2 model of English Heritage’s national mapping programme [139]. Between these approaches there is no consistency in data modelling and obviously no uniformly accepted physical database model.
4.2. A Multi-Layered Database Approach
Although well-managed geospatial databases can exist without ESRI’s geodatabase (GDB) technology, the GDB data model has numerous advantages for structuring and documenting data in an archaeological GIS [127]. Whichever the specific type of GDB (ESRI has a number of different implementations), they all use a relational database at their core [140]. For the purposes outlined in this paper, an ArcGIS Server Enterprise GeoDataBase (GDB) is proposed since it uses an application tier (e.g., the ESRI ArcGIS software, currently at version 10.4.1) and a separate storage tier, while the responsibility for managing data is shared between both. As storage solution, one can opt for PostgreSQL, which is a free and powerful open source object-relational database management system [141]. In this case, PostGIS enables spatial queries and functions inside the PostgreSQL database [140,142,143].
Although a free and open-source solution consisting of a PostgreSQL + PostGIS backbone and a Quantum GIS frontend (or another open source geospatial software) is cheaper and maybe more flexible than the proposed ArcGIS-based solution, one might miss very useful geodatabase functionality. Additionally, the standard framework of the GDB ensures one is not starting from a blank sheet of paper. Since many functions are implemented in a GDB by default, the time-consuming burden of programming them all from scratch is alleviated [144]. Running a PostgreSQL-based ArcSDE Enterprise geodatabase with PostGIS—in which the geodatabase is stored in PostgreSQL and PostGIS is the storage type for the spatial data allowing location queries—is thus a justifiable, solid and powerful object-relational spatial database solution (ESRI, 2010). Moreover, the PostgreSQL/PostGIS combination has also proven successful in several archaeological applications (e.g., [136,145]) while solutions such as aSpect 3D [146] have proven that managing 3D data becomes to a certain extent possible using the latest PostgreSQL/PostGIS database 3D enhancements.
Because a physical database model always enables or constrains certain possibilities [147], existing data models are primarily dictated by the application. This is, however, only a good approach in the case that the spatial database has to fulfil a single purpose. As a result, not one single-purpose GDB but different GDBs can be planned: the editing (or data maintenance) GDB environment which should be separated from the application-specific GDBs since both database-types ask for different designs (e.g., a normalised design versus a denormalised design [144]). Additionally, both GDB types can evolve independently as user needs and technology change. Figure 5 provides the general outline of such a GDB-based strategy for the workflow proposed here, while Figure 6 indicates where specific datasets will be stored.
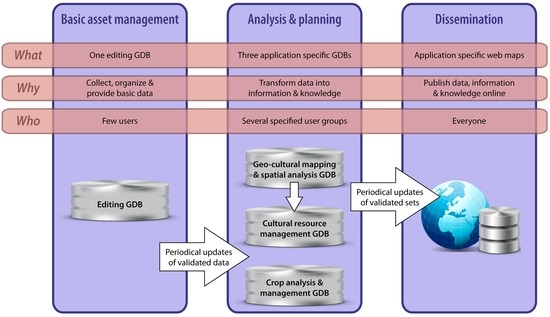
Figure 5.
The proposed GIS framework: from data organisation to knowledge dissemination.
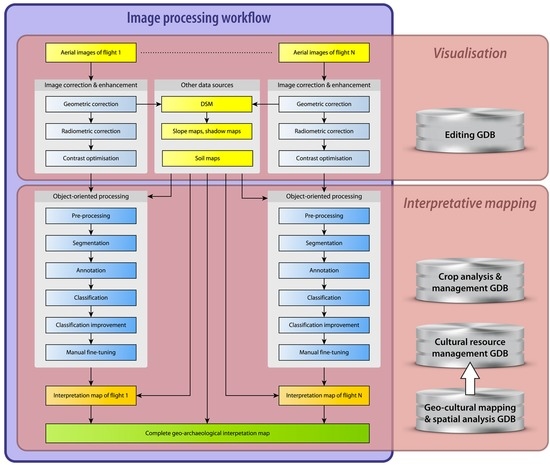
Figure 6.
Processing aerial images into geo-archaeological interpretation maps. Alongside, the main functionality of the processing block is indicated together with the storage location of the results.
In an ideal world, all collected data and derived information layers should be as open as possible (mediated by the policy of the specific data provider), meaning that they could be put online in specific web maps. Furthermore, the documentation of the data needs to adhere to the INSPIRE standard [148], which (in ESRI-based implementations) can be enabled by the ArcGIS for INSPIRE extension [149]. Although such an enterprise-type GIS does take quite some time and planning to implement, the return on investment is high since it will be scalable and secure.
5. Interpretative Mapping
5.1. Status Quaestionis
Unravelling past engagement with the landscape is generally attempted by throwing a continuum of theoretical and methodological tools at physical dimensions in order to create conceptual ones. Remote sensing is one effective technique used in landscape archaeology for providing raw data [150,151,152] that serve as a basis for interpretation at various scales, since the generated data products are able to provide both a small- and a large-scale geographic overview of the environment. Given their potential to shape our current understanding of past cultural and physical landscapes, it can never be stressed enough that imagery should not only be acquired, but, more importantly, also be managed and interpreted. In most cases, archaeological interpretative mapping should thus be the main reason why remote sensing data are acquired for archaeological landscape research. It is the process that helps to turn raw data into archaeological information and knowledge, often assisted by analysis techniques such as comparison with historical sources or statistical inference and mediated through theoretical concepts that help to interpret human activity in the past through the durable remains of their activity that are present today.
Archaeological interpretative mapping of georeferenced and orthorectified remote sensing products typically follows more or less the same workflow: the image is displayed in a GIS application and interpreted by drawing points, lines and polygons. As no internationally-accepted or even European interpretation templates with standardised symbology or drawing conventions exist, during interpretation people tend to attribute the geometrical entities created with specific properties such as hatching, colour and line thickness as they see fit. When the information is difficult to extract, a multitude of interpretational processing aids can be applied. A lack of contrast can be counteracted by a variety of contrast enhancing algorithms before—or even during—this mapping phase. When multiple spectral bands are available, one can also compute VIs, perform a principal component analysis and apply a classification. Although all these image processing approaches can help to visualise information that is otherwise not (or badly) visible in the data, they are all executed on the pixel level. This means that the algorithms are basically rather unintelligent, missing semantic connections and interrelations of the image content. As such, they do not really aid in automating interpretative mapping, rather they help to make certain mapping decisions easier.
5.2. Harnessing the Power of Object-Based Image Analysis
Large-area mapping projects have already revealed that the traditional ways in which archaeologists deal with the interpretative mapping of large quantities of data are insufficient. As such, it is the authors’ believe that interpretative mapping can benefit from (semi-)automated techniques. Although a fully automated workflow is not advocated here (cf. [153]), automated Object-Oriented (OO) methods [154] are among approaches that can be utilised to pre-classify imagery before the final manual interpretative mapping takes place, thus increasing the efficiency of the interpretation process. Such OO approaches can be embedded in Object-Based Image Analysis (OBIA) workflows [155,156]. When dealing with spatial information that has a geographic component (e.g., orthorectified aerial imagery), the subdiscipline and corresponding acronym GEOBIA (GEographic Object-Based Image Analysis) are often used to denote OBIA applications that deal specifically with geographic information [157,158]. In contrast to pixel-based procedures, OBIA approaches attempt to mimic the human eye/brain interpretive process: vector, raster and attribute data can be merged to create a classification rule set that uses human-like reasoning by incorporating topographical and spectral signatures, temporal data and morphological semantics ([159] and see Sevara et al. [160] for some archaeological implications of both strategies).
As a first step in an OBIA approach, an image is generally segmented into interrelated pixel groups or objects that do not overlap. There are a number of ways in which this can be done (see [161] for a comprehensive overview), however in the present application we propose the use of an approach based on spectral, spatial and geometric homogeneity [161] in which the more complex image segmentation tasks rely largely on a multiresolution segmentation algorithm to determine homogeneity based on a bottom-up pairwise region merging approach [162,163]. The resulting image objects, defined by a complete set of specific characteristics like colour, shape, texture and local context, can then be assigned to different classes and become annotated with new thematic properties (e.g., sealed areas, water bodies). Afterward, individually segmented objects can be merged into logical units based on their properties, using combinations of characteristics including radiometric and geometric values as well as semantic relationships. In the proposed application, rule-based classification would occur in a hierarchical manner, and as each object is classified it is removed from consideration for subsequent classifications. Together these values should describe real-world objects: houses, vegetation patches, topographic or archaeological features, etc. [164]. By utilizing the assembly of all image objects, it is not only possible to analyse the pure physical spectral properties of an image, but also its semantic connections and the relationships between various objects which comprise the image content. Furthermore, with data sets that have a high temporal resolution (multiple fly-overs of a given area at different times) areas of correspondence and change could be identified and used as a likelihood criterion in the classification schema.
An approach to feature detection such as the one described here could benefit further from the inclusion of accurate height data in the detection process. Given that the proposed image rectification workflow (Section 3.1) generates a raster DSM and also a 3D point cloud, both of whose values are derived directly from the imagery, such 2.5/3D data and their derivatives can be used as criteria for both segmenting image objects (based on height homogeneity/difference) and for image object classification. Classification can be further improved through the use of various spectral band combinations (see Section 3.3) in conjunction with elevation data in order to differentiate between different types and heights of vegetation that may have similar spectral signatures (e.g., [165,166] for examples of land cover classification using multiple spectral imagery bands and airborne laser scanning data, and see [23] for an archaeological example). This approach could even be used to differentiate types of archaeological feature marks present in the imagery. In this way, soil marks (which have a low relative height but high spectral and geometric contrast in relationship to their surroundings) could be differentiated from vegetation marks. Vegetation marks could be further classified into positive and negative marks based on their local topographic contrast, geometry, and spectral continuity/discontinuity with the surrounding vegetation. These are just a few examples of ways in which the proposed approach could cross-correlate a number of different types of information into an integrated assessment of the information present in the collected imagery. This type of data fusion approach would also greatly increase the robustness of semi-automated image interpretation workflows.
In light of the discussion presented above, and given the capabilities of GEOBIA applications with regard to feature detection and the need for a processing chain which includes a level of automation that can deal with the high spatial, spectral and temporal volumes of data being acquired by such a system, this paper thus suggests using a largely GEOBIA-based approach to distinguish regions of possible vegetation and soil marks from their surroundings. While a number of open-source applications exist for such tasks (e.g., Orfeo Toolbox [167] or InterIMAGE [168]) and have proven applicable in certain situations [169], Trimble’s eCognition software [170] is currently the most robust application available for such tasks. eCognition provides a suite of advanced image analysis tools along with integrated support for writing data directly to spatial database applications. While a GEOBIA approach is by no means a magic wand, nor is it the only solution to automated classification (e.g., emerging experiments with artificial neural networks), we use it here as a possible solution to exemplify how specialised algorithms can assist the archaeological interpretative mapping of large datasets. For some components of an approach such as the one described above, pixel-based or template matching approaches could be sufficient or even preferable. In many image analysis applications, including the ones mentioned above, it is possible to use a combination of such approaches. In all likelihood, an eventual (semi)automated image analysis approach would rely on a combination of such methodologies. Nevertheless, we see GEOBIA applications as having the potential to play an important role in the computer-aided detection of archaeological objects.
This semi-automated hierarchical approach is ideal as a pre-interpretative mapping step. The user is relieved from labour-intensive manual image segmentation and can focus their attention on the final interpretation of already pre-segmented objects. For example, the accurate detection and mapping of individual archaeological features may be secondary to the need to detect general objects of archaeological interest [160]. In this way, exclusively manual inspection is shortcut, which is of the utmost importance if one wants to make effective use of such complex and extensive datasets [171]. Semi-automated extraction of features means that larger areas can be investigated with higher detail to develop a coherent picture of the past. Moreover, setting up classification schemes will make archaeologists more aware of the possible inconsistencies in their interpretation approach, since developing rule sets forces the interpreter to properly define what is looked for [172]. The output of this GEOBIA approach will be stored in the several application-specific GDBs (Figure 6). As the application-specific GDBs store very different information, each GEOBIA rule set will need to be tailored to the specific nature of the dataset. For example, as the crop management GDB only has to visualise the fields with crops and their status (vigorous or stressed), classification approaches will be simpler than those for the geo-cultural GDB. After manually fine-tuning the results from the GEOBIA routines—for which the radiometrically corrected and contrast enhanced aerial images will be the input alongside other (derived) data layers—and combination with other sources stored in the editing GDB (Figure 6), flight-specific interpretative maps can be generated. The combination of all interpretation maps can then produce a final integrated interpretation of the whole study region. Both the individual and final interpretation maps can be stored in the geo-cultural mapping and spatial analysis GDB, after which the final results are deposited in the cultural resource management GDB (Figure 6). Whereas the former GDB would thus be used to perform spatio-temporal analyses on the data and draw relevant geo-archaeological conclusions, managing all known cultural resources and related policy development would be the main aim of the latter.
6. Discussion
Our modern environment contains the present remains of countless traces of past land use and natural processes. These traces manifest themselves in numerous ways, appearing as vegetation and soil marks in agricultural land, upstanding earthwork remains hidden within our modern forests, the inherited layout of field systems, braided systems of palaeochannels, or any of the other myriad relict manifestations of human interaction with, and natural alteration of, the land surface. Each of these relict traces of the past in the present, large or small, lends character to its environment through the perceptive lens we use to value our relationship to our surroundings and our place in the world. Together, these trace elements of the past and our perception of them form what we collectively call “landscape”. Therefore, when we, archaeologists, speak of landscapes, we invoke a multivariate construct whose entities are both qualitative and quantitative, simultaneously rooted in the physical traces of the past and the interpretive nature of how we experience them. Aerial archaeology is a practice that enables us to collect important spatial information about landscapes as a basis for interpretation, and the record this view produces is an integral aid to developing our understanding of how, why and where people did what they did in the past. However, in many ways the praxis of archaeological aerial photography remains a “craft tradition”, much like many excavation and interpretation practices in field archaeology [18], whose recursive actions inadvertently affect how we see archaeological resources and create methodological and interpretive holes in our perception of the present remains of the past.
Despite the fact that information gained from aerial photography has been transforming human understanding of the physical environment and cultural-archaeological landscapes for decades, it has always been difficult to assess zones without any recorded archaeology. Areas that are prone to vegetation marks will very often deliver, but what about those regions in which marks have never manifested? Was this the result of the soil conditions or did the aerial photographer simply miss the very faint features? Or did the photographer not see them simply because she/he had not “learned” to see them yet and therefore did not consider a certain area important enough to image? Although GNSS track logs can tell us where an aircraft has flown, it is impossible to know where the observers have looked and how attentive they were. For all the spatial data we can capture, it is equally impossible for us to quantify the observer’s frame of mind and to deduce the decision-making process that results in the images we end up with for interpretation. In his 1978 paper, Palmer tackled the issue of extracting meaningful settlement distribution patterns from such biased aerial photo collections, pointing out that “… for analysis of settlement type, function and distribution, the validity of the results will increase with the percentage sample taken ...” and “… optimum information may only be recoverable from analysis of the total, or near total, information available and an understanding of why that information, and only that information, was recovered” [173]. More recently, Cowley also gave his insight on this matter. Although he clearly states that survey methodology is only one of the many factors that produce false patterning in the archaeological record, it is evident that particular distributions of crop mark sites are most likely even reinforced by successive sorties of observer-based reconnaissance [15,123,174]. In the end, it is clear that it becomes very difficult to infer any form of large area landscape or settlement activity from the resulting visual record when the main question related to every second photograph is “Why has only this field been photographed, and not the neighbouring one(s)?”.
Through the acquisition of geographically unbiased (vertical) photographs in the right spectral bands, information can be extracted that allows us to better or more reliably understand past settlement patterns and human interaction with the environment. We do, however, stress again that a new approach to archaeological airborne data acquisition alone is not the only solution needed. Only when archaeologists are also provided with easily implementable methods for aerial photo orthorectification as well as data management and processing routines will the enormous amount of valuable data on geo-archaeological landscapes be accessible for interpretative mapping. Coupling the total coverage approach with the semi-automatic multispectral image matching and orthorectification pipeline outlined here would also mean that there is never a lack of decent ground control points. This issue is still very often encountered in the observer-directed approach. Not only must the photographer make sure that everything of possible geo-archaeological relevance is imaged, the process is further complicated by the need for proper zooming and framing, so that the photograph features sufficient, well-defined objects that can serve as ground control points to allow for its proper georeferencing. Once orthorectified, the imagery should be subjected to a combined approach of vegetation indices computation and additional contrast enhancement algorithms to markedly improve the visual quality of the aerial imagery and boost their “readability”. Among other sources, these optimised orthophotographs also form the input for the subsequent object-based image analysis routines. The latter are proposed as a pre-interpretative mapping step before the final interpretative mapping is generated.
Although some of these processes may introduce other forms of bias, the process outlined here can nevertheless remove the bias induced via selective geographical coverage from consideration. Furthermore, analysing the amalgam of all flight-specific interpretations should seriously help to move beyond the lack of data, false patterning, many entangled biases and resulting misinterpretations of the past that are unavoidably created by the current practice of archaeological airborne photography. In the end, the pipeline presented here would be able to generate knowledge in at least three domains: (I) the visible remains of the archaeological and physical landscape; (II) the available cultural resources and their management; and (III) the distribution of crops and their vigour. As seen in Figure 5 and Figure 6, the information generated from the proposed workflow would reside in specific spatial databases. Although only the data that reside in the geo-cultural GDB will normally be the topic of further archaeological research, the other spatial databases can be made accessible to anyone with an interest (e.g., through specifically created web map applications). This would not only provide useful information for a wider range of users, it could also have a positive effect on the general understanding of the landscape and allow archaeologists to tackle very specific issues. For instance, if farmers are allowed to extract information about the vigour of their crops from the crop GDB, they might provide their crop records and give permission for targeted, in-situ field checks (e.g., field spectrometer measurements). Upon combination with the flight-specific interpretation maps, these pieces of information would allow users to draw unique and powerful conclusions regarding the (vegetation-, period- or soil-related) occurrence of vegetation marks. In addition, the conditions governing the hitherto unresponsive, archaeologically “empty” parts of the landscape would systematically acquire an explanation with a high degree of integrity and an archaeological meaning instead of being attributed solely to environmental factors or the way archaeological aerial prospection has been executed.
When interest from urban or rural planners and local decision makers exists, other datasets can be generated as well. One could think of a complete land cover matrix for the local communities, detailing the amount of pavements and tree canopy, the percentage of vegetated ground or the amount of fields under agriculture. Although this information does not have to be stored in the crop management database by default, it could nevertheless be generated within the proposed object-based classification workflow. In contrast to archaeological applications of semi-automated feature detection, these types of land use/land cover applications are some of the most common remote sensing image analysis tasks, and could be adapted from existing routines.
Of course, the implementation of such an acquisition-processing-management approach will take time. Various hurdles, including a change in mentality, have to be overcome. It should also go without saying that national and even regional mapping projects will find it impossible to exhaustively cover everything with the aforementioned approach from the very beginning onwards. However, if we, as archaeologists, fail to learn from the many methodological achievements in other disciplines that use remote sensing data, we run the risk of locking ourselves into a recursive loop of geospatially-biased data collection and cumbersomely slow single-image-based workflows that can (and already do) have a significant effect on the interpretation of the visible remains of the archaeological record and their place within the landscape.
7. Conclusions
Landscape archaeology studies and interprets the complex ways by which people have consciously and unconsciously perceived, organised and altered their environment. Shaping the landscape has been done by deploying a variety of practices for a range of purposes: economic, political, religious, social as well as subsistence undertakings. In turn, past people were also constrained, influenced or inspired by their natural surroundings. Aerial photographs and their interpretation are often considered central materials for unravelling this past engagement with the landscape. However, in order to see the bigger picture, the view from the air needs to be more complete. This is only possible when archaeological aerial prospection moves beyond the false patterning and biases that are currently created by the way in which reconnaissance sorties are carried out.
This paper has proposed a fundamental change to the way in which archaeological aerial photographs are commonly collected, processed and interpreted. In order to accomplish this and to advance the use of aerial imagery within the discipline of landscape archaeology, it is of vital importance that standard remote sensing practices and achievements as well as the latest photographic imaging developments are adopted by aerial archaeologists. Since the need for a completely new approach to aerial reconnaissance flights is paramount, we have proposed a practical implementation of a novel airborne imaging system for blanket vertical photography in selected spectral bands, together with the complete processing and management back-ends that should deal with the large amounts of acquired data. In short, a cutting-edge small-format digital still camera such as the Nikon D810 can be teamed up with a filter slider-equipped ALPA FPS to acquire data in both the visible and invisible domains, capturing spectral data in small, vegetation and soil mark-sensitive spectral bands as well as in the very common wavebands of the visible spectrum. Not only do its core requirements make the proposed imaging system very customisable, the embedded technologically-different but complementary data acquisition systems open up a wide variety of interesting and new research topics. Furthermore, the semi-automated data processing, interpretation and management system outlined here provides practical and implementable structure for ensuring data collected with this system are readily available for use in (archaeological) geospatial applications.
The very way in which we collect data has direct effects on not only what we see but also how we see it. By tackling the very core concepts of geographically-biased aerial archaeological photography and proposing new imaging technologies, data handling methodologies and processing procedures, this paper gives the authors’ personal opinion on how they think that the field of aerial archaeology and specifically aerial photography could evolve during the next decade if attaining a more complete visual record of the durable effects of human impact on the environment is an important aim. A change such as this could have a dramatic effect on the future of landscape archaeology, where accurate, detailed and coherent GIS-based maps of whole regions can add important information for directing archaeological research and cultural heritage management. Since this discipline has already missed many opportunities to re-invent itself, it is now really time for aerial archaeology to shift its focus in order to generate fewer method dependent questions and more reliable answers.
Acknowledgments
The authors would like to thank Dave Cowley and Michael Doneus for their useful feedback on a first draft of this paper. Michael Pregesbauer gave valuable insight concerning aircraft regulations, while Ralph Rosenbauer is heartily thanked for the many discussions on the feasibility of the new data acquisition approach and the hardware needed for its execution. Not all people that have provided feedback, or all the members of the authors’ host institutions (LBI ArchPro and the Department of Prehistoric and Historical Archaeology at the University of Vienna), necessarily share the opinions expressed in this paper, which are very much those of the authors. Finally, it remains important to say that the authors are also not affiliated with any of the brands or products mentioned in the text.
Author Contributions
Geert Verhoeven created the general structure of the text, generated all illustrations and wrote the parts on image acquisition, image correction and data management. Those parts have, however, also been revised by Christopher Sevara, who mainly wrote the section on object-based interpretative mapping. Both Geert and Christopher wrote the introduction, discussion and conclusion.
Conflicts of Interest
The authors declare no conflict of interest.
References
- Remondino, F.; Stylianidis, E. Cultural Heritage Documentation with RPAS/UAV. In 3D Recording, Documentation and Management of Cultural Heritage; Stylianidis, E., Remondino, F., Eds.; Whittles Publishing: Dunbeath, UK, 2016; pp. 369–381. [Google Scholar]
- Verhoeven, G. Providing an archaeological bird’s-eye view: An overall picture of ground-based means to execute Low-Altitude Aerial Photography (LAAP) in Archaeology. Archaeol. Prospect. 2009, 16, 233–249. [Google Scholar] [CrossRef]
- Verhoeven, G. Beyond Conventional Boundaries: New Technologies, Methodologies, and Procedures for the Benefit of Aerial Archaeological Data Acquisition and Analysis. Ph.D. Thesis, Ghent University, Ghent, Belgium, 13 May 2009. [Google Scholar]
- Verhoeven, G. Are we there yet? An assessment of archaeological passive airborne optical imaging approaches and some thoughts. J. Archaeol. Sci. 2016, in press. [Google Scholar]
- Reeves, D.M. Aerial photography and archaeology. Am. Antiq. 1936, 2, 102–107. [Google Scholar] [CrossRef]
- Palmer, R. If they used their own photographs they would not take them like that. In From the Air: Understanding Aerial Archaeology; Brophy, K., Cowley, D.C., Eds.; Tempus: Stroud, UK, 2005; pp. 94–116. [Google Scholar]
- Cowley, D.C. Creating the cropmark archaeological record in East Lothian, South-East Scotland. In Prehistory Without Borders: The Prehistoric Archaeology of the Tyne-Forth Region; Crellin, R., Fowler, C., Tipping, R., Eds.; Oxbow Books: Oxford, UK, 2016; pp. 59–70. [Google Scholar]
- Knapp, A.B.; Ashmore, W. Archaeological landscapes: Constructed, conceptualized, ideational. In Archaeologies of Landscape: Contemporary Perspectives; Ashmore, W., Knapp, A.B., Eds.; Blackwell: Malden, MA, USA, 1999; pp. 1–30. [Google Scholar]
- Herring, P. The past informs the future; landscape archaeology and historic landscape characterisation in the UK. In Landscape Archaeology between Art and Science: From a Multi- to an Interdisciplinary Approach; Kluiving, S.J., Gutmann-Bond, E.B., Eds.; Amsterdam University Press: Amsterdam, The Netherlands, 2012; pp. 485–501. [Google Scholar]
- Johnson, M. Ideas of Landscape; Blackwell: Oxford, UK, 2007. [Google Scholar]
- Cleere, H. The evaluation of cultural landscapes: The role of ICOMOS. In Cultural Landscapes of Universal Value: Components of a Global Strategy; von Droste, B., Plachter, H., Rössler, M., Eds.; Gustav Fischer in cooperation with United Nations Educational, Scientific and Cultural Organization: Stuttgart, Germany; New York, NY, USA, 1995; pp. 50–59. [Google Scholar]
- Rössler, M. World heritage cultural landscapes: A UNESCO flagship programme 1992–2006. Landsc. Res. 2006, 31, 333–353. [Google Scholar] [CrossRef]
- Brophy, K.; Cowley, D.C. From the Air: Understanding Aerial Archaeology; Tempus: Stroud, UK, 2005. [Google Scholar]
- Hanson, W.S. The future of aerial archaeology (or are algorithms the answer?). In Remote Sensing for Archaeology and Cultural Heritage Management, Proceedings of the 1st International European Association of Remote Sensing Laboratories Workshop, Rome, Italy, 30 September–4 October 2008; Lasaponara, R., Masini, N., Eds.; Arracne: Rome, Italy, 2008; pp. 47–50. [Google Scholar]
- Cowley, D.C. What kind of gaps? Some approaches to understanding bias in remote sensing data. Archeologia Aerea. Studi di Aerotopografia Archeologica 2013, 7, 76–88. [Google Scholar]
- Rączkowski, W. Why interpretation? Chairman’s Piece. AARGnews 2009, 39, 5–8. [Google Scholar]
- Rączkowski, W. Beyond the technology: Do we need “meta-aerial archaeology”? In Aerial Archaeology: Developing Future Practice; Bewley, R., Rączkowski, W., Eds.; IOS Press: Amsterdam, The Netherlands, 2002; Volume 337, pp. 311–327. [Google Scholar]
- Bradley, R. “To see is to have seen”: Craft traditions in British field archaeology. In The Cultural Life of Images: Visual Representation in Archaeology; Molyneaux, B.L., Ed.; Routledge: London, UK; New York, NY, USA, 1997; pp. 62–72. [Google Scholar]
- Nurminen, K. Oblique aerial photographs—An “old-new” data source. Photogramm. J. Finl. 2015, 24, 1–19. [Google Scholar] [CrossRef]
- Verhoeven, G. BRDF and its impact on aerial archaeological photography. Archaeol. Prospect. 2016, in press. [Google Scholar]
- Palmer, R. Seventy-five Years v. ninety minutes: Implications of the 1996 Bedfordshire vertical aerial survey on our perceptions of clayland archaeology. In Populating Clay Landscapes; Mills, J., Palmer, R., Eds.; Tempus: Stroud, UK, 2007; pp. 88–103. [Google Scholar]
- Palmer, R. Uses of vertical photographs for archaeological studies in parts of lowland England. In Landscapes through the Lens: Aerial Photographs and Historic Environment; Cowley, D.C., Standring, R.A., Abicht, M.J., Eds.; Oxbow Books: Oxford, UK; Oakville, ON, Canada, 2010; Volume 2, pp. 43–54. [Google Scholar]
- Verhoeven, G.; Vermeulen, F. Engaging with the canopy: Multi-dimensional vegetation mark visualisation using archived aerial images. Remote Sens. 2016, 8, 752. [Google Scholar] [CrossRef]
- Bewley, R.; Rączkowski, W. Past achievements and prospects for the future development of aerial archaeology: An introduction. In Aerial Archaeology: Developing Future Practice; Bewley, R., Rączkowski, W., Eds.; IOS Press: Amsterdam, The Netherlands, 2002; Volume 337, pp. 1–8. [Google Scholar]
- Musson, C.; Palmer, R.; Campana, S. Flights into the Past: Aerial Photography, Photo Interpretation and Mapping for Archaeology; Aerial Archaeological Research Group-ArcLand: Heidelberg, Germany, 2013. [Google Scholar]
- Warner, W.S.; Graham, R.W.; Read, R.E. Small Format Aerial Photography; Whittles Publishing: Caithness, UK, 1996. [Google Scholar]
- Aber, J.S.; Marzolff, I.; Ries, J.B. Small-Format Aerial Photography: Principles, Techniques and Geoscience Applications; Elsevier Science: Amsterdam, The Netherlands, 2010. [Google Scholar]
- Har, D.; Son, Y.; Lee, S. SLR Digital camera for forensic photography. In Sensors and Camera Systems for Scientific, Industrial, and Digital Photography Applications V; Blouke, M.M., Sampat, N., Motta, R.J., Eds.; Society for Imaging Science and Technology (IS&T)-The International Society for Optical Engineering (SPIE): Bellingham, WA, USA, 2004; Volume 5301, pp. 276–284. [Google Scholar]
- Verhoeven, G.; Smet, P.F.; Poelman, D.; Vermeulen, F. Spectral characterization of a digital still camera’s NIR modification to enhance archaeological observation. IEEE Trans. Geosci. Remote Sens. 2009, 47, 3456–3468. [Google Scholar] [CrossRef]
- Nakamura, J. Basics of image sensors. In Image Sensors and Signal Processing for Digital Still Cameras; Nakamura, J., Ed.; Taylor & Francis: Boca Raton, FL, USA, 2006; pp. 55–93. [Google Scholar]
- Bayer, B.E. Color. Imaging Array. U.S. Patent 3,971,065, 20 July 1976. [Google Scholar]
- Microsoft. Ultracam. 2015. Available online: https://www.microsoft.com/en-us/ultracam (accessed on 4 March 2016).
- Intergraph Corporation. Image Acquisition. 2016. Available online: http://www.intergraph.com/photo/ia.aspx (accessed on 4 March 2016).
- Leica Geosystems AG. Leica ADS100 Airborne Digital Sensor. 2016. Available online: http://leica-geosystems.com/products/airborne-systems/cameras-large-format/leica-ads100-airborne-digital-sensor (accessed on 4 March 2016).
- Phase One. iXU-R & iXU Aerial Cameras. 2013. Available online: http://industrial.phaseone.com/100MP.aspx (accessed on 4 March 2016).
- Trimble Navigation Limited. Trimble Aerial Camera. 2016. Available online: http://www.trimble.com/Imaging/Trimble-Aerial-Camera.aspx (accessed on 4 March 2016).
- Jacobsen, K. Development of digital aerial cameras. In Proceedings of the ISPRS Istanbul Workshop 2010, WG I/4, Modeling of Optical Airborne and Space Borne Sensors, Istanbul, Turkey, 11–13 October 2010.
- Petrie, G. Systematic oblique aerial photography using multiple digital frame cameras. Photogramm Eng. Remote Sens. 2009, 75, 102–107. [Google Scholar]
- Rupnik, E.; Nex, F.; Remondino, F. Oblique multi-camera systems-orientation and dense matching issues. Int. Arch. Photogramm. Remote Sens. Spat. Inf. Sci. 2014, XL-3/W1, 107–114. [Google Scholar] [CrossRef]
- Lemmens, M. Digital oblique aerial cameras (1): A survey of features and systems. GIM Int. Glob. Mag. Geomat. 2014, 28, 20–21, 23–25. [Google Scholar]
- Lemmens, M. Digital Oblique Aerial Cameras (2): A Survey of Features and Systems. GIM Int. Glob. Mag. Geomat. 2014, 28, 20. [Google Scholar]
- Tetracam. Multi-Spectral Imaging Systems. Available online: http://www.tetracam.com/Products1.htm (accessed on 23 February 2016).
- MosaicMill. EnsoMOSAIC Aerial Mapping System. Available online: http://www.mosaicmill.com/products/complete.html (accessed on 1 March 2016).
- SkyIMD Inc. Aerial Imaging Pod. Available online: http://skyimd.com/aerial_imaging_pod.html (accessed on 1 March 2016).
- Geodetska Druzba. GEONISS Airborne Digital Sensor. Available online: http://www.geoniss.com/ (accessed on 2 October 2016).
- Klau Geomatics. Aerial Mapping Systems. Available online: http://geomatics.com.au/ (accessed on 1 July 2016).
- Capture Integration. Phase One IQ260 Achromatic in Action. 2013. Available online: https://captureintegration.com/phase-one-iq260-achromatic-in-action/ (accessed on 30 September 2016).
- ALPA of Switzerland. ALPA 12 FPS, the Matchless. 2015. Available online: https://www.alpa.ch/en/article/alpa-12-fps (accessed on 2 October 2016).
- Beckhusen, D. Technik|ALPA 12 FPS: Die Große Freiheit. Photo Int. 2013, 72–74. [Google Scholar]
- Caduff, R.; Rieke-Zapp, D.H. Registration and visualisation of deformation maps from terrestrial radar Interferometry using photogrammetry and structure from motion. Photogramm. Rec. 2014, 29, 167–186. [Google Scholar] [CrossRef]
- Rieke-Zapp, D.H. A digital medium-format camera for metric applications-Alpa 12 Metric. Photogramm. Rec. 2010, 25, 283–298. [Google Scholar] [CrossRef]
- Verhoeven, G.; Doneus, M. Balancing on the borderline—A low-cost approach to visualize the red-edge shift for the benefit of aerial archaeology. Archaeol. Prospect. 2011, 18, 267–278. [Google Scholar] [CrossRef]
- Bennett, R.; Welham, K.; Hill, R.A.; Ford, A.L.J. The application of vegetation Indices for the prospection of archaeological features in grass-dominated environments. Archaeol. Prospect. 2012, 19, 209–218. [Google Scholar] [CrossRef]
- Agapiou, A.; Hadjimitsis, D.G.; Georgopoulos, A.; Sarris, A.; Alexakis, D.D. Towards an archaeological index: Identification of the spectral regions of stress vegetation due to buried archaeological remains. In Progress in Cultural Heritage Preservation; Ioannides, M., Fritsch, D., Leissner, J., Davies, R., Remondino, F., Caffo, R., Eds.; Springer: Berlin/Heidelberg, Germany, 2012; Volume 7616, pp. 129–138. [Google Scholar]
- Curcio, J.A.; Petty, C.C. The near-infrared absorption spectrum of liquid water. J. Opt. Soc. Am. 1951, 41, 302–304. [Google Scholar] [CrossRef]
- Jones, R.J.; Evans, R. Soil and Crop Marks in the recognition of archaeological sites by air photography. In Aerial Reconnaissance for Archaeology; Wilson, D.R., Ed.; The Council for British Archaeology: London, UK, 1975; Volume 12, pp. 1–11. [Google Scholar]
- Avery, T.E.; Lyons, T.R. Remote Sensing. Aerial and Terrestrial Photography for Archeologists; Cultural Resources Management Division: Washington, DC, USA, 1981. [Google Scholar]
- Rinker, J.N. Some technical aspects of film emulsions in relation to the analysis and interpretation of aerial photographs. In Aerial Reconnaissance for Archaeology; Wilson, D.R., Ed.; The Council for British Archaeology: London, UK, 1975; Volume 12, pp. 32–46. [Google Scholar]
- Lyons, T.R.; Avery, T.E. Remote Sensing: A Handbook for Archaeologists and Cultural Resource Managers; National Park Service: Washington, DC, USA, 1977. [Google Scholar]
- Sandmeier, S.R.; Itten, K.I. A Field Goniometer System (FIGOS) for acquisition of hyperspectral BRDF data. IEEE Trans. Geosci. Remote Sens. 1999, 37, 978–986. [Google Scholar] [CrossRef]
- Hatfield, J.L.; Gitelson, A.A.; Schepers, J.S.; Walthall, C.L. Application of spectral remote sensing for agronomic decisions. AGRON J. 2008, 100. [Google Scholar] [CrossRef]
- Buschmann, C.; Nagel, E. In vivo spectroscopy and internal optics of leaves as basis for remote sensing of vegetation. Int. J. Remote Sens. 1993, 14, 711–722. [Google Scholar] [CrossRef]
- Gitelson, A.A.; Merzlyak, M.N. Quantitative estimation of chlorophyll-a using reflectance spectra: Experiments with autumn chestnut and maple leaves. J. Photochem. Photobiol. B Biol. 1994, 22, 247–252. [Google Scholar] [CrossRef]
- Gitelson, A.A.; Merzlyak, M.N. Signature analysis of leaf reflectance spectra: Algorithm development for remote sensing of chlorophyll. J. Plant Physiol. 1996, 148, 494–500. [Google Scholar] [CrossRef]
- Gitelson, A.A.; Gritz, Y.; Merzlyak, M.N. Relationships between leaf chlorophyll content and spectral reflectance and algorithms for non-destructive chlorophyll assessment in higher plant leaves. J. Plant. Physiol. 2003, 160, 271–282. [Google Scholar] [CrossRef] [PubMed]
- Thenkabail, P.S.; Smith, R.B.; De Pauw, E. Evaluation of narrowband and broadband vegetation indices for determining optimal hyperspectral wavebands for agricultural crop characterization. Photogramm. Eng. Remote Sens. 2002, 68, 607–621. [Google Scholar]
- Zhao, D.; Li, J.; Qi, J. Identification of red and NIR spectral regions and vegetative indices for discrimination of cotton nitrogen stress and growth stage. Comput. Electron. Agric. 2005, 48, 155–169. [Google Scholar] [CrossRef]
- Schepers, J.S.; Blackmer, T.M.; Wilhelm, W.W.; Resende, M. Transmittance and reflectance measurements of cornleaves from plants with different nitrogen and water supply. J. Plant Physiol. 1996, 148, 523–529. [Google Scholar] [CrossRef]
- Datt, B. Visible/near infrared reflectance and chlorophyll content in Eucalyptus leaves. Int. J. Remote Sens. 1999, 20, 2741–2759. [Google Scholar] [CrossRef]
- Carter, G.A.; Estep, L. General spectral characteristics of leaf reflectance responses to plant stress and their manifestation at the landscape scale. In From Laboratory Spectroscopy to Remotely Sensed Spectra of Terrestrial Ecosystems; Muttiah, R.S., Ed.; Kluwer Academic Publishers: Dordrecht, The Netherlands, 2002; pp. 271–293. [Google Scholar]
- Carter, G.A. Responses of leaf spectral reflectance to plant stress. Am. J. Bot. 1993, 80, 239–243. [Google Scholar] [CrossRef]
- Carter, G.A.; Cibula, W.; Miller, R.L. Narrow-band reflectance imagery compared with thermal imagery for early detection of plant stress. J. Plant Physiol. 1996, 148, 515–522. [Google Scholar] [CrossRef]
- Gitelson, A.A.; Merzlyak, M.N.; Lichtenthaler, H.K. Detection of red edge position and chlorophyll content by reflectance measurements near 700 nm. J. Plant Physiol. 1996, 148, 501–508. [Google Scholar] [CrossRef]
- Carter, G.A. Reflectance wavebands and indices for remote estimation of photosynthesis and stomatal conductance in pine canopies. Remote Sens. Environ. 1998, 63, 61–72. [Google Scholar] [CrossRef]
- Smith, W.J. Modern Optical Engineering: The Design of Optical Systems; McGraw-Hill: New York, NY, USA, 1966. [Google Scholar]
- Escobar, D.E.; Everitt, J.H.; Noriega, J.R.; Cavazos, I.; Davis, M.R. A twelve-band airborne digital video imaging system (ADVIS). Remote Sens. Environ. 1998, 66, 122–128. [Google Scholar] [CrossRef]
- Everitt, J.H.; Escobar, D.E.; Noriega, J.R.; Cavazos, I.; Davis, M.R. A video system capable of simulating Landsat TM 5, 4, 3 imagery. Remote Sens. Environ. 1997, 62, 40–45. [Google Scholar] [CrossRef]
- Alsadik, B.; Gerke, M.; Vosselman, G. Efficient use of video for 3D modelling of cultural heritage objects. ISPRS Ann. Photogramm. Remote Sens. Spat. Inf. Sci. 2015, II-3/W4, 1–8. [Google Scholar] [CrossRef]
- Rupnik, E.; Jansa, J. Off-the-shelf videogrammetry—A success story. Int. Arch. Photogramm. Remote Sens. Spat. Inf. Sci. 2014, XL-3/W1, 99–105. [Google Scholar] [CrossRef]
- ESRI. ArcGIS Full Motion Video. Available online: http://www.esri.com/products/arcgis-capabilities/imagery/full-motion-video (accessed on 10 March 2016).
- SBG Systems. Ellipse-N: Miniature INS/GPS. 2016. Available online: http://www.sbg-systems.com/products/ellipse-n-miniature-ins-gps (accessed on 10 March 2016).
- Xsens Technologies B.V. MTi-G-710. Available online: https://www.xsens.com/products/mti-g-710/ (accessed on 10 March 2016).
- Cessna-Textron Aviation. Cessna Textron Aviation. Available online: http://cessna.txtav.com/ (accessed on 5 October 2016).
- Johanneum Research. Remote Sensing and Evironmental Monitoring. Available online: https://www.joanneum.at/en/digital/research-areas/remote-sensing-and-evironmental-monitoring.html (accessed on 7 October 2016).
- Sandau, R. (Ed.) Digital Airborne Camera: Introduction and Technology; Springer: Dordrecht, The Netherlands, 2010.
- TopoFlight Systems. Available online: http://www.topoflight.com/ (accessed on 19 February 2016).
- Verhoeven, G.; Doneus, M.; Briese, C.; Vermeulen, F. Mapping by matching: A computer vision-based approach to fast and accurate georeferencing of archaeological aerial photographs. J. Archaeol. Sci. 2012, 39, 2060–2070. [Google Scholar] [CrossRef]
- Wolf, P.R.; Dewitt, B.A. Elements of Photogrammetry with Applications in GIS, 3rd ed.; McGraw-Hill: Boston, MA, USA, 2000. [Google Scholar]
- Trimble Navigation Limited. Trimble Inpho. Available online: http://www.trimble.com/imaging/inpho.aspx (accessed on 4 March 2016).
- PCI Geomatics. Geomatica Professional. Available online: http://www.pcigeomatics.com/software/geomatica/professional (accessed on 4 March 2016).
- Hartley, R.; Zisserman, A. Multiple View Geometry in Computer Vision, 2nd ed.; Cambridge University Press: Cambridge, UK, 2003. [Google Scholar]
- Ullman, S. The interpretation of structure from motion. Proc. R. Soc. B Biol. Sci. 1979, 203, 405–426. [Google Scholar] [CrossRef]
- Szeliski, R. Computer Vision: Algorithms and Applications; Springer: New York, NY, USA, 2011. [Google Scholar]
- Remondino, F.; Spera, M.G.; Nocerino, E.; Menna, F.; Nex, F. State of the art in high density image matching. Photogramm. Rec. 2014, 29, 144–166. [Google Scholar] [CrossRef]
- Haala, N. The landscape of dense image matching algorithms. In Photogrammetric Week 2013; Fritsch, D., Ed.; Institut für Photogrammetrie (IFP): Stuttgart, Germany, 2013; pp. 271–284. [Google Scholar]
- Goesele, M.; Curless, B.; Seitz, S.M. Multi-view stereo revisited. In Proceedings of the 2006 IEEE Computer Society Conference on Computer Vision and Pattern Recognition (CVPR’06), New York, NY, USA, 17–22 June 2006; IEEE Computer Society Press: Los Alamitos, CA, USA, 2006; Volume 2, pp. 2402–2409. [Google Scholar]
- Karel, W.; Doneus, M.; Verhoeven, G.; Briese, C.; Ressl, C.; Pfeifer, N. Oriental: Automatic geo-referencing and ortho-rectification of archaeological aerial photographs. ISPRS Ann. Photogramm. Remote Sens. Spat. Inf. Sci. 2013, II-5/W1, 175–180. [Google Scholar] [CrossRef]
- Karel, W.; Doneus, M.; Briese, C.; Verhoeven, G.; Pfeifer, N. Investigation on the Automatic Geo-Referencing of Archaeological UAV Photographs by Correlation with Pre-Existing Ortho-Photos. Int. Arch. Photogramm. Remote Sens. Spat. Inf. Sci. 2014, XL-5, 307–312. [Google Scholar] [CrossRef]
- Lo Brutto, M.; Borruso, A.; D’Argenio, A. UAV systems for photogrammetric data acquisition of archaeological sites. Int. J. Hérit. Digit. Era 2012, 1, 7–13. [Google Scholar] [CrossRef]
- Scollar, I.; Giradeau-Montaut, D. Georeferenced orthophotos and DTMs from multiple oblique images. AARGnews 2012, 44, 12–17. [Google Scholar]
- Verhoeven, G.; Taelman, D.; Vermeulen, F. Computer vision-based orthophoto mapping of complex archaeological sites: The ancient quarry of Pitaranha (Portugal-Spain). Archaeometry 2012, 54, 1114–1129. [Google Scholar] [CrossRef]
- Verhoeven, G. Taking computer vision aloft—Archaeological three-dimensional reconstructions from aerial photographs with PhotoScan. Archaeol. Prospect. 2011, 18, 67–73. [Google Scholar] [CrossRef]
- Costa-García, J.M.; Casal García, R. Fotografía aérea histórica, satelital moderna y LiDAR aéreo en algunos recintos militares romanos de Castilla y León. Portvgalia Nova Série 2015, 36, 143–158. [Google Scholar]
- Applanix Corporation. POSAV. 2016. Available online: http://www.applanix.com/products/airborne/posav.html (accessed on 4 May 2016).
- IGI mbH. AEROcontrol. 2016. Available online: http://www.igi.eu/aerocontrol.html (accessed on 4 March 2016).
- Doneus, M.; Wieser, M.; Verhoeven, G.; Karel, W.; Fera, M.; Pfeifer, N. Automated archiving of archaeological aerial images. Remote Sens. 2016, 8, 209. [Google Scholar] [CrossRef]
- Applanix Corporation. Direct Mapping Solutions for UAVs. 2016. Available online: http://www.applanix.com/products/dms-uavs.htm (accessed on 28 September 2016).
- Mian, O.; Lutes, J.; Lipa, G.; Hutton, J.J.; Gavelle, E.; Borghini, S. Direct georeferencing on small unmanned aerial platforms for improved reliability and accuracy of mapping without the need for ground control points. Int. Arch. Photogramm. Remote Sens. Spat. Inf. Sci. 2015, XL-1/W4, 397–402. [Google Scholar] [CrossRef]
- Richter, R.; Schläpfer, D. Atmospheric/topographic correction for airborne imagery. ATCOR-4 User Guide. Version 6.2 BETA. Available online: http://www.dlr.de/eoc/Portaldata/60/Resources/dokumente/5_tech_mod/atcor4_manual_2012.pdf (accessed on 3 May 2016).
- Schowengerdt, R.A. Remote Sensing: Models and Methods for Image Processing, 3rd ed.; Academic Press: Burlington, MA, USA, 2007. [Google Scholar]
- Schläpfer, D.; Richter, R.; Hueni, A. Recent developments in operational atmospheric and radiometric correction of hyperspectral imagery. In Proceedings of the 6th European Association of Remote Sensing Laboratories SIG IS Workshop, Imaging Spectroscopy: Innovative Tool for Scientific and Commercial Environmental Applications, Tel-Aviv University, Tel-Aviv, Israel, 16–19 March 2009; EARSeL: Tel-Aviv, Israel, 2009. [Google Scholar]
- ITT Visual Information Solutions. ENVI—Atmospheric Correction Module: QUAC and FLAASH User’s Guide. Available online: http://www.exelisvis.com/portals/0/pdfs/envi/Flaash_Module.pdf (accessed on 9 September 2016).
- Gonzalez, R.C.; Woods, R.E. Digital Image Processing, 2nd ed.; Prentice-Hall: Upper Saddle River, NJ, USA, 2002. [Google Scholar]
- Zamperoni, P. Image enhancement. In Advances in Imaging and Electron Physics. Volume 92; Hawkes, P.W., Ed.; Academic Press: San Diego, CA, USA, 1995; pp. 1–77. [Google Scholar]
- Hatfield, J.L.; Prueger, J.H. Value of using different vegetative indices to quantify agricultural crop characteristics at different growth stages under varying management practices. Remote Sens. 2010, 2, 562–578. [Google Scholar] [CrossRef]
- Le Maire, G.; François, C.; Dufrêne, E. Towards universal broad leaf chlorophyll indices using PROSPECT simulated database and hyperspectral reflectance measurements. Remote Sens. Environ. 2004, 89, 1–28. [Google Scholar] [CrossRef]
- Boochs, F.; Kupfer, G.; Dockter, K.; Kühbauch, W. Shape of the red edge as vitality indicator for plants. Int. J. Remote Sens. 1990, 11, 1741–1753. [Google Scholar] [CrossRef]
- Ustin, S.L.; Roberts, D.A.; Gamon, J.A.; Asner, G.P.; Green, R.O. Using imaging spectroscopy to study ecosystem processes and properties. BioScience 2004, 54, 523–534. [Google Scholar] [CrossRef]
- Al-amri, S.S. Contrast stretching enhancement in remote sensing image. BIOINFO Sens. Netw. 2011, 1, 6–9. [Google Scholar]
- Zuiderveld, K. Contrast limited adaptive histogram equalization. In Graphics Gems IV; Heckbert, P.S., Ed.; Academic Press Professional: Boston, MA, USA, 1994; pp. 474–485. [Google Scholar]
- Exelis Visual Information Solutions. ENVI. Available online: http://www.exelisvis.com/IntelliEarthSolutions/GeospatialProducts/ENVI.aspx (accessed on 8 March 2016).
- Goetz, A.F.H. Three decades of hyperspectral remote sensing of the Earth: A personal view. Remote Sens. Environ. 2009, 113, S5–S16. [Google Scholar] [CrossRef]
- Cowley, D.C. What do the patterns mean? Archaeological distributions and bias in survey data. In The Age of Sensing; Forte, M., Campana, S., Eds.; Springer: New York, NY, USA, 2016. [Google Scholar]
- Lock, G.R.; Stančič, Z. (Eds.) Archaeology and Geographical Information Systems: A European Perspective; Taylor & Francis: London, UK, 1995.
- Conolly, J.; Lake, M.W. Geographical Information Systems in Archaeology; Cambridge University Press: Cambridge, UK, 2006. [Google Scholar]
- Wheatley, D.; Gillings, M. Spatial Technology and Archaeology: The Archaeological Applications of GIS; Taylor & Francis: New York, NY, USA, 2002. [Google Scholar]
- Tennant, E.W. A sample geodatabase structure for managing archaeological data and resources with ArcGIS. Tech. Briefs Hist. Archaeol. 2007, 2, 12–14. [Google Scholar]
- International Organization for Standardization. ISO 21127:2006: Information and Documentation—A Reference Ontology for the Interchange of Cultural Heritage Information; ICS: 3.524.030; International Organization for Standardization: Geneva, Switzerland, 2010. [Google Scholar]
- Cripps, P.; Greenhalgh, A.; Fellows, D.; May, K.; Robinson, D. Ontological Modelling of the Work of the Centre for Archaeology. CIDOC CRM Technical Paper. 2004. Available online: http://www.cidoc-crm.org/docs/Ontological_Modelling_Project_Report_%20Sep2004.pdf (accessed on 27 August 2013).
- CRM. The CIDOC Conceptual Reference Model. Available online: http://www.cidoc-crm.org/ (accessed on 16 August 2016).
- International Organization for Standardization. ISO 21127:2014: Information and Documentation—A Reference Ontology for the Interchange of Cultural Heritage Information; ICS: 3.524.030; International Organization for Standardization: Geneva, Switzerland, 2014. [Google Scholar]
- Binding, C.; May, K.; Tudhope, D. Semantic Interoperability in Archaeological Datasets: Data Mapping and Extraction Via the CIDOC CRM. In Research and Advanced Technology for Digital Libraries, Proceedings of the 12th European Conference, ECDL 2008, Aarhus, Denmark, 14–19 September 2008; Christensen-Dalsgaard, B., Castelli, D., Jurik, B.A., Lippincott, J., Eds.; Springer: Berlin, Germany, 2008; Volume 5173, pp. 280–290. [Google Scholar]
- Hiebel, G.; Hanke, K.; Hayek, I. Methodology for CIDOC CRM based data integration with spatial data. In Fusion of Cultures, In Proceedings of the 38th Annual Conference on Computer Applications and Quantitative Methods in Archaeology (CAA 2010), Granada, Spain, 6–9 April 2010; Contreras, F., Farjas, M., Melero, F.J., Eds.; Archaeopress: Granada, Spain, 2010; Volume 2494, pp. 1–8. [Google Scholar]
- Van Leusen, M.; van Gessel, S. Towards 3D GIS: Notes from the 2012 CAA-NL/DE chapter session “from 2.5 to 3 spatial dimensions”. In The Three Dimensions of Archaeology, Proceedings of the XVII Union Internationale des Sciences Préhistoriques et Protohistoriques World Congress, Volume 7/Sessions A4b and A12, Burgos, Spain, 1–7 September 2016; Kamermans, H., de Neef, W., Piccoli, C., Posluschny, A.G., Scopigno, R., Eds.; Archaeopress Publishing: Oxford, UK, 2016; pp. 33–37. [Google Scholar]
- Qiang, Y. Modelling Temporal Information in a Two-Dimensional Space: A Visualization Perspective. Ph.D. Thesis, Ghent University, Ghent, Belgium, 2012. [Google Scholar]
- IntraSIS. IntraSIS—Intra-Site Information System. Available online: http://www.intrasis.com (accessed on 4 March 2016).
- Wu, L.; Zhu, C.; Wang, X. Design and realization on the object-oriented remote sensing archaeological information system. In Proceedings of the 2011 International Conference on Remote Sensing, Environment and Transportation Engineering (RSETE), Nanjing, China, 24–26 June 2011; IEEE: Piscataway, NJ, USA, 2011; pp. 3050–3053. [Google Scholar]
- Doneus, M.; Fornwagner, U.; Kiedl, C. APIS-Archaeological Prospection Information System. In Archaeological Prospection, Proceedings of the 10th International Conference on Archaeological Prospection, Vienna, Austria, 29 May 2013–2 June 2013; Neubauer, W., Trinks, I., Salisbury, R.B., Einwögerer, C., Eds.; Austrian Academy of Sciences: Vienna, Austria, 2013; pp. 317–318. [Google Scholar]
- Winton, H.; Boutwood, Y.; Horne, P. Interpretation and Mapping from Aerial Photographs and Other Aerial Remote Sensed Dat. MoRPHE Project Planning Note 7. Swindon, UK, 2012. Available online: http://www.english-heritage.org.uk/publications/morphe-project-planning-note-7/morphe-ppn7.pdf (accessed on 10 September 2013).
- Environmental Systems Research Institute. Geodatabase Storage in Relational Databases. Available online: http://desktop.arcgis.com/en/arcmap/10.3/manage-data/gdb-architecture/geodatabase-storage-in-relational-databases.htm (accessed on 7 October 2016).
- The PostgreSQL Global Development Group. PostgreSQL. Available online: http://www.postgresql.org/ (accessed on 6 October 2016).
- PostGIS Project Steering Committee. PostGIS, Spatial and Geographic objects for PostgreSQL. Available online: http://postgis.net/ (accessed on 1 October 2016).
- Environmental Systems Research Institute. Using the PostGIS Geometry Type. Available online: http://webhelp.esri.com/arcgisdesktop/9.3/index.cfm?id=2777&pid=2762&topicname=Using_the_PostGIS_geometry_type (accessed on 26 August 2016).
- Butler, J.A. Designing Geodatabases for Transportation, 1st ed.; Environmental Systems Research Institute Press: Redlands, CA, USA, 2008. [Google Scholar]
- Pfoser, D.; Hadzilacos, T.; Faradouris, N.; Kyrimis, K. Spatial data management aspects in archaeological excavation documentation. In The European Information Society: Leading the Way with Geo-Information; Fabrikant, S.I., Wachowicz, M., Eds.; Springer: Berlin/Heidelberg, Germany, 2007; pp. 287–302. [Google Scholar]
- ArcTron 3D. aSPECT 3D. 2016. Available online: http://aspect.arctron.de/ (accessed on 29 September 2016).
- Nyerges, T.L.; Jankowski, P. Regional and Urban GIS: A Decision Support Approach; Guilford Press: New York, NY, USA, 2010. [Google Scholar]
- European Commission. INSPIRE-Infrastructure for Spatial Information in the European Community. 2016. Available online: http://inspire.jrc.ec.europa.eu/ (accessed on 8 October 2016).
- ESRI. ArcGIS for INSPIRE. 2016. Available online: http://www.esri.com/software/arcgis/arcgis-for-inspire (accessed on 7 October 2016).
- Pasquinucci, M.; Trément, F. (Eds.) Non-Destructive Techniques Applied to Landscape Archaeology; Oxbow Books: Oxford, UK, 2000.
- Cheetham, P.N. Noninvasive Subsurface mapping techniques, satellite and aerial imagery in landscape archaeology. In Handbook of Landscape Archaeology, 1st ed.; David, B., Thomas, J., Eds.; Left Coast: Walnut Creek, CA, USA, 2010; pp. 562–582. [Google Scholar]
- Doneus, M. Die hinterlassene Landschaft-Prospektion und Interpretation in der Landschaftsarchäologie; Verlag der Österreichischen Akademie der Wissenschaften: Wien, Austria, 2013. [Google Scholar]
- Cowley, D.C. In with the new, out with the old? Auto-extraction for remote sensing archaeology. In Proceedings of the Remote Sensing of the Ocean, Sea Ice, Coastal Waters, and Large Water Regions 2012 Conference, Edinburgh, UK, 26–27 September 2012; Bostater, C.R., Jr., Mertikas, S.P., Neyt, X., Nichol, C., Cowley, D.C., Bruyant, J.P., Eds.; SPIE: Bellingham, WA, USA, 2012; Volume 8532. [Google Scholar]
- Blaschke, T.; Strobl, J. What’s wrong with pixels? Some recent developments interfacing remote sensing and GIS. GeoInform. Syst. 2001, 06, 12–17. [Google Scholar]
- Blaschke, T. Object based image analysis for remote sensing. ISPRS J. Photogramm. Remote Sens. 2010, 65, 2–16. [Google Scholar] [CrossRef]
- Blaschke, T.; Lang, S.; Lorup, E.; Strobl, J.; Zeil, P. Object-oriented image processing in an Integrated GIS/remote sensing environment and perspectives for environmental applications. In Umweltinformatik ‘00: Umweltinformation für Planung, Politik und Öffentlichkei: 12. Internationales Symposium “Informatik für den Umweltschutz” der Gesellschaft für Informatik (GI), Bonn 2000; Cremers, A.B., Greve, K., Eds.; Metropolis Verlag: Marburg, Germany, 2000; Volume 2, pp. 555–570. [Google Scholar]
- Blaschke, T.; Hay, G.J.; Kelly, M.; Lang, S.; Hofmann, P.; Addink, E.; Queiroz Feitosa, R.; van der Meer, F.; van der Werff, H.; van Coillie, F.M.B.; et al. Geographic object-based image analysis—Towards a new paradigm. ISPRS J. Photogramm. Remote Sens. 2014, 87, 180–191. [Google Scholar] [CrossRef] [PubMed]
- Hay, G.J.; Castilla, G. Geographic Object-Based Image Analysis (GEOBIA): A new name for a new discipline. In Object-Based Image Analysis: Spatial Concepts for Knowledge-Driven Remote Sensing Applications; Blaschke, T., Lang, S., Hay, G., Eds.; Springer: Berlin, Germany, 2008; pp. 75–89. [Google Scholar]
- Hussain, M.; Chen, D.; Cheng, A.; Wei, H.; Stanley, D. Change detection from remotely sensed images: From pixel-based to object-based approaches. ISPRS J. Photogramm. Remote Sens. 2013, 80, 91–106. [Google Scholar] [CrossRef]
- Sevara, C.; Pregesbauer, M.; Doneus, M.; Verhoeven, G.; Trinks, I. Pixel versus object—A comparison of strategies for the semi-automated mapping of archaeological features using airborne laser scanning data. J. Archaeol. Sci. Rep. 2016, 5, 485–498. [Google Scholar]
- Dey, V.; Zhang, Y.; Zhong, M. A review on image segmentation techniques with remote sensing perspective. In Proceedings of the ISPRS Technical Commission VII Symposium, 100 Years ISPRS. Advancing Remote Sensing Science, Vienna, Austria, 5–7 July 2010; Wagner, W., Székely, B., Eds.; XXXVIII-Part 7A. pp. 31–42.
- Baatz, M.; Schäpe, A. Multiresolution segmentation: An optimization approach for high quality multi-scale image segmentation. In Beiträge zum AGIT-Symposium Salzburg 2000; Strobl, J., Blaschke, T., Griesebner, G., Eds.; Wichmann: Heidelberg, Germany, 2000; Volume 12, pp. 12–23. [Google Scholar]
- Trimble. eCognition® Developer 8.7.1. Reference Book; Trimble Germany GmbH: Munich, Germany, 2012. [Google Scholar]
- Sevara, C.; Pregesbauer, M. Archaeological feature classification: An object oriented approach. SE Eur. J. Earth Obs. Geomat. 2014, 3, 139–143. [Google Scholar]
- Styers, D.M.; Moskal, L.M.; Richardson, J.J.; Halabisky, M.A. Evaluation of the contribution of LiDAR data and postclassification procedures to object-based classification accuracy. J. Appl. Remote Sens. 2014, 8, 83529. [Google Scholar] [CrossRef]
- Zou, X.; Zhao, G.; Li, J.; Yang, Y.; Fang, Y. Object based image analysis combining high spatial resolution imagery and laser point clouds for urban land cover. Int. Arch. Photogramm. Remote Sens. Spat. Inf. Sci. 2016, XLI-B3, 733–739. [Google Scholar] [CrossRef]
- Inglada, J.; Christophe, E. The Orfeo Toolbox remote sensing image processing software. In Proceedings of the 2009 IEEE International Geoscience and Remote Sensing Symposium, Cape Town, South Africa, 12–17 July 2009; IEEE Geoscience and Remote Sensing Society: Piscataway, NJ, USA, 2009; Volume V, pp. IV-733–IV-736. [Google Scholar]
- Costa, G.A.O.P.D.; Feitosa, R.; Fonseca, L.M.G.; Oliveira, D.A.B.; Ferreira, R.D.S.; Castejon, E.F. Knowledge-based interpretation of remote sensing data with the Inter IMAGE system: Major characteristics and recent developments. In Proceedings of the GEOBIA 2010: Geographic Object-Based Image Analysis, Ghent, Belgium, 29 June–2 July 2010; Addink, E.A., van Coillie, F.M.B., Eds.; XXXVIII-4/C7.
- Teodoro, A.C.; Araujo, R. Comparison of performance of object-based image analysis techniques available in open source software (Spring and Orfeo Toolbox/Monteverdi) considering very high spatial resolution data. J. Appl. Remote Sens. 2016, 10, 16011. [Google Scholar] [CrossRef]
- Trimble. eCognition. 2016. Available online: http://www.ecognition.com/ (accessed on 2 March 2016).
- Opitz, R.S.; Cowley, D.C. (Eds.) Interpreting Archaeological Topography: 3D Data, Visualisation and Observation; Oxbow Books: Oxford, UK; Oakville, ON, Canada, 2013.
- Bennett, R.; Cowley, D.C.; De Laet, V. The data explosion: Tackling the taboo of automatic feature recognition in airborne survey data. Antiquity 2014, 88, 896–905. [Google Scholar] [CrossRef]
- Palmer, R. Aerial archaeology and sampling. In Sampling in Contemporary British Archaeology; Cherry, J.F., Gamble, C., Shennan, S., Eds.; British Archaeological Reports: Oxford, UK, 1978; Volume 50, pp. 129–148. [Google Scholar]
- Cowley, D.C. A case study in the analysis of patterns of aerial reconnaissance in a lowland area of southwest Scotland. Archaeol. Prospect. 2002, 9, 255–265. [Google Scholar] [CrossRef]
© 2016 by the authors; licensee MDPI, Basel, Switzerland. This article is an open access article distributed under the terms and conditions of the Creative Commons Attribution (CC-BY) license (http://creativecommons.org/licenses/by/4.0/).