Article

Relasphone—Mobile and Participative In Situ Forest Biomass Measurements Supporting Satellite Image Mapping

by
Matthieu Molinier
1,*,
Carlos A. López-Sánchez
2,
Timo Toivanen
1,†,
Ilkka Korpela
3,
José J. Corral-Rivas
2,
Renne Tergujeff
1 and
Tuomas Häme
1
1
Remote sensing team, VTT Technical Research Centre of Finland Ltd., PL 1000, FI-02044 Espoo, Finland
2
Instituto de Silvicultura e Industria de la Madera, Universidad Juárez del Estado de Durango, Bld. del Guadiana 501, Ciudad Universitaria, Torre de Investigación, 34120 Durango, Mexico
3
Department of Forest Sciences, University of Helsinki, P.O. Box 27, FI-00014 Helsinki, Finland
*
Author to whom correspondence should be addressed.
Current affiliation: CGI Group Inc. (Consultants to Government and Industries), P.O. Box 38, FI-00381 Helsinki, Finland
Remote Sens. 2016, 8(10), 869; https://doi.org/10.3390/rs8100869
Submission received: 1 September 2016 / Revised: 28 September 2016 / Accepted: 11 October 2016 / Published: 21 October 2016
(This article belongs to the Special Issue Citizen Science and Earth Observation)

Abstract

:
Due to the high cost of traditional forest plot measurements, the availability of up-to-date in situ forest inventory data has been a bottleneck for remote sensing image analysis in support of the important global forest biomass mapping. Capitalizing on the proliferation of smartphones, citizen science is a promising approach to increase spatial and temporal coverages of in situ forest observations in a cost-effective way. Digital cameras can be used as a relascope device to measure basal area, a forest density variable that is closely related to biomass. In this paper, we present the Relasphone mobile application with extensive accuracy assessment in two mixed forest sites from different biomes. Basal area measurements in Finland (boreal zone) were in good agreement with reference forest inventory plot data on pine ( R 2 = 0 . 75 , R M S E = 5 . 33 m 2 /ha), spruce ( R 2 = 0 . 75 , R M S E = 6 . 73 m 2 /ha) and birch ( R 2 = 0 . 71 , R M S E = 4 . 98 m 2 /ha), with total relative R M S E ( % ) = 29 . 66 % . In Durango, Mexico (temperate zone), Relasphone stem volume measurements were best for pine ( R 2 = 0 . 88 , R M S E = 32 . 46 m 3 /ha) and total stem volume ( R 2 = 0 . 87 , R M S E = 35 . 21 m 3 /ha). Relasphone data were then successfully utilized as the only reference data in combination with optical satellite images to produce biomass maps. The Relasphone concept has been validated for future use by citizens in other locations.

Graphical Abstract

1. Introduction

Participatory sensing [1], citizen science [2], crowdsourcing [3] and volunteered geographic information (VGI) [4] are closely related concepts, which refer to the involvement of the general public with, e.g., scientific activities [5]. Over the past few years, citizen science and participatory sensing have gained momentum [6,7], partly driven by the democratization of smartphones and mobile applications [8]. Through data acquisition, labeling, interpretation or analysis, citizens can contribute valuable geospatial data in various application domains related to ecological research [9], environmental monitoring [10] and Earth observation [11]. Land cover mapping has largely benefited from citizen science and VGI [12,13], all the more since open and free satellite imagery and online maps are increasingly available [5]. See et al. [14] underline that current land cover products are not accurate enough for many applications and that better and more accessible validation data are needed to improve them. The Geo-Wiki platform, by Fritz et al. [15], is successfully providing a large quantity of crowd-sourced samples for global land cover mapping [16] or accuracy assessment of a global forest mask [17]. In other studies, VGI was combined with satellite images for mapping [18,19], to augment image time series [20] or to assist forest monitoring in the context of REDD+ [18,21,22,23] (Reducing Emissions from Deforestation and forest Degradation in developing countries and the role of conservation, sustainable management of forests and enhancement of forest carbon stocks). Forest mapping [24] and monitoring [25] are natural applications of participatory sensing, especially in communities where forest plays an important socio-economic role.
Billions of people are influenced by forests that provide them with food, energy and shelter. In 2015, forests covered four billion hectares (ha) globally (30.6% of the total land area) according to the Global Forest Resources Assessment 2015 [26] of the FAO (Food and Agriculture Organization). Deforestation, mainly the conversion of tropical forests to agricultural land, caused an annual reduction of 7.6 million ha of forest between 2010 and 2015. Taking into account afforestation and natural expansion, the annual net loss over the same period was around 3.3 million ha for all forest areas and 6.5 million ha for natural forests [26], with the largest losses in South America and Africa. Forests have a large influence on climate change, as they absorb and store about 650 billion tons (Gt) of carbon in total. The Kyoto protocol and the United Nations Framework Convention on Climate Change (UNFCCC) request all member countries to regularly assess and report national greenhouse gas emissions in order to control their carbon footprint. Globally, carbon stocks are decreasing each year by about 0.3 Gt due to deforestation caused, e.g., by illegal logging in many tropical countries. Curbing deforestation and evaluating how forests affect the carbon cycle and climate change [27] requires efficient, continuous and worldwide monitoring of forest biomass. Remote sensing imagery can provide continuous coverage with high temporal and spatial resolutions , especially since the opening of the Landsat archive [28] and the first Sentinel satellites of the Copernicus programme. In order to process large amounts of satellite imagery into sensible global biomass maps, in situ reference data are increasingly needed for training and accuracy assessment of biomass mapping models. A report by the Global Forest Observation Initiative [29] on the use of Remote Sensing in national forest monitoring identified that many countries suffer from a lack of in situ calibration and validation data for biomass estimation. Reference forest inventory data need to be up-to-date, representative of the underlying tree population and to describe accurately the forest variables of interest at geo-referenced locations. Forest inventory tasks are currently carried out by professionals using field observations. Field inventory is based on sampling to limit the costs, which depend mainly on the intensity of the field work and number of observations. Because field work is expensive, forest inventories result in restricted spatial and temporal coverage, with updates every five or ten years.
Forest inventories often include the basal area (BA) attribute, since it is easily measured at a point location and provides a fast means for the important stem volume and forest biomass estimations [30,31]. Basal area is the cross-sectional area of the trunk (in m 2 ) at the breast height of 1.3 m. The BA of trees at a given location is conveniently measured in the field as a density measure (in m 2 /ha) with a relascope, a device that relies on Bitterlich sampling [32,33]. Several techniques to automate or facilitate forest inventory measurements have been developed. Various types of dendrometers, including the laser relascope, were surveyed in [34]. Terrestrial laser scanning (TLS) was used for automatic measuring of forest inventory parameters, including tree height and tree diameter at breast height (dbh) [35,36,37], basal area [38,39] and forest structure and biomass [40], with good accuracy on basal area estimations [39]. However, TLS is expensive, not easily portable and requires an expertly-trained operator. Terrestrial photogrammetry in digital optical images was used in [41] to reconstruct tree stem surface, but the technique requires several cameras.
The proliferation of smartphones and the rise of citizen science can provide frequent, fast and inexpensive in situ observations to support forest inventory and mapping. Abd-Elrahman et al. [42] used geo-referenced data gathered by volunteers to augment forest inventory data. Butt et al. [43] showed that volunteers can provide accurate tree height and tree diameter measurements in relation to carbon stock estimates. Pratihast et al. [22] used mobile devices for community-based REDD+ monitoring in Vietnam and showed that local communities can provide data with comparable accuracy to expert measurements for estimating tree counts and forest disturbance.
Häme et al. [44] presented the Relasphone concept in 2010, a digital relascope for mobile phones to collect in situ basal area and forest biomass measurements in a cost-effective way. Automatic image processing was investigated by Molinier et al. in 2011 [45], and the interactive Relasphone application (http://www.relasphone.com) was released for free. Since then, similar smartphone apps have been proposed, such as MOTI for professional foresters and Trestima, a commercial application developed in 2012 that sends images to a server for automatic or semi-automatic processing [46]. To our knowledge, Relasphone measurements are the only ones that were extensively tested versus reference forest inventory plot data in two different biomes—boreal zone in Finland [47] and temperate zone in Durango, Mexico [48]—then combined with satellite images to produce maps of growing stock volume (GSV) or aboveground biomass (AGB). This article improves the description of datasets and methods from both conference papers [47,48], extends accuracy assessment (including a comparison with the results of Trestima in Finland) and presents new results in Mexico since [48] with forty more plot measurements by two users instead of one. An extensive discussion on the relevance of Relasphone for citizen science and Earth observation is also included.

2. Study Sites and Datasets

The Relasphone concept was developed and first demonstrated in mixed boreal forests of southern Finland in 2010 [44,47]. The successful methodology was then extended and applied in 2014–2015 to a different biome, in temperate mixed forests of Durango, Mexico [48].

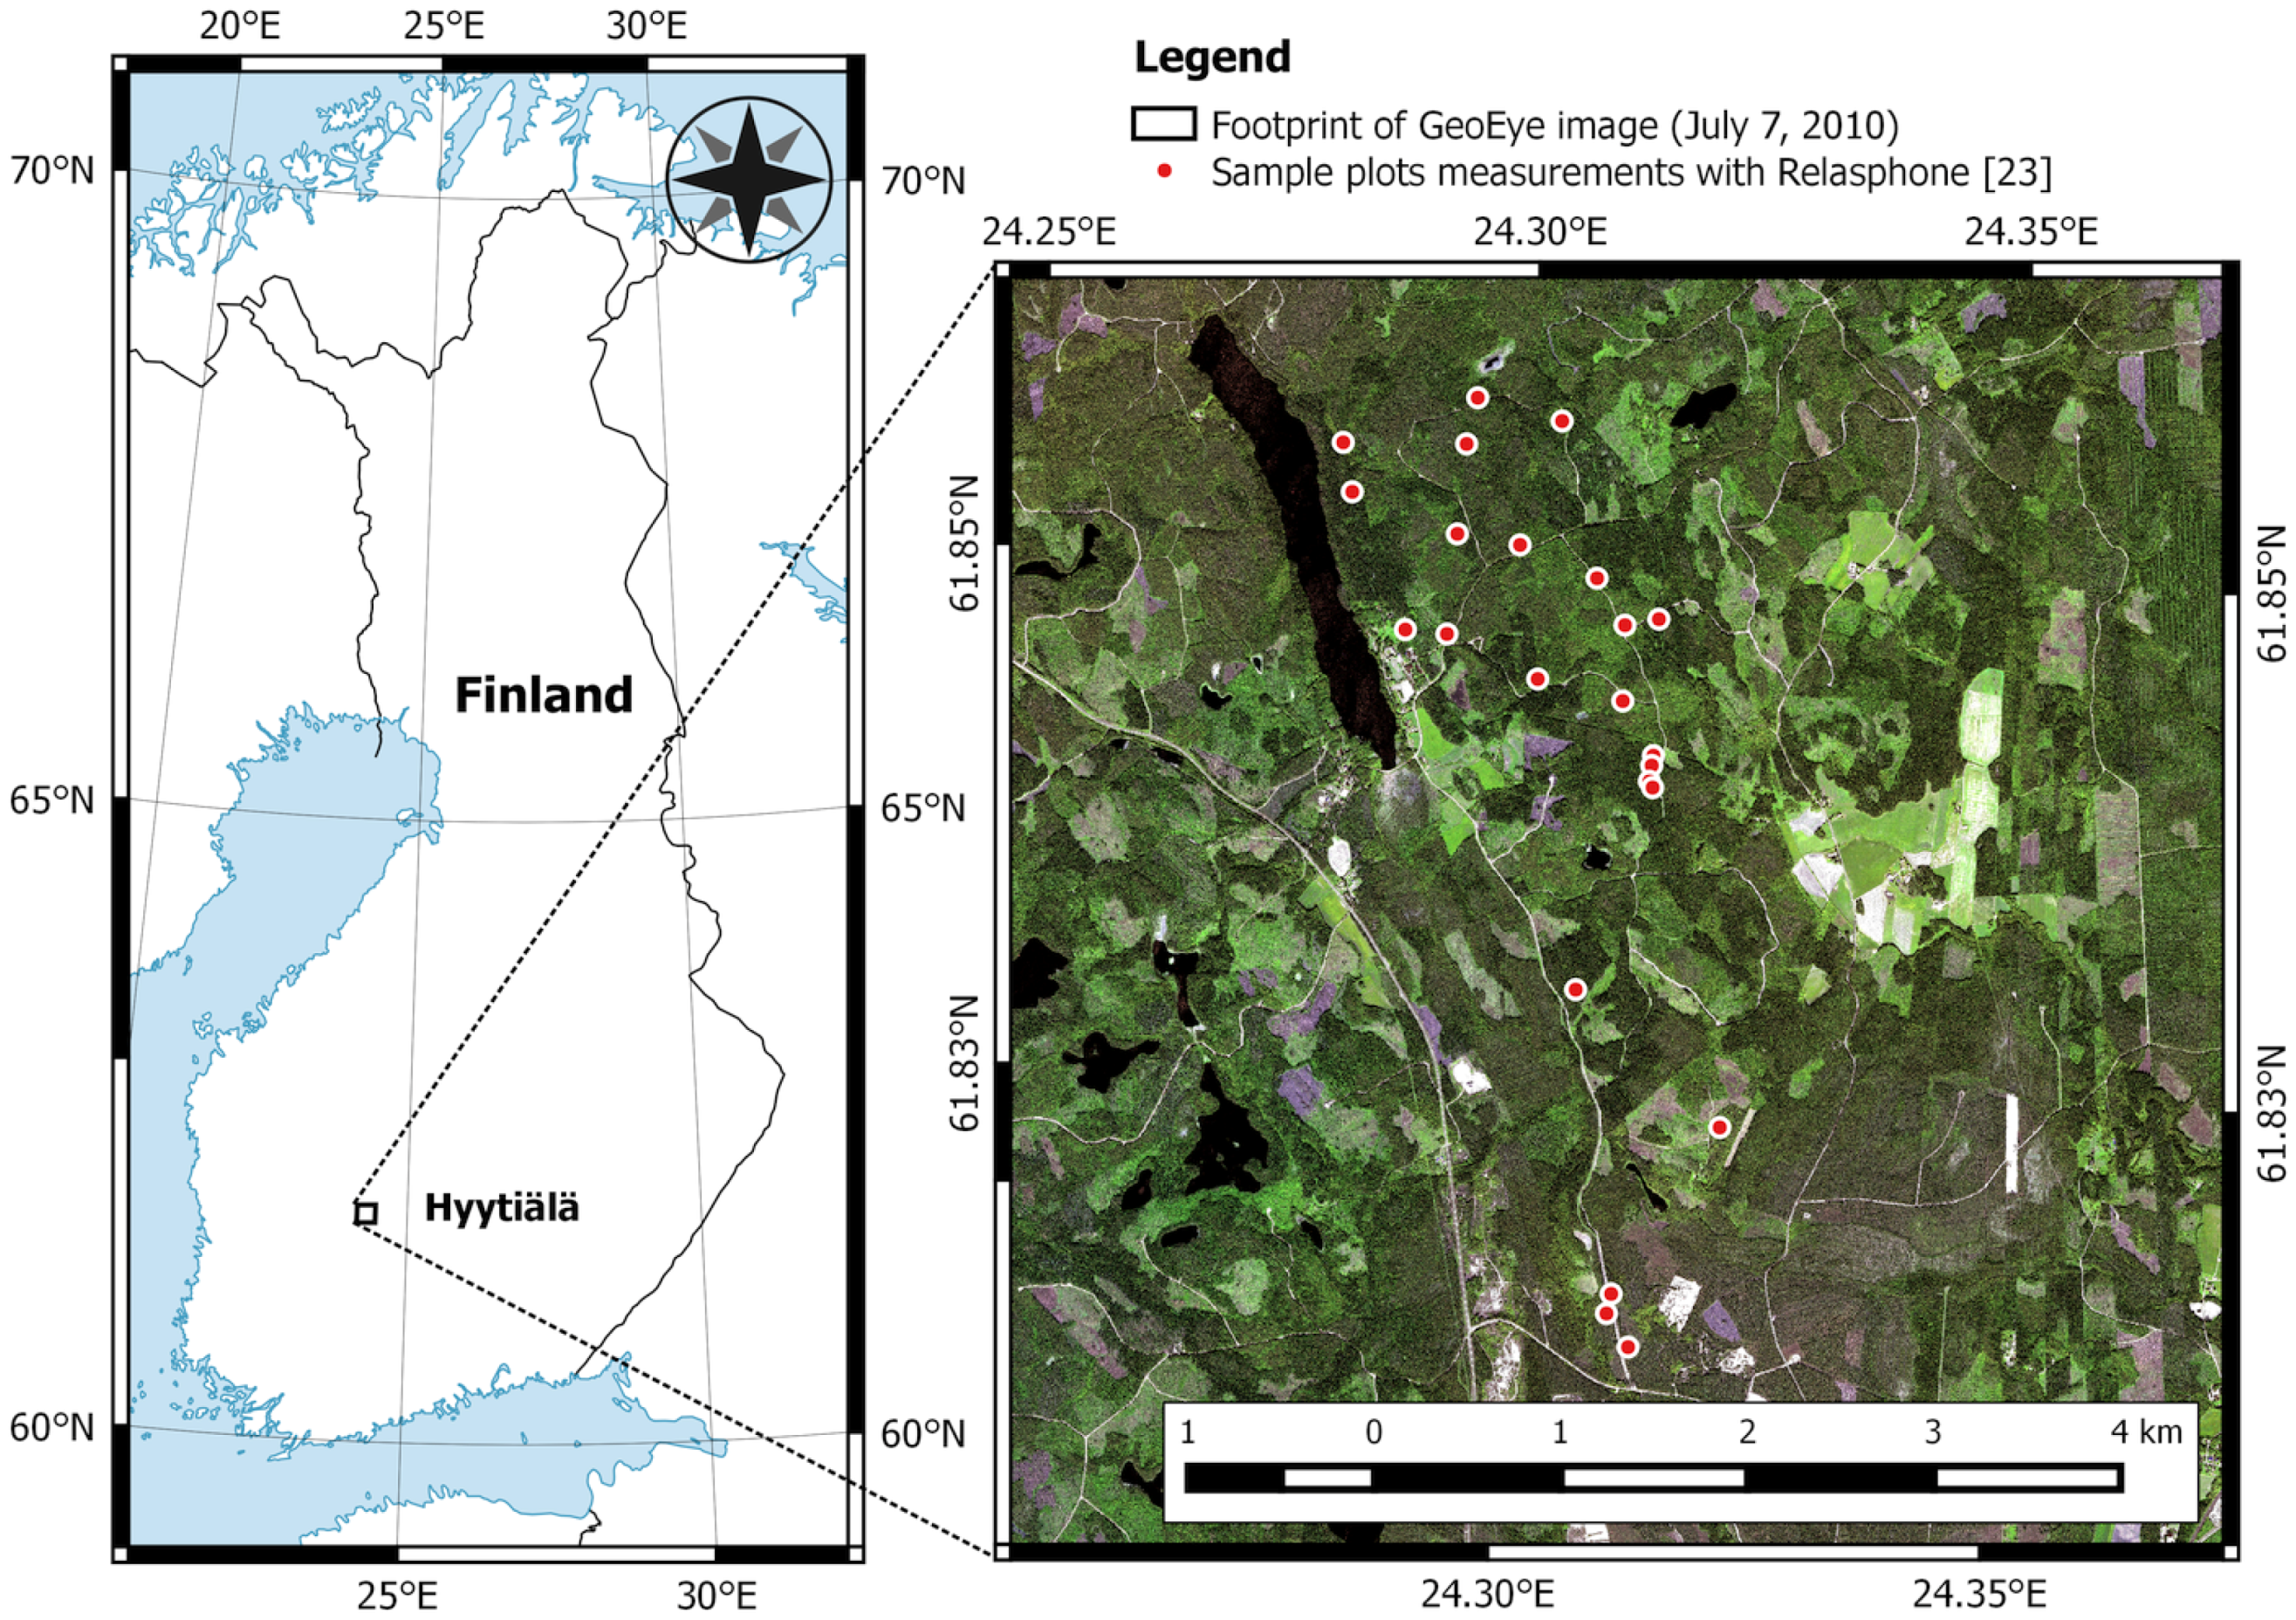
2.1. Boreal Mixed Forest Site in Southern Finland

2.1.1. Study Area and Reference Forest Inventory Plot Data

The Finland study site is located in Hyytiälä (61 ° 50 42″N, 24 ° 17 11″E, at 135–198 m above sea level); see Figure 1. The Hyytiälä Forestry Field Station has been used in various forestry-related remote sensing studies [49,50,51] because of its long-term, up-to-date and detailed inventory plot data that covers over 25 ha of mapped forests. Dominant tree species are Norway spruce (Picea abies (L.) Karst), Scots pine (Pinus sylvestris L.) and birches (Betula pubescens Ehrh., Betula pendula Roth). A detailed description of the Hyytiälä forest site is available in [52] and a map of forest site types in [53].
The reference data in this study were measured between 2006 and 2010. Each standing tree has observations of species, diameter at breast height (dbh), status of the crown and the 3D coordinates in the global UTM35N system. The tree positions were retrieved by combining 2D field trilateration and triangulation, using photogrammetric positions (LiDAR and aerial images) of treetops (representing trunks) as a network of ground control points, as in [54]. The tree positioning accuracy of trunks had a standard deviation of 0.2 m–0.4 m in eastings and northings coordinates, at the 95% confidence level. The accuracy was better for young or small trees than for old trees with a round or sparse apex. Table 1 summarizes the statistics of the main stand variables estimated from forest plots in Finland.

2.1.2. In Situ Mobile Phone Data Preparation and Acquisition

In June 2010, two foresters selected and prepared 54 locations within the 23 reference forest plots in Hyytiälä, to account for various combinations of tree species mixture, tree dimensions, stand density (occlusions of trees in the background), understory vegetation density and terrain slopes. The selection aimed at providing a realistic benchmark for method testing close to operational conditions. Stand development class ranged from seedling to mature stands and the chosen locations also covered variations in forest fertility site types [55]; see Figure 2. Table 2 shows basal area, mean dbh and tree species proportions in the 23 plots from which the 54 locations were selected. The total area of reference plots was always over 0.2 ha and up to 1 ha. The 54 locations within these plots were chosen such that the relascope (with a default relascope factor [33] of 1 m 2 /ha) would see all reference trees plus a buffer, to avoid border effects at the boundaries of the reference plots.
Each location was marked in the forest with a pole to guide and control later in situ data acquisition by another person, so that mobile phone measurements could be easily compared with reference basal area measurements at the exact same location. The absolute coordinates of the poles were retrieved by triangulation using 10–20 nearby trees, to increase accuracy. The average positioning accuracy of poles was 0.16 m in both easting and northing coordinates, which is far better than the expected 0.75 m–2 m accuracy of differential GNSS (Global Navigation Satellite System) under canopy [56,57] or that of a mobile phone GNSS [58]. Each selected location was checked for changes in trees (e.g., damages due to earlier storms or heavy snowfalls), as the oldest tree measurements were made in 2006. Reference basal area was measured from each of the 54 locations, standing at the corresponding pole in the forest, using the traditional relascope principle [32,33].
The first version of the Relasphone required acquisition of mobile phone images to be later processed interactively on a desktop computer. The imaging campaign was carried out 28–29 June 2010, during the growing season that occurs in Finland between early May and the end of September. The 54 previously-marked locations were visited by the first author, who had little background knowledge in forestry at the time. At each location, six or seven mobile phone images were acquired to cover the full 360 ° panoramic view, for a total of 314 images; see Figure 2. The images were acquired with a Nokia 5800 XpressMusic mobile phone, equipped with a standard 3.2-megapixel camera. Each image included geo-location information embedded in the image metadata.

2.1.3. Satellite Imagery

The optimal time window for forest remote sensing over southern Finland is in the beginning of July, when broad-leaved trees (mainly birch) exhibit fully-grown leaves. A cloud-free GeoEye image (Figure 1) was acquired on 7 July 2010 over Hyytiälä, Finland, one week after the in situ data. The very-high resolution (VHR) image was geometrically corrected to the WGS84/UTM35N coordinate system, the same as the Relasphone measurements and forest inventory data. Radiometric correction was done with the simplified model for atmospheric correction (SMAC) algorithm [59].

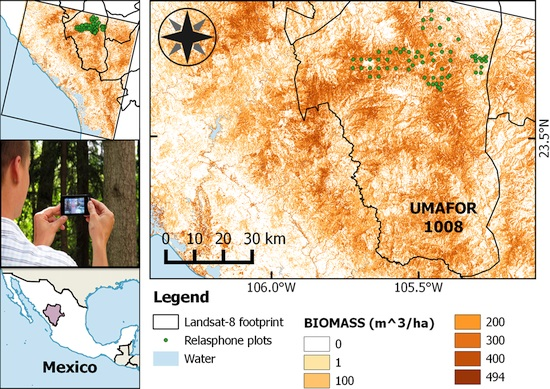
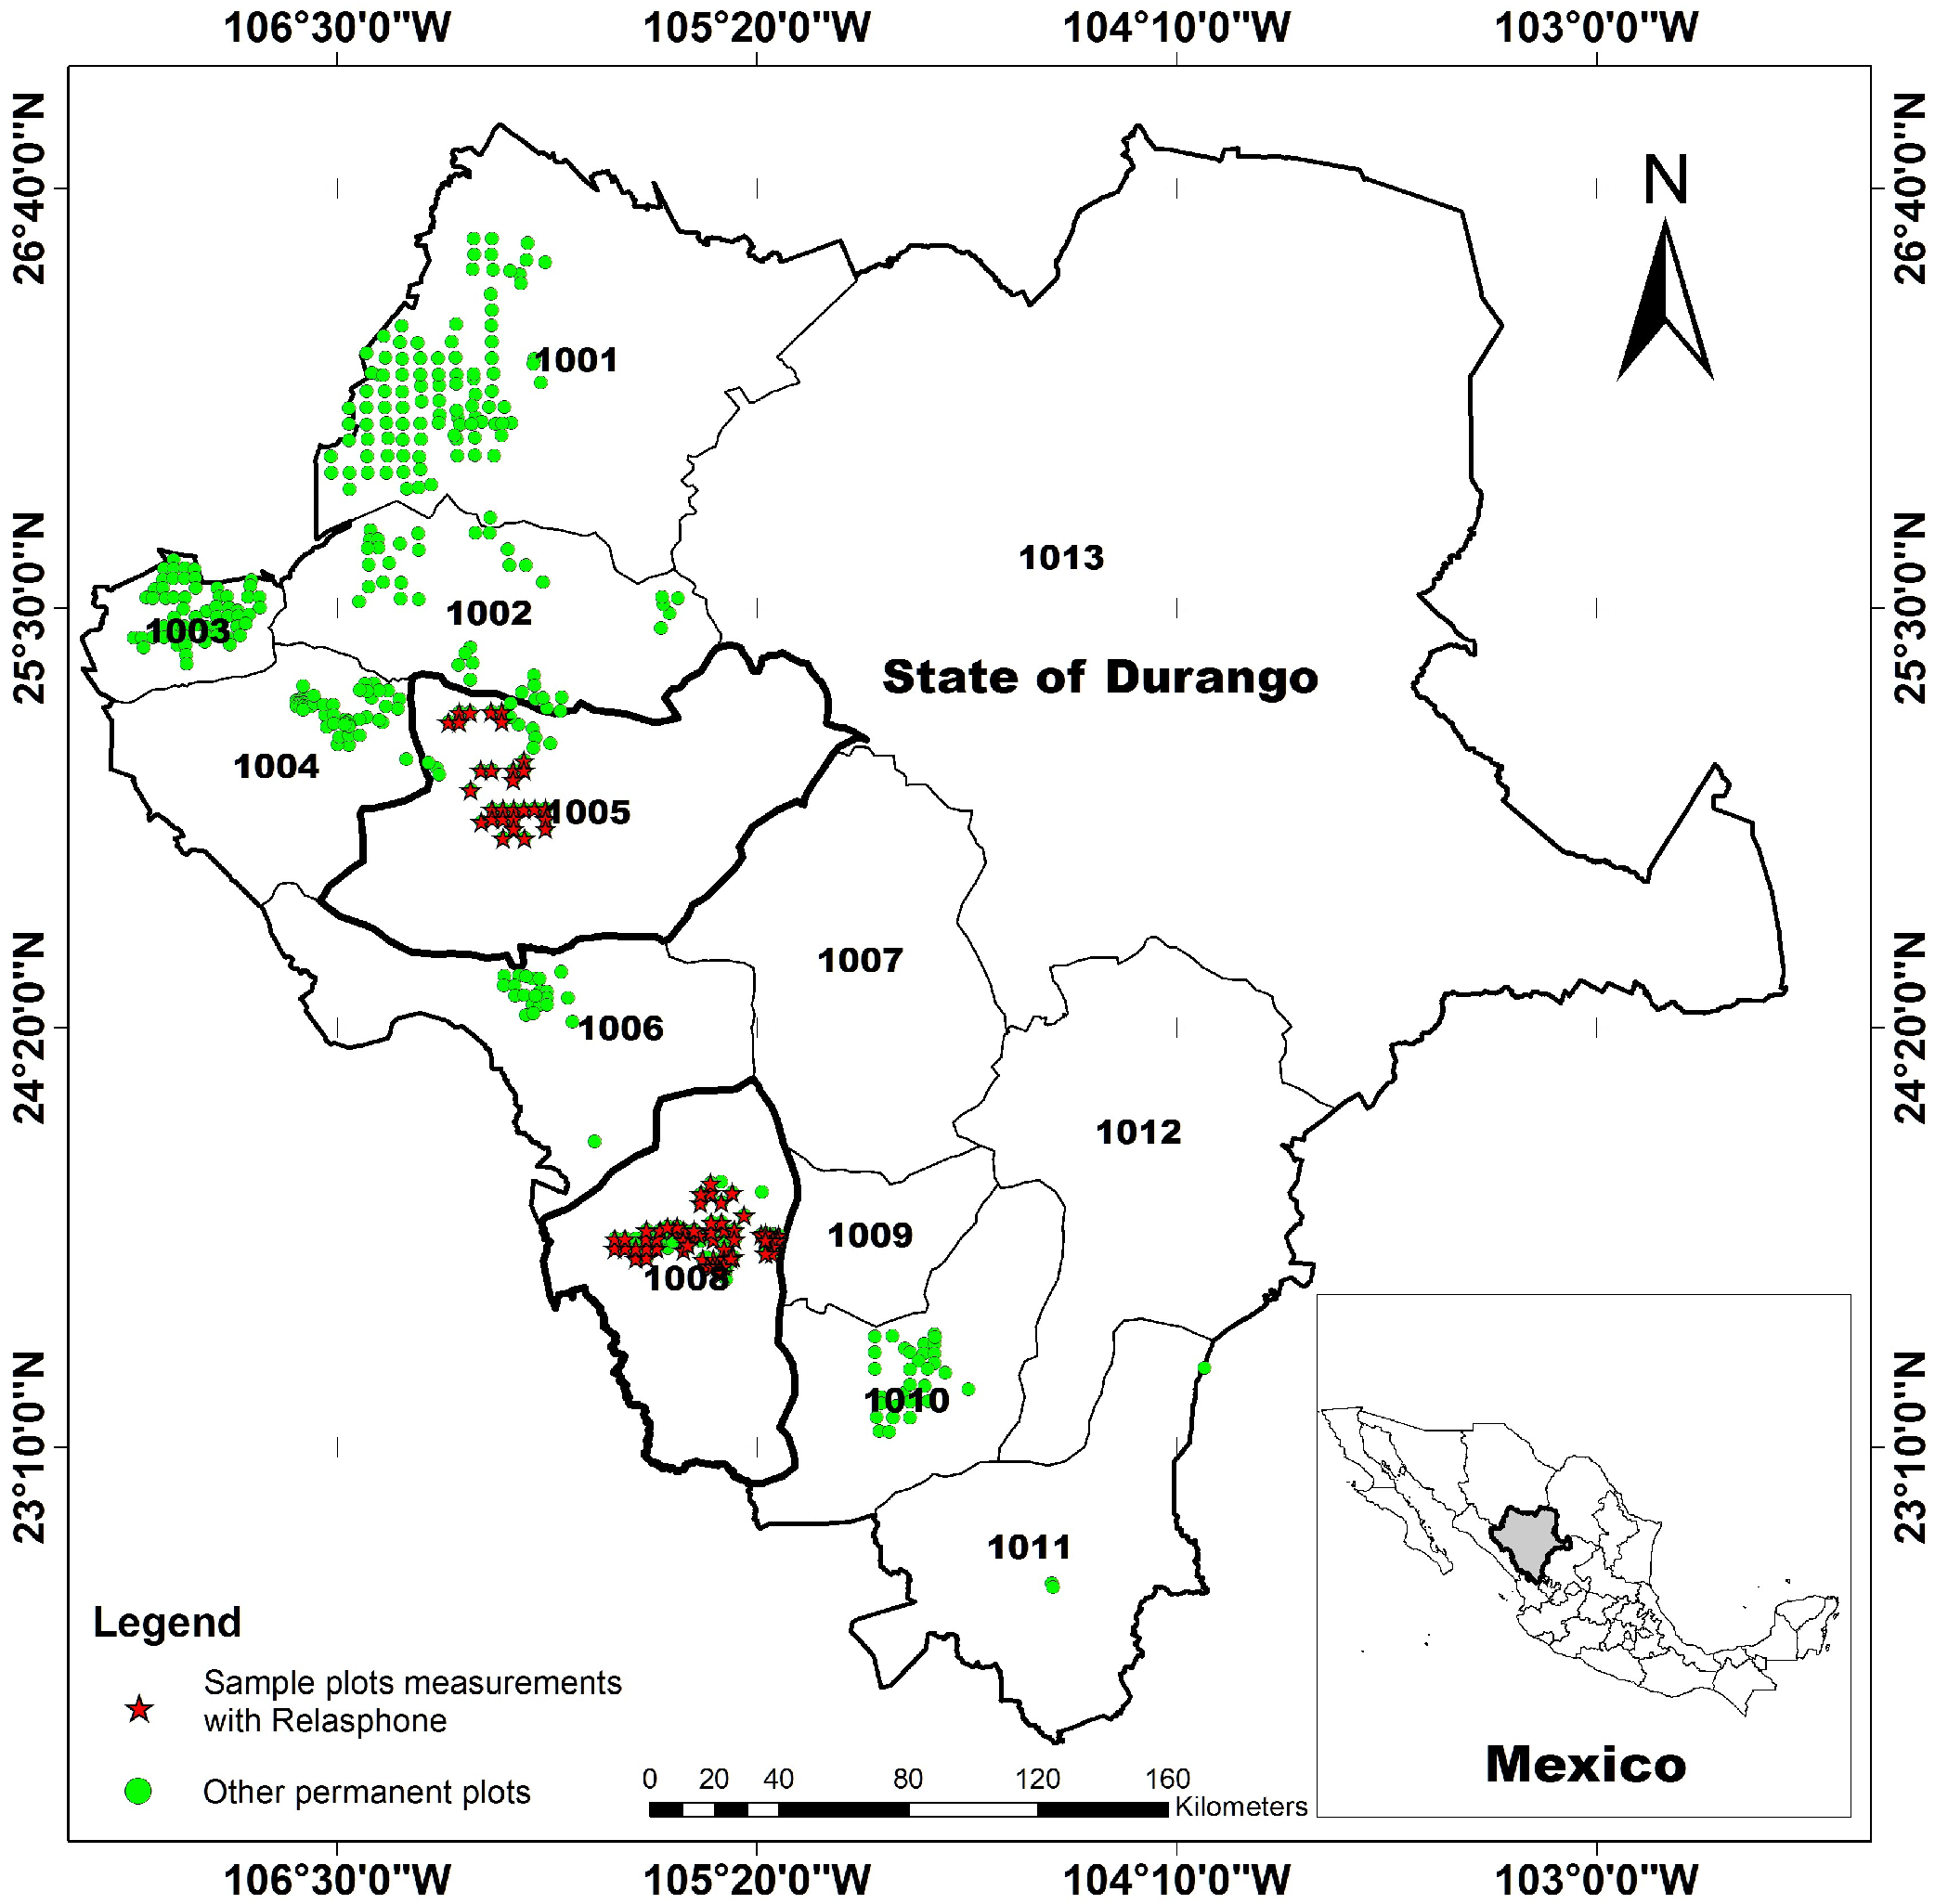
2.2. Temperate Forest Site in the State of Durango, Mexico

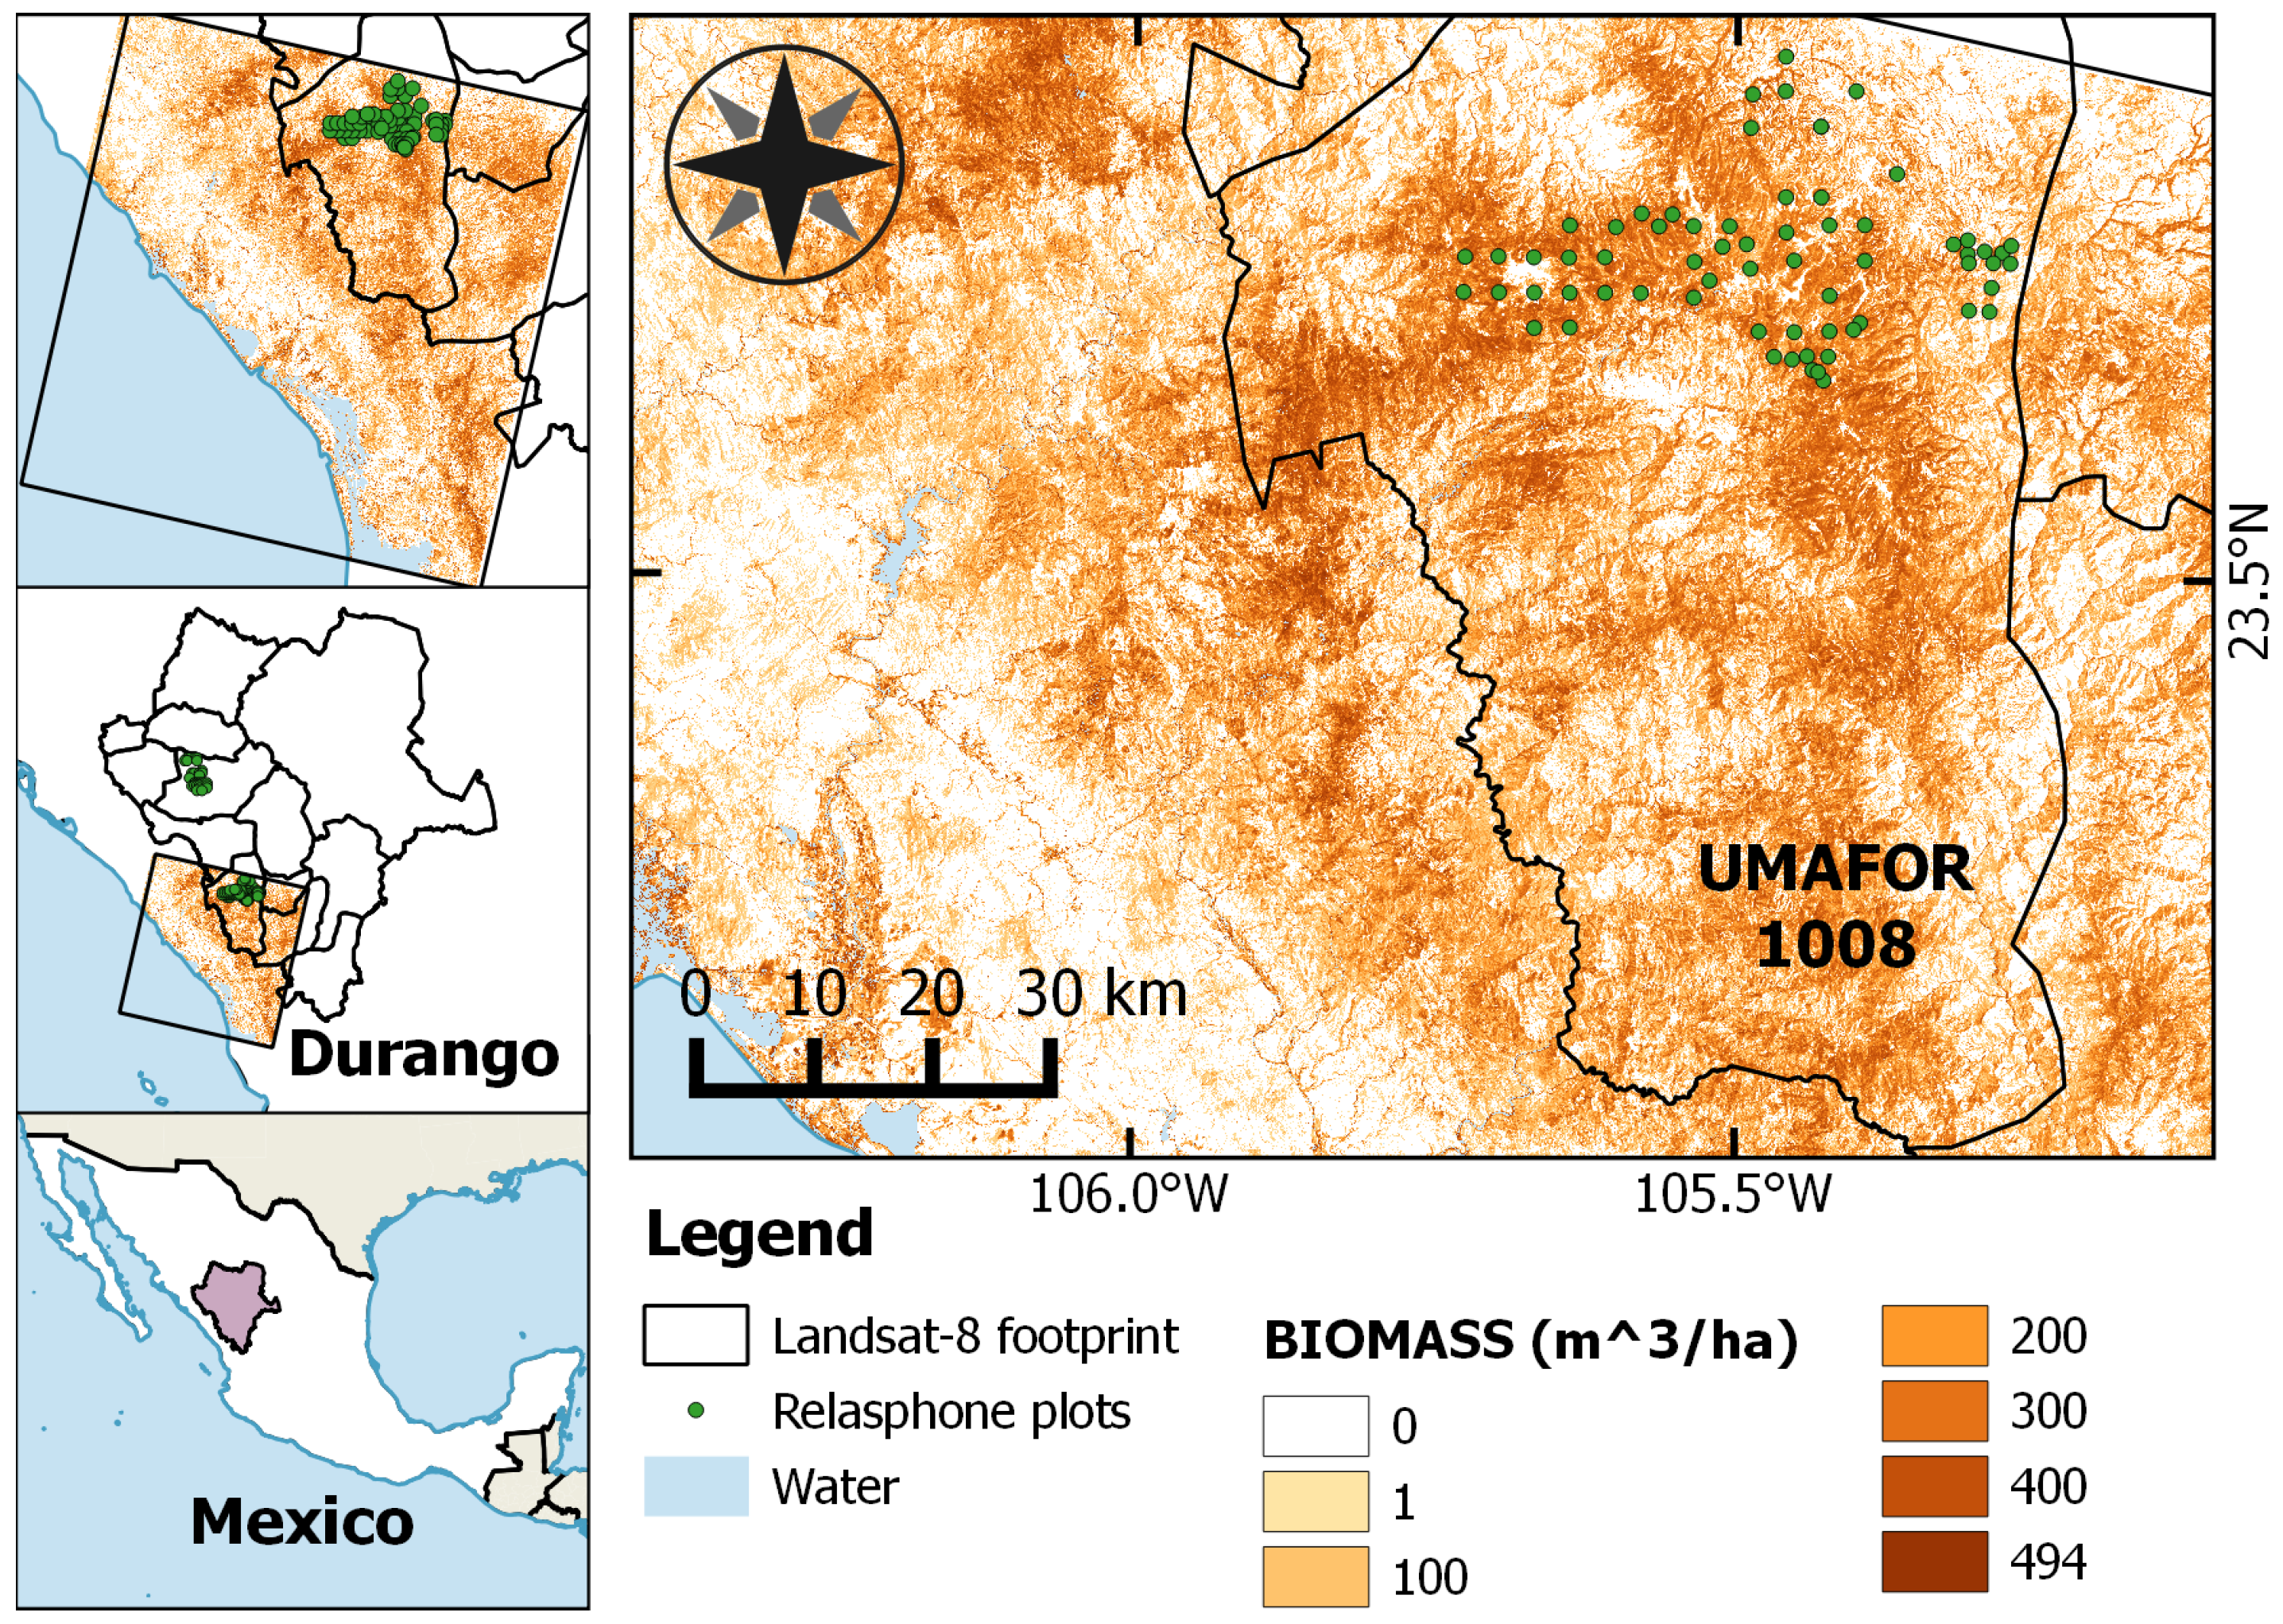
2.2.1. Study Area and Reference Forest Inventory Plot Data

The study area in Mexico is part of the Sierra Madre Occidental (SMO) mountain range in the state of Durango (Figure 3), which is the main timber source of the country. A large part of the forestland in Durango (4.9 million ha out of 9.1 million ha) is covered by temperate forest, at a mean elevation of 2650 m above sea level. Precipitation levels in this area average between 800 and 1200 mm per year, and frost occurs in winter due to low temperatures and humid winds [60]. Two-thirds of the total area (latitude: 107 ° 11 W– 104 ° 20 W; longitude: 26 ° 50 N– 22 ° 20 N) is covered by mixed and uneven-aged pine-oak forests (Pinus spp. and Quercus spp.). The area contains natural and managed forests (mainly selective logging for almost a century), resulting in an irregular spatial arrangement of trees and variations in the age structure of trees and stands [60].
Permanent sampling plots SPIFyS (Sitios Permanentes de Investigación Forestal y de Suelos) were established in Durango during the winters of 2007–2011, following the methods in [61]. The 429 SPIFyS plots were located by systematic sampling (with some exceptions to avoid non-forested areas) on a grid of equidistant points separated by 3–5 km, depending on the orography of the area. The field data were collected using squared plots of a fixed size of 0.25 ha, measuring individually each tree in diameter at breast height (1.3 m above the ground level) and total height then expressed on a per ha basis, to allow for later comparison with density measurements (basal area) from the Relasphone. Biomass allometries and carbon content have been measured for the main pine species in the plot network [62]. The SPIFyS sampling plots have been re-measured at five-year intervals since the year of establishment.
The reference forest inventory data used in this study are a subset of 95 SPIFyS plots, from the 201 SPIFyS plots presented in [60]. The 95 SPIFyS plots are located UMAFOR 1005 and 1008 (Unidad de Manejo Forestal Regional or Regional Forest Management Unit), in the west part of Durango, Mexico; see Figure 3. Table 3 shows descriptive statistics of the main stand variables in these 95 plots.
Example cell phone images of the reference Pinus cooperi plots in Durango are shown in Figure 4. The images were not used to compute basal area, unlike in the Finland case.

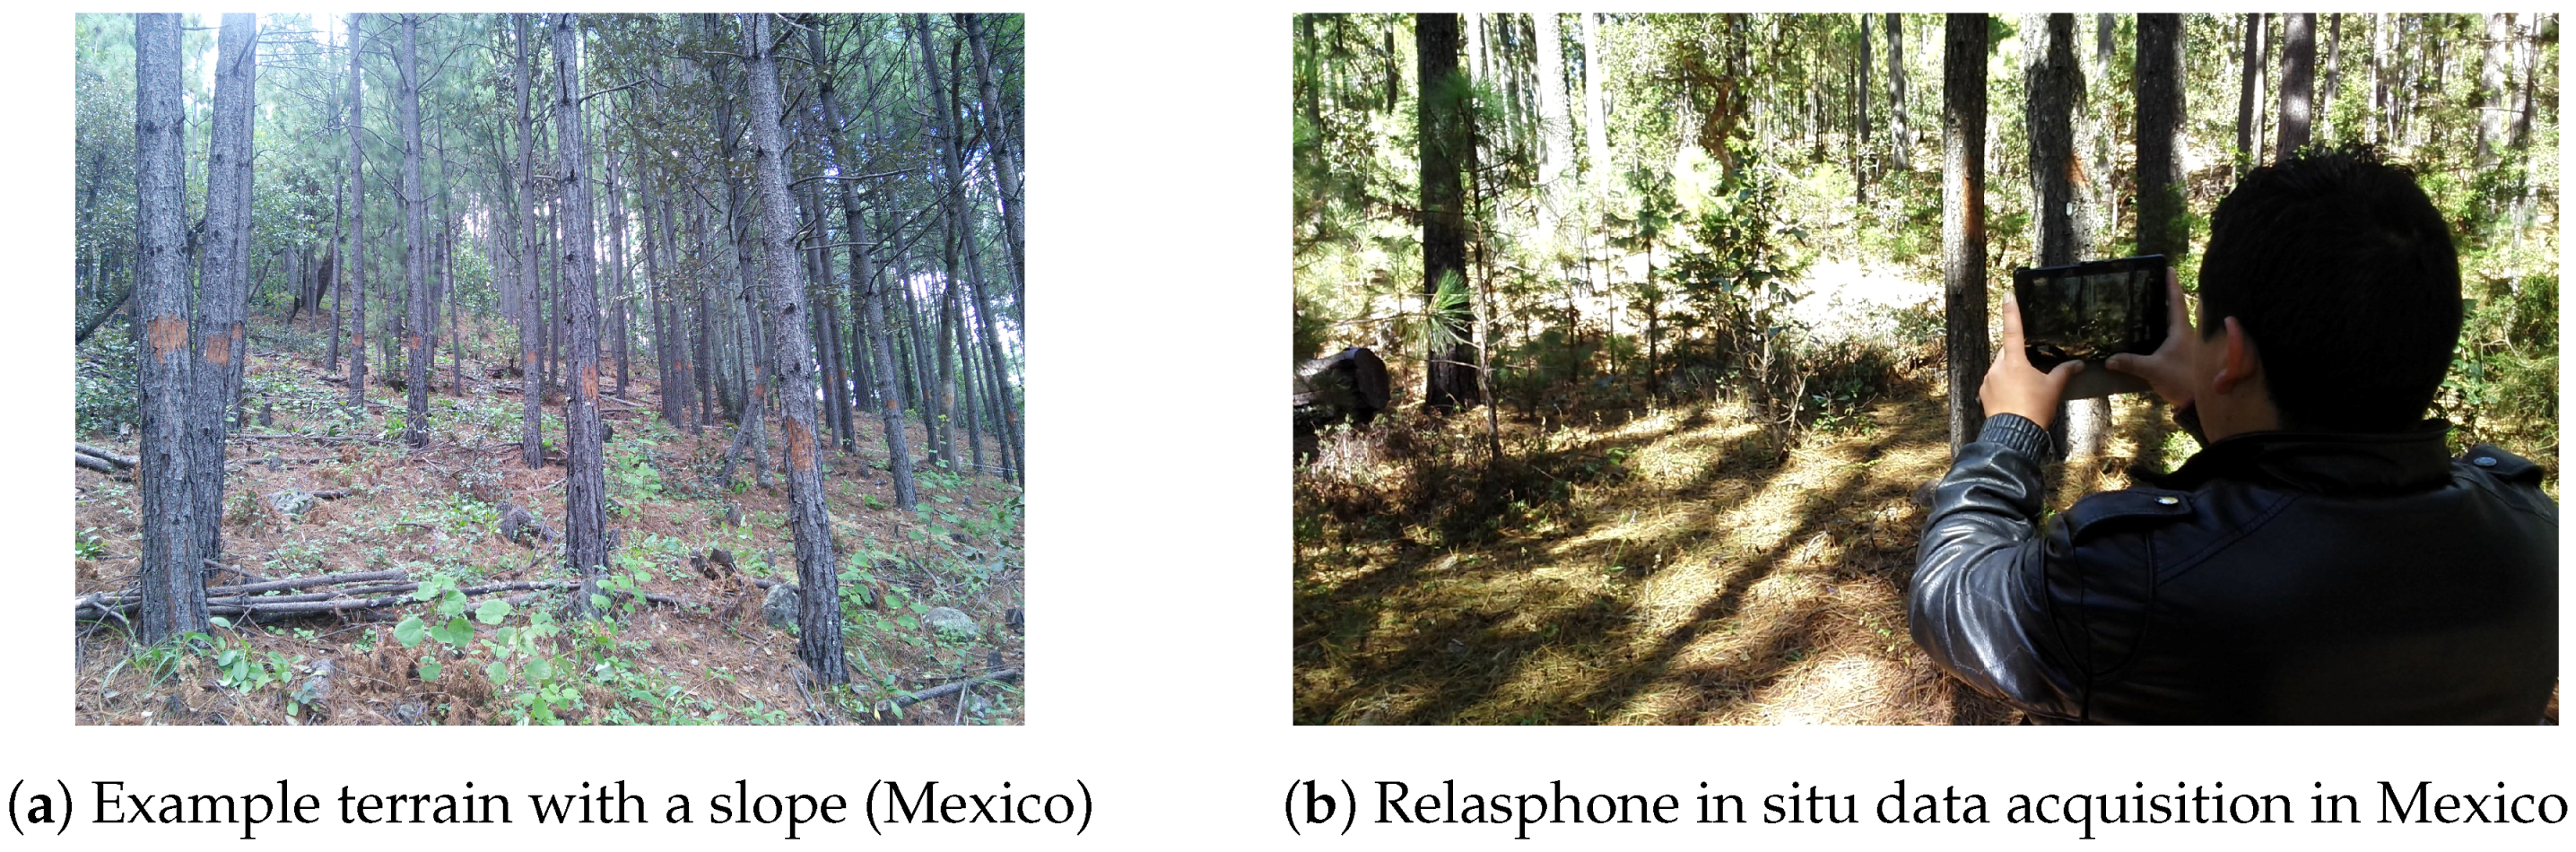
2.2.2. In Situ Relasphone Measurements

The 95 Durango plots located in UMAFOR 1005 and 1008 (Figure 3) were visited in March–April 2015. Basal area was directly measured in situ with the Relasphone mobile app, and reference plot data were re-measured simultaneously at the same locations, to avoid temporal discrepancies in the data sources before comparison. In each plot, independent observations were made by two users, to assess the consistency of Relasphone measurements.

2.2.3. Satellite Imagery

Optimal acquisition dates for optical satellite images over Durango, Mexico, are either right before or right after the rainy season that runs from June–October. A cloud-free Landsat-8 image acquired on 10 May 2014 at Path 031/Row 044 was selected, covering all ground measurements made with the Relasphone in the UMAFOR 1008 region (Figure 3). Using VTT in-house software, the Landsat 8 image was ortho-rectified to a 15-m resolution DEM (continuous elevation model provided by the National Institute of Statistics and Geography of Mexico (INEGI)).The DEM was first filtered on a 5 × 5 window to minimize striping artifacts. Atmospheric correction was performed with the SMAC algorithm [59]. The corrected Landsat-8 image, Relasphone measurements and forest inventory data in Mexico were all in the WGS84/UTM13N coordinate system.

3. Methods

3.1. The Relascope Principle

The relascope, invented in 1948 by Walter Bitterlich [32], is a widely-used device in forest inventory with variable radius sample plots [33]. In its most simple version, a relascope can be a stick with an opening gauge at one extremity. The ratio between the gauge diameter and the stick length defines the gauge angle for angle-count sampling. In the forest, the sample plot basal area (BA, in m 2 /ha) is measured at a given location by counting the number of tree stems with an apparent thickness larger than the opening gauge of the relascope, then multiplying by a form factor called the basal area factor B A F (or relascope factor) [33]. B A F typically takes values between 0.5 and 2, depending on the density of trees in the plot, and is linked to the length of the stick c by Equation (1):
B A F = 2500 c
Stem volume can then be obtained by multiplying BA with tree height and the basal area factor ( B A F ). The relascope being an optical fork, the ratio between the tree stem diameter d (for a tree within the angle-count plot) and the distance r between the standing point and the tree is the same as the ratio between the gauge diameter and the stick length. The relascope gauge angle α, under the far-range assumption ( α t a n ( α ) ), is linked to the relascope factor B A F by Equation (2) [33]:
α d r = B A F 50
These basic principles are common to many relascope designs [34], and can be applied in digital images acquired from a mobile phone camera.

3.2. Application of the Relascope Principle to Digital Cameras

The central projection geometry of cell phone cameras allows to apply the relascope principle. The angle gauge of the relascope is related to the width of the opening and the distance between the eye and the gauge. In the case of digital images, the angle gauge depends on the image width in pixels and the camera field of view F o V , which relates to the sensor size and the focal length of the lens. Slight deviations from the technical specifications can occur for sensor size or focal length. The phone camera F o V was measured using simple trigonometry principles assuming a pinhole camera model, with a target of known width W and at a distance D from the camera; Equation (3):
F o V = 2 × a t a n W 2 D
This simple measurement method for the camera F o V can easily be reproduced by non-experts with any flat target, for example a wall. The current version of the Relasphone app includes a simple built-in calibration procedure to calculate the camera F o V and set the size of the relascope gauge.

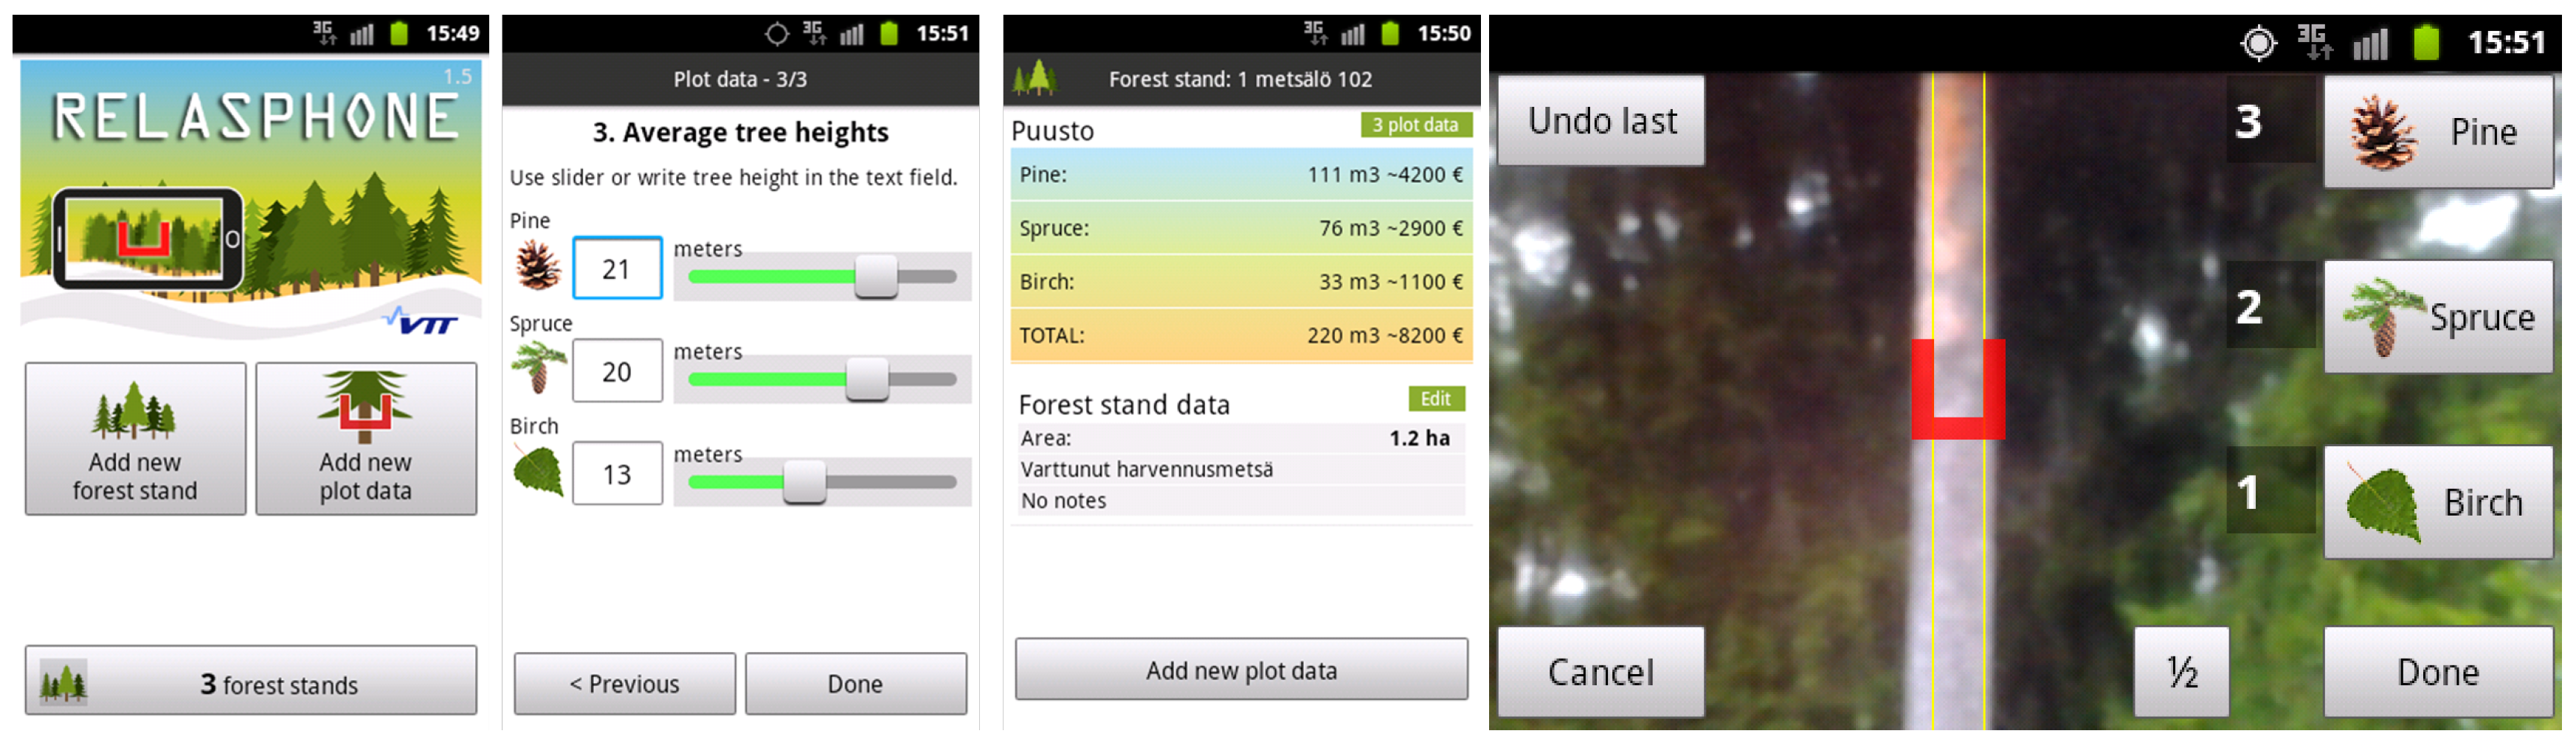
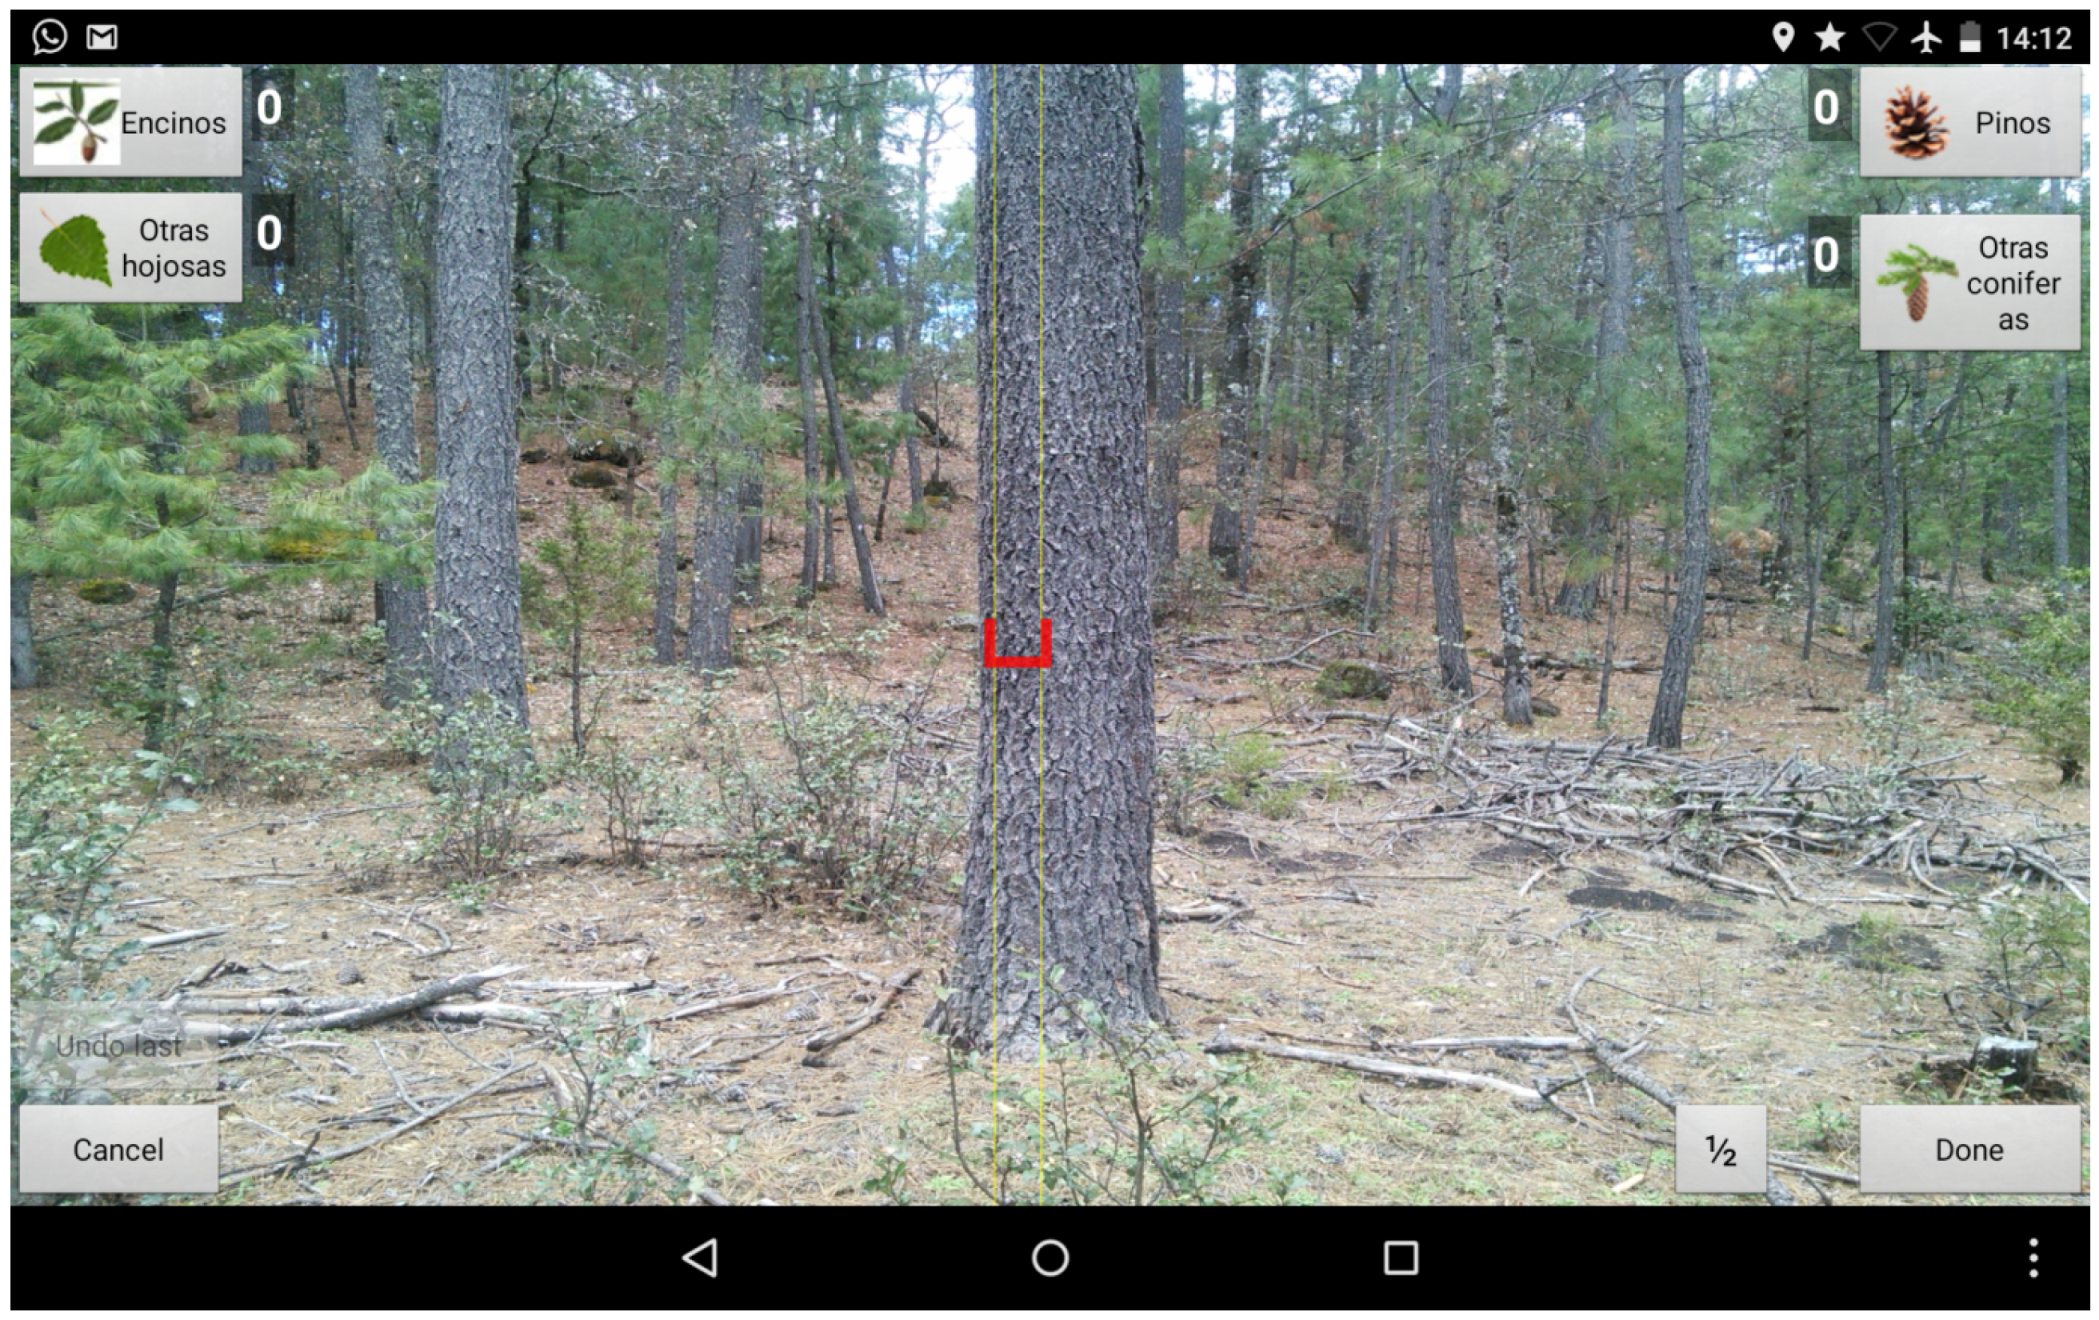
3.3. Relasphone: A Smartphone Application for Forest Basal Area Measurements

The Relasphone [47] is a free forest measurement app for Android smartphones that implements the digital relascope, augmented with metadata and computed forest variables. The app does not require professional training and has been designed to be as easy as possible to use, with short introductions for each measurement phase. Users can easily gather in situ forest inventory data, including basal area, tree species, tree height and age. Basal area is measured interactively, with the digital relascope gauge displayed on top of the image acquisition live view of the smartphone. Touch buttons are used to increment counters of trees appearing at least as wide as the gauge, for each tree species (Figure 5). The computation of basal area at a given forest plot requires examining all trees that appear in the phone camera view when rotating 360 ° around oneself (like with a traditional relascope). Figure 6 shows the digital relascope view for local tree species in Durango, Mexico. The Relasphone app is available on Google Play Store http://play.google.com/store/apps/details?id=fi.vtt.socialforest.
In addition, the Relasphone can collect other forest inventory data, such as:
  • tree diameter;
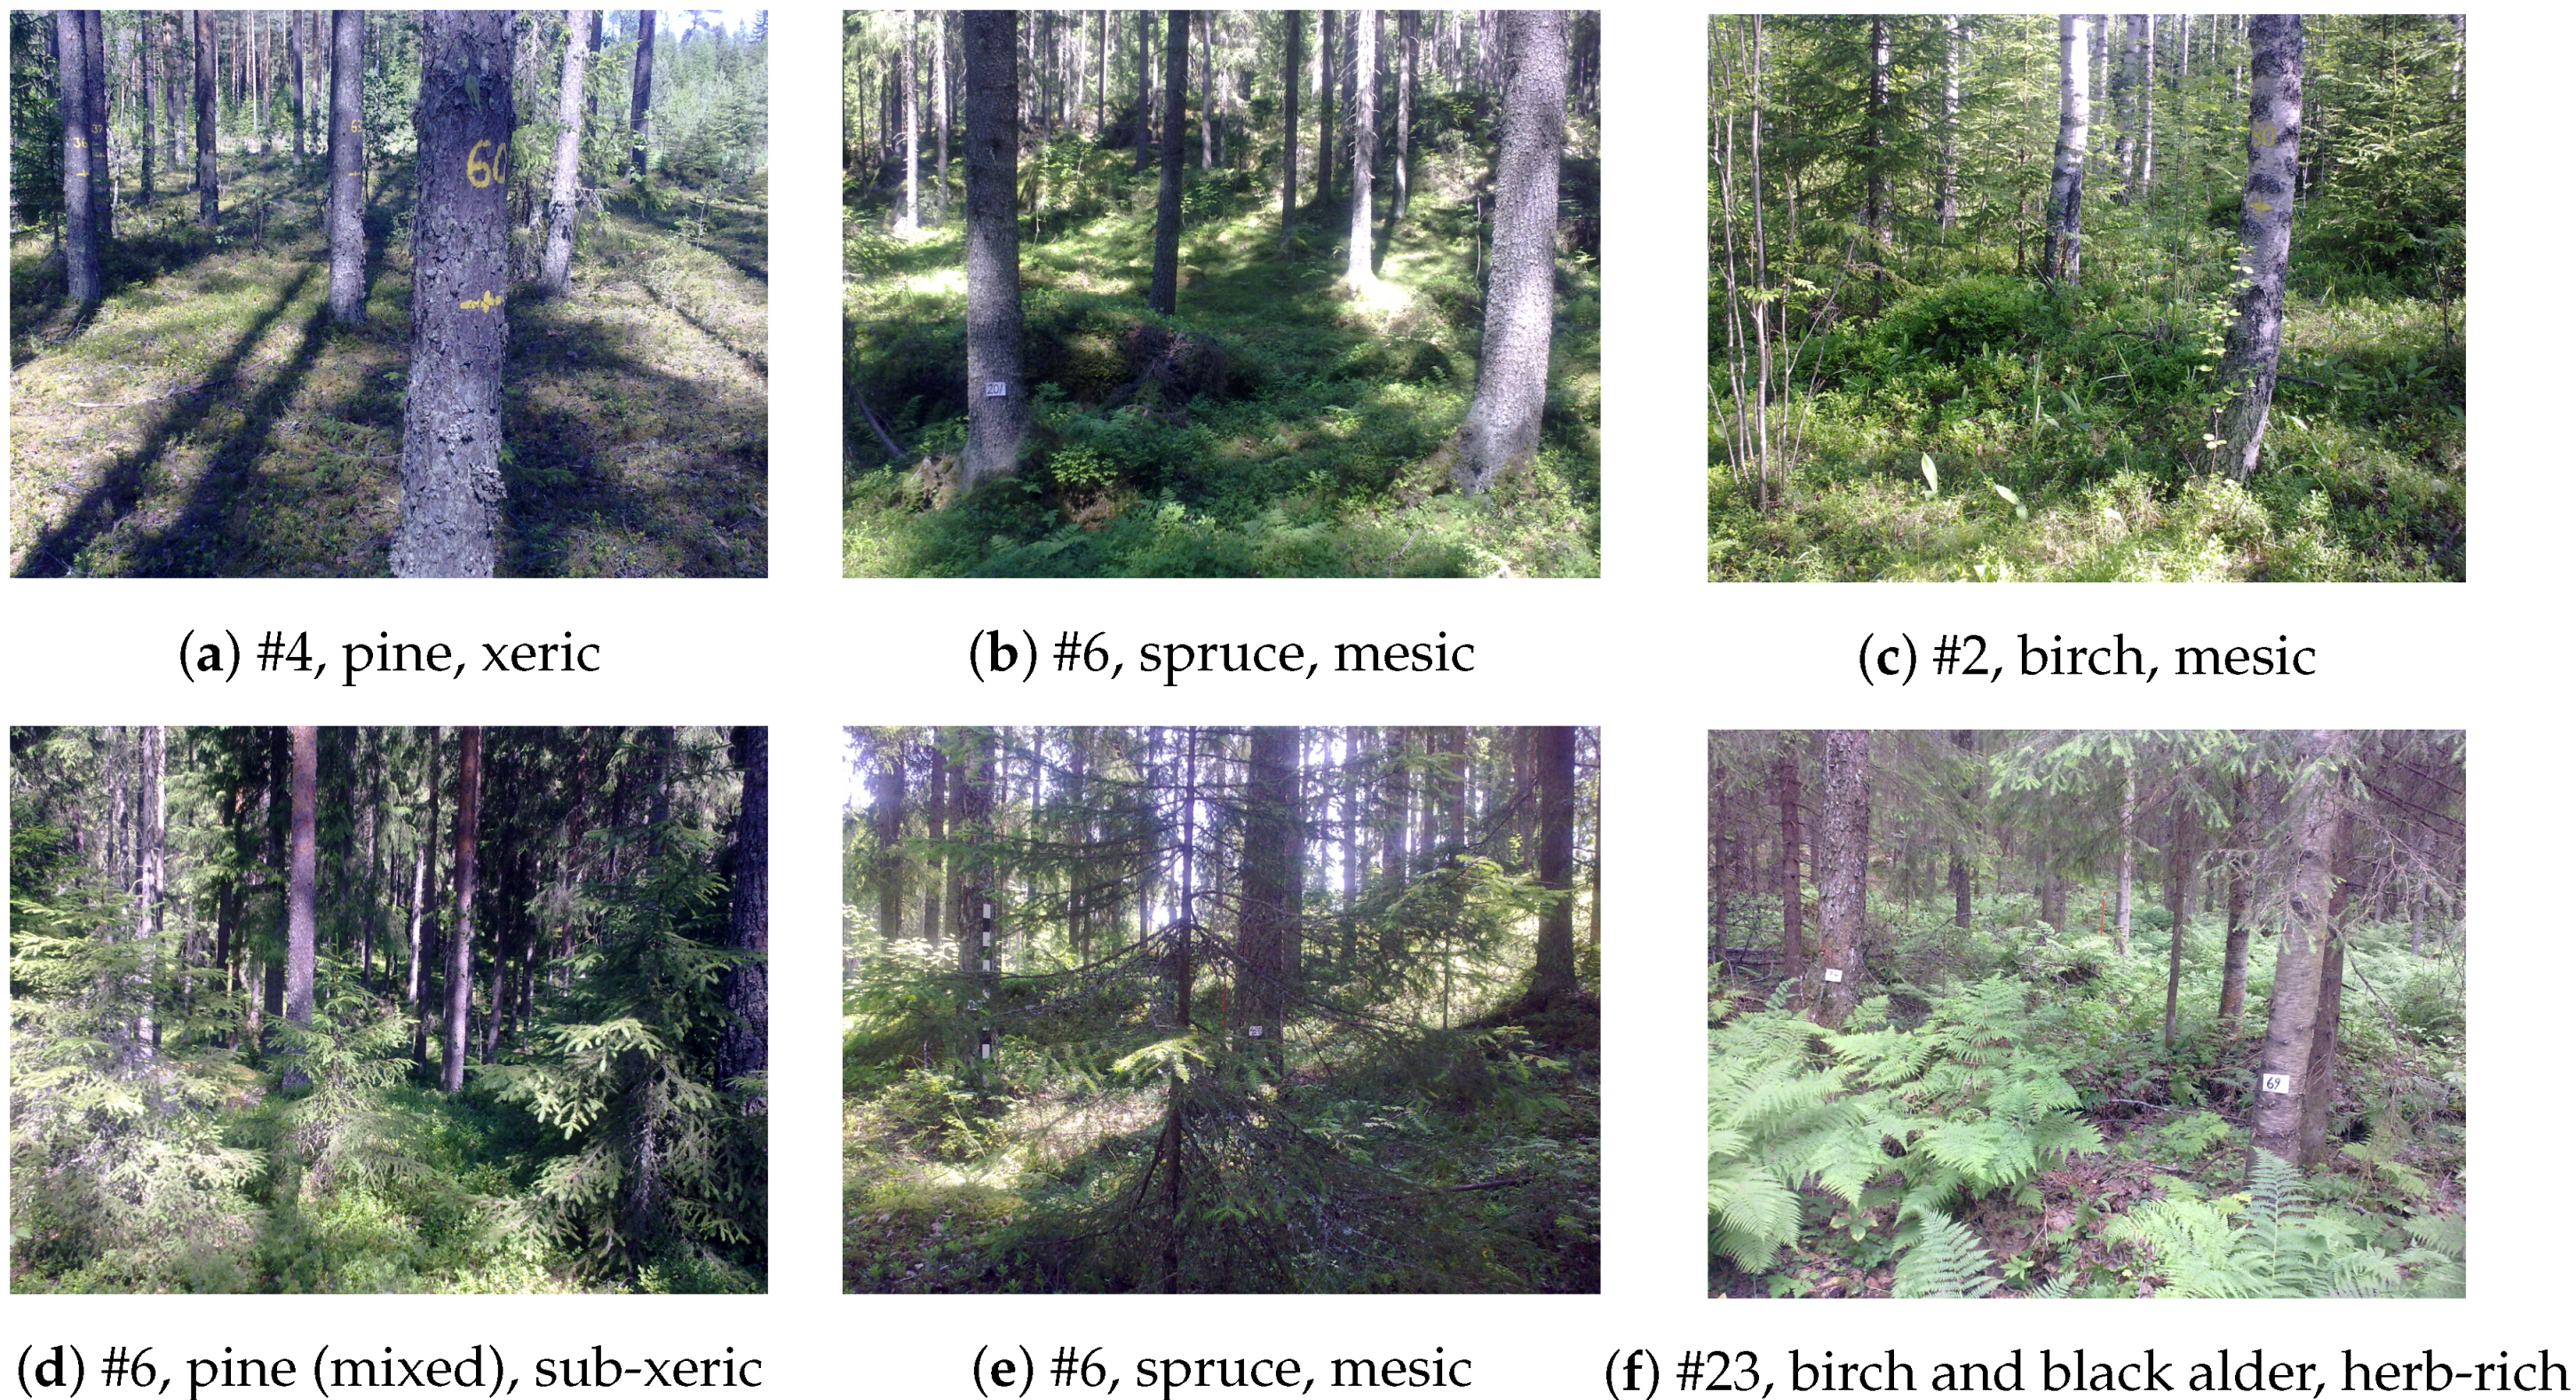
  • site type, characterizing the richness of the soil [55]: herb-rich, mesic, sub-xeric or xeric;
  • soil type: mineral or peat;
  • development class, characterizing the degree of maturity of the dominant tree species in the plot: young trees (siblings), middle-age trees (thinning), mature trees, open (clear-cuts) or shelter (cleared areas with remaining middle-aged or mature trees for regeneration);
  • estimated monetary value of timber.
The Relasphone enables instantaneous and in situ computation of forest biomass estimates (aboveground biomass AGB or stem volume), using suitable allometric equations involving basal area and stand dominant tree height [63]. In Mexico, this was done using allometric equations of the local tree species [62], that considered a single dominant height by plot for every tree species, grouped by genus (18 Pinus spp. and 54 Quercus spp.).

3.4. Accuracy Assessment

Relasphone basal area measurements and stem volume estimates were compared to reference forest inventory data for accuracy assessment, through linear regression. Accuracy measures included the coefficient of determination R 2 , absolute and relative root mean squared error ( R M S E and R M S E ( % ) ) and absolute and relative bias ( B I A S and B I A S ( % ) ); Equations (46):
R 2 = 1 - i ( y i - y ^ i ) 2 i ( y i - y ¯ ) 2 ;
R M S E = i ( y i - y ^ i ) 2 n , R M S E ( % ) = R M S E y ¯ × 100 ;
B I A S = i ( y i - y ^ i ) n , B I A S ( % ) = B I A S y ¯ × 100 .
with y i the observed values from reference forest inventory and y ¯ their mean, y i ^ the Relasphone measurements and n the total number of measurements; all sums are for i = 1 n .

3.5. Combining Relasphone Measurements with Satellite Imagery for Biomass Mapping

Satellite images can be combined with in situ data to produce maps of forest variables [64,65], such as growing stock volume (GSV) or aboveground biomass (AGB). Growing stock volume, defined as the total stem volume of all living trees per unit area (m 3 /ha), is often used as a predictor of carbon-related variables such as aboveground biomass [66]. Two simple methods were used to produce GSV and AGB maps from spatially co-registered in situ measurements and satellite images.
In Finland, the model was first computed from stand-level reference data, then transferred to a finer segment level using the Relasphone measurements for fine-tuning. The approach was based on segmentation of the GeoEye image, followed by k-means clustering and target variable estimation with the probability method [67]. Häme et al. [65] described the methodology in more detail. The Relasphone basal area measurements were used as reference data, to fine-tune the value assigned to each segment of the GeoEye image.
In Mexico, a linear regression analysis between Relasphone measurements and spectral bands of the Landsat-8 image was performed to predict aboveground biomass; Equation (7):
A G B = β + α 1 B 1 + α 2 B 2 + + α N B N + ϵ
with A G B the aboveground biomass, N the number of bands, β the intercept, α i , i = 1 N the regression coefficients, B i , i = 1 N the spectral bands (predictor variables) and ϵ a normally-distributed random variable with zero mean and constant variance, representing noise. Landsat-8 Bands 1–8 ( N = 8 ) were included in the regression analysis. Sequential forward selection (SFS) was used to reduce the number of bands in the model. The size of plots used in the AGB model was implicitly the size of the reference forest inventory plots (0.25 ha), even if only Relasphone measurements (with a corresponding variable plot radius) were used in training the model.

4. Results

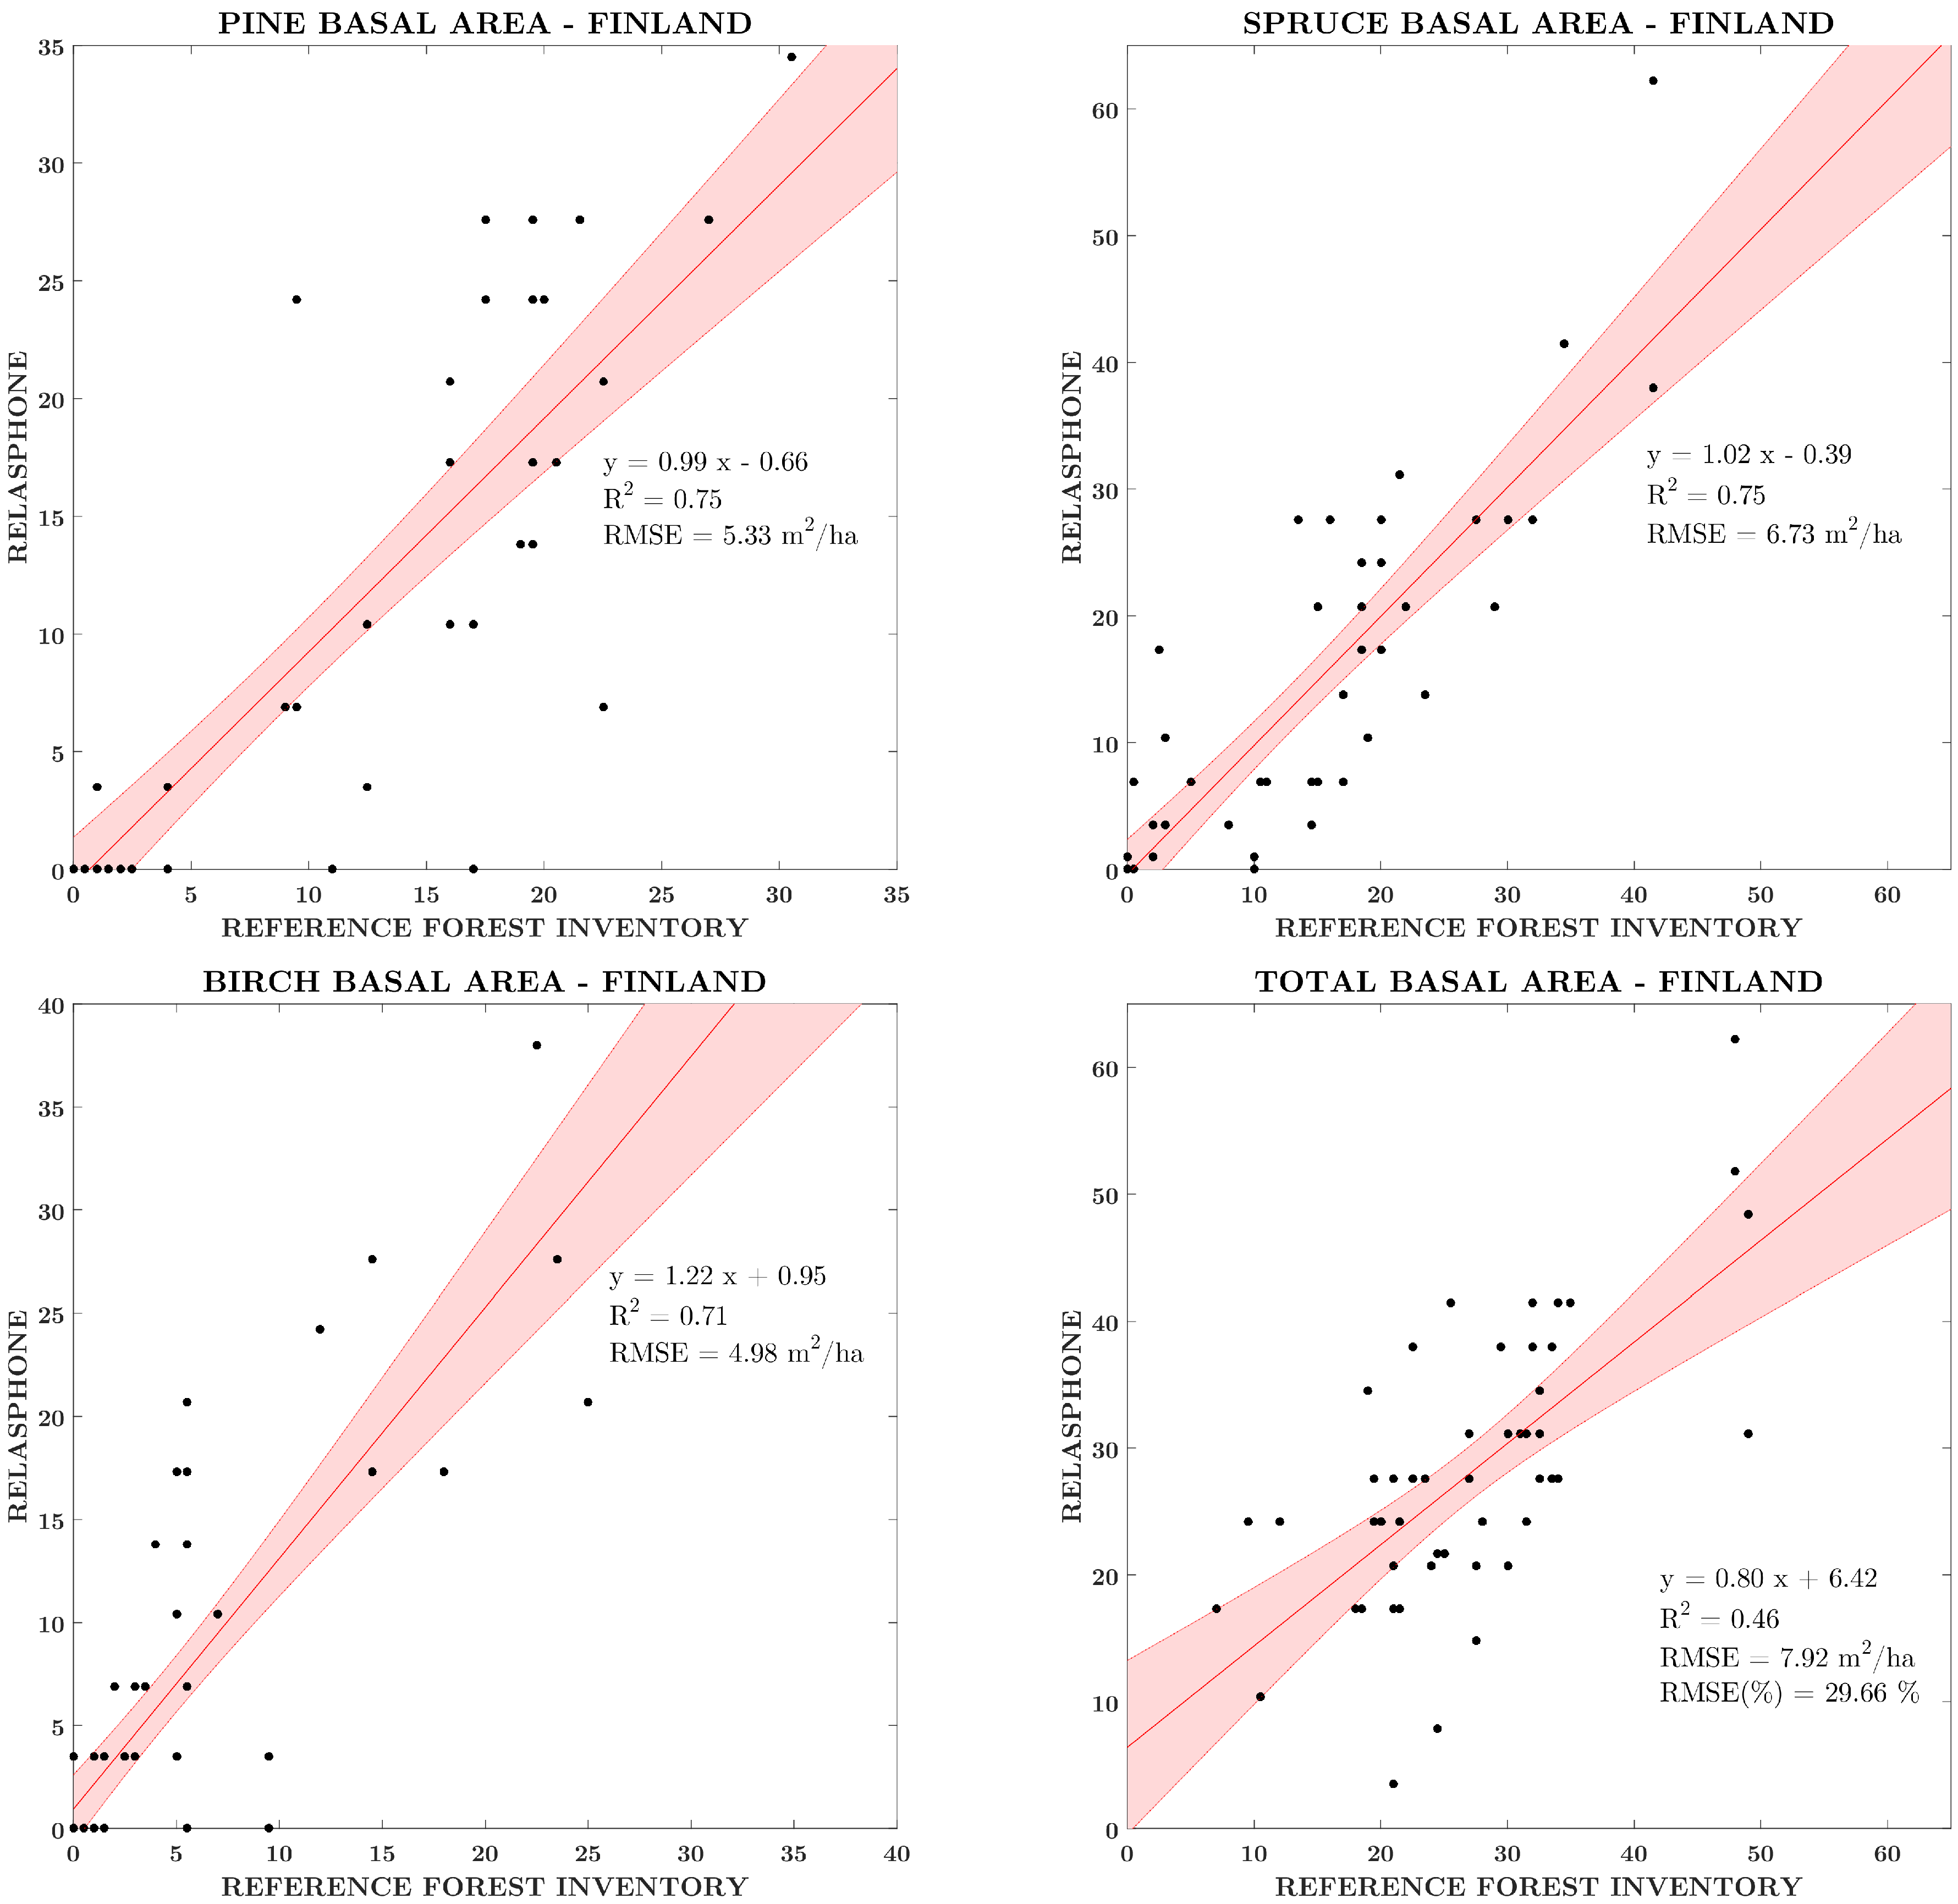
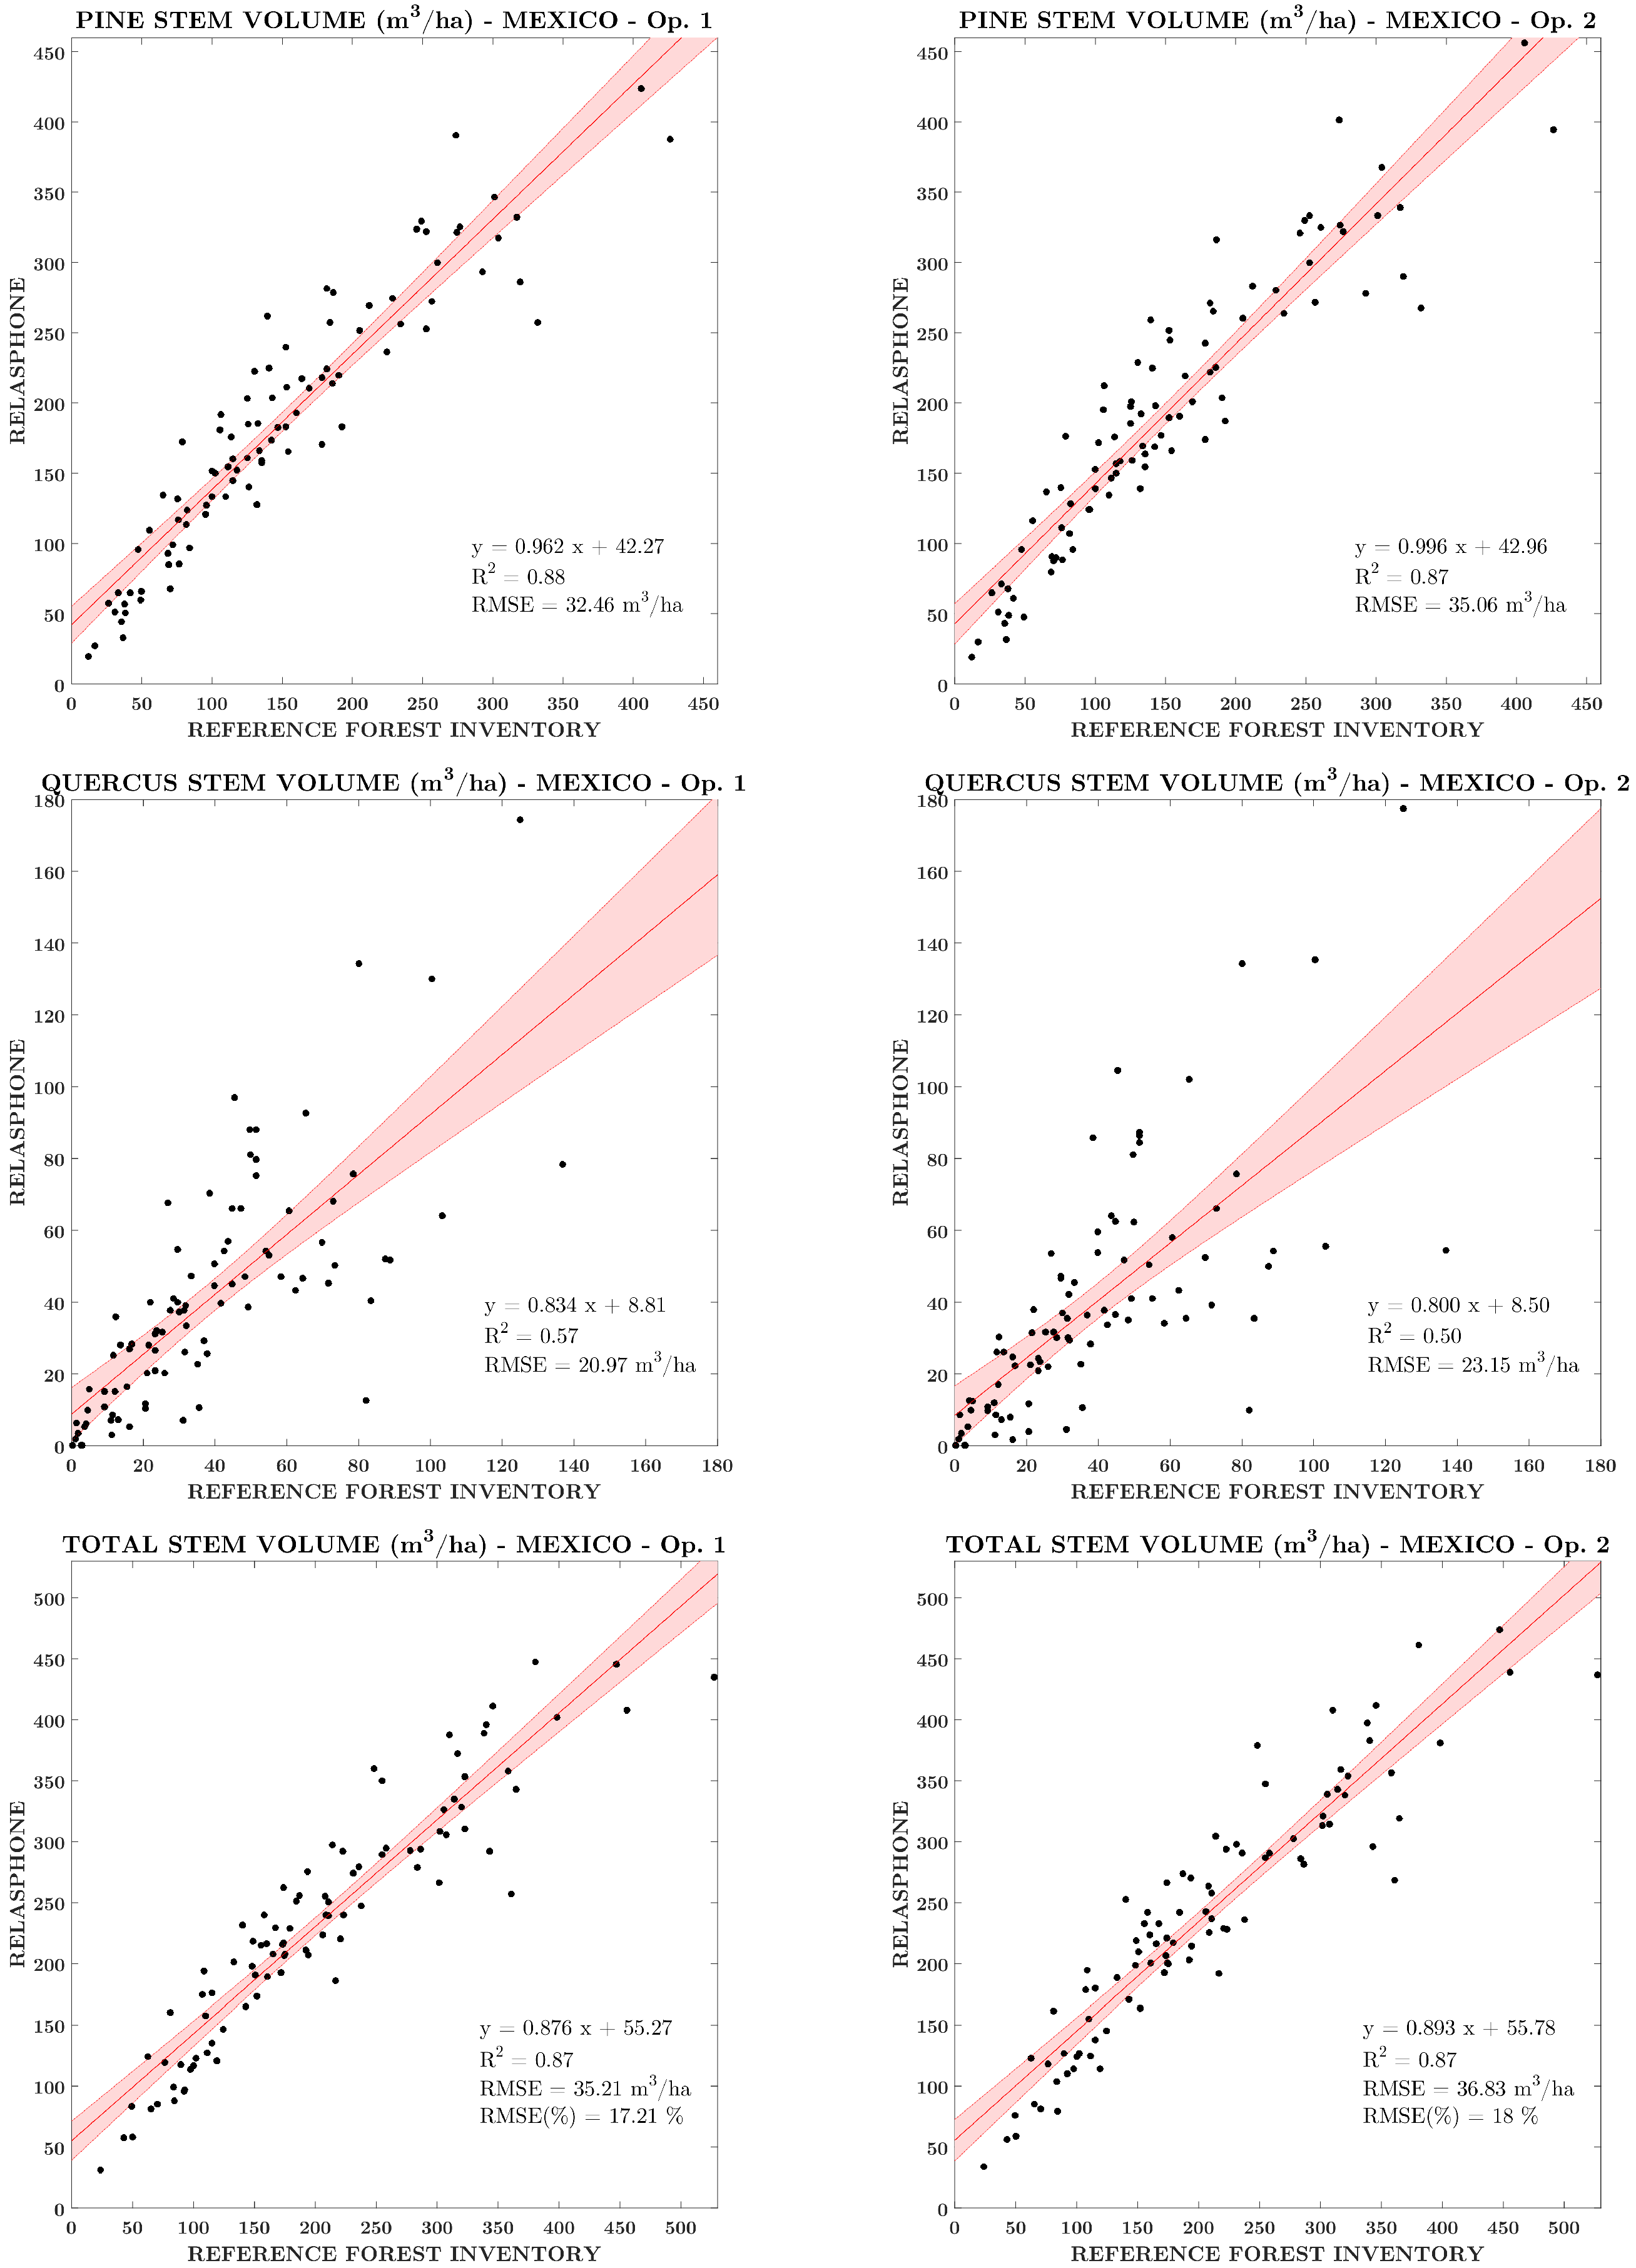
4.1. Relasphone Biomass Measurements versus Reference Forest Inventory Plot Data

Using the measurement protocol described in Section 3.2, the camera field of view of the mobile phone used in the Finland site was measured at F o V = 52 . 12 ° . Knowing the camera F o V , the size of the digital relascope gauge was computed, assuming a 3.7-mm focal length according to the technical specifications of the phone lens. The corresponding digital relascope gauge was overlaid on acquired in situ photographs, using a desktop interactive tool [47] to compute basal area in each of the 54 locations over 23 field plots in Hyytiälä, Finland. Relasphone basal area measurements were then compared to reference basal area from forest inventory data for accuracy assessment; see Figure 7. The scatterplots for each tree species include the linear regression line and 95% confidence interval.
Table 4 presents the goodness of fit statistics between Relasphone basal area measurements and reference forest inventory data. The fit was equally good with pine and spruce ( R 2 = 0 . 75 , with R M S E = 5 . 33 m 2 /ha and R M S E = 6 . 73 m 2 /ha, respectively), and almost as good with birch ( R 2 = 0 . 71 , R M S E = 4 . 98 m 2 /ha). The regression of the total basal area was not as good ( R 2 = 0 . 46 , R M S E = 7 . 92 m 2 /ha), although R M S E ( % ) = 29 . 66 % was moderate. The mean relative bias between the Relasphone measurements and reference basal area, as reported in [47], was excellent for spruce ( - 0 . 8 % ), good for pine ( - 7 . 9 % ) and in total ( + 4 . 1 % ), but worse for birch ( + 43 . 2 % ); see Table 5.
In Mexico, basal area was measured directly in situ with the Relasphone app, which comes with a simple calibration tool to estimate the camera field of view and set the relascope gauge accordingly. Two users visited all of the field plots and independently measured basal area with the Relasphone. After removing outliers and missing Relasphone measurements for either observer, measurements from 92 plots out of 95 initial plots (Table 3) were compared with the reference forest inventory data.
Figure 8 shows the scatterplots between Relasphone-based stem volume estimates and reference stem volume from forest inventory data, for each tree species in the Durango site in Mexico. For the 92 plots, goodness of fit statistics between Relasphone-based stem volume estimates and reference forest inventory data are given in Table 6. The best fit between estimated and reference stem volume was obtained with the dominant species Pinus spp. ( R 2 = 0 . 87 0 . 88 ) and total stem volume ( R 2 = 0 . 87 ). The corresponding R M S E was in the order of 32 to 37 m 3 /ha, for a range of stem volume from 23–528 m 3 /ha (Table 3). The fit was significantly lower with Quercus spp. ( R 2 = 0 . 5 0 . 57 ) and worse for other coniferous ( R 2 = 0 . 34 0 . 35 ) and broad-leaved ( R 2 = 0 . 44 0 . 47 ) species. Measurements performed independently by the two users were consistent, with a good agreement on all measures in Table 6. Relative error on total basal area varied almost the same for both observers ( R M S E 1 ( % ) = 17 . 21 and R M S E 2 ( % ) = 18 % ).

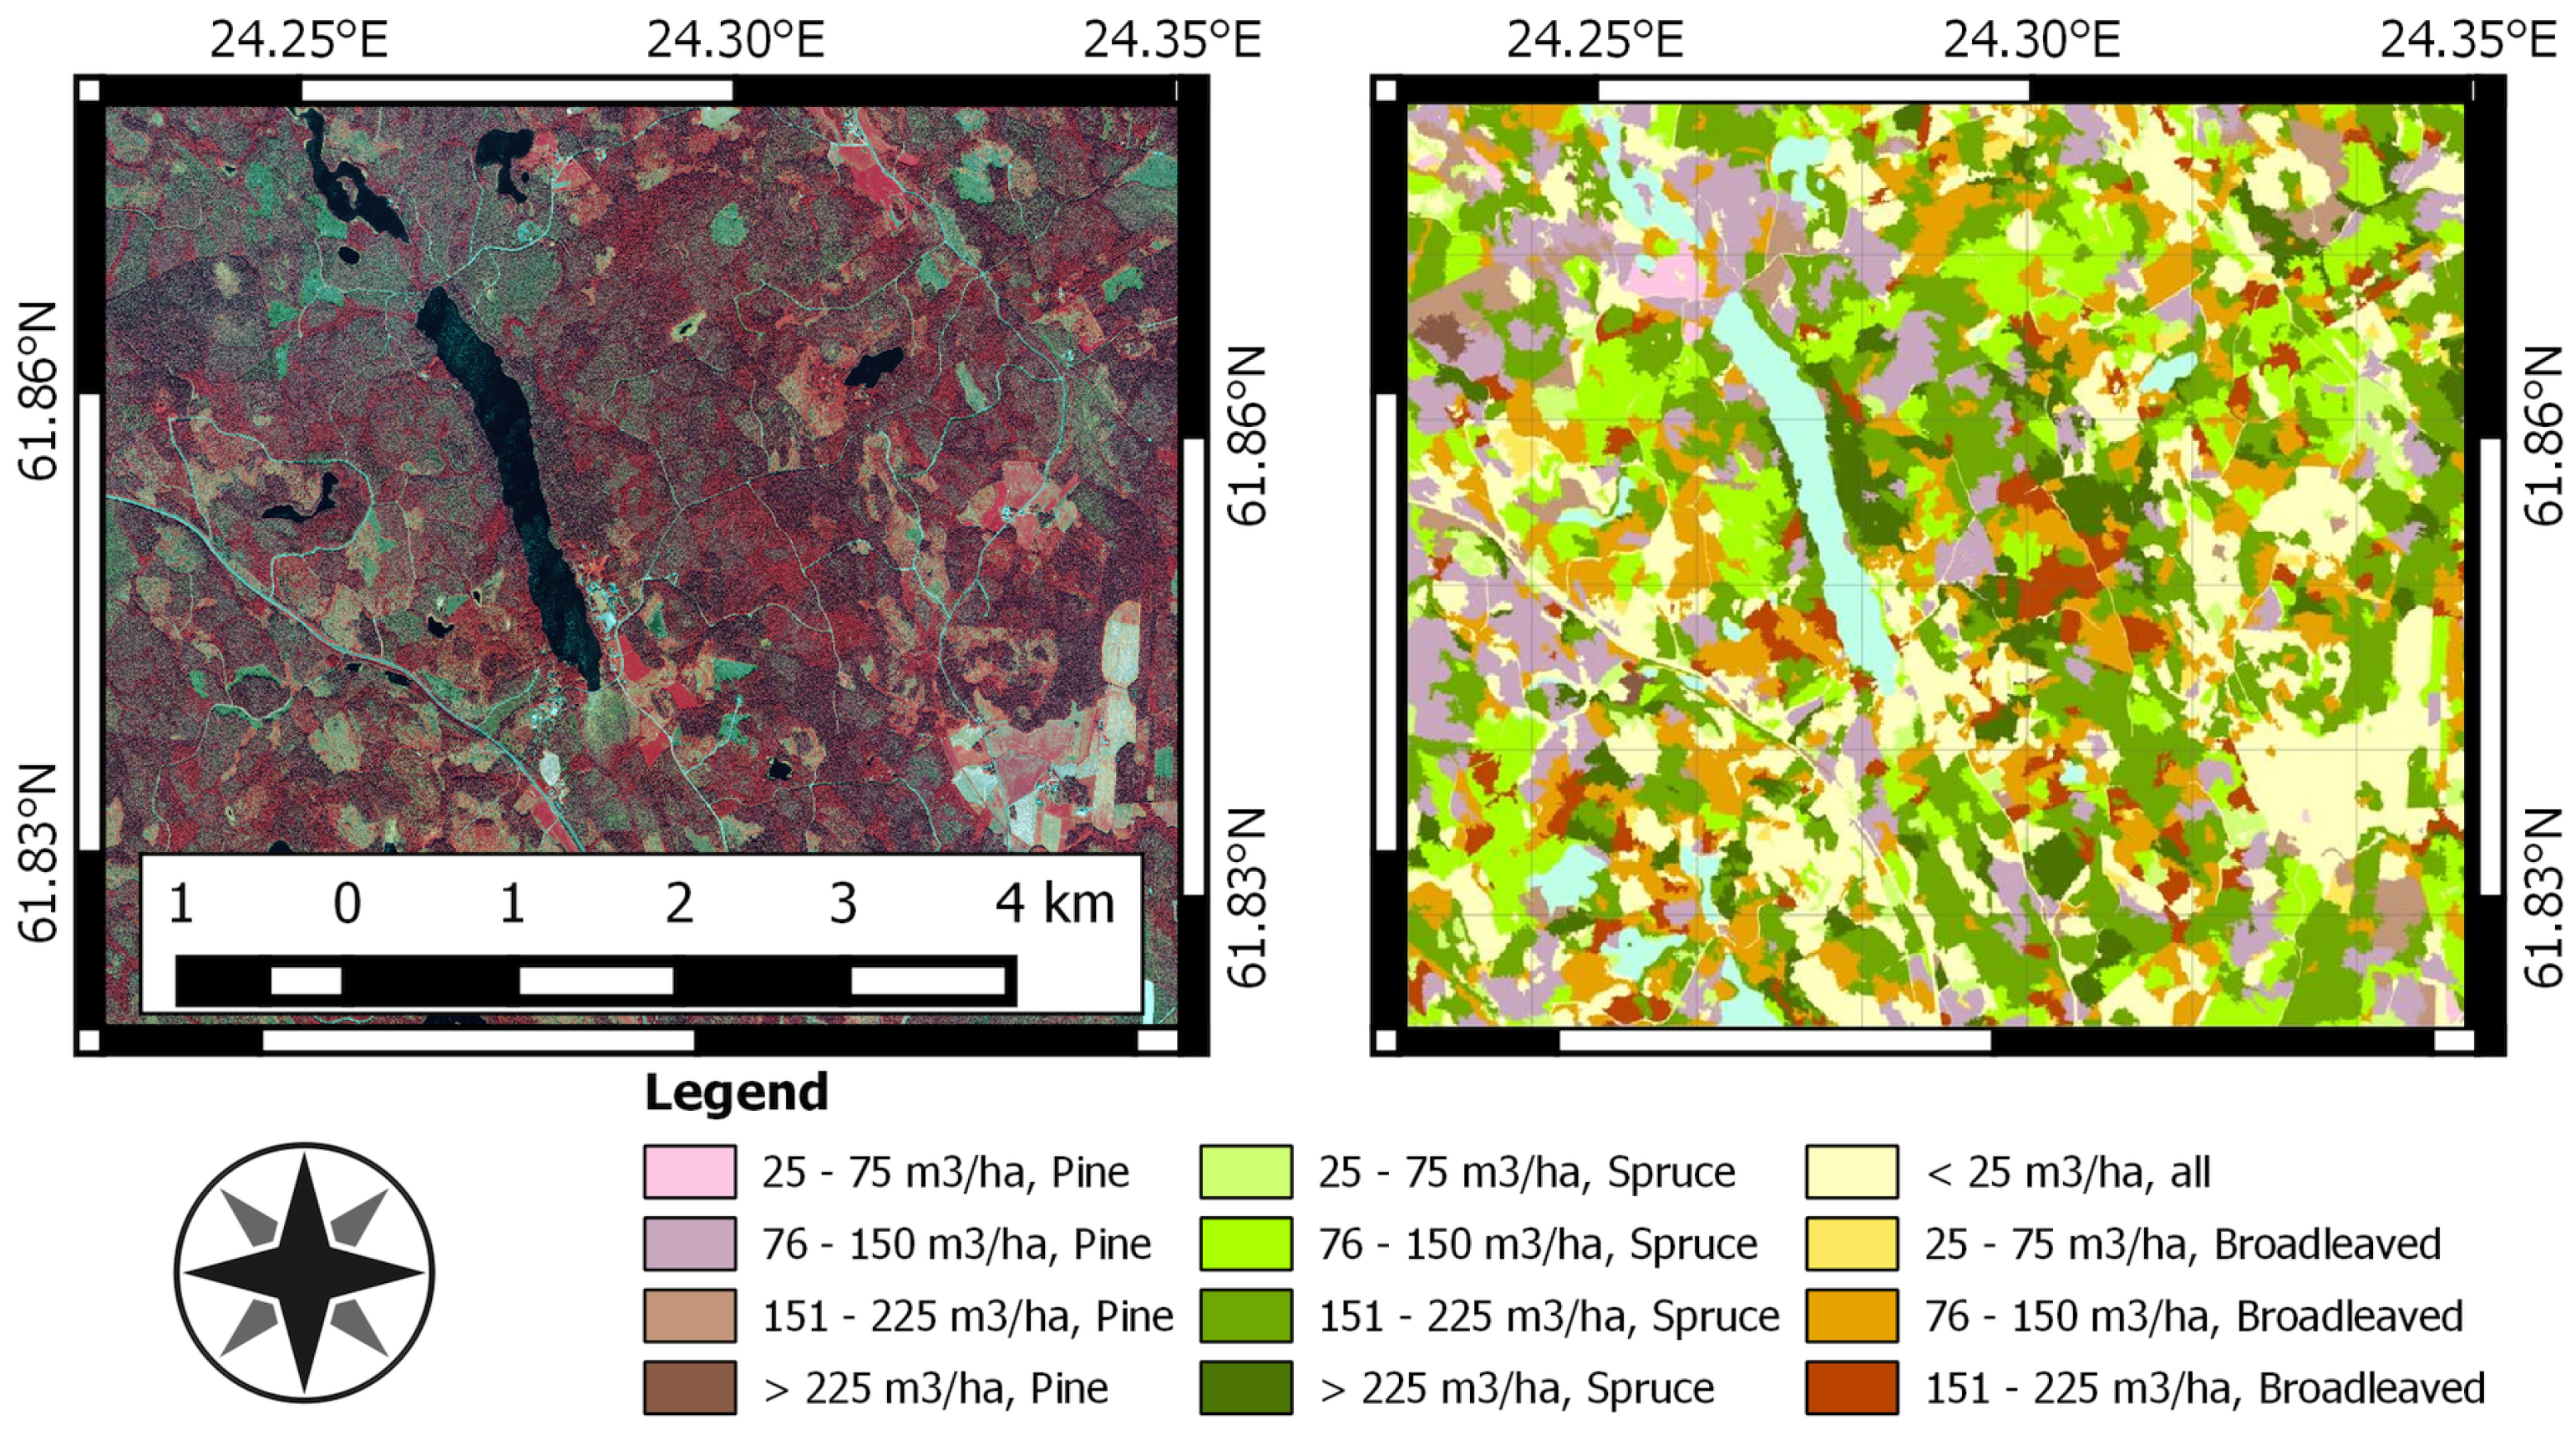
4.2. Satellite Biomass Maps Using Relasphone Observations

In situ biomass reference data can be combined with various types of optical satellite imagery (e.g., VHR, Landsat, Sentinel-2) to produce biomass maps. Figure 9 shows a GSV map obtained from the GeoEye image and the Relasphone data collected in Hyytiälä, Finland.
In Mexico, SFS returned a model using the SWIR2 (2.11–2.29 μ m) and green (0.53–0.59 μ m) bands of the Landsat-8 image. The reference data used in training the model were from Relasphone measurements (92 plots). The standard error of the model estimate was 70 m 3 /ha (34% of the mean of the measured stem volumes). Figure 10 presents the AGB map created from the Landsat-8 image using Relasphone stem volume measurements as the reference data. This map is comparable to the AGB map in [60], produced with reference forest inventory data over the same UMAFOR 1008 region.

5. Discussion

5.1. Quality of Relasphone Measurements

5.1.1. Relasphone Measurements versus Reference Forest Inventory Plot Data

In Finland, pine and spruce basal area measured with the Relasphone were in good agreement with reference forest inventory plot data (Figure 7, Table 4 and Table 5). However, birch basal area was over-estimated (+43% relative bias on basal area; Table 5), which could be explained by two phenomena. Birch trees in the selected plots were relatively thinner than other trees, increasing the likelihood to appear at the limit of the relascope angle gauge, which determines whether or not to include the tree in basal area computations. Furthermore, reference plots were measured up to four years before the Relasphone measurements took place. The annual basal area growth is 1%–4% in the forests examined and was not taken into account when comparing Relasphone measurements with the reference data. Assuming a 3% annual growth rate in basal area, the missing growth effect could account for up 12% overestimation in plots with the oldest measurements (3–4 years before Relasphone measurements). The effect could be more pronounced on birch plots because those plots contained younger trees growing faster and because birch plots accounted for a smaller part of the total basal area; there were only three birch-dominated plots among the 23 reference plots (Table 2). There was a slight positive bias for total basal area (4.1%), which in part could be due to the missing growth. Finally, outliers were not cleaned before linear regression between Relasphone measurements and reference data on the Finland site, which contributed to decreasing the accuracy.
In Mexico, Relasphone-based stem volume estimations for Quercus spp., other coniferous and other broad-leaved species were not as good as with Pinus spp. or total stem volume (Figure 8). This was likely due to the allometric equations linking basal area measurements to stem volume [62], which were supported by a single height by plot, the dominant height of Pinus stems. Independent measurements performed by two users were consistent with one another; see Table 6. This result suggests that the Relasphone can provide reliable and consistent measurements with more users.
The Mexican users reported in [48] that the Relasphone has “a great data acquisition capacity in forest stands with presence of gaps” and a “good sensibility to changing conditions within a forest stand”. They think the Relasphone is a “good working tool, from the operational point of view”. It is noted that the app cannot fully replace traditional forest inventory yet, since very accurate dendrometric measurements are required for forest inventory in Mexico. The Relasphone can however contribute to filling the spatial and temporal gaps in in situ data availability, especially since the app is available for free.

5.1.2. Relasphone Measurements versus Other Forest Mensuration Methods

Relasphone measurements can also be compared with other forest mensuration methods. Stand basal area estimates by the laser-relascope [38] have a better relative error of 2% compared to the traditional relascope [39], after correcting for tree occlusions, which was not done for Relasphone measurements in Finland. Yao et al. [40] reported R 2 = 0 . 66 (lower than the Relasphone results in Finland) for plot-level basal area estimation with TLS, but a slightly better agreement for biomass ( R 2 = 0 . 85 ), similar to the best results for pine and total stem volume in Mexico. The accuracies of the commercial forest inventory app Trestima was reported on 25 plots from another site in southern Finland [46]. The relative R M S E for Relasphone-based total basal area in Finland ( R M S E ( % ) = 29 . 66 % ; Table 4) was comparable to that of Trestima (19.7%–29.3%) and slightly better in Mexico ( R M S E ( % ) = 17 . 21 % 18 % ). The relative biases on basal area measurements for spruce ( B I A S ( % ) = - 0 . 8 % ), pine ( - 7 . 9 % ) and in total ( + 4 . 1 % ) (Table 5) were significantly lower for the Relasphone than for Trestima (respectively + 7 . 8 % , + 16 . 8 % and + 15 . 2 % ). However, for broad-leaved trees (mainly birch), the Relasphone ( B I A S ( % ) = + 43 . 2 % ) did not perform as well as Trestima ( + 11 . 2 % ). This may be partly due to the challenging nature of birch-dominated plots selected in the Finland study site.

5.1.3. Quality of Relasphone Measurements as VGI Data and Geo-Location Issues

Several studies point out that not only quantity [68], but quality of volunteered geographical information (VGI) is crucial [69,70,71]. The overall quality of Relasphone measurements was good in both sites, but can be improved for birch in Finland and Quercus and other non-dominant tree species in Mexico. For basal area in forest inventory, low bias is more important than low R M S E . Since measurements were made at the plot level, it is expected that accuracies would improve by averaging into variables at the stand level (0.5 ha–10 ha), which is the scale usually considered in forest management. Further tests with more measurements involving citizens will be performed in the future to consolidate our results, as there can be quality discrepancies between data collected by experts and non-experts [72]. The ambition is to maintain or even increase the quality of the forest mensuration data acquired by the Relasphone as the number of users grows. If large in situ datasets of good quality can be collected, the concept is expected to be a very cost-effective and flexible solution for substantially enhancing the availability of forest area in situ measurements and observations, required to support the remote sensing-based Copernicus Land Service, forest management planning and a wide range of forest and environment-related surveys. Accurate and frequent reference data are beneficial also to local, regional and national stakeholders involved in decision-making or business activities in environmental stewardship and forest management. The concept would also facilitate local communities to become aware of the current state of their forests.
Geo-localization of images can be a challenge; we have observed geo-location inaccuracies of 20–50 m from mobile phone GNSS under the canopy of Finland. This corresponds to 1 or 2 pixels in Landsat images and between 2 and 5 pixels in Sentinel-2 images. In order to minimize this issue, smartphone apps could be used in predefined locations of known coordinates to collect in situ data, as was done in the two sites in this study. When used outside forest inventory plots by citizens, locations of known coordinates could still be pre-determined in the same fashion as geocaching games [73], for example. Maps showing the locations of the desired measurements could be provided by scientists for citizens to visit in situ. Online communities with a wide user base, such as Geocaching [73] or the Geo-Wiki platform [15], could support these types of activities. Another solution to increase geo-location accuracy is to wait at the measurement location up to 20 minutes [57]. This would however negate the main benefits of smartphones compared to traditional forest inventory, mainly the speed and ease of measurements. In the longer term, the accuracy of GNSS under canopy could improve along with future upgrades in GNSS and smartphone technologies.

5.1.4. Considerations on the Quality of Mobile Phone Sensors

Because the Relasphone is an interactive tool that does not acquire or process photographs, the quality of the phone camera is not critical for basal area estimation. Screen resolution is slightly more relevant when comparing the size of the angle gauge with the diameter of each tree. Limit cases are solved with the assistance of the zoomed view, as shown in Figure 5. Overall, the quality of Relasphone measurements is not directly affected by the quality of the smartphone or its camera, or only marginally in a rare number of occurrences. The Relasphone was designed to be able to operate even on mid- to low-range smartphones, not necessarily requiring the best phone cameras available. The rationale for this design choice was that not every citizen could afford the most expensive mobile phones, especially in the developing countries where participatory in situ measurements are perhaps needed most.

5.2. Relevance of the Relasphone for Citizen Science

In both study sites, data acquisition was easy and fast when compared to reference forest inventory data and relatively reliable. In Finland, Relasphone measurements were carried out by a user who had limited knowledge of forestry and was sent alone to his first field trip in a forest that he visited for the first time. Maps and precise localization of the desired observations were provided by experienced foresters, who did not however take part to the actual data acquisition. In Mexico, Relasphone measurements were collected by two self-trained Mexican users from the UMAFOR 1008 Forest Management Unit. Although the users have a background in forestry, they received only short instructions remotely on the basic logic of the Relasphone app, and the acquisitions were made with no further training. We hypothesize that these conditions were close to those of a real-world citizen science measurement campaign, where non-experts collect data without necessarily receiving individual or extensive training.
Even though the in situ data reported in this study were acquired by a scientist and forestry experts, it is expected that similar results can be obtained with citizens, since the application is easy and straightforward to use for non-specialists. We are looking forward to connecting with networks of citizen scientists willing to use the Relasphone. In order to get citizens more involved with Relasphone measurements, several strategies can be adopted in the future:
  • Local communities should be involved, from nature enthusiasts to school students. This was not easily feasible in the Mexican study site due to the remote location of the plots and hilly terrain. Forests located closer to large cities or in more accessible terrain can more easily bring locals to take part in such citizen science measurements. In more remote locations, approaches such as geocaching games [73] could be used, targeting nature-enthusiast citizens.
  • In Finland, the network of small forest owners has a natural interest in utilizing the application, and private forest owners are often local to their forest of interest during summer.
  • Gamification or “serious games” appear to be one of the most efficient ways to engage and attract users for taking part in citizen science projects [74].

5.3. Relevance of the Relasphone for Earth Observation and Forest Biomass Mapping Worldwide

In situ data collected with the Relasphone were successfully combined with VHR (Figure 9) and Landsat (Figure 10) optical satellite images to produce growing stock volume and aboveground biomass maps, respectively. The results clearly demonstrate that the Relasphone concept is sound and can provide reliable reference forest biomass data. Other satellite images can be combined with Relasphone measurements, including Sentinel-2 or even synthetic aperture radar (SAR) images.
Presently, field data for forest inventory and management plans are collected by forestry professionals, but it can be foreseen that by combining citizen science, satellite imagery and UAV data (Unmanned Aerial Vehicle), the principal material for forest management plans of acceptable quality can be collected without professional foresters’ work on the field. Such opportunity could significantly increase the area coverage of forest management plans, particularly in countries where funds for forest inventory are limited [48].
The Relasphone concept can be easily applied for other purposes that require similar information on a wider scale or with frequent updates, in combination with remote sensing imagery. The users of this category include the non-governmental organizations (NGOs) that are concerned about nature conservation and illegal cuttings, the European Commission that will fund EU-wide land cover mapping and the FAO that conducts global survey of forest resources, for instance.

5.4. Applicability of the Relasphone in Tropical Regions

This study also demonstrated that the Relasphone has easily been adapted to different biomes (boreal and temperate zones), terrains (flat low-elevated and mountainous), tree species (including mixed and uneven-aged plots) and to forests with different management practices. This suggests that the Relasphone could also perform well in tropical regions, in locations where the undergrowth vegetation does not prevent visibility of the tree stems at breast height.
Tropical forests pose additional challenges due to the many tree species and the associated allometric equations. When using a stand model to estimate volume, tree species can be grouped by genus. This was done in the Mexico study site for 18 Pinus spp. and 54 Quercus spp., where tree species of the same genus have similar growth patterns. Grouping of tree species by genus through the allometric equations for AGB estimation has also been successful in tropical forests of Southeast Asia [75]. In Vietnam and Indonesia, the genus-specific equations for two genera improved the accuracy of AGB estimates compared to allometric equations for mixed-species equations [75].
If tree species are not known or allometric equations cannot be used to estimate volume or biomass, basal area can still be measured for any tree. The inaccuracies would increase when converting to GSV or AGB. When basal area is well known for a certain area, we can assume that the annual increment of GSV (forest growth) can still be quantified in that area.
Magnabosco Marra et al. [76] carried out measurements and AGB modeling of 727 trees, from 101 genera and 135 species in Brazilian tropical forests. Good individual tree model fits did not necessarily translate into reliable predictions of AGB at the landscape level. They concluded that predicting biomass accurately at the landscape level in very diverse and structurally complex tropical forests requires predictors that express inherent variations in species architecture, such as floristic composition and size-distribution variability of the target forest, and that these predictors are often unavailable or only in limited areas. Citizen science solutions like the Relasphone can contribute to improving the availability of such data.
A potential application of the Relasphone is the REDD+ process that will require the inventory of forest resources over wide areas in the tropical regions [48]. For instance, inexpensive smartphones with GNSS could be given to local populations in the developing countries, in exchange of measurements or photographs from the forests to support satellite image mapping. These activities would in turn serve the economy of the country through sustainable use of forest resources. A similar approach as Pratihast et al. [22] could be used to involve local communities in REDD+ monitoring activities. Once the Relasphone concept is successfully transferred to tropical forests with a sufficient participation of citizen scientists, it can dramatically change the way forest inventory, databases and management plans are produced globally and may lead to major cost reductions.

5.5. Future Research and Developments

The next step is to increase citizen engagement in the collection of Relasphone measurements from forests around the world, by applying gamification or in connection with existing citizen science networks. The Relasphone app will be modified to include custom allometric equations and tree species, allowing an easier and faster deployment anywhere in the world, without additional software modifications. The possibility to release the application as open source is also considered. The Relasphone app is currently being tested in stands of Pinus radiata and Pinus pinaster, in the northwest of Spain. We are open to scientific and technical collaboration in order to deploy and test the Relasphone in other areas of the world, especially in tropical regions where the availability of ground reference data for spaceborne forest biomass estimation is of the utmost importance [29].

6. Conclusions

Citizen science can provide reference data for satellite image analysis. In this study, we presented the Relasphone concept, a free smartphone application to collect forest inventory measurements and in situ biomass estimates. The accuracy of Relasphone measurements was assessed by comparison with reference forest inventory plot data in two mixed forest sites, located in separate biomes—the southern boreal zone in Finland and the temperate zone in Durango, Mexico—with different tree species and forest management regimes. Results indicate a good agreement with reference plot data and consistent measurements when performed by two different observers. Basal area and stem volume measured with the Relasphone were used to compute biomass maps in Finland and Mexico from a GeoEye and a Landsat-8 image, respectively. The results validate the Relasphone app as a provider of reference training data for satellite image analysis. In the future, we will involve citizens across the globe in the data collection process, with a special focus on tropical regions.

Acknowledgments

This research was supported by the European Space Agency (ESA) through the project EducEO (Education for Earth Observation capitalizing on a Citizen Science approach (2014–2015) -ESA contract 4000111132/14/I-AM), the Finnish Funding Agency for Innovation (TEKES) with the project Social Forest Planning (2010–2011, contract 40209/10) and SEP-PROMEP (Secretaría de Educación Pública-PROgrama de MEjoramiento del Profesorado) with the project Seguimiento y Evaluación de Sitios Permanentes de Investigación Forestal y el Impacto Socio-económico del Manejo Forestal en el Norte de México. The authors wish to acknowledge Aarne Hovi (with University of Helsinki at the time of the study) for setting up the field measurements in Hyytiälä (Finland), Yrjö Rauste (VTT Technical Research Centre of Finland Ltd) for computing the biomass map in Finland, as well as Daniel Molina Medrano and Arturo Quiñones Mallorquin (of the Ejido UMAFOR 1008) for carrying out Relasphone measurements in Mexico. The authors wish to thank the three anonymous reviewers for their fruitful comments and suggestions that improved this article.

Author Contributions

Matthieu Molinier co-designed the Relasphone concept, collected and analyzed in situ observations in Hyytiälä, Finland, and wrote the manuscript. Tuomas Häme co-designed the Relasphone concept, conceived of and designed the experiments in Finland and Mexico and reviewed the manuscript. Timo Toivanen developed the Relasphone mobile application, computed the forest biomass map in Mexico and wrote the corresponding parts in the manuscript. Renne Tergujeff contributed to the Relasphone development and the corresponding sections in the manuscript. Ilkka Korpela selected and prepared locations for in situ acquisitions in Finland together with Aarne Hovi and provided the corresponding reference forest inventory data. Carlos A. López-Sánchez and José J. Corral-Rivas collected and analyzed Relasphone and reference forest inventory data in Durango, Mexico, and contributed to the corresponding sections in the manuscript.

Conflicts of Interest

The authors declare no conflict of interest.

References

  1. Sieber, R. Public participation geographic information systems: A literature review and framework. Ann. Assoc. Am. Geogr. 2006, 96, 491–507. [Google Scholar] [CrossRef]
  2. Goodchild, M.F. Citizens as sensors: The world of volunteered geography. GeoJournal 2007, 69, 211–221. [Google Scholar] [CrossRef]
  3. Heipke, C. Crowdsourcing geospatial data. ISPRS J. Photogramm. Remote Sens. 2010, 65, 550–557. [Google Scholar] [CrossRef]
  4. Elwood, S.; Goodchild, M.F.; Sui, D.Z. Researching volunteered geographic information: Spatial data, geographic research, and new social practice. Ann. Assoc. Am. Geogr. 2012, 102, 571–590. [Google Scholar] [CrossRef]
  5. See, L.; Mooney, P.; Foody, G.; Bastin, L.; Comber, A.; Estima, J.; Fritz, S.; Kerle, N.; Jiang, B.; Laakso, M.; et al. Crowdsourcing, citizen science or volunteered geographic information? The current state of crowdsourced geographic information. ISPRS Int. J. Geo-Inf. 2016, 5, 55–77. [Google Scholar] [CrossRef]
  6. Silvertown, J. A new dawn for citizen science. Trends Ecol. Evol. 2009, 24, 467–471. [Google Scholar] [CrossRef] [PubMed]
  7. Estrin, D. Participatory sensing: Applications and architecture. IEEE Int. Comput. 2010, 14, 12–14. [Google Scholar] [CrossRef]
  8. Khan, W.; Xiang, Y.; Aalsalem, M.; Arshad, Q. Mobile phone sensing systems: A survey. IEEE Commun. Surv. Tutor. 2013, 15, 402–427. [Google Scholar] [CrossRef]
  9. Dickinson, J.L.; Zuckerberg, B.; Bonter, D.N. Citizen science as an ecological research tool: Challenges and benefits. Ann. Rev. Ecol. Evol. Syst. 2010, 41, 149–172. [Google Scholar]
  10. Conrad, C.C.; Hilchey, K.G. A review of citizen science and community-based environmental monitoring: issues and opportunities. Environ. Monit. Assess. 2011, 176, 273–291. [Google Scholar] [CrossRef] [PubMed]
  11. Ferster, C.J.; Coops, N.C. A review of earth observation using mobile personal communication devices. Comput. Geosci. 2013, 51, 339–349. [Google Scholar] [CrossRef]
  12. Comber, A.; See, L.; Fritz, S.; Van der Velde, M.; Perger, C.; Foody, G. Using control data to determine the reliability of volunteered geographic information about land cover. Int. J. Appl. Earth Obs. Geoinf. 2013, 23, 37–48. [Google Scholar] [CrossRef]
  13. Fonte, C.; Bastin, L.; See, L.; Foody, G.; Lupia, F. Usability of VGI for validation of land cover maps. Int. J. Geogr. Inf. Sci. 2015, 29, 1269–1291. [Google Scholar] [CrossRef]
  14. See, L.; Fritz, S.; McCallum, I. Satellite data: Beyond sharing earth observations. Nat. Corresp. 2014, 514, 168. [Google Scholar] [CrossRef] [PubMed]
  15. Fritz, S.; McCallum, I.; Schill, C.; Perger, C.; Grillmayer, R.; Achard, F.; Kraxner, F.; Obersteiner, M. Geo-Wiki.Org: The use of crowdsourcing to improve global land cover. Remote Sens. 2009, 1, 345–354. [Google Scholar] [CrossRef]
  16. Fritz, S.; McCallum, I.; Schill, C.; Perger, C.; See, L.; Schepaschenko, D.; Van der Velde, M.; Kraxner, F.; Obersteiner, M. Geo-Wiki: An online platform for improving global land cover. Environ. Model. Softw. 2012, 31, 110–123. [Google Scholar] [CrossRef]
  17. Schepaschenko, D.; See, L.; Lesiv, M.; McCallum, I.; Fritz, S.; Salk, C.; Moltchanova, E.; Perger, C.; Shchepashchenko, M.; Shvidenko, A.; et al. Development of a global hybrid forest mask through the synergy of remote sensing, crowdsourcing and FAO statistics. Remote Sens. Environ. 2015, 162, 208–220. [Google Scholar] [CrossRef]
  18. Fisher, R. Tropical forest monitoring, combining satellite and social data, to inform management and livelihood implications: Case studies from Indonesian West Timor. Int. J. Appl. Earth Obs. Geoinf. 2012, 16, 77–84. [Google Scholar] [CrossRef]
  19. Ferster, C.; Coops, N. Integrating volunteered smartphone data with multispectral remote sensing to estimate forest fuels. Int. J. Digit. Earth 2016, 9, 171–196. [Google Scholar] [CrossRef]
  20. DeVries, B.; Pratihast, A.K.; Verbesselt, J.; Kooistra, L.; Herold, M. Characterizing forest change using community-based monitoring data and landsat time series. PLoS ONE 2016, 11, 1–25. [Google Scholar] [CrossRef] [PubMed]
  21. Pratihast, A.; Herold, M.; De Sy, V.; Murdiyarso, D.; Skutsch, M. Linking community-based and national REDD+ monitoring: A review of the potential. Carbon Manag. 2013, 4, 91–104. [Google Scholar] [CrossRef]
  22. Pratihast, A.; Herold, M.; Avitabile, V.; De Bruin, S.; Bartholomeus, H.; Souza, C., Jr.; Ribbe, L. Mobile devices for community-based REDD+ monitoring: A case study for central vietnam. Sensors 2013, 13, 21–38. [Google Scholar] [CrossRef] [PubMed]
  23. Pratihast, A.; DeVries, B.; Avitabile, V.; De Bruin, S.; Kooistra, L.; Tekle, M.; Herold, M. Combining satellite data and community-based observations for forest monitoring. Forests 2014, 5, 2464–2489. [Google Scholar] [CrossRef]
  24. Foody, G.; Boyd, D.S. Using volunteered data in land cover map validation: Mapping west African forests. IEEE J. Sel. Top. Appl. Earth Obs. Remote Sens. 2013, 6, 1305–1312. [Google Scholar] [CrossRef]
  25. Holck, M.H. Participatory forest monitoring: An assessment of the accuracy of simple cost-effective methods. Biodivers. Conserv. 2008, 17, 2023–2036. [Google Scholar] [CrossRef]
  26. Food and Agriculture Organization (FAO) of the United Nations. Global Forest Resources Assessment 2015 (FRA 2015): How Are the World’s Forests Changing? 2nd ed.; Food and Agriculture Organization: Rome, Italy, 2016; Available online: http://www.fao.org/3/a-i4793e.pdf (accessed on 25 August 2016).
  27. Gleason, C.J.; Im, J. A review of remote sensing of forest biomass and biofuel: Options for small-area applications. GISci. Remote Sens. 2011, 48, 141–170. [Google Scholar] [CrossRef]
  28. Woodcock, C.; Allen, R.; Anderson, M.; Belward, A.; Bindschadler, R.; Cohen, W.; Gao, F.; Goward, S.; Helder, D.; Helmer, E.; et al. Free access to landsat imagery. Science 2008, 320, 1011. [Google Scholar] [CrossRef] [PubMed]
  29. Penman, J.; Baltuck, M.; Green, C.; Olofsson, P.; Raison, J.; Woodcock, C. Integrating Remote-Sensing and Ground-Based Observations for Estimation of Emissions and Removals of Greenhouse Gases in Forests: Methods and Guidance from the Global Forest Observations Initiative, 1st ed.; Global Forest Observations Initiative (GFOI): Geneva, Switzerland, 2014. [Google Scholar]
  30. Brown, S.; Gillespie, A.; Lugo, A. Biomass estimation methods for tropical forests with applications to forest inventory data. For. Sci. 1989, 35, 881–902. [Google Scholar]
  31. Phillips, O.; Malhi, Y.; Higuchi, N.; Laurance, W.; Núñez, P.; Vásquez, R. Changes in the carbon balance of tropical forests: Evidence from long-term plots. Science 1998, 282, 439–442. [Google Scholar] [CrossRef] [PubMed]
  32. Bitterlich, W. Die Winkelzählprobe. Allg. Forst-und Holzwirt. Zeitung. 1948, 59, 4–5. [Google Scholar] [CrossRef]
  33. Bitterlich, W. The Relascope Idea: Relative Measurements in Forestry; Commonwealth Agricultural Bureaux: Farnham, UK, 1984. [Google Scholar]
  34. Clark, N.A.; Wynne, R.H.; Schmoldt, D.L. A Review of past research on dendrometers. For. Sci. 2000, 46, 570–576. [Google Scholar]
  35. Maas, H.G.; Bienert, A.; Scheller, S.; Keane, E. Automatic forest inventory parameter determination from terrestrial laser scanner data. Int. J. Remote Sens. 2008, 29, 1579–1593. [Google Scholar] [CrossRef]
  36. Huang, H.; Li, Z.; Gong, P.; Cheng, X.; Clinton, N.; Cao, C.; Ni, W.; Wang, L. Automatic methods for measuring DBH and tree heights with a commercial scanning laser. Photogramm. Eng. Remote Sens. 2011, 77, 219–227. [Google Scholar] [CrossRef]
  37. Lovell, J.; Jupp, D.; Newnham, G.; Culvenor, D. Measuring tree stem diameters using intensity profiles from ground-based scanning LiDAR from a fixed viewpoint. ISPRS J. Photogramm. Remote Sens. 2011, 66, 46–55. [Google Scholar] [CrossRef]
  38. Kalliovirta, J.; Laasasenaho, J.; Kangas, A. Evaluation of the laser-relascope. For. Ecol. Manag. 2005, 204, 181–194. [Google Scholar] [CrossRef]
  39. Strahler, A.H.; Jupp, D.L.B.; Woodcock, C.E.; Schaaf, C.B.; Yao, T.; Zhao, F.; Yang, X.; Lovell, J.; Culvenor, D.; Newnham, G.; et al. Retrieval of forest structural parameters using a ground-based LiDAR instrument (Echidna®). Can. J. Remote Sens. 2008, 34, S426–S440. [Google Scholar] [CrossRef]
  40. Yao, T.; Yang, X.; Zhao, F.; Wang, Z.; Zhang, Q.; Jupp, D.; Lovell, J.; Culvenor, D.; Newnham, G.; Ni-Meister, W.; et al. Measuring forest structure and biomass in New England forest stands using Echidna ground-based LiDAR. Remote Sens. Environ. 2011, 115, 2965–2974. [Google Scholar] [CrossRef]
  41. Surový, P.; Yoshimoto, A.; Panagiotidis, D. Accuracy of reconstruction of the tree stem surface using terrestrial close-range photogrammetry. Remote Sens. 2016, 8, 123–135. [Google Scholar] [CrossRef]
  42. Abd-Elrahman, A.H.; Thornhill, M.E.; Andreu, M.G.; Escobedo, F. A community-based urban forest inventory using online mapping services and consumer-grade digital images. Int. J. Appl. Earth Obs. Geoinf. 2010, 12, 249–260. [Google Scholar] [CrossRef]
  43. Butt, N.; Slade, E.; Thompson, J.; Malhi, Y.; Riutta, T. Quantifying the sampling error in tree census measurements by volunteers and its effect on carbon stock estimates. Ecol. Appl. 2013, 23, 936–943. [Google Scholar] [CrossRef] [PubMed] [Green Version]
  44. Häme, T.; Korpela, I.; Hovi, A.; Hippi, I.; Rasinmäki, J.; Molinier, M.; Andersson, K. Social Forest Planning. In Proceddings of Finnish Remote Sensing Days, Espoo, Finland, 4–5 November 2010.
  45. Molinier, M.; Andersson, K.; Häme, T. Automatic tree stem delineation supporting forest inventory. In Proceedings of the IEEE International Geoscience and Remote Sensing Symposium Vancouver, BC, Canada, 24–29 July 2011; pp. 4465–4468.
  46. Vastaranta, M.; Latorre, E.G.; Luoma, V.; Saarinen, N.; Holopainen, M.; Hyyppä, J. Evaluation of a smartphone app for forest sample plot measurements. Forests 2015, 6, 1179–1194. [Google Scholar] [CrossRef]
  47. Molinier, M.; Häme, T.; Toivanen, T.; Andersson, K.; Mutanen, T. Relasphone—Mobile phone and interactive applications to collect ground reference biomass data for satellite image analysis. In Proceedings of the IEEE International Geoscience and Remote Sensing Symposium (IGARSS), Québec, QC, Canada, 13–18 July 2014; pp. 836–839.
  48. Molinier, M.; Toivanen, T.; Häme, T.; López-Sánchez, C.A.; Corral-Rivas, J.J.; Vega, D. Participative forest in situ measurements for biomass mapping in satellite images over Durango State, Mexico. In Proceedings of the IEEE International Geoscience and Remote Sensing Symposium (IGARSS), Milan, Italy, 26–31 July 2015; pp. 5391–5394.
  49. Korpela, I.; Heikkinen, V.; Honkavaara, E.; Rohrbach, F.; Tokola, T. Variation and directional anisotropy of reflectance at the crown scale—Implications for tree species classification in digital aerial images. Remote Sens. Environ. 2011, 115, 2062–2074. [Google Scholar] [CrossRef]
  50. Korpela, I.; Hovi, A.; Morsdorf, F. Understory trees in airborne LiDAR data-Selective mapping due to transmission losses and echo-triggering mechanisms. Remote Sens. Environ. 2012, 119, 92–104. [Google Scholar] [CrossRef]
  51. Rautiainen, M.; Mõttus, M.; Heiskanen, J.; Akujärvi, A.; Majasalmi, T.; Stenberg, P. Seasonal reflectance dynamics of common understory types in a northern European boreal forest. Remote Sens. Environ. 2011, 115, 3020–3028. [Google Scholar] [CrossRef]
  52. Korpela, I.; Ørka, H.O.; Maltamo, M.; Tokola, T.; Hyyppä, J. Tree species classification using airborne LiDAR—Effects of stand and tree parameters, downsizing of training set, intensity normalization, and sensor type. Silva Fennica 2010, 44, 319–339. [Google Scholar] [CrossRef]
  53. Pisek, J.; Rautiainen, M.; Heiskanen, J.; Mõttus, M. Retrieval of seasonal dynamics of forest understory reflectance in a Northern European boreal forest from MODIS BRDF data. Remote Sens. Environ. 2012, 117, 464–468. [Google Scholar] [CrossRef]
  54. Korpela, I.; Tuomola, T.; Välimäki, E. Mapping forest plots: An efficient method combining photogrammetry and field triangulation. Silva Fennica 2007, 41, 457–469. [Google Scholar] [CrossRef]
  55. Cajander, A.K. Forest types and their significance. Acta For. Fennica 1949, 56, 1–71. [Google Scholar]
  56. Næsset, E. Point accuracy of combined pseudorange and carrier phase differential GPS under forest canopy. Can. J. For. Res. 1999, 29, 547–553. [Google Scholar] [CrossRef]
  57. Valbuena, R.; Mauro, F.; Rodriguez-Solano, R.; Manzanera, J. Accuracy and precision of GPS receivers under forest canopies in a mountainous environment [Exactitud y precisiońn de receptores GPS bajo cubiertas forestales en ambientes montañosos]. Span. J. Agric. Res. 2010, 8, 1047–1057. [Google Scholar] [CrossRef]
  58. Zandbergen, P.A.; Barbeau, S.J. Positional accuracy of assisted GPS data from high-sensitivity GPS-enabled mobile phones. J. Navig. 2011, 64, 381–399. [Google Scholar] [CrossRef]
  59. Rahman, H.; Dedieu, G. SMAC: A simplified method for the atmospheric correction of satellite measurements in the solar spectrum. Int. J. Remote Sens. 1994, 15, 123–143. [Google Scholar] [CrossRef]
  60. López-Serrano, P.; Sánchez, C.; Solís-Moreno, R.; Corral-Rivas, J. Geospatial estimation of above ground forest biomass in the Sierra Madre Occidental in the state of Durango, Mexico. Forests 2016, 7, 70–82. [Google Scholar] [CrossRef]
  61. Corral-Rivas, J.J.; Vargas, B.; Wehenkel, C.; Aguirre, O.; Álvarez, J.; Rojo, A. Guía para el Establecimiento de Sitios de Inventario Periódico Forestal y de Suelos del Estado de Durango; Facultad de Ciencias Forestales, Universidad Juárez del Estado de Durango: Durango, Mexico, 2009. [Google Scholar]
  62. Vargas-Larreta, B.; González-Herrera, L.; López-Sánchez, C.; Corral-Rivas, J.; López-Martínez, J.; Aguirre-Calderón, C.G.; Álvarez González, J. Biomass equations and carbon content of the temperate forests of northwestern México. Biomass Bioenerg 2016, in press. [Google Scholar]
  63. Torres, A.; Lovett, J. Using basal area to estimate aboveground carbon stocks in forests: La Primavera Biosphere’s Reserve, Mexico. Forestry 2013, 86, 267–281. [Google Scholar] [CrossRef]
  64. Tomppo, E.; Olsson, H.; Ståhl, G.; Nilsson, M.; Hagner, O.; Katila, M. Combining national forest inventory field plots and remote sensing data for forest databases. Remote Sens. Environ. 2008, 112, 1982–1999. [Google Scholar] [CrossRef]
  65. Häme, T.; Rauste, R.; Antropov, O.; Ahola, H.A.; Kilpi, J. Improved mapping of tropical forests with optical and SAR imagery, Part II: Above ground biomass estimation. IEEE J. Sel. Top. Appl. Earth Obs. Remote Sens. 2013, 6, 92–101. [Google Scholar] [CrossRef]
  66. Santoro, M.; Beaudoin, A.; Beer, C.; Cartus, O.; Fransson, J.E.; Hall, R.J.; Pathe, C.; Schmullius, C.; Schepaschenko, D.; Shvidenko, A.; et al. Forest growing stock volume of the northern hemisphere: Spatially explicit estimates for 2010 derived from Envisat ASAR. Remote Sens. Environ. 2015, 168, 316–334. [Google Scholar] [CrossRef]
  67. Häme, T.; Stenberg, P.; Andersson, K.; Rauste, Y.; Kennedy, P.; Folving, S.; Sarkeala, J. AVHRR-based forest proportion map of the Pan-European area. Remote Sens. Environ. 2001, 77, 76–91. [Google Scholar] [CrossRef]
  68. Foody, G.M.; See, L.; Fritz, S.; Van der Velde, M.; Perger, C.; Schill, C.; Boyd, D.; Comber, A. Accurate attribute mapping from volunteered geographic information: Issues of volunteer quantity and quality. Cartogr. J. 2015, 52, 336–344. [Google Scholar] [CrossRef] [Green Version]
  69. Flanagin, A.J.; Metzger, M.J. The credibility of volunteered geographic information. GeoJournal 2008, 72, 137–148. [Google Scholar] [CrossRef]
  70. Foody, G.; See, L.; Fritz, S.; Van der Velde, M.; Perger, C.; Schill, C.; Boyd, D. Assessing the accuracy of volunteered geographic information arising from multiple contributors to an Internet based collaborative project. Trans. GIS 2013, 17, 847–860. [Google Scholar] [CrossRef]
  71. Goodchild, M.F.; Li, L. Assuring the quality of volunteered geographic information. Spat. Stat. 2012, 1, 110–120. [Google Scholar] [CrossRef]
  72. See, L.; Comber, A.; Salk, C.; Fritz, S.; Van der Velde, M.; Perger, C.; Schill, C.; McCallum, I.; Kraxner, F.; Obersteiner, M. Comparing the quality of crowdsourced data contributed by expert and non-experts. PLoS ONE 2013, 8, 1–11. [Google Scholar] [CrossRef] [PubMed]
  73. Clough, G. Geolearners: Location-based informal learning with mobile and social technologies. IEEE Trans. Learn. Technol. 2010, 3, 33–44. [Google Scholar] [CrossRef]
  74. Salk, C.F.; Sturn, T.; See, L.; Fritz, S.; Perger, C. Assessing quality of volunteer crowdsourcing contributions: lessons from the Cropland Capture game. Int. J. Digit. Earth 2016, 9, 410–426. [Google Scholar] [CrossRef] [Green Version]
  75. Huy, B.; Poudel, K.P.; Kralicek, K.; Hung, N.D.; Khoa, P.V.; Phuong, V.T.; Temesgen, H. Allometric equations for estimating tree aboveground biomass in tropical dipterocarp forests of vietnam. Forests 2016, 7, 180–198. [Google Scholar] [CrossRef]
  76. Magnabosco Marra, D.; Higuchi, N.; Trumbore, S.E.; Ribeiro, G.H.P.M.; dos Santos, J.; Carneiro, V.M.C.; Lima, A.J.N.; Chambers, J.Q.; Negrón-Juárez, R.I.; Holzwarth, F.; et al. Predicting biomass of hyperdiverse and structurally complex central Amazonian forests—A virtual approach using extensive field data. Biogeosciences 2016, 13, 1553–1570. [Google Scholar] [CrossRef]
Figure 1. Study area in Finland, GeoEye image (Red Green Blue) and the 23 reference forest plots where Relasphone measurements were conducted.
Remotesensing 08 00869 g001
Figure 2. (ae) Mobile phone images in Finland on various site types and understory conditions. The captions give the plot number (Table 2), dominant tree species and forest fertility site type [55].
Remotesensing 08 00869 g002
Figure 3. Study area in Durango, Mexico. The plots used in this study were located in Regional Forest Management Units (Unidad de Manejo Forestal Regional (UMAFOR)) 1005 and 1008.
Remotesensing 08 00869 g003
Figure 4. Two example photographs (a,b) of the reference Pinus cooperi plots in Durango, Mexico.
Remotesensing 08 00869 g004
Figure 5. Screen captures of the Relasphone app (Version 1.5, for boreal forests). From left to right: main screen, plot tree heights, forest stand summary (with biomass and timber value estimates by tree species) and digital relascope (in zoomed view) with touch buttons to count each tree species. Reproduced with permission from IEEE.
Remotesensing 08 00869 g005
Figure 6. Relasphone: digital relascope view for local tree species of Durango, Mexico: Quercus (“Encinos”), other broad-leaved (“otras hojosas”), Pinus and other coniferous (“otras coniferas”).
Remotesensing 08 00869 g006
Figure 7. Scatter plots of Relasphone basal area measurements in Hyytiälä (Finland), versus reference forest inventory data, with the regression line and 95% confidence interval (in red).
Remotesensing 08 00869 g007
Figure 8. Scatter plots of Relasphone stem volume measurements in Durango, Mexico, versus reference forest inventory data, with the linear regression model and 95% confidence interval (in red). Measurements from Operator 1 (left column) and Operator 2 (right column) were made independently.
Remotesensing 08 00869 g008
Figure 9. GeoEye color-infrared image (Near-Infrared Red Green) acquired on 7 July 2010 in Hyytiälä, Finland (left), and the growing stock volume map (right) trained with Relasphone biomass data as the reference. Reproduced with permission from IEEE.
Remotesensing 08 00869 g009
Figure 10. Aboveground biomass map in Durango, Mexico, based on Landsat-8 image, utilizing Relasphone in situ stem volume measurements as the only reference data.
Remotesensing 08 00869 g010
Table 1. Descriptive statistics of the main stand variables in the 23 reference forest plots, Hyytiälä, Finland: minimum (min), maximum (max), mean and standard deviation (std). The plot-wise mean diameter at breast height (dbh) was weighted by basal area.
VariableMinMaxMeanStd
Number of stems per ha3971931.4980.4462.8
Basal area (m 2 /ha)8.647.926.19.8
Plot-wise mean dbh (cm)12.335.322.76.3
Table 2. Mean characteristics of reference plots in Hyytiälä, Finland. The plot-wise mean diameter at breast height was weighted by basal area (BA). OC: other coniferous. OBL: other broad-leaved.
Plot #AreaBasal Area (BA)Mean Diameter,PineSpruceBirchOCOBL
Number(m 2 )(m 2 /ha)BA-Weighted (cm)%%%%%
1146227.816.8 100
2134523.222.54.6 95.4
3219121.127100
4209226.226.1100
5401033.631.31475.13.11.83.2
6950127.829.724.367.77.7 0.4
7725919.319.170.715.1100.90.5
8773029.623.217.761.115.7 5.1
9257625.416.2462.923.5 7.1
1064041321.548.13.348.1 0.4
1152812624.628.464.95.5 1.2
1245103335.31.183.62.27.12.2
13336837.135.226.258.913.9
14238513.721.542.142.615.3
1526331415.20.785.65.2 8.6
1622451213.41.76.276 16.1
17197922.516.162.529.68
18228935.626.81.383.65.8 9.3
19230429.624.70.785.14.8 9.3
20240247.921.71.1888.7 2
21238036.621.7182.49.2 7.4
2227028.612.312.340.134.4 13.2
23325936.720.79.853.917.3 19
Table 3. Descriptive statistics of the main stand variables from the 95 permanent sample plots in Durango, Mexico. The dominant stand height was averaged from the 100 thickest trees per hectare.
VariableMinMaxMeanStd
Number of stems per ha2242264645271.84
Diameter at breast height (cm)11.6931.1218.443.46
Dominant height (m)6.8630.6017.475.08
Stand basal area (m 2 /ha)8.2154.8323.448.06
Total stem volume (m 3 /ha)23.78527.65204.59104.81
Stand biomass (Mg/ha)27.73469.42141.6475.01
Table 4. Relasphone basal area measurements by tree species in Hyytiälä (Finland): slope a and intercept b of linear regression versus reference forest inventory data, corresponding coefficient of determination R 2 , absolute and relative root mean squared error ( R M S E and R M S E ( % ) , respectively).
Tree Species a b R 2 RMSE (m 2 /ha) RMSE (%)
Hyytiälä, Finland
Pine0.99−0.660.755.3359.89
Spruce1.02−0.390.756.7352.99
Birch1.220.950.714.98113.18
Total0.86.420.467.9229.66
Table 5. Mean basal area of Relasphone measurements by tree species in Hyytiälä, Finland, versus reference forest inventory data, and biases. Reproduced with permission from IEEE.
Mean Basal Area (m 2 /ha)PineSpruceBirchTotal
Hyytiälä, Finland
Relasphone8.212.66.327.8
Reference data8.912.74.426.7
B I A S (m 2 /ha)−0.7−0.1+1.9+1.1
B I A S (%)−7.9%−0.8%+43.2%+4.1%
Table 6. Relasphone-based stem volume estimations by tree species in Durango, Mexico, measured by two users: slope a and intercept b of linear regression versus reference forest inventory data, corresponding coefficient of determination R 2 and root mean squared error ( R M S E ) (m 3 /ha).
Tree SpeciesOperator 1Operator 2
Durango, Mexico a 1 b 1 R 1 2 RMSE 1 (m 3 /ha) a 2 b 2 R 2 2 RMSE 2 (m 3 /ha)
Pinus spp.0.96242.270.8832.460.99642.960.8735.06
Quercus spp.0.8348.810.5720.970.88.50.523.15
Other coniferous0.9441.890.347.070.8712.080.356.46
Other broad-leaved0.6652.070.444.70.6531.940.474.29
Total0.87655.270.8735.210.89355.780.8736.83

