
A Temporal-Spatial Iteration Method to Reconstruct NDVI Time Series Datasets


Abstract
:
1. Introduction
2. Materials and Methods
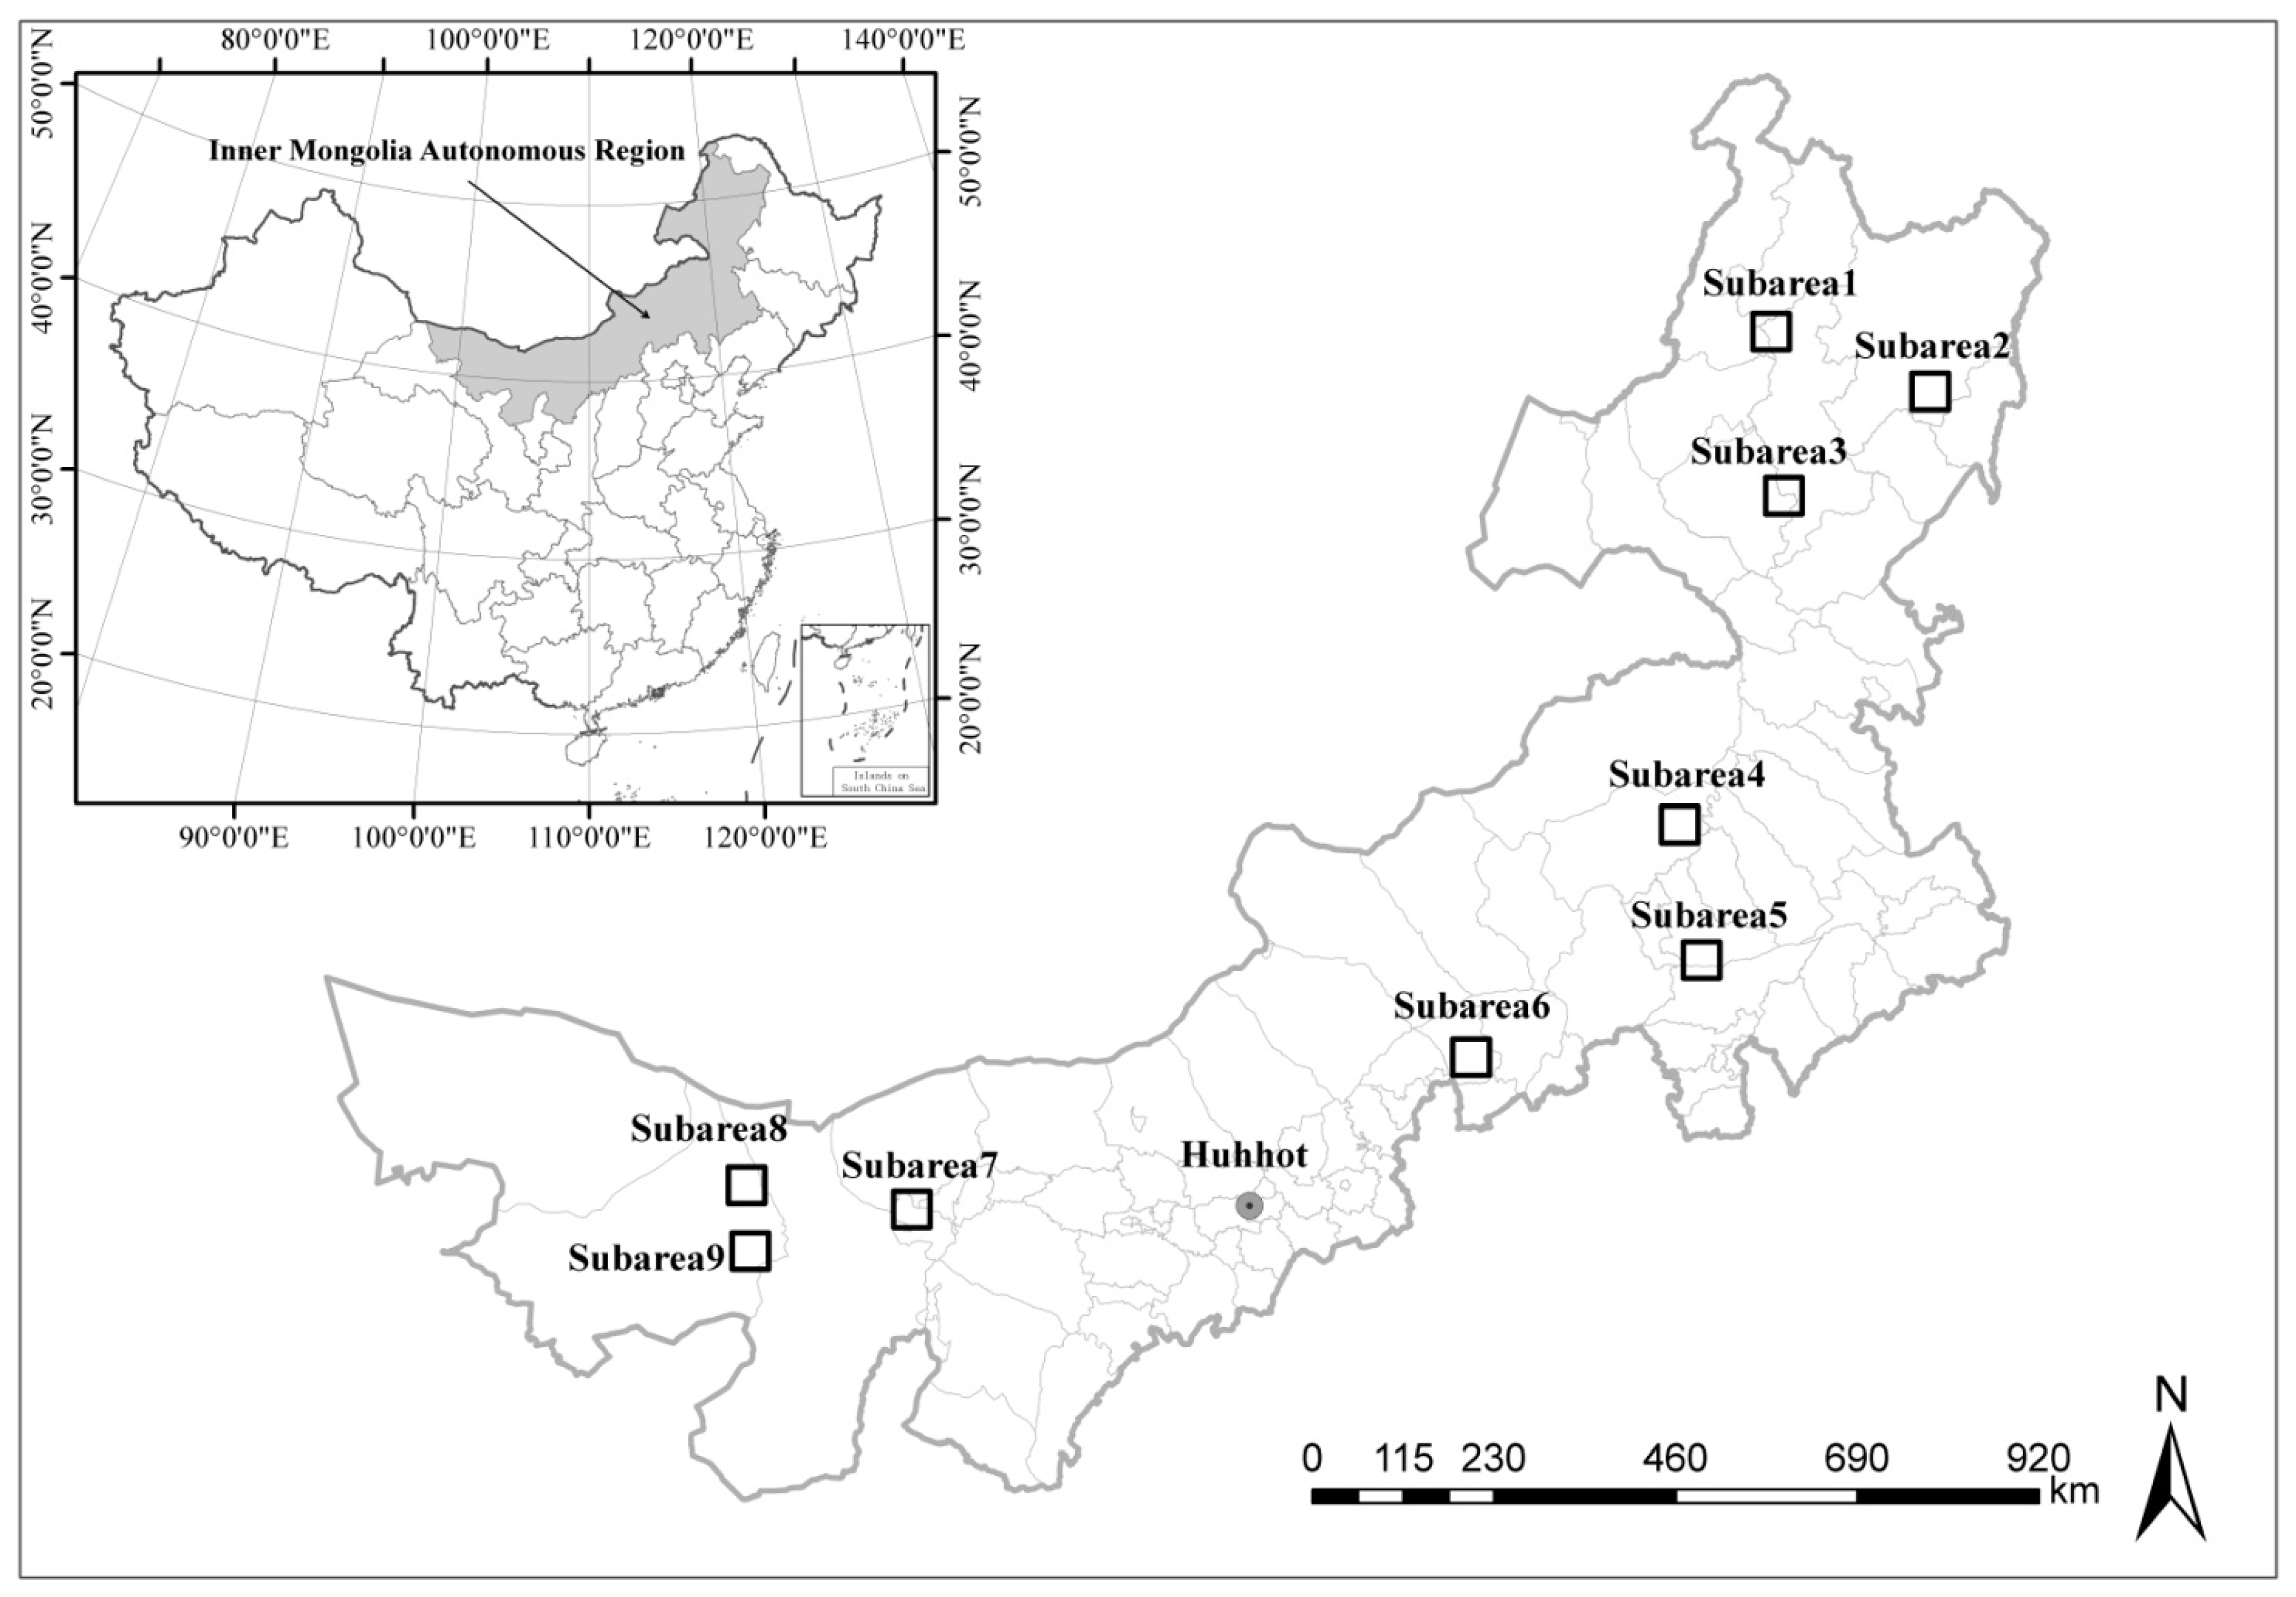
2.1. Study Area

| Study Area | Geographic Coordinates of the Center Pixel | |
|---|---|---|
| Humid area | Sub-area 1 | 50°22′112′′N, 121°1′40′′E |
| Sub-area 2 | 49°26′33′′N, 123°38′54′′E | |
| Sub-area 3 | 48°27′57′′N, 120°55′56′′E | |
| Semi-arid area | Sub-area 4 | 44°51′11′′N, 118°40′11′′E |
| Sub-area 5 | 43°18′31′′N, 118°50′25′′E | |
| Sub-area 6 | 42°24′22′′N, 115°7′4′′E | |
| Arid area | Sub-area 7 | 40°45′8′′N, 106°28′8′′E |
| Sub-area 8 | 40°11′55′′N, 104°2′52′′E | |
| Sub-area 9 | 40°54′33′′N, 103°57′8′′E | |
2.2. Data and Data Preprocessing
| Study Area | Contaminated NDVIs | Percentage (%) | |
|---|---|---|---|
| Humid area | Sub-area 1 | 1,508,984 | 41.0 |
| Sub-area 2 | 1,212,144 | 32.9 | |
| Sub-area 3 | 1,529,305 | 41.6 | |
| Sub-total | 4,250,433 | 38.5 | |
| Semi-arid area | Sub-area 4 | 1,281,536 | 34.8 |
| Sub-area 5 | 998,648 | 27.1 | |
| Sub-area 6 | 827,819 | 22.5 | |
| Sub-total | 3,108,003 | 28.1 | |
| Arid area | Sub-area 7 | 282,627 | 7.70 |
| Sub-area 8 | 287,835 | 7.80 | |
| Sub-area 9 | 478,787 | 13.0 | |
| Sub-total | 1,049,249 | 9.50 | |
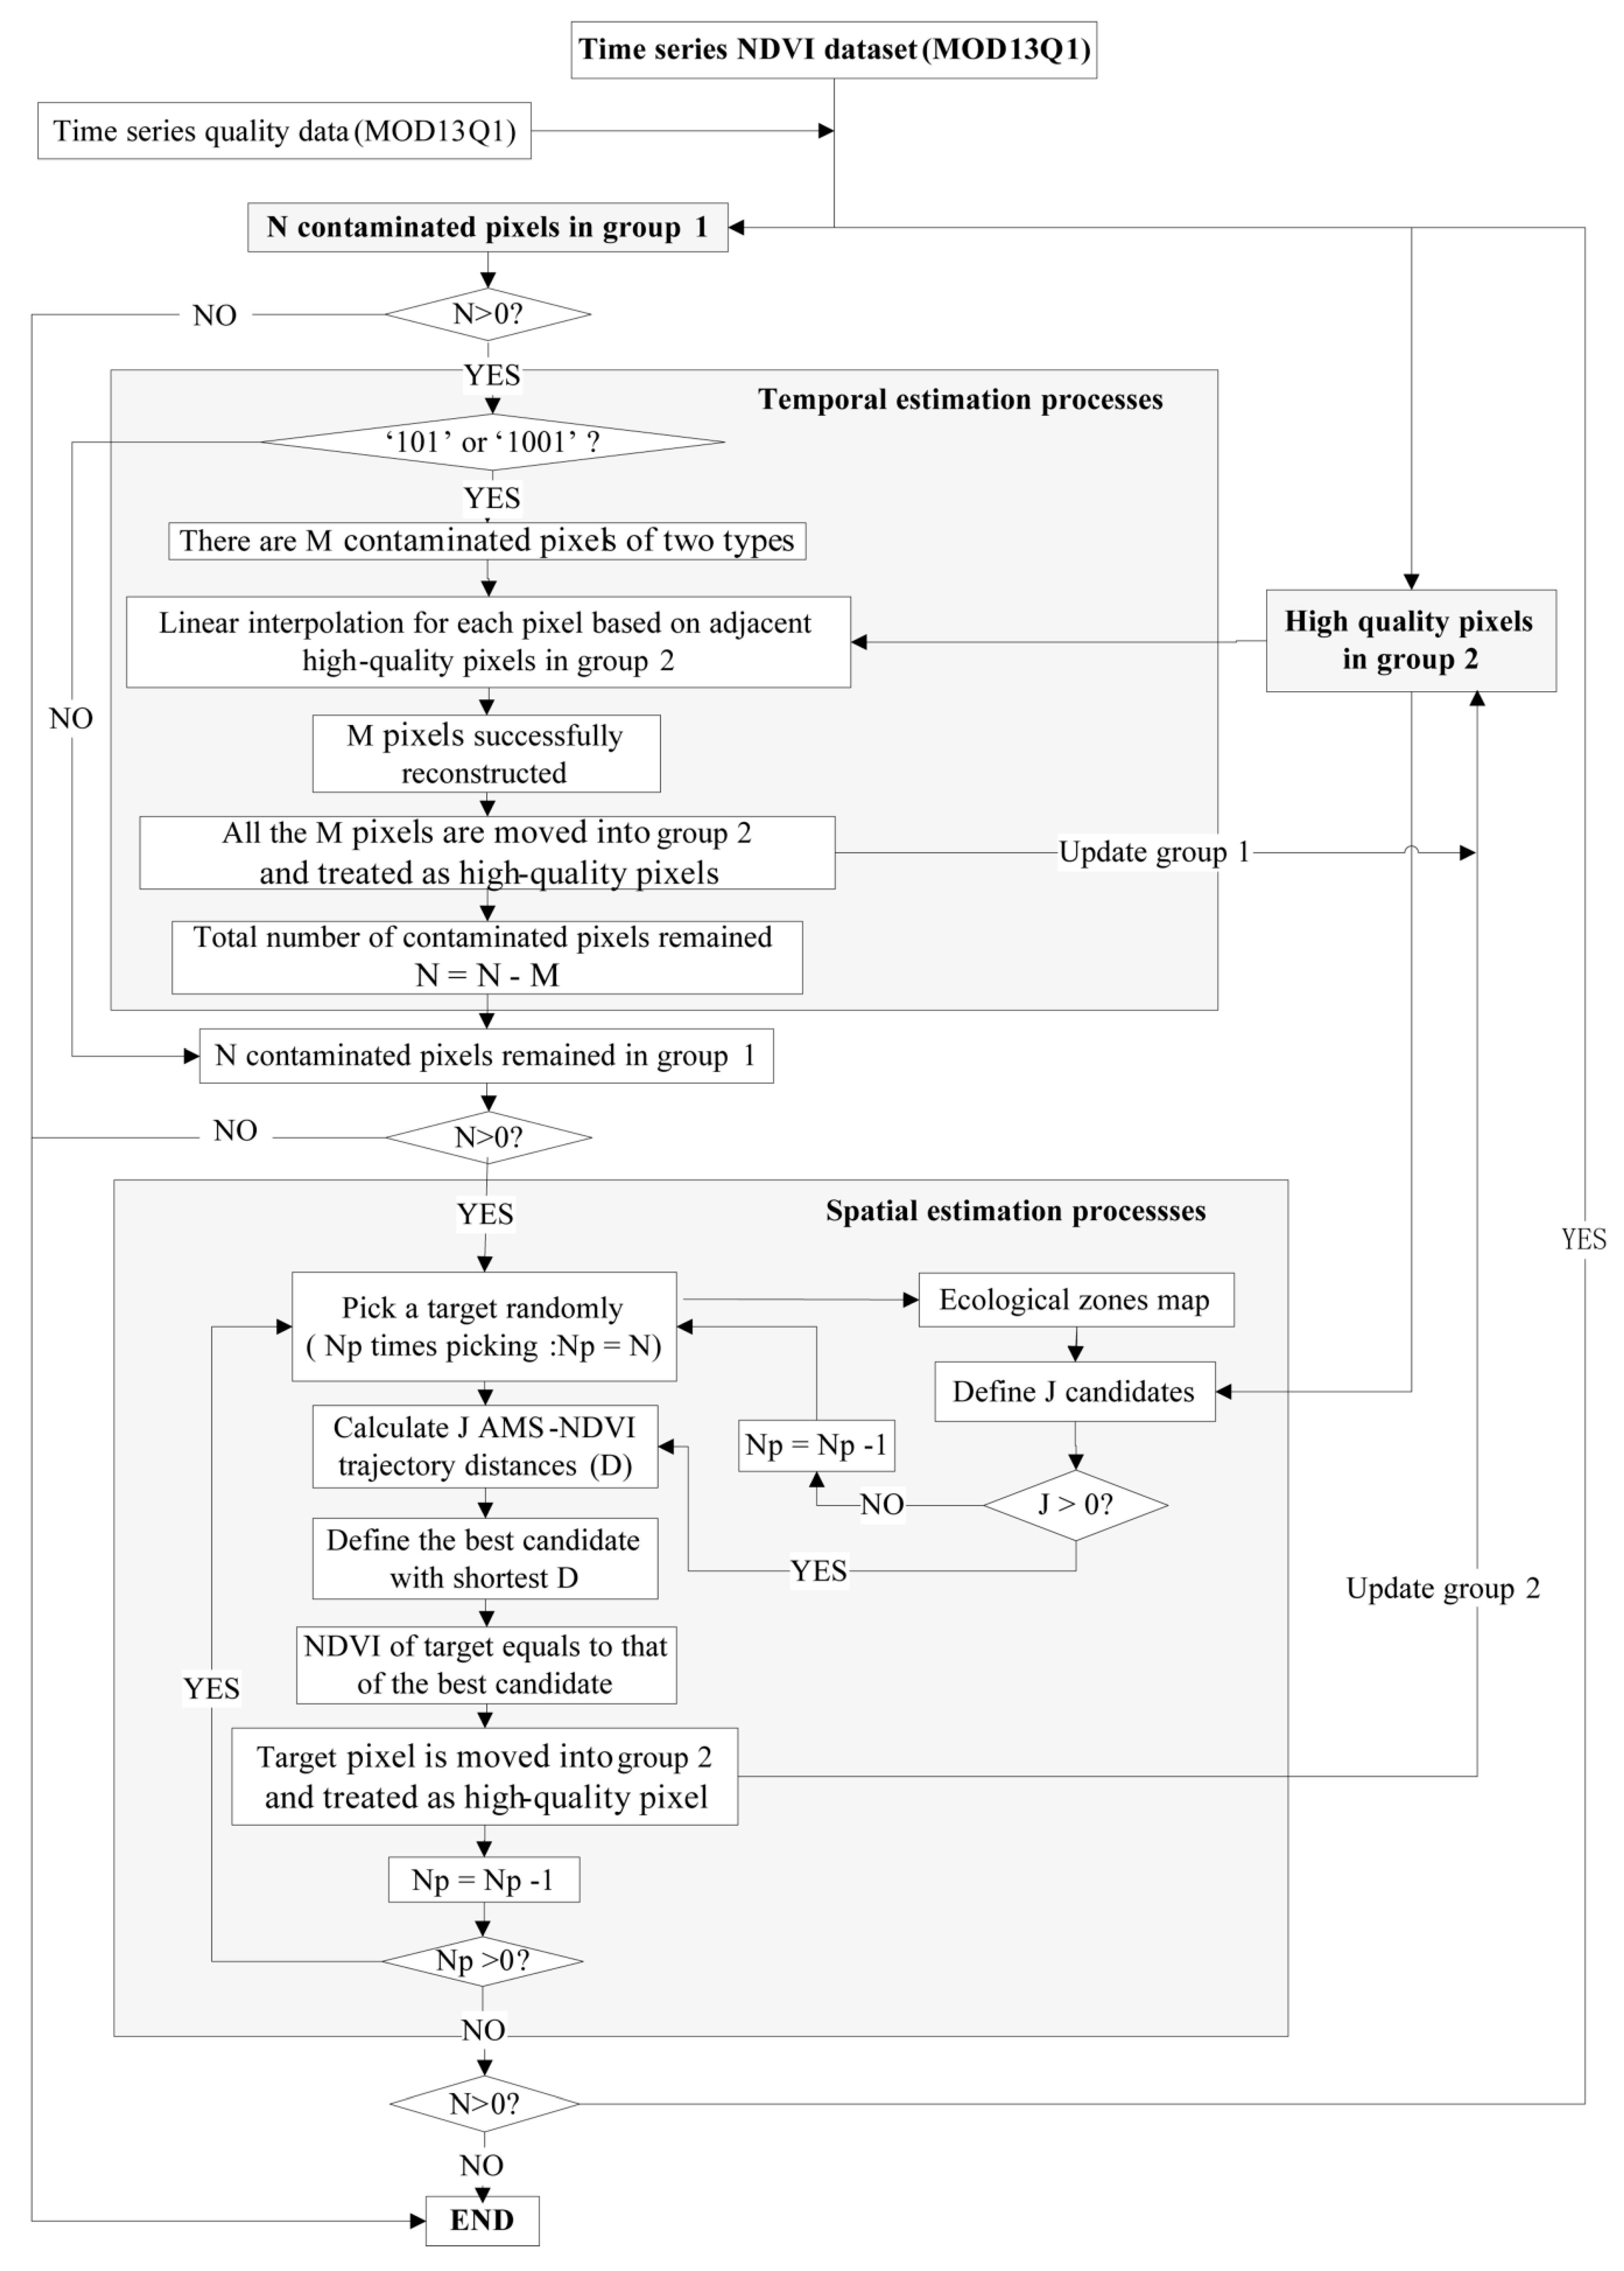
2.3. Methodology

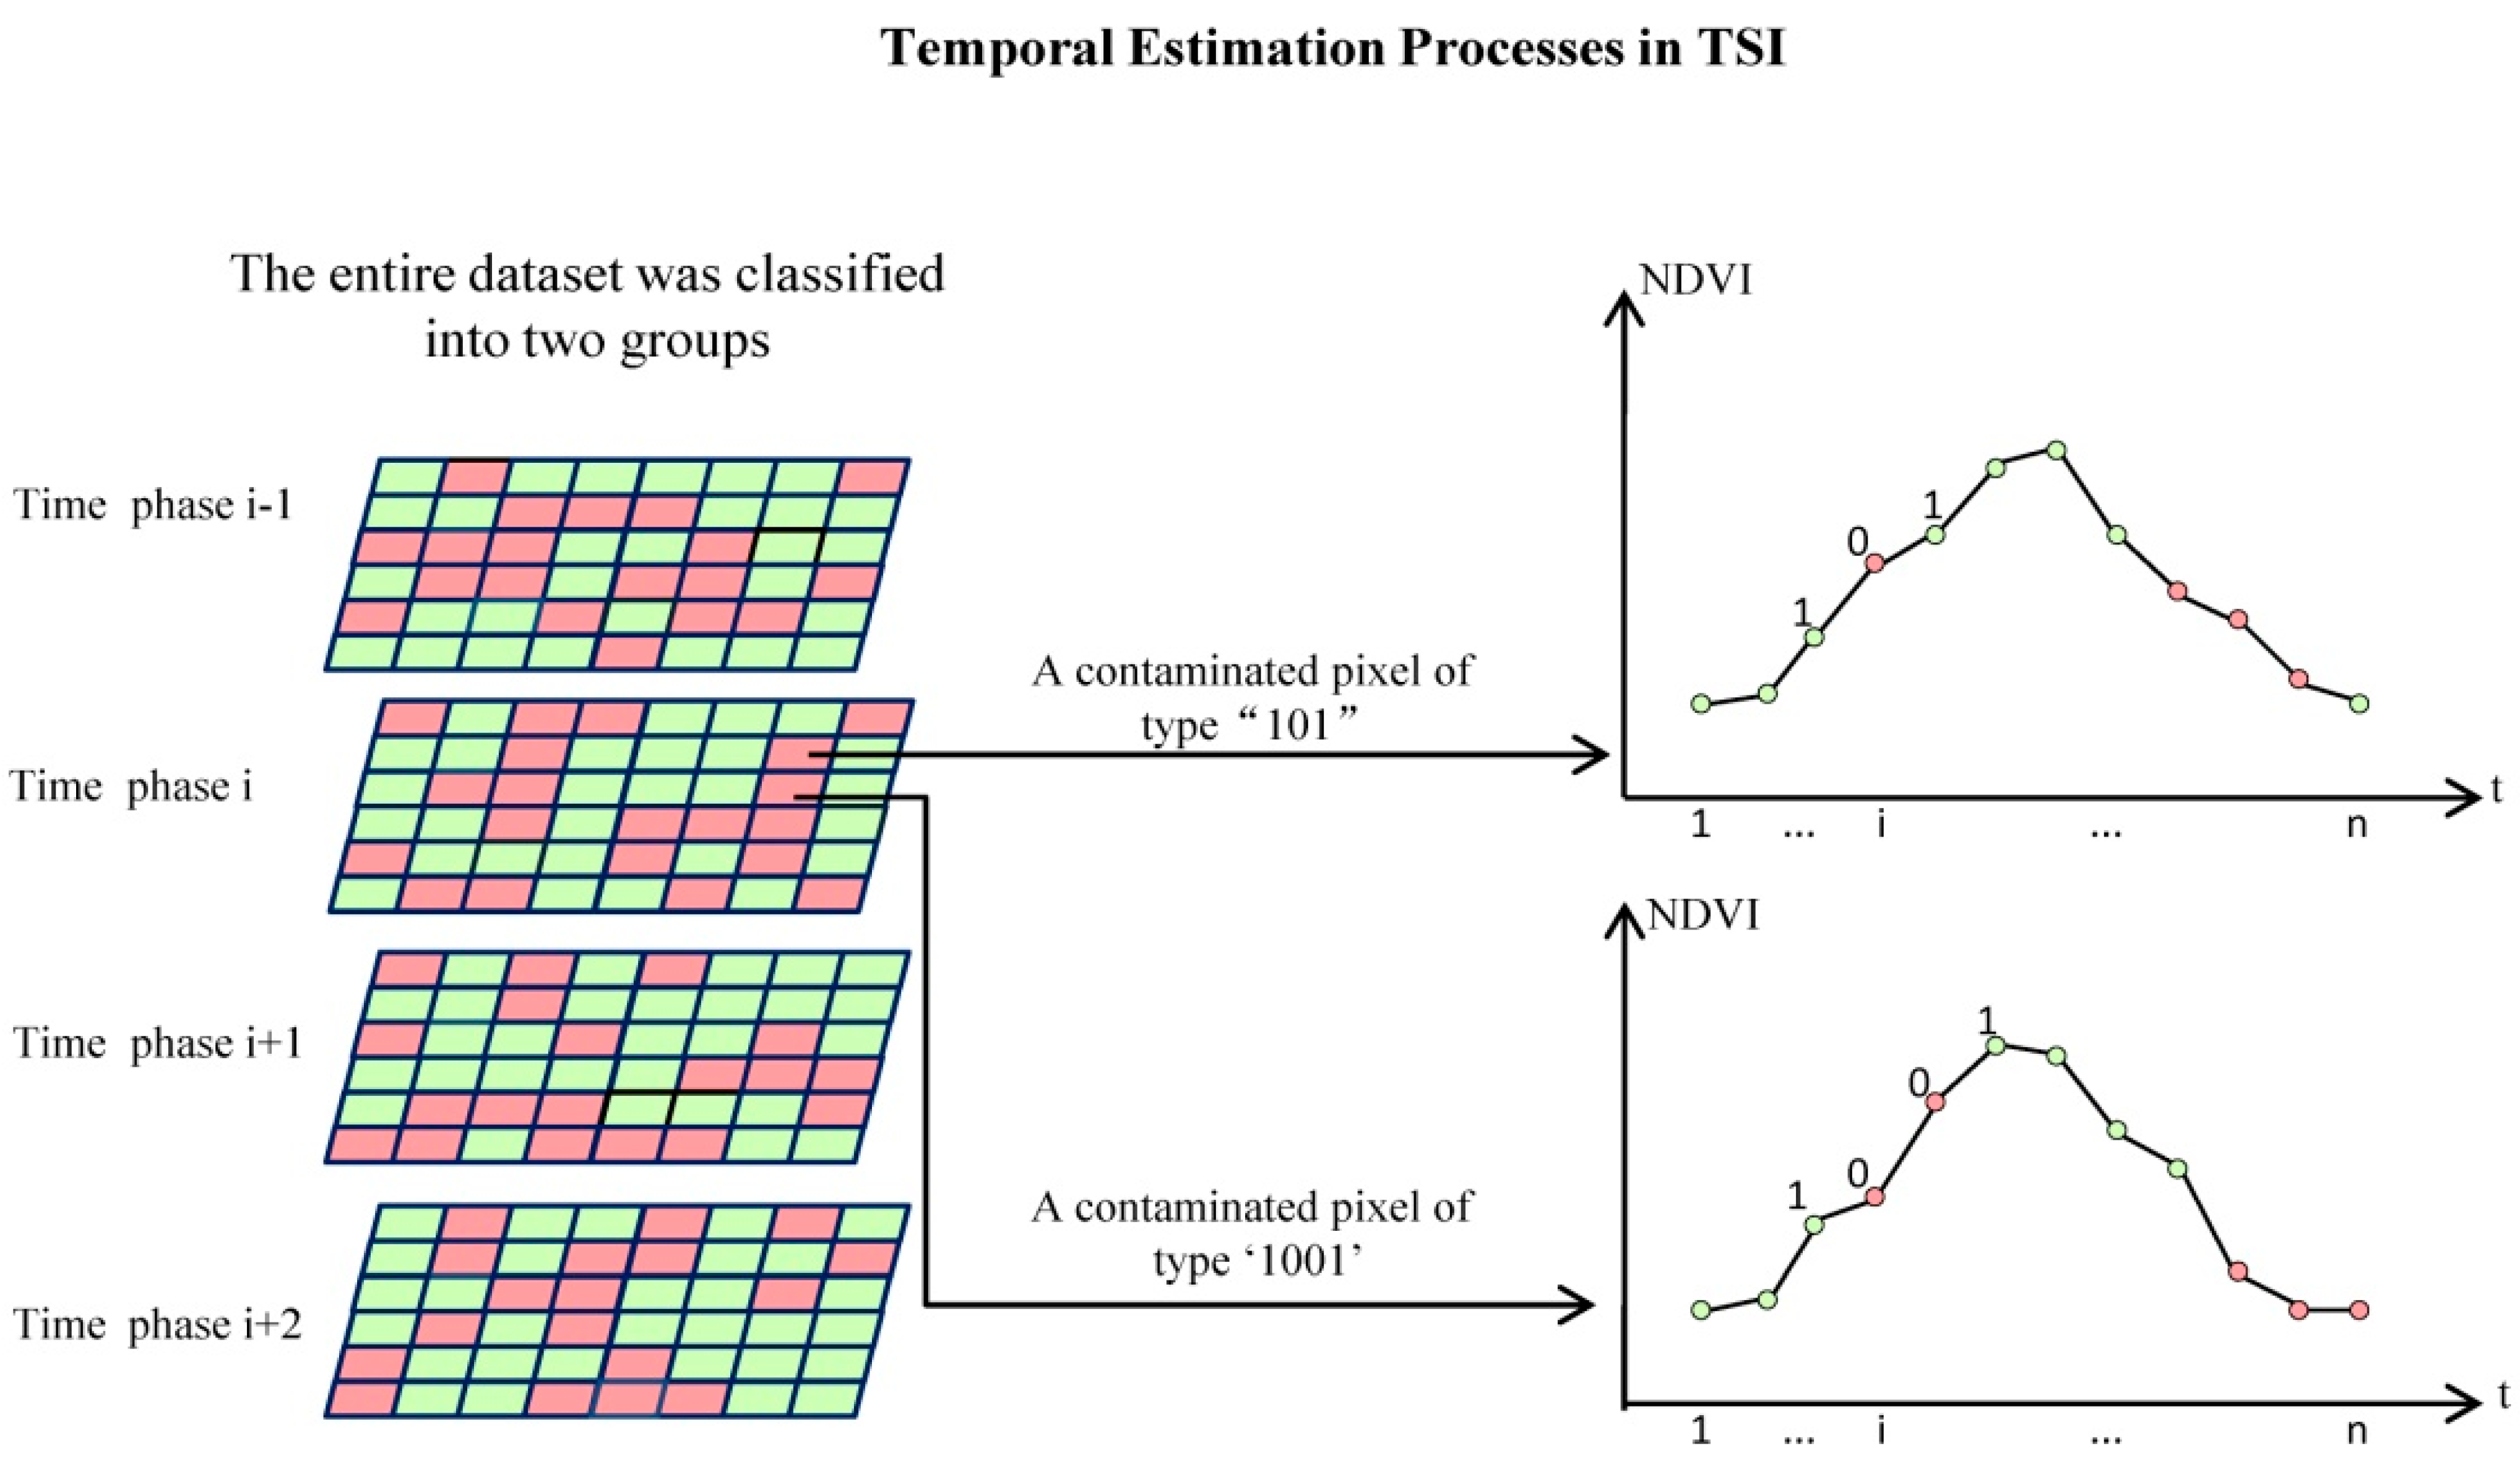
2.3.1. Temporal Estimation

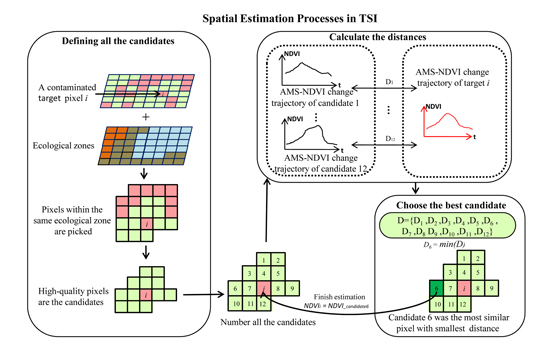
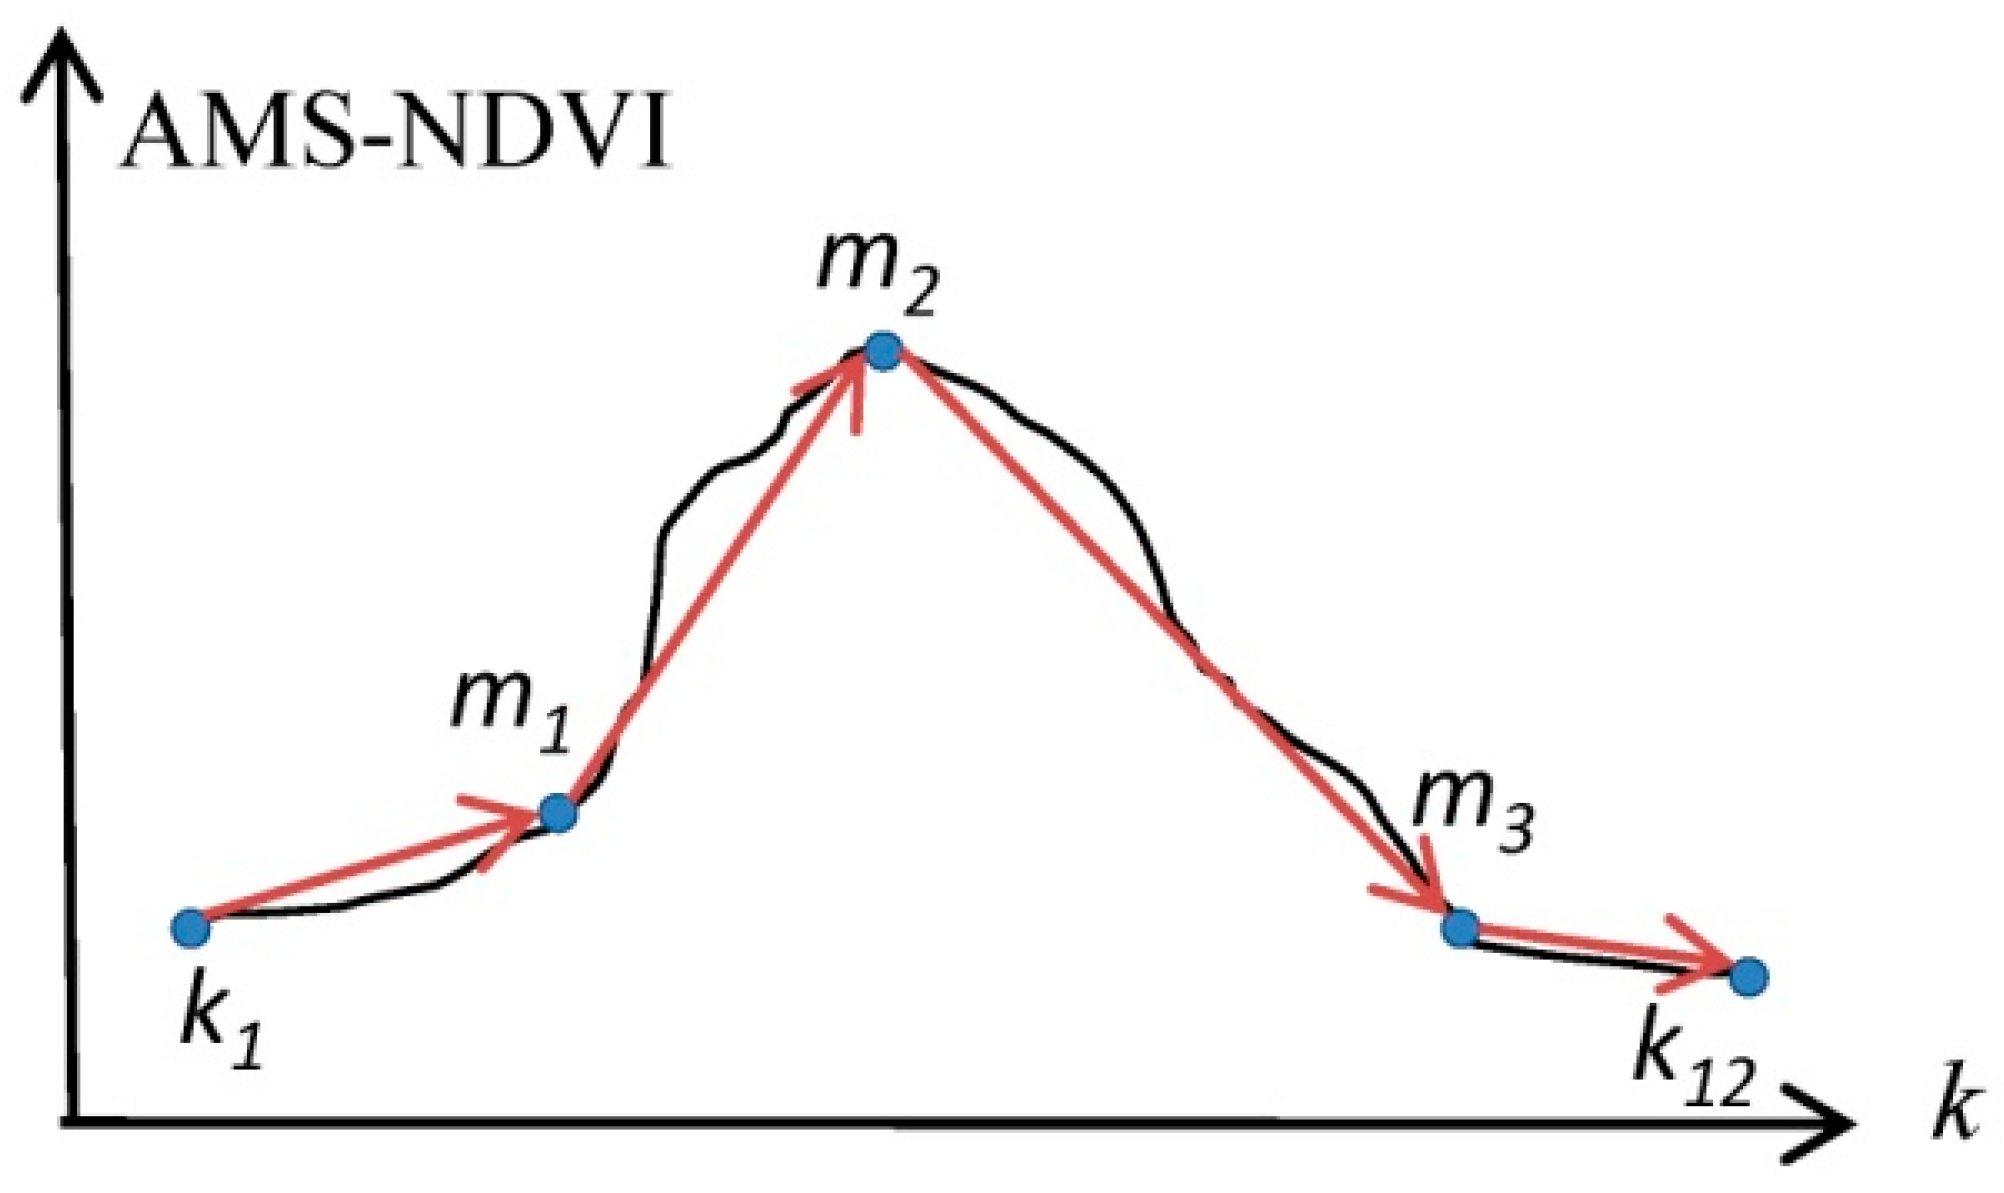
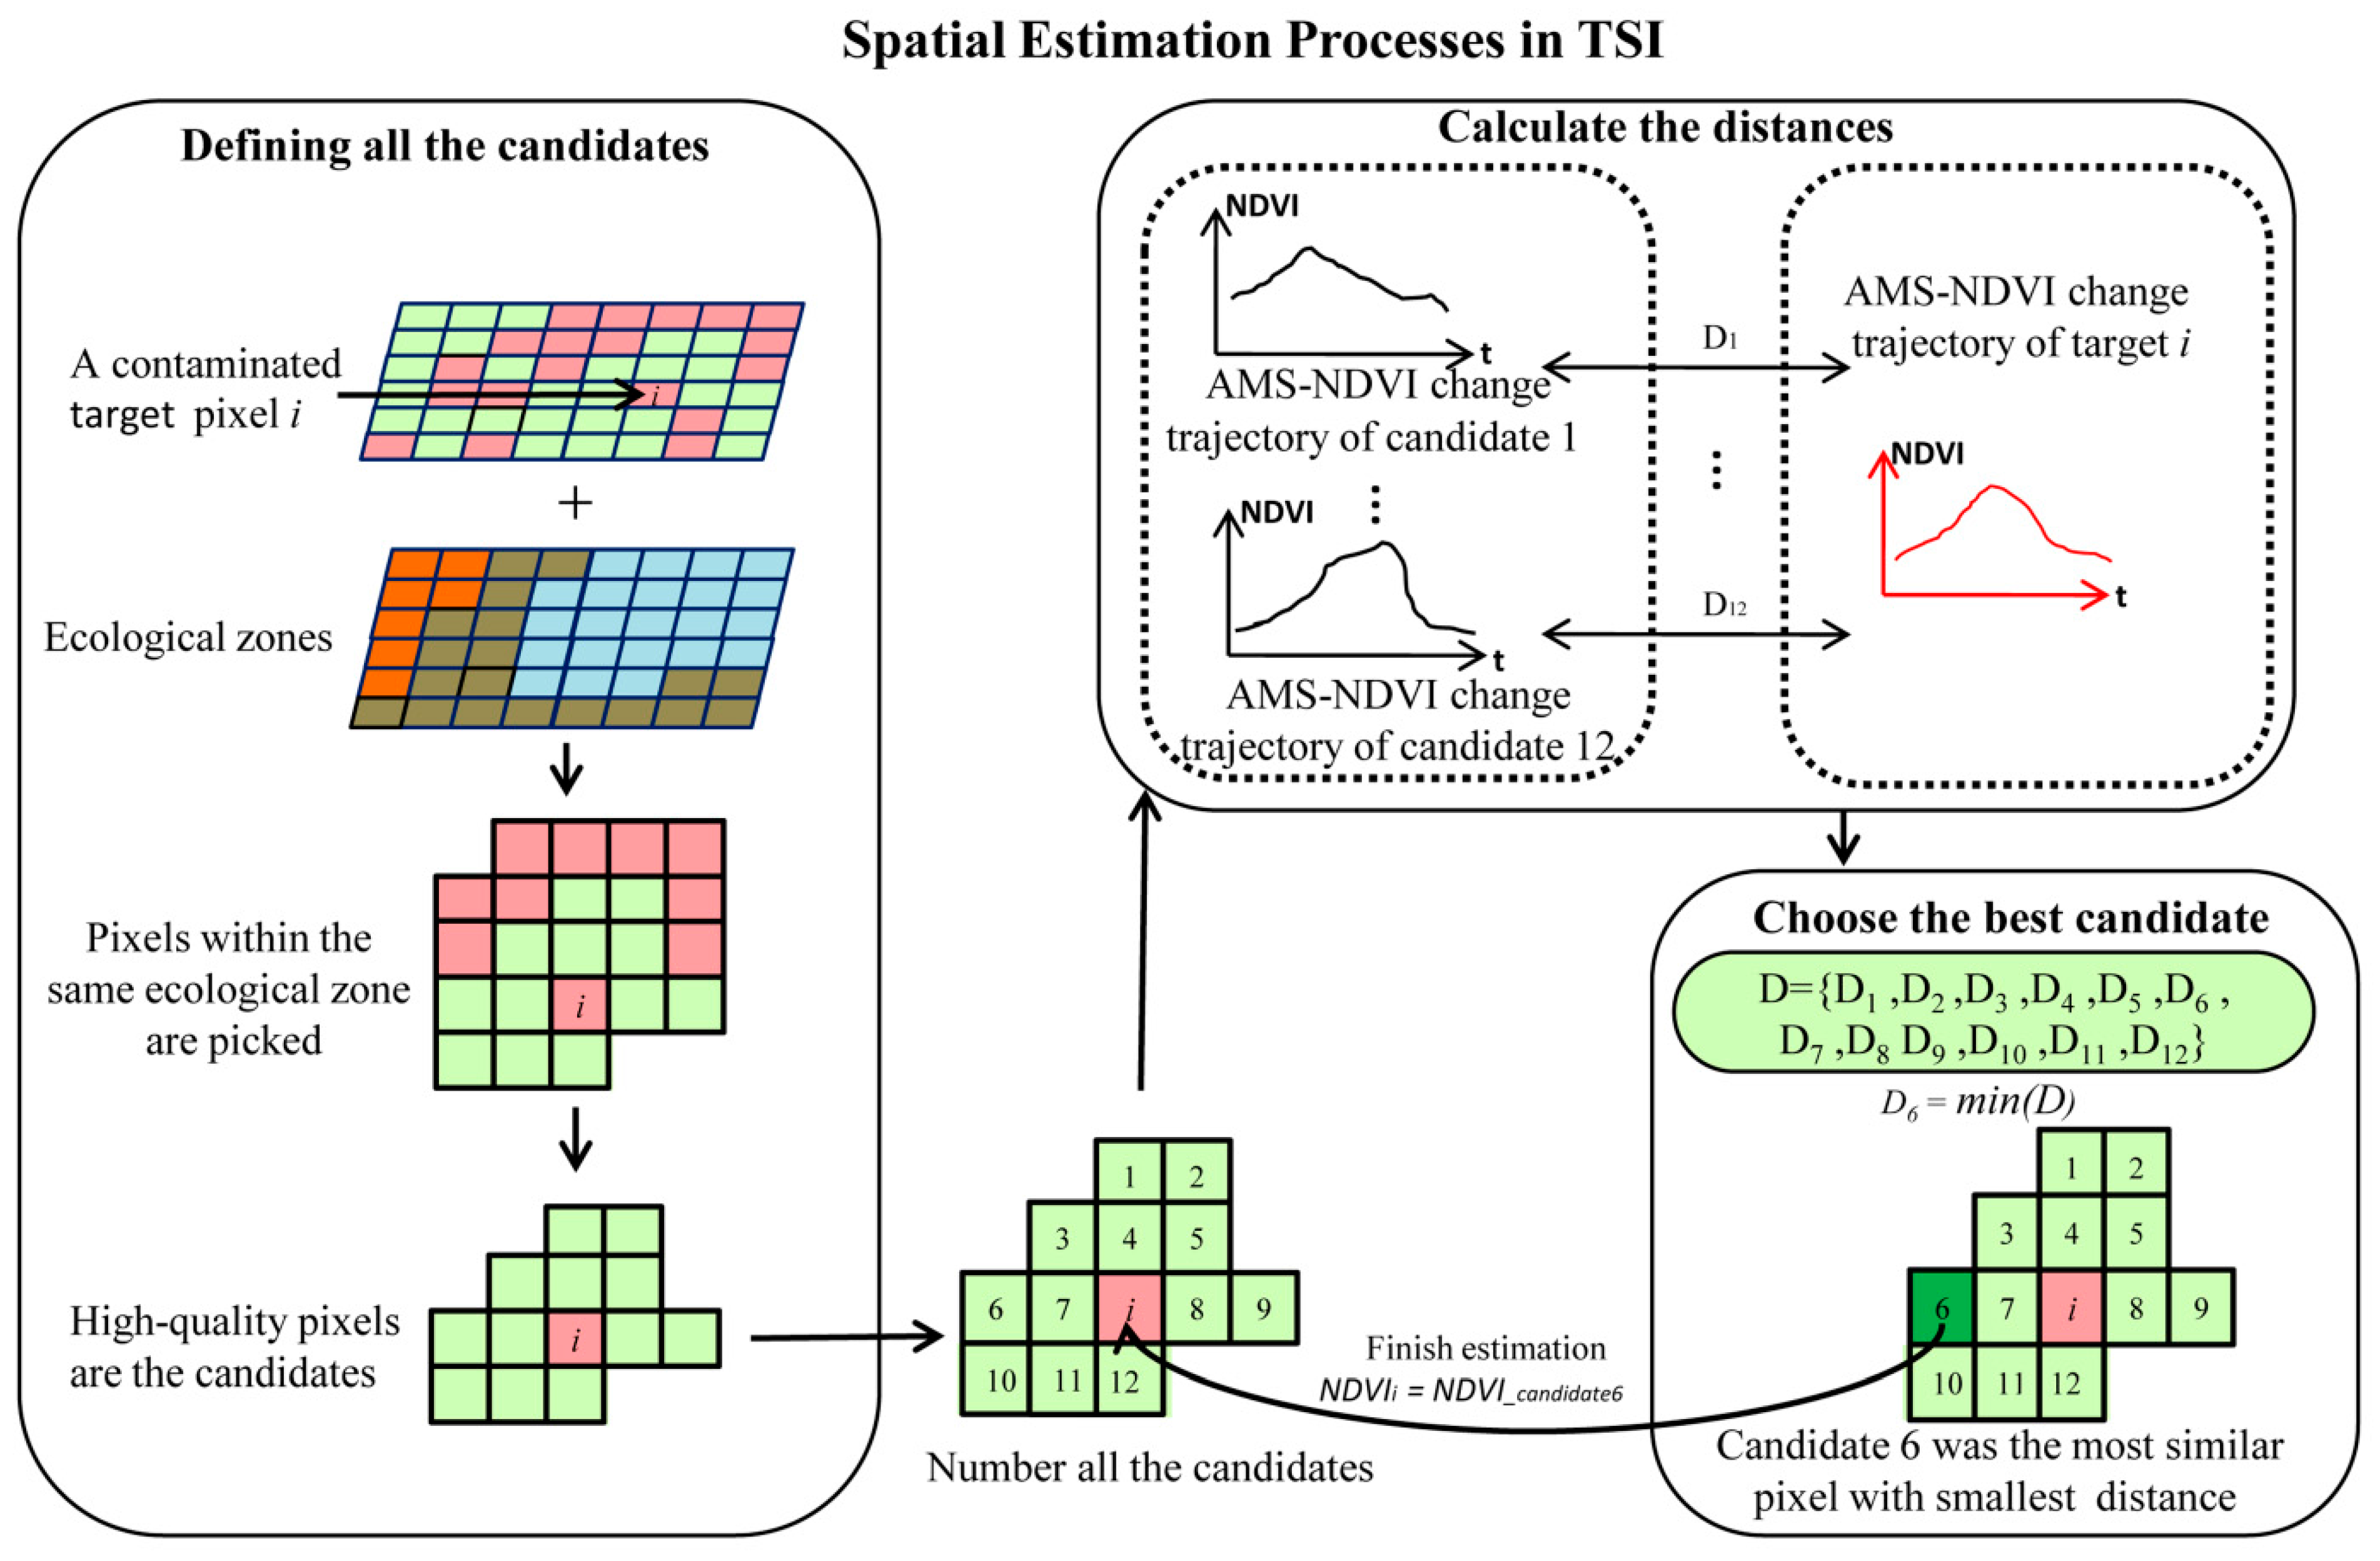
2.3.2. Spatial Estimation

2.4. Technique Evaluation
2.4.1. Accuracies of the Estimated NDVIs of Contaminated Pixels
2.4.2. Ability to Retain the Original Values of the High-Quality Pixels
2.4.3. Number of Contaminated Pixels that Can Be Estimated
3. Results
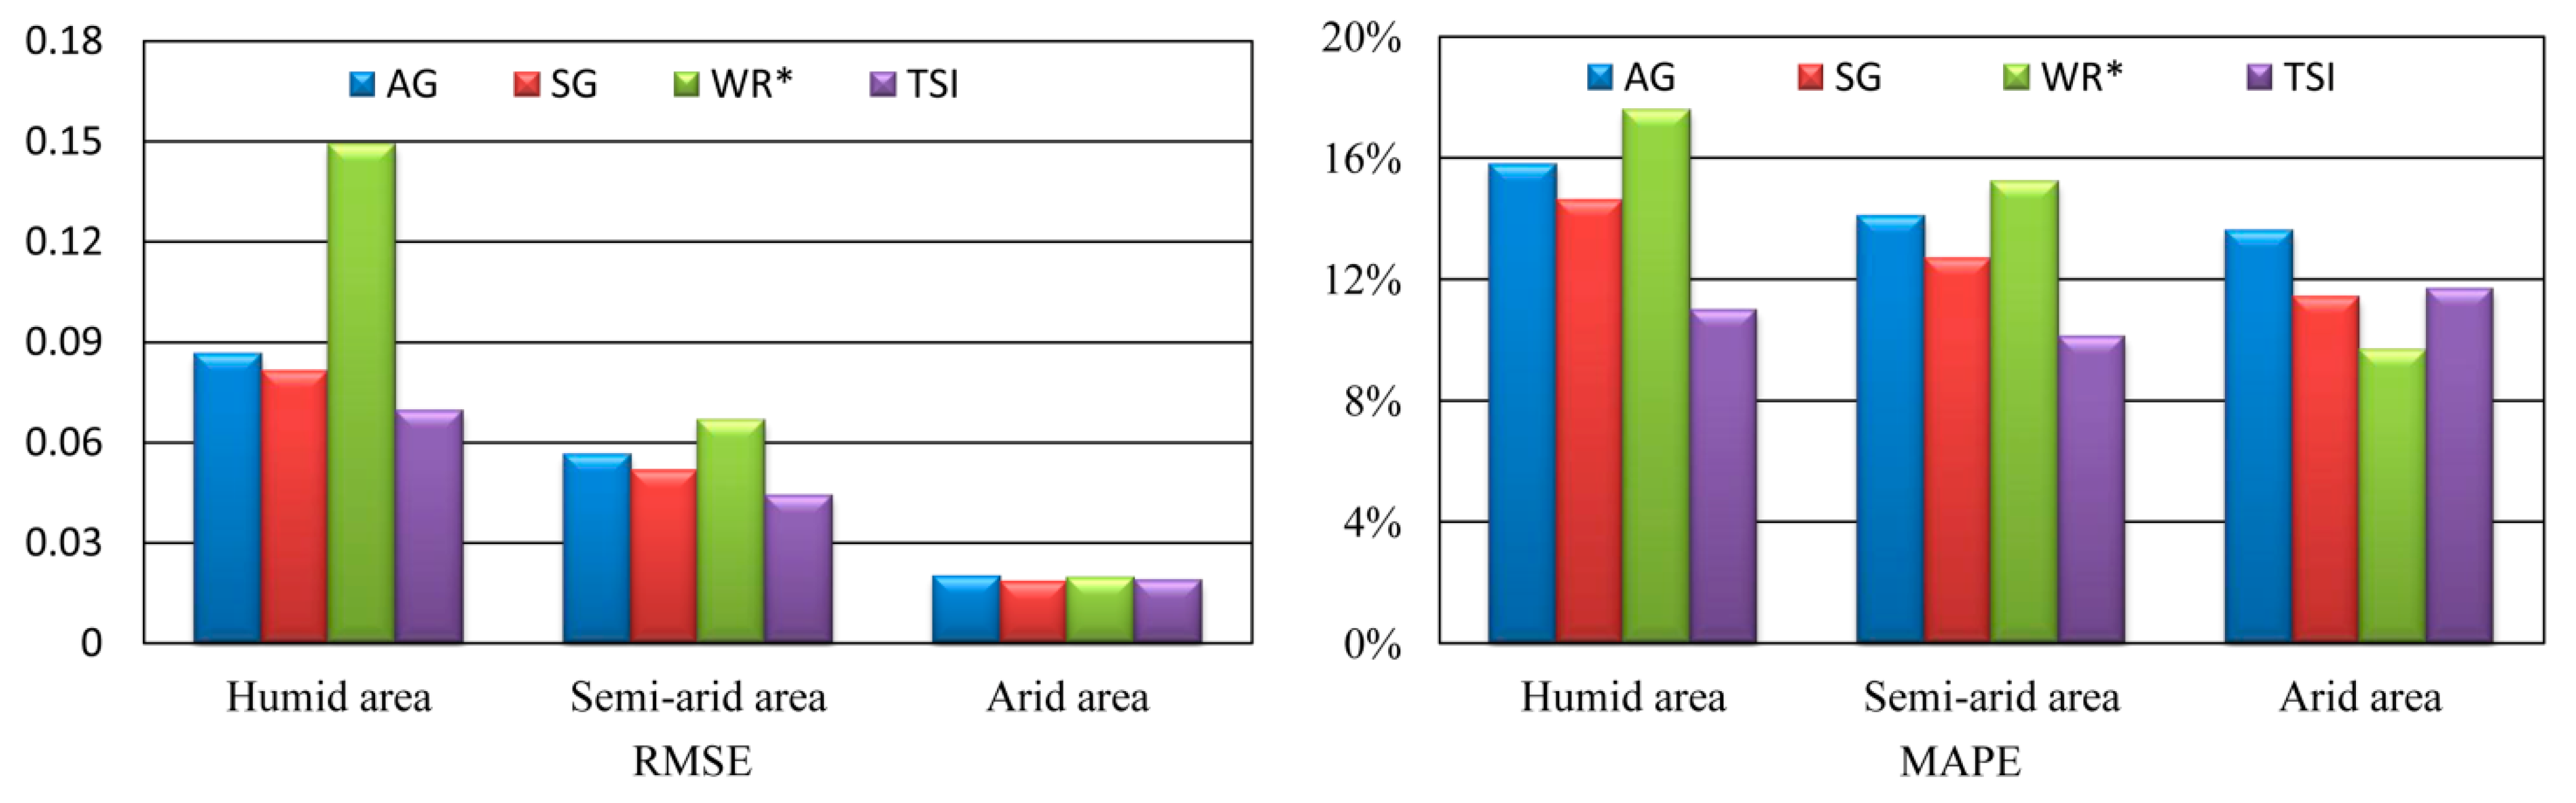
3.1. Accuracies of the Estimated NDVIs of Contaminated Pixels
| Method | AG | SG | WR* | TSI | |||||
|---|---|---|---|---|---|---|---|---|---|
| RMSE | MAPE (%) | RMSE | MAPE (%) | RMSE | MAPE (%) | RMSE | MAPE (%) | ||
| Humid area | Sub-area 1 | 0.0872 | 15.5 | 0.0814 | 14.0 | 0.168 | 18.9 | 0.0717 | 11.4 |
| Sub-area2 | 0.0909 | 17.0 | 0.0867 | 16.0 | 0.126 | 15.5 | 0.0721 | 11.5 | |
| Sub-area 3 | 0.0801 | 14.2 | 0.0745 | 12.7 | 0.150 | 18.5 | 0.0638 | 10.1 | |
| Sub-total | 0.0864 | 15.8 | 0.0814 | 14.6 | 0.149 | 17.6 | 0.0696 | 11.0 | |
| Semi-arid area | Sub-area 4 | 0.0703 | 18.3 | 0.0634 | 16.0 | 0.0978 | 21.2 | 0.0529 | 11.3 |
| Sub-area 5 | 0.0462 | 10.9 | 0.0446 | 10.5 | 0.0490 | 11.1 | 0.0442 | 10.5 | |
| Sub-area 6 | 0.0498 | 13.0 | 0.0451 | 11.6 | 0.0472 | 14.4 | 0.0336 | 8.6 | |
| Sub-total | 0.0564 | 14.1 | 0.0518 | 12.7 | 0.0668 | 15.2 | 0.0443 | 10.1 | |
| Arid area | Sub-area 7 | 0.0254 | 12.0 | 0.0240 | 10.1 | 0.0293 | 11.0 | 0.0254 | 10.8 |
| Sub-area 8 | 0.0152 | 14.8 | 0.0137 | 12.8 | 0.0118 | 9.33 | 0.0139 | 12.9 | |
| Sub-area 9 | 0.0176 | 14.1 | 0.0150 | 11.3 | 0.0110 | 8.58 | 0.0142 | 11.3 | |
| Sub-total | 0.0199 | 13.6 | 0.0182 | 11.4 | 0.0194 | 9.65 | 0.0186 | 11.7 | |
| Total | 0.0607 | 14.5 | 0.0567 | 12.9 | 0.0907 | 13.8 | 0.0486 | 10.9 | |

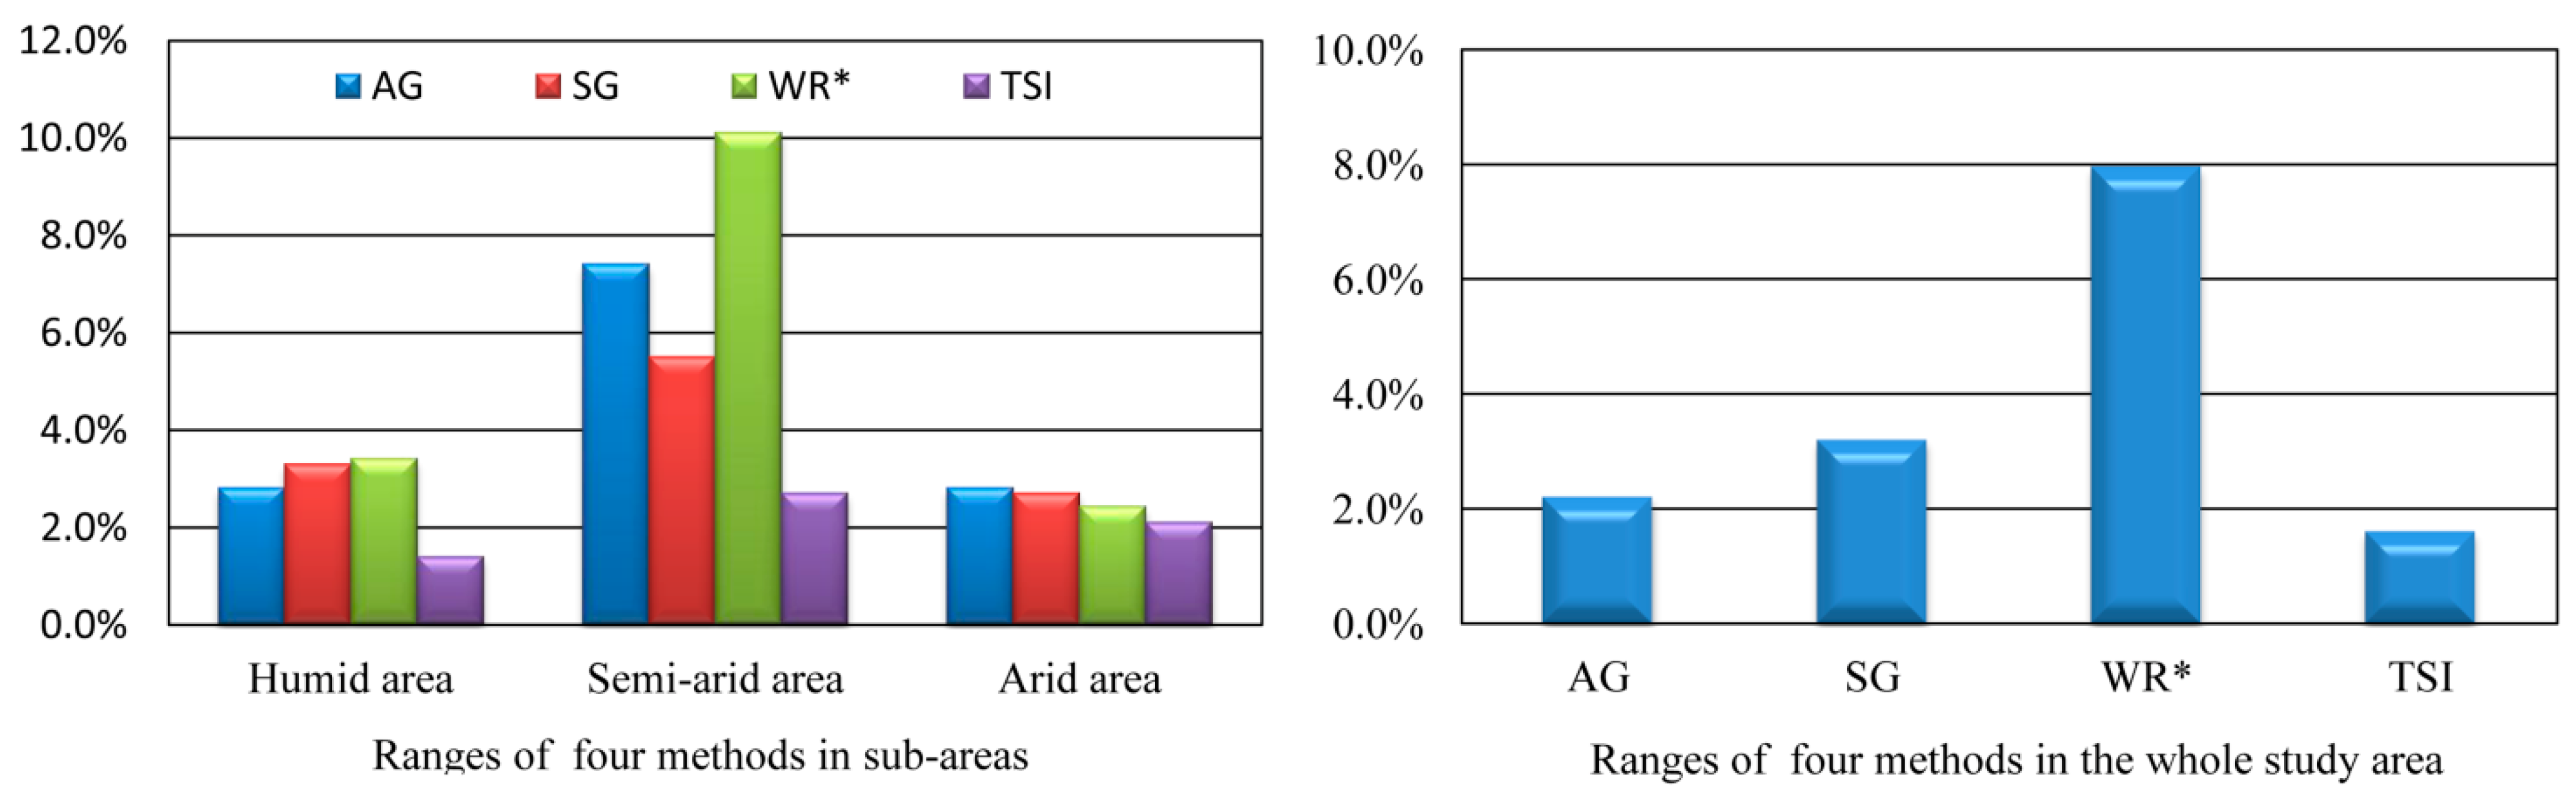
3.2. Ability to Retain the Original Values of the High-Quality Pixels
| Study Areas | AG | SG | |||
|---|---|---|---|---|---|
| RMSE | MAPE (%) | RMSE | MAPE (%) | ||
| Humid area | Sub-area 1 | 0.0692 | 12.4 | 0.0642 | 11.3 |
| Sub-area2 | 0.0739 | 14.0 | 0.0715 | 13.0 | |
| Sub-area 3 | 0.0670 | 12.8 | 0.0651 | 11.6 | |
| Sub-total | 0.0703 | 13.1 | 0.0672 | 12.0 | |
| Semi-arid area | Sub-area 4 | 0.0586 | 14.5 | 0.0511 | 12.2 |
| Sub-area 5 | 0.0341 | 10.1 | 0.0321 | 8.71 | |
| Sub-area 6 | 0.0407 | 10.4 | 0.0380 | 9.38 | |
| Sub-total | 0.0450 | 11.5 | 0.0407 | 10.0 | |
| Arid area | Sub-area 7 | 0.0207 | 15.1 | 0.0182 | 11.3 |
| Sub-area 8 | 0.0088 | 8.50 | 0.0066 | 6.23 | |
| Sub-area 9 | 0.0122 | 9.91 | 0.0094 | 7.22 | |
| Sub-total | 0.0148 | 11.2 | 0.0125 | 8.27 | |
| Total | 0.0458 | 11.8 | 0.0428 | 9.85 | |
3.3. Number of Contaminated Pixels that Can Be Estimated
| Study Area | Estimated NDVIs (%) | |
|---|---|---|
| Humid area | Sub-area 1 | 70.2 |
| Sub-area2 | 70.6 | |
| Sub-area 3 | 68.1 | |
| Sub-total | 69.6 | |
| Semi-arid area | Sub-area 4 | 66.4 |
| Sub-area 5 | 80.1 | |
| Sub-area 6 | 78.5 | |
| Sub-total | 75.0 | |
| Arid area | Sub-area 7 | 88.5 |
| Sub-area 8 | 84.7 | |
| Sub-area 9 | 90.8 | |
| Sub-total | 88.0 | |
| Total | 77.5 | |
4. Discussion
4.1. Limitation of Temporal Estimation of NDVIs of Contaminated Pixels
| Study Area | Window Type | Temporal | Spatial | |||
|---|---|---|---|---|---|---|
| 101 (%) | 1001 (%) | Total (%) | 3 × 3 (%) | 5 × 5 (%) | ||
| Humid area | Sub-area 1 | 0.63 | 0.55 | 1.17 | 95.9 | 92.1 |
| Sub-area2 | 2.45 | 1.93 | 4.38 | 92.9 | 87.2 | |
| Sub-area 3 | 1.83 | 1.21 | 3.04 | 93.6 | 87.8 | |
| Sub-total | 1.64 | 1.23 | 2.86 | 94.1 | 89.0 | |
| Semi-arid area | Sub-area 4 | 1.02 | 0.30 | 1.31 | 95.5 | 91.5 |
| Sub-area 5 | 7.56 | 6.35 | 13.9 | 83.7 | 71.6 | |
| Sub-area 6 | 1.28 | 2.68 | 3.96 | 94.9 | 90.5 | |
| Sub-total | 3.29 | 3.11 | 6.39 | 91.4 | 84.5 | |
| Arid area | Sub-area 7 | 27.8 | 16.6 | 44.4 | 69.0 | 48.7 |
| Sub-area 8 | 28.4 | 16.7 | 45.1 | 72.3 | 52.9 | |
| Sub-area 9 | 24.7 | 19.2 | 43.9 | 73.9 | 55.7 | |
| Sub-total | 27.0 | 17.5 | 44.5 | 71.7 | 52.4 | |
| Total | 10.6 | 7.28 | 17.9 | 85.7 | 75.3 | |
4.2. Limitation of using Regular Spatial Neighborhood in Spatial Estimation
4.3. Impact of the Percentage of Contaminated Pixels
4.4. Significance of High-Quality Data
4.5. Weaknesses and Further Research
5. Conclusions
Acknowledgments
Author Contributions
Conflicts of Interest
References
- Anyamba, A.; Tucker, C.J. Analysis of Sahelian vegetation dynamics using NOAA-AVHRR NDVI data from 1981–2003. J. Arid Environ. 2005, 63, 596–614. [Google Scholar] [CrossRef]
- Xue, Y.J.; Liu, S.G.; Zhang, L.; Hu, Y.M. Integrating fuzzy logic with piecewise linear regression for detecting vegetation greenness change in the Yukon River Basin, Alaska. Int. J. Remote Sens. 2013, 34, 4242–4263. [Google Scholar] [CrossRef]
- Piao, S.L.; Fang, J.Y.; Zhou, L.M.; Ciais, P.; Zhu, B. Variations in satellite-derived phenology in China’s temperate vegetation. Glob. Chang. Biol. 2006, 12, 672–685. [Google Scholar] [CrossRef]
- De Jong, R.; Verbesselt, J.; Zeileis, A.; Schaepman, M.E. Shift in global vegetation activity trends. Remote Sens. 2013, 5, 1117–1133. [Google Scholar] [CrossRef]
- Kim, D.Y.; Thomas, V.; Olson, J.; Williams, M.; Clements, N. Statistical trend and change-point analysis of land-cover-change patterns in East Africa. Int. J. Remote Sens. 2013, 34, 6636–6650. [Google Scholar] [CrossRef]
- Jamali, S.; JÖnsson, P.; Eklundh, L.; ArdÖ, J.; Seaquist, J. Detecting changes in vegetation trends using time series segmentation. Remote Sens. Environ. 2015, 156, 182–195. [Google Scholar] [CrossRef]
- Roy, D.P.; Borak, S.J.; Devadiga, S.; Wolfe, R.E.; Zheng, M.; Descloitres, J. The MODIS land product quality assessment approach. Remote Sens. Environ. 2002, 83, 62–76. [Google Scholar] [CrossRef]
- Chen, J.; Jonsson, P.; Tamura, M.; Gu, Z.H.; Matsushita, B.; Eklundh, L. A simple method for reconstructing a high-quality NDVI time-series data set based on the Savitzky–Golay filter. Remote Sens. Environ. 2004, 91, 332–344. [Google Scholar] [CrossRef]
- Gu, J.; Li, X.; Huang, C.L.; Okin, G.S. A simplified data assimilation method for reconstructing time-series MODIS NDVI data. Adv. Space Res. 2009, 44, 501–509. [Google Scholar] [CrossRef]
- Michishita, R.; Zhen, Y.J.; Chen, J.; Xu, B. Empirical comparison of noise reduction techniques for NDVI time-series based on a new measure. ISPRS J. Photogramm. Remote Sens. 2014, 91, 17–28. [Google Scholar] [CrossRef]
- Cai, B.; Yu, R. Advance and evaluation in the long time series vegetation trends research based on remote sensing. J. Remote Sens. 2009, 13, 1170–1186. [Google Scholar]
- Wessels, K.J.; Prince, S.D.; Malherbe, J.; Small, J.; Frost, P.E.; Van, Z.D. Can human-induced land degradation be distinguished from the effects of rainfall variability? A case study in South Africa. J. Arid Environ. 2007, 68, 271–297. [Google Scholar] [CrossRef]
- Savitzky, A.; Golay, M.J. Smoothing and differentiation of data by simplified least squares procedures. Anal. Chem. 1964, 36, 1627–1639. [Google Scholar] [CrossRef]
- Jönsson, P.; Eklundh, L. TIMESAT—A program for analyzing time-series of satellite sensor data. Comput. Geosci. 2004, 30, 833–845. [Google Scholar] [CrossRef]
- Ma, M.G.; Veroustraete, F. Reconstructing pathfinder AVHRR land NDVI time-series data for the Northwest of China. Adv. Space Res. 2006, 37, 835–840. [Google Scholar] [CrossRef]
- Viovy, N.; Arino, O.; Belward, A. The Best Index Slope Extraction (BISE): A method for reducing noise in NDVI time-series. Int. J. Remote Sens. 1992, 13, 1585–1590. [Google Scholar] [CrossRef]
- Beck, P.S.A.; Atzberger, C.; Hogda, K.A.; Johansen, B.; Skidmore, A.K. Improved monitoring of vegetation dynamics at very high latitudes: A new method using MODIS NDVI. Remote Sens. Environ. 2006, 100, 321–334. [Google Scholar] [CrossRef]
- Jonsson, P.; Eklundh, L. Seasonality extraction by function fitting to time-series of satellite sensor data. IEEE Trans. Geosci. Remote Sens. 2002, 40, 1824–1832. [Google Scholar] [CrossRef]
- Roerink, G.J.; Menenti, M.; Verhoef, W. Reconstructing cloud free NDVI composites using Fourier analysis of time series. Int. J. Remote Sens. 2000, 21, 1911–1917. [Google Scholar] [CrossRef]
- De Oliveira, J.C.; Neves Epiphanio, J.C.; Rennó, C.D. Window regression: A spatial-temporal analysis to estimate pixels classified as low-quality in MODIS NDVI time series. Remote Sens. 2014, 6, 3123–3142. [Google Scholar] [CrossRef]
- Shao, Y.; Lunetta, R.S. Comparison of support vector machine, neural network, and CART algorithms for the land-cover classification using limited training data points. ISPRS J. Photogramm. Remote Sens. 2012, 70, 78–87. [Google Scholar] [CrossRef]
- Poggio, L.; Gimona, A.; Brown, L. Spatio-temporal MODIS EVI gap filling under cloud cover: An example in Scotland. ISPRS J. Photogramm. Remote Sens. 2012, 72, 56–72. [Google Scholar] [CrossRef]
- Cho, A.R.; Suh, M.S. Detection of contaminated pixels based on the short-term continuity of NDVI and correction using spatio-temporal continuity. Asia Pac. J. Atmos. Sci. 2013, 49, 511–525. [Google Scholar] [CrossRef]
- Yu, L.; Wang, J.; Gong, P. Improving 30 m global land-cover map FROM-GLC with time series MODIS and auxiliary data sets: A segmentation-based approach. Int. J. Remote Sens. 2013, 34, 5851–5867. [Google Scholar] [CrossRef]
- Gong, P.; Wang, J.; Yu, L.; Zhao, Y.C.; Zhao, Y.Y.; Liang, L.; Niu, Z.G.; Huang, X.M.; Fu, H.H.; Liu, S.; et al. Finer resolution observation and monitoring of global land cover: First mapping results with Landsat TM and ETM+ data. Int. J. Remote Sens. 2013, 34, 2607–2654. [Google Scholar] [CrossRef]
- Gao, F.; Masek, J.; Schwaller, M.; Hall, F. On the blending of the Landsat and MODIS surface reflectance: Predicting daily Landsat surface reflectance. IEEE T. Geosci. Remote Sens. 2006, 44, 2207–2218. [Google Scholar]
- Zhu, X.L.; Chen, J.; Gao, F.; Chen, X.H.; Masek, J.G. An enhanced spatial and temporal adaptive reflectance fusion model for complex heterogeneous regions. Remote Sens. Environ. 2010, 114, 2610–2623. [Google Scholar] [CrossRef]
- Keogh, E.J.; Pazzani, M.J. An enhanced representation of time series which allows fast and accurate classification. In Proceedings of the Fourth International Conference on Knowledge Discovery and Data Mining (KDD’98), New York, NY, USA, 27–31 August 1998; pp. 239–241.
- Wang, X.Z.; Smith, K.; Hyndman, R. Characteristic-based clustering for time series data. Data Min. Knowl. Disc. 2006, 13, 335–364. [Google Scholar] [CrossRef]
- Kumar, M.; Patel, N.R.; Woo, J. Clustering seasonality patterns in the presence of errors. In Proceedings of the Eighth ACM SIGKDD International Conference: Knowledge Discovery & Data Mining, Edmonton, AB, Canada, 23 July 2002; pp. 557–563.
© 2015 by the authors; licensee MDPI, Basel, Switzerland. This article is an open access article distributed under the terms and conditions of the Creative Commons Attribution license (http://creativecommons.org/licenses/by/4.0/).
Share and Cite
Xu, L.; Li, B.; Yuan, Y.; Gao, X.; Zhang, T. A Temporal-Spatial Iteration Method to Reconstruct NDVI Time Series Datasets. Remote Sens. 2015, 7, 8906-8924. https://doi.org/10.3390/rs70708906
Xu L, Li B, Yuan Y, Gao X, Zhang T. A Temporal-Spatial Iteration Method to Reconstruct NDVI Time Series Datasets. Remote Sensing. 2015; 7(7):8906-8924. https://doi.org/10.3390/rs70708906
Chicago/Turabian StyleXu, Lili, Baolin Li, Yecheng Yuan, Xizhang Gao, and Tao Zhang. 2015. "A Temporal-Spatial Iteration Method to Reconstruct NDVI Time Series Datasets" Remote Sensing 7, no. 7: 8906-8924. https://doi.org/10.3390/rs70708906
APA StyleXu, L., Li, B., Yuan, Y., Gao, X., & Zhang, T. (2015). A Temporal-Spatial Iteration Method to Reconstruct NDVI Time Series Datasets. Remote Sensing, 7(7), 8906-8924. https://doi.org/10.3390/rs70708906