
Automatic Case-Based Reasoning Approach for Landslide Detection: Integration of Object-Oriented Image Analysis and a Genetic Algorithm

 ,
, 

Abstract
:
1. Introduction
2. Materials and Data Collection
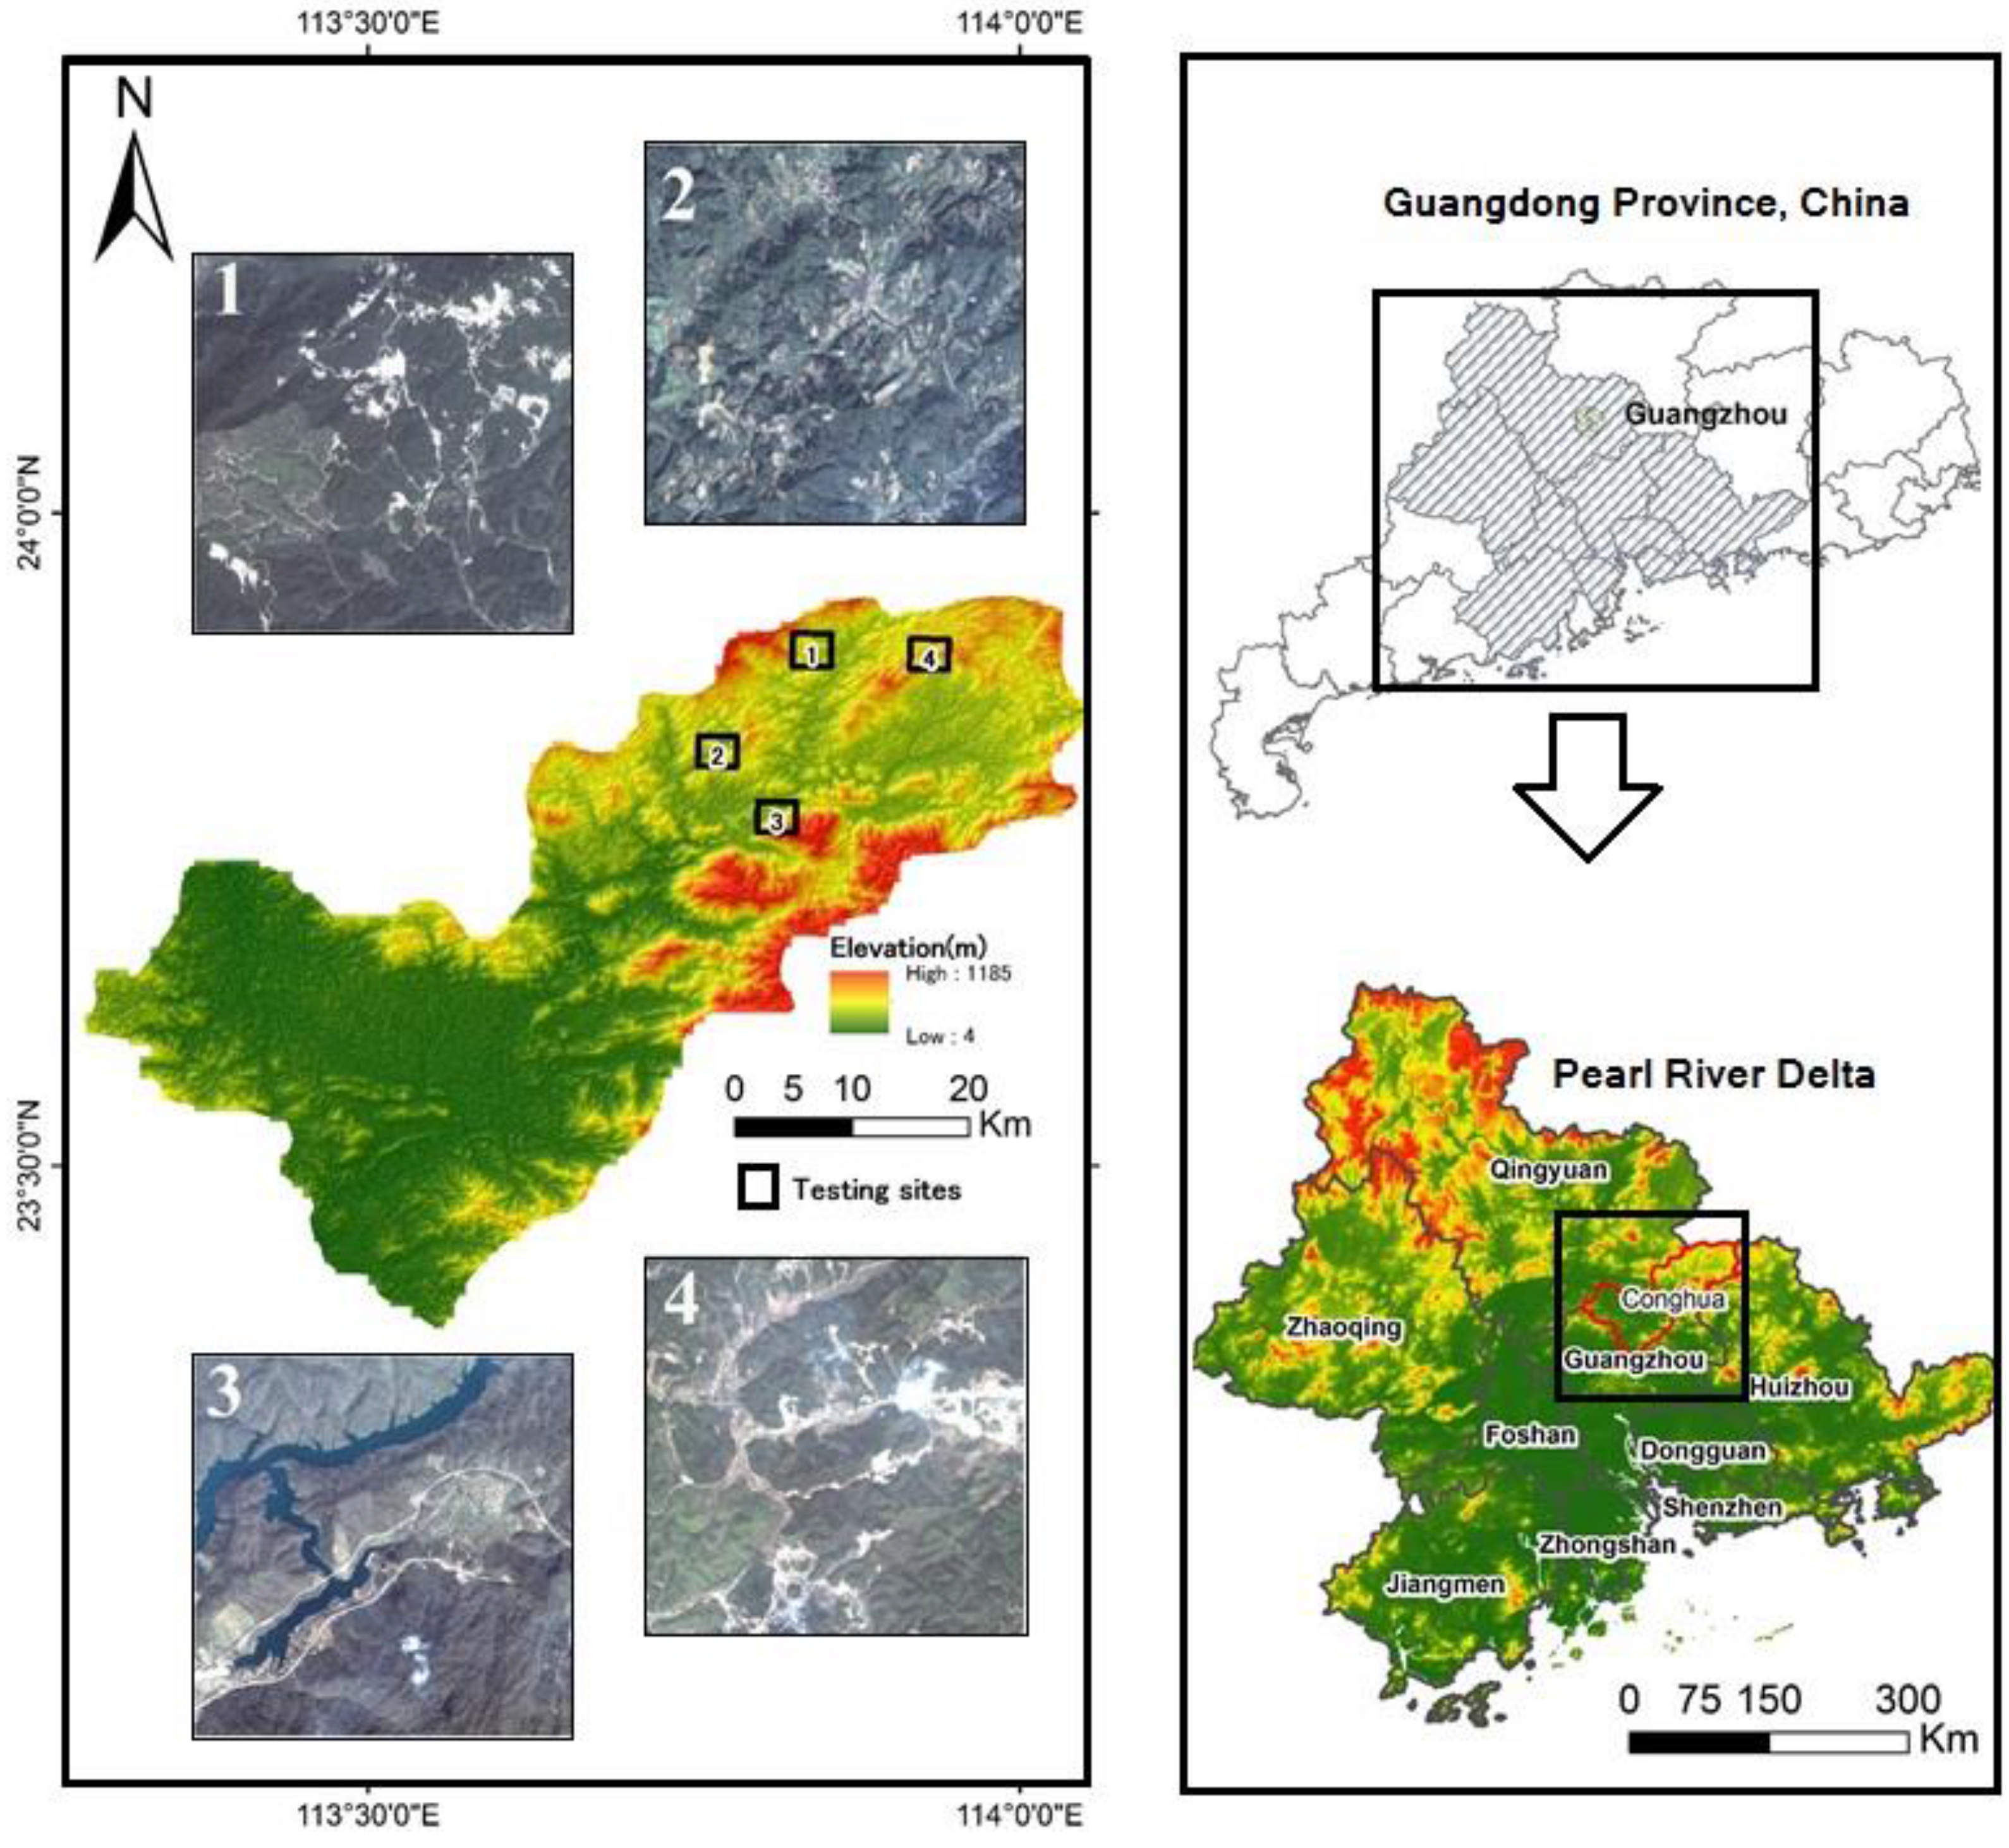
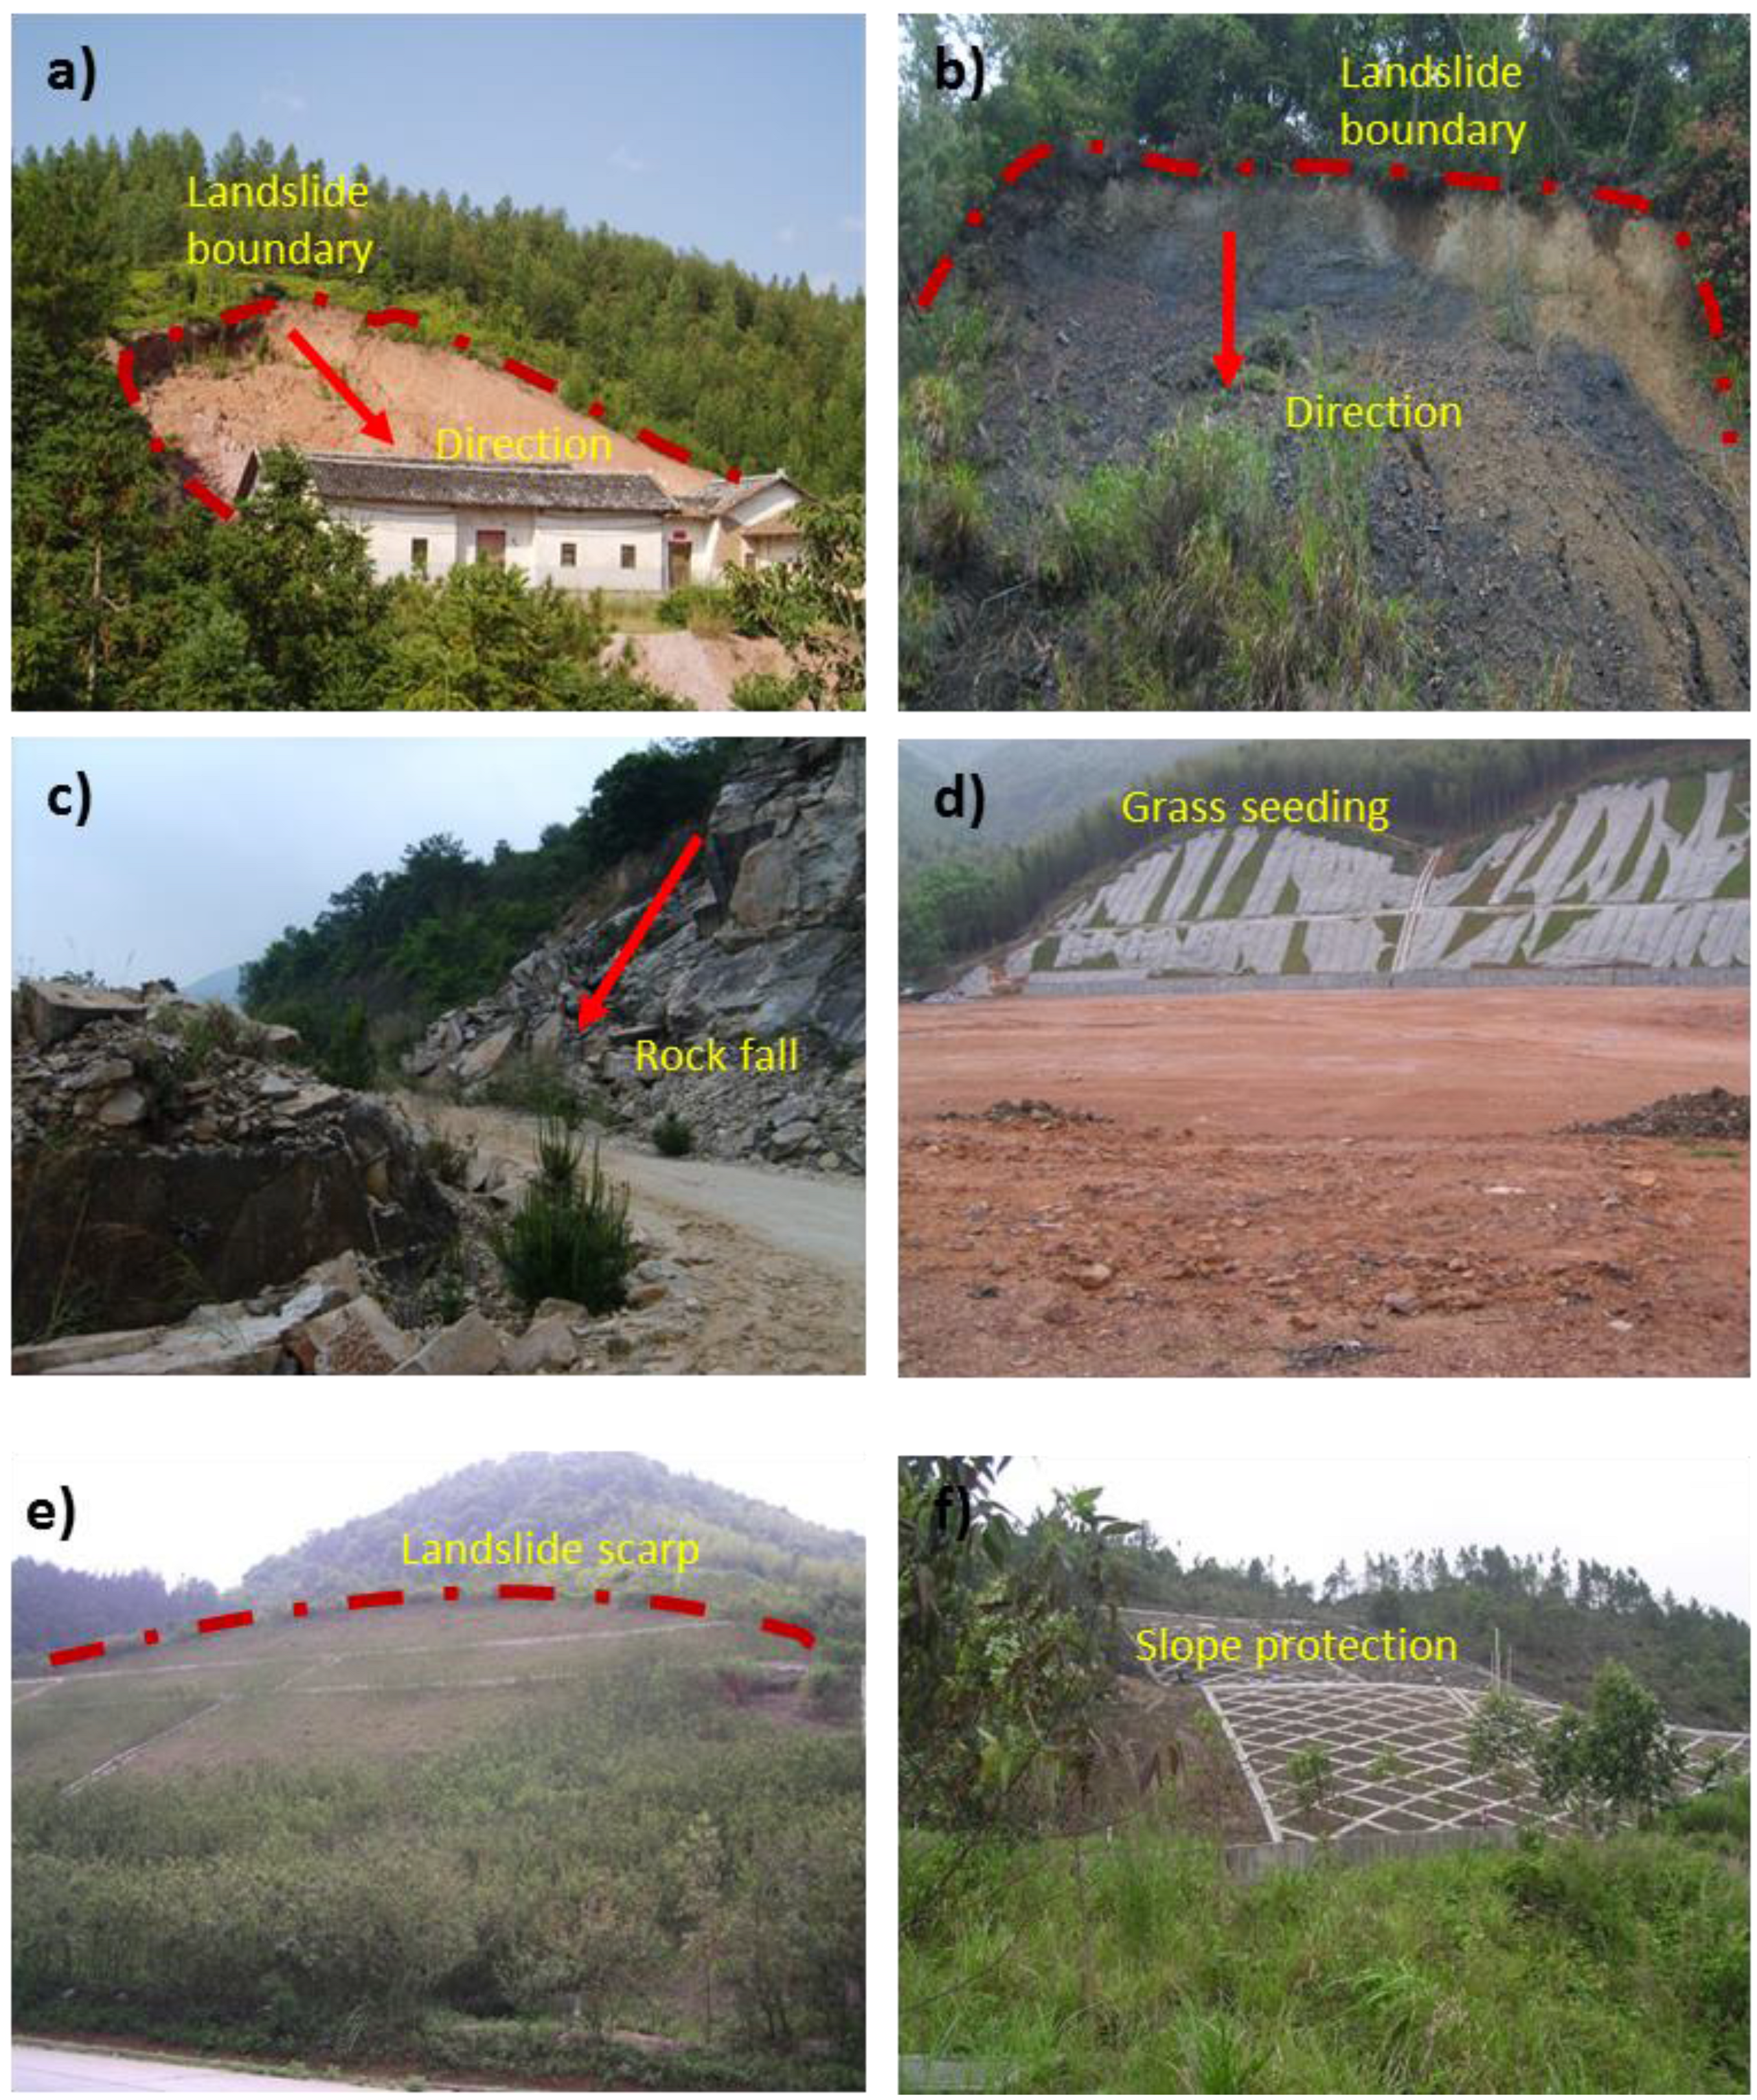
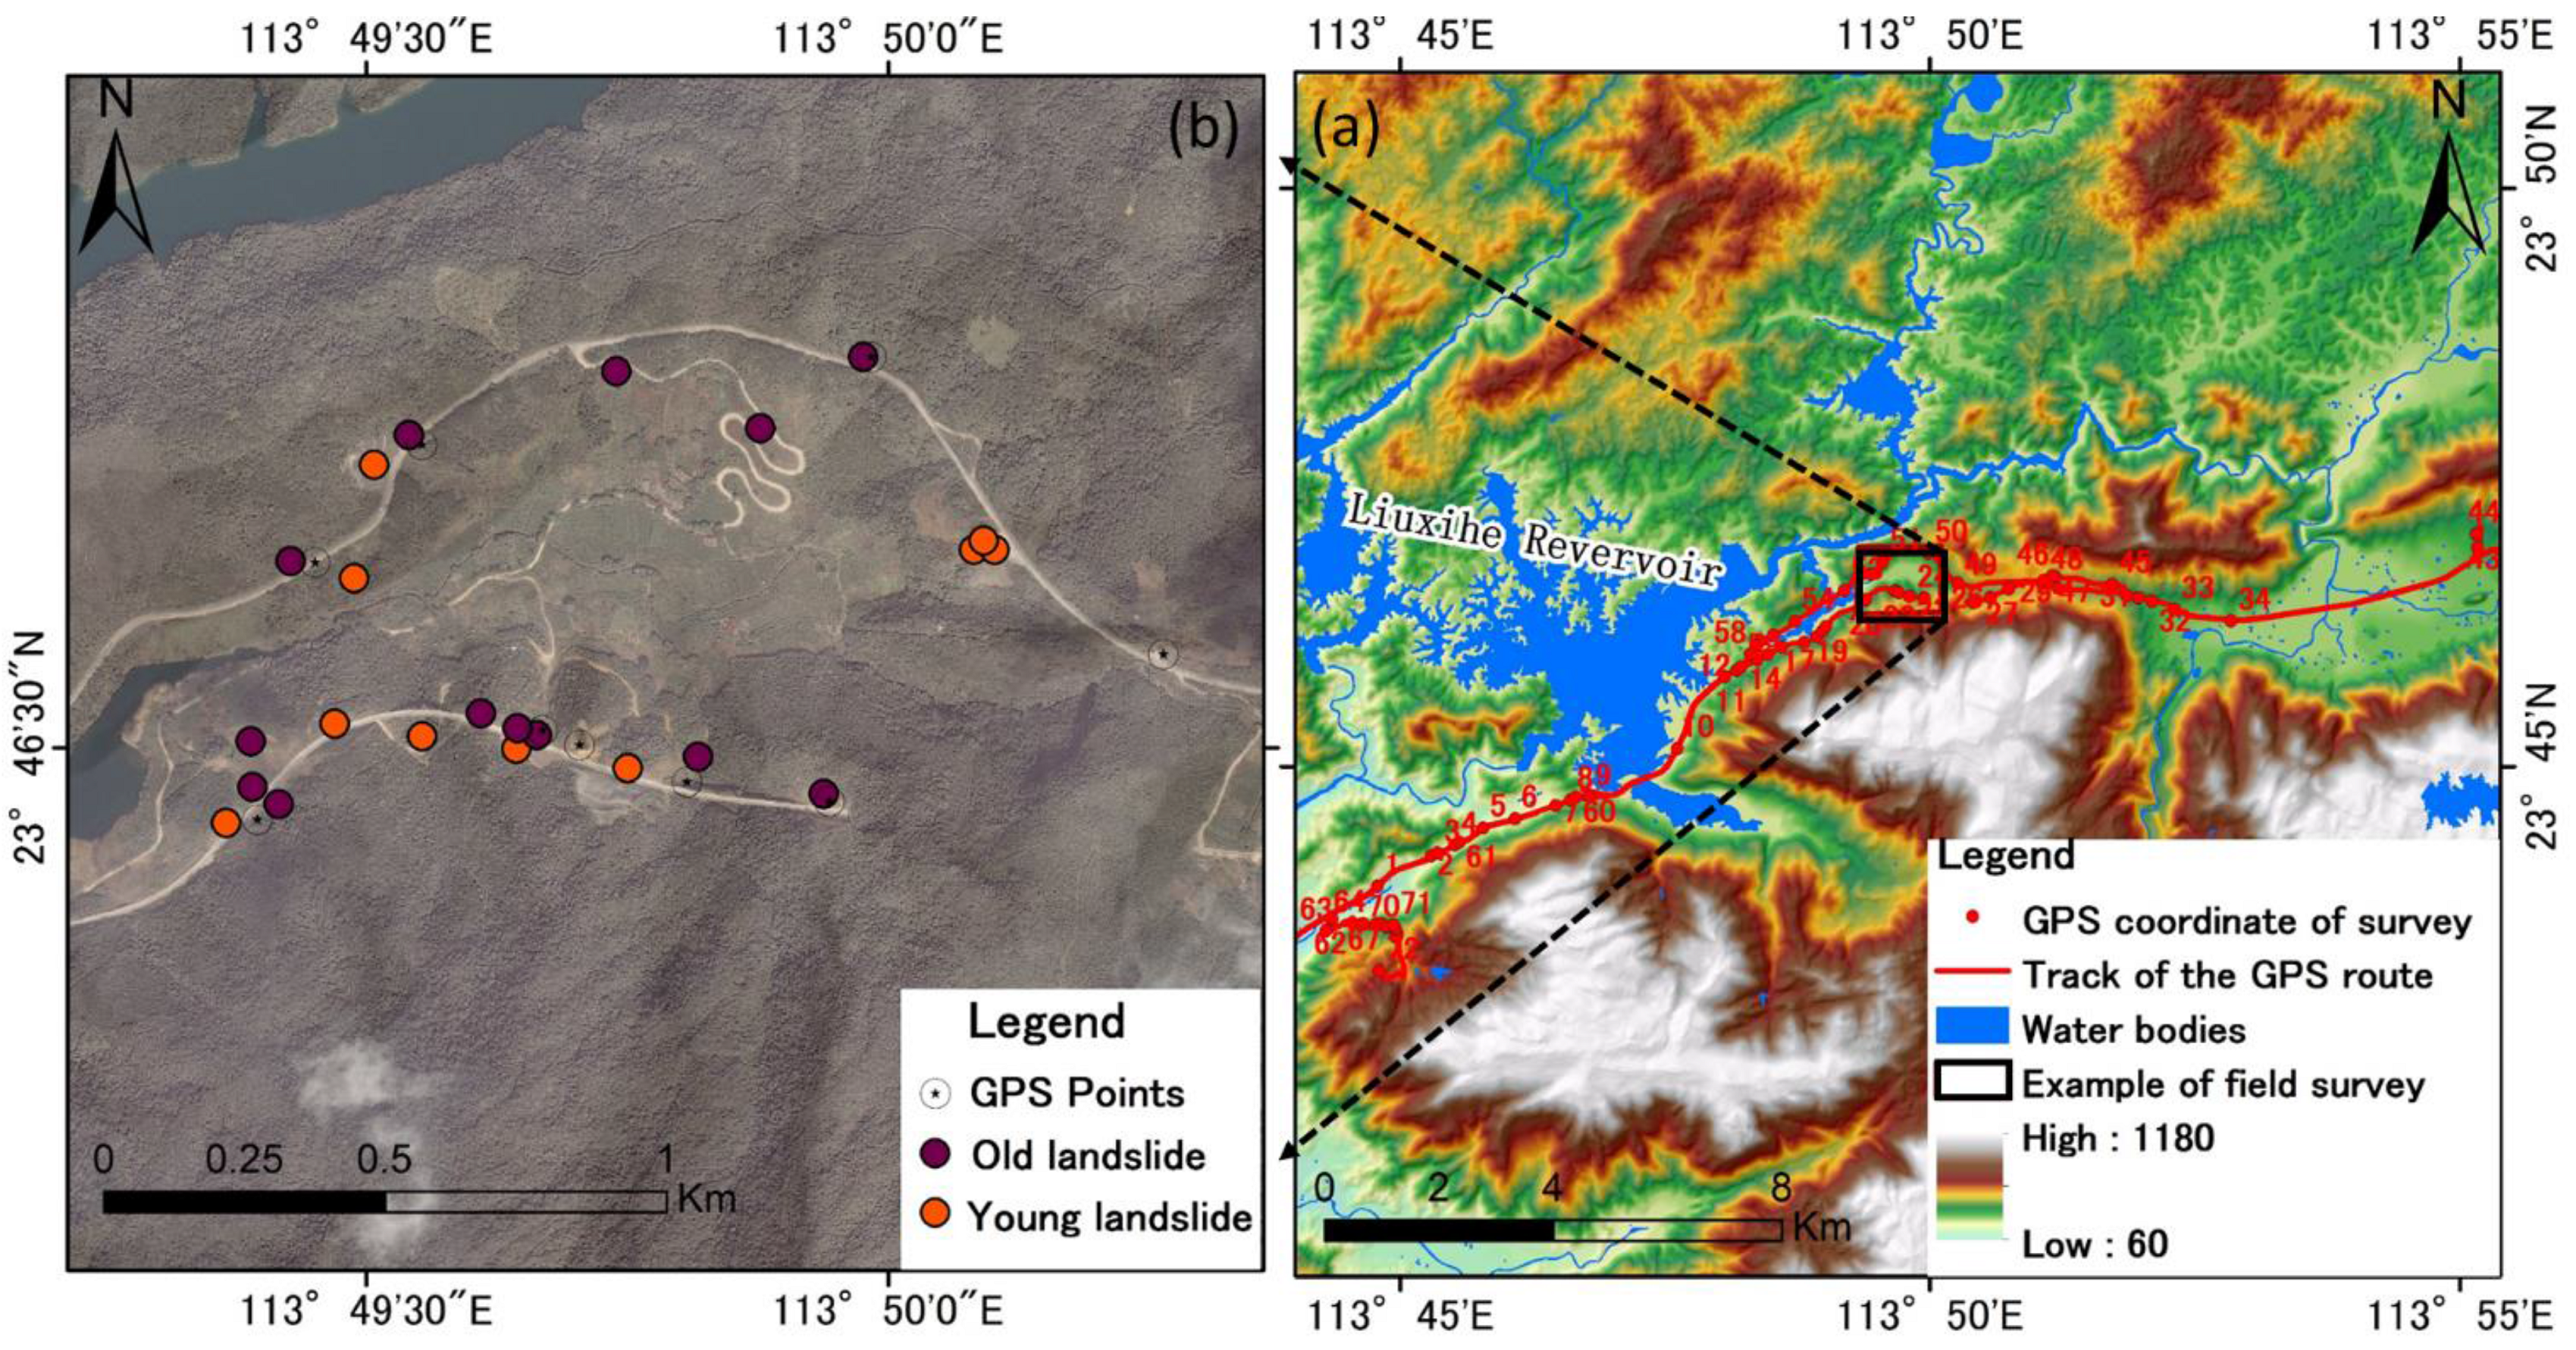
2.1. Geography of the Study Area
2.2. Data Collection

| Image Data | Pan (µm) | Red (µm) | Green (µm) | Blue (µm) | Near IR (µm) | Spatial Resolution | Date of Acquisition |
|---|---|---|---|---|---|---|---|
| QuickBird | 0.45–0.9 | 0.63–0.69 | 0.52–0.6 | 0.45–0.52 | 0.78–0.9 | Pan:0.61 m | 10 October 2006 and 20 March 2007 |
| Ms:2.8 m | |||||||
| SPOT 5 | 0.48–0.71 | 0.61–0.68 | 0.5–0.59 | Shortwave IR (1.58–1.75) | 0.78–0.89 | Pan 2.5 m | 7 December 2006 |
| Ms:10 m |
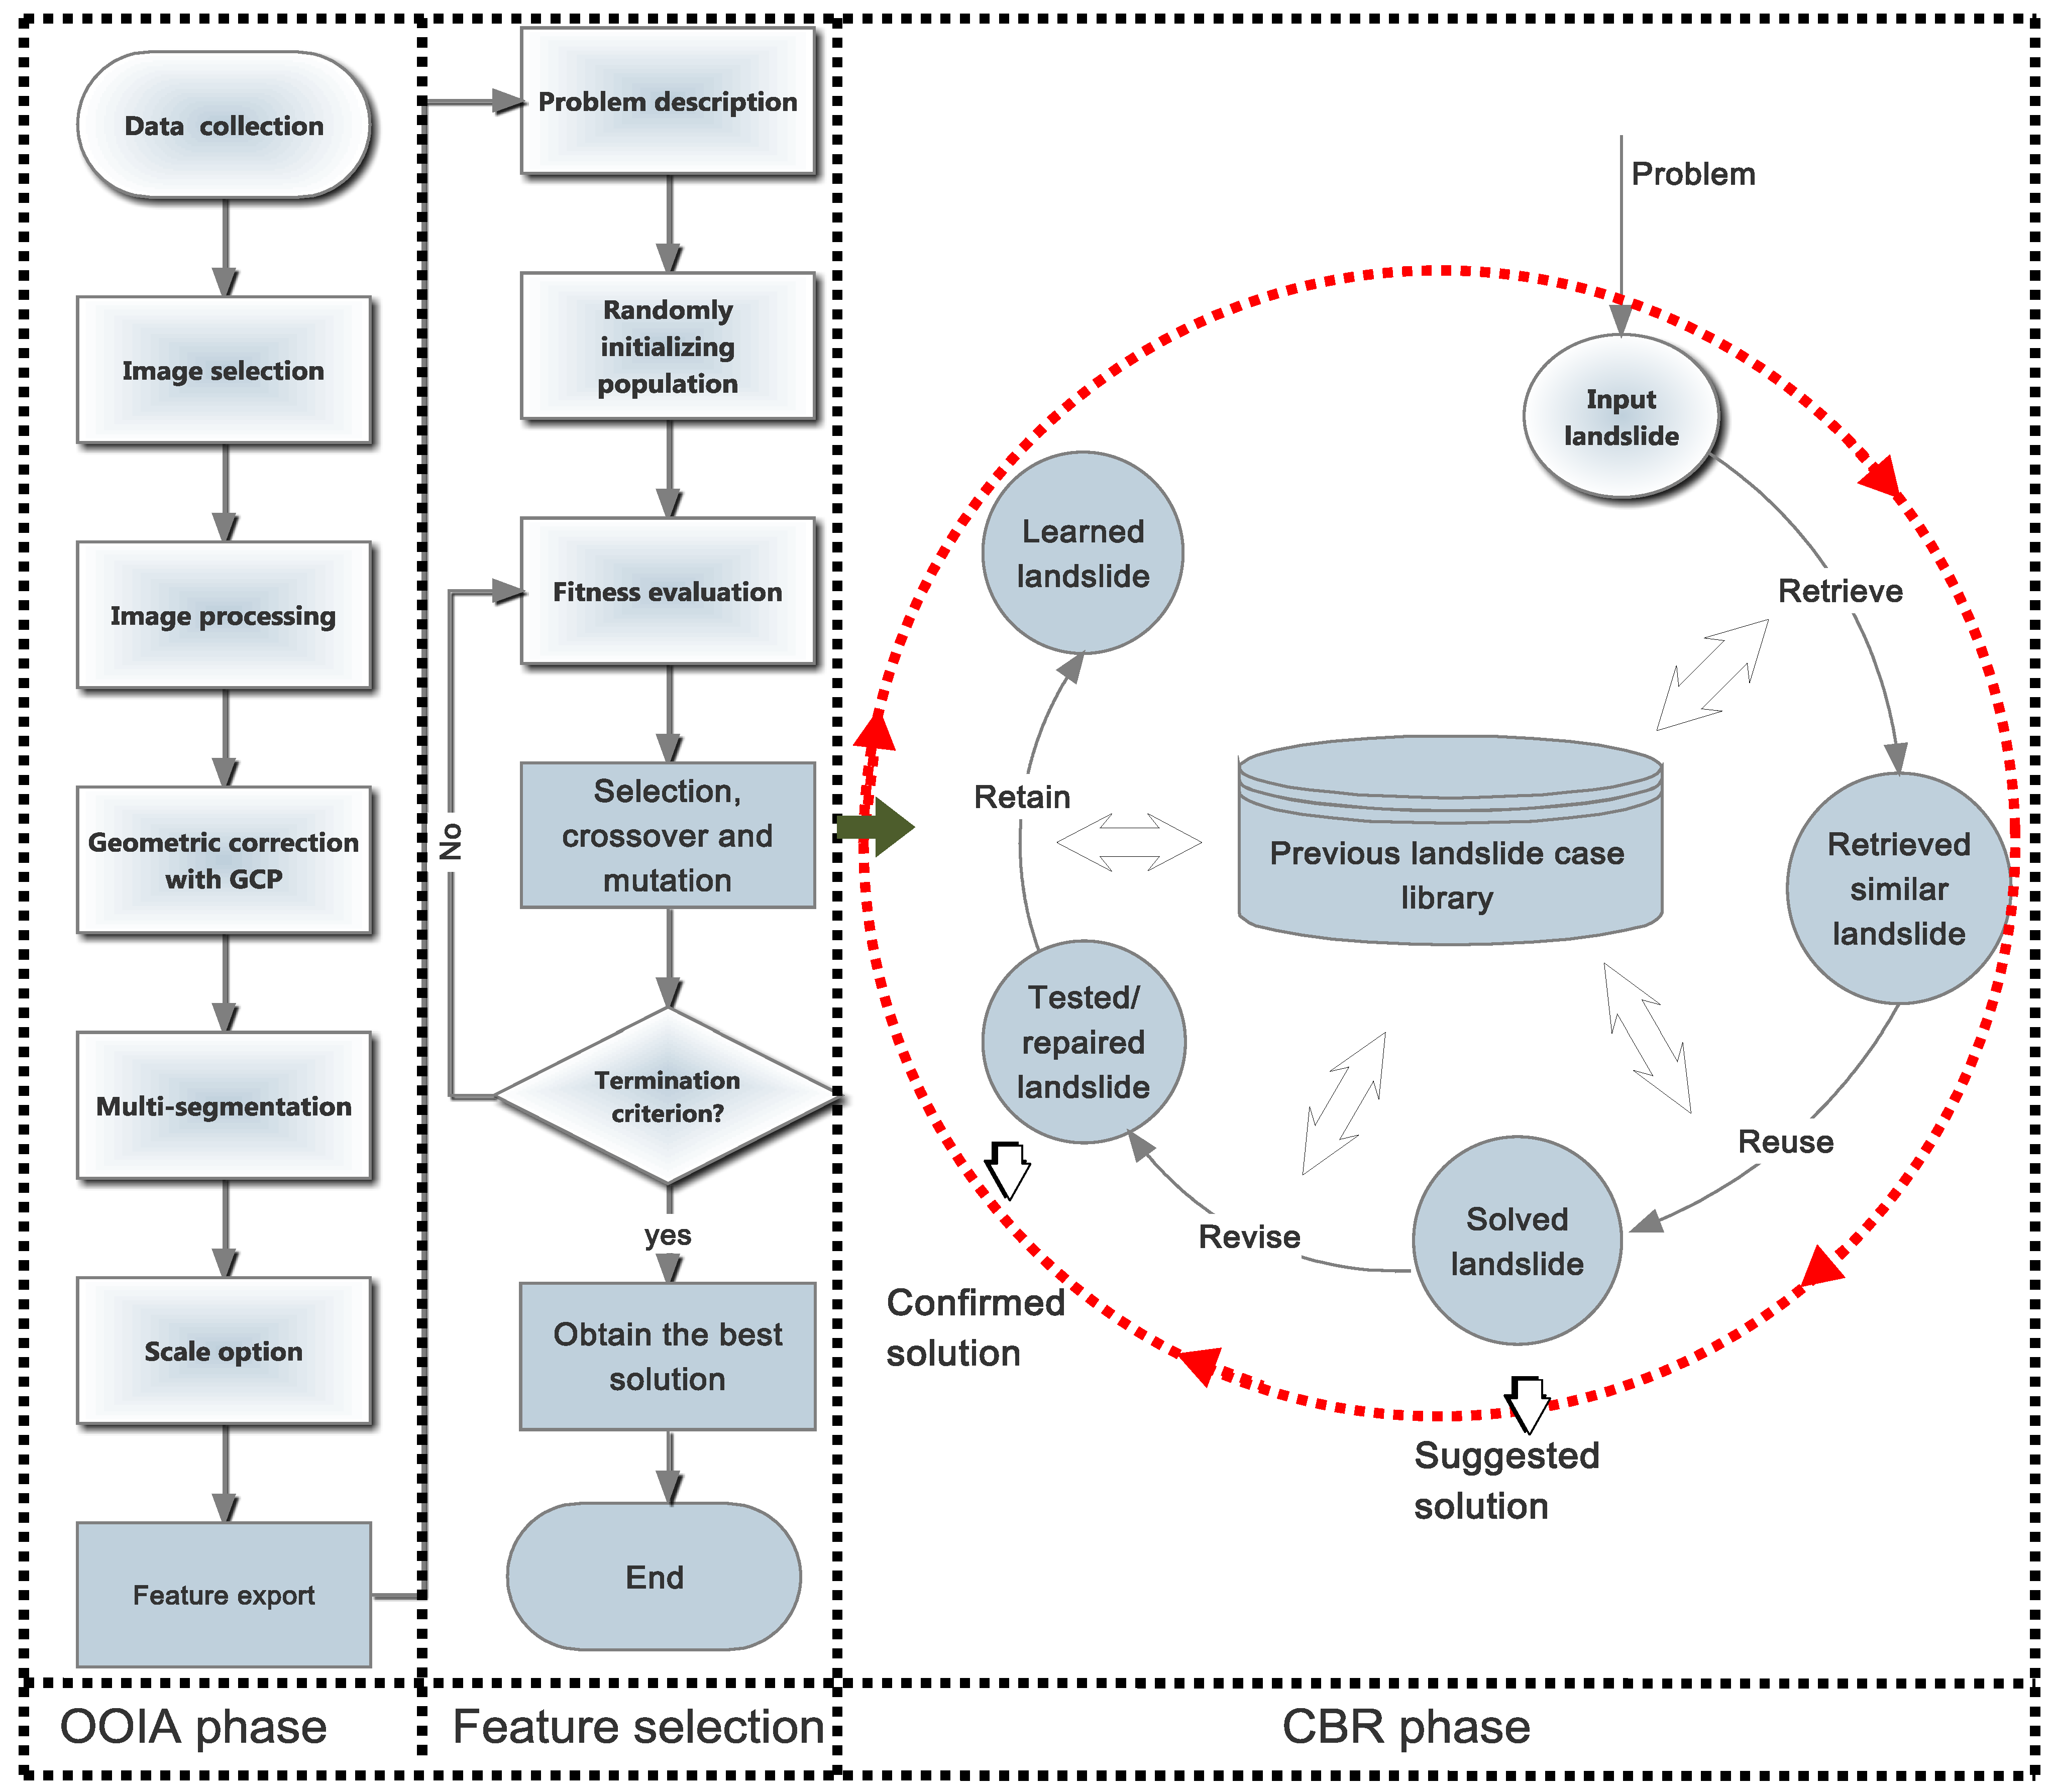
3. Methodology
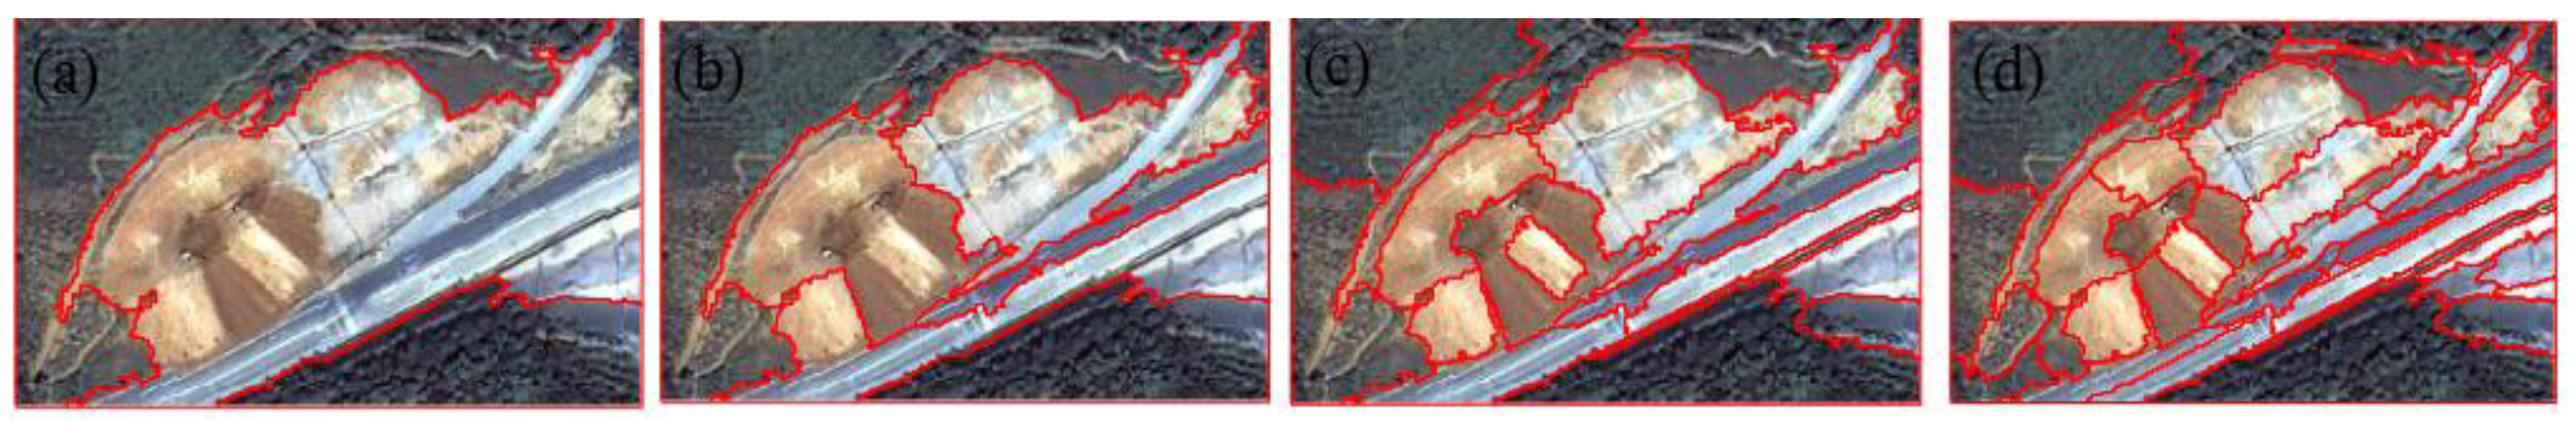
3.1. Multiresolution Segmentation Technique


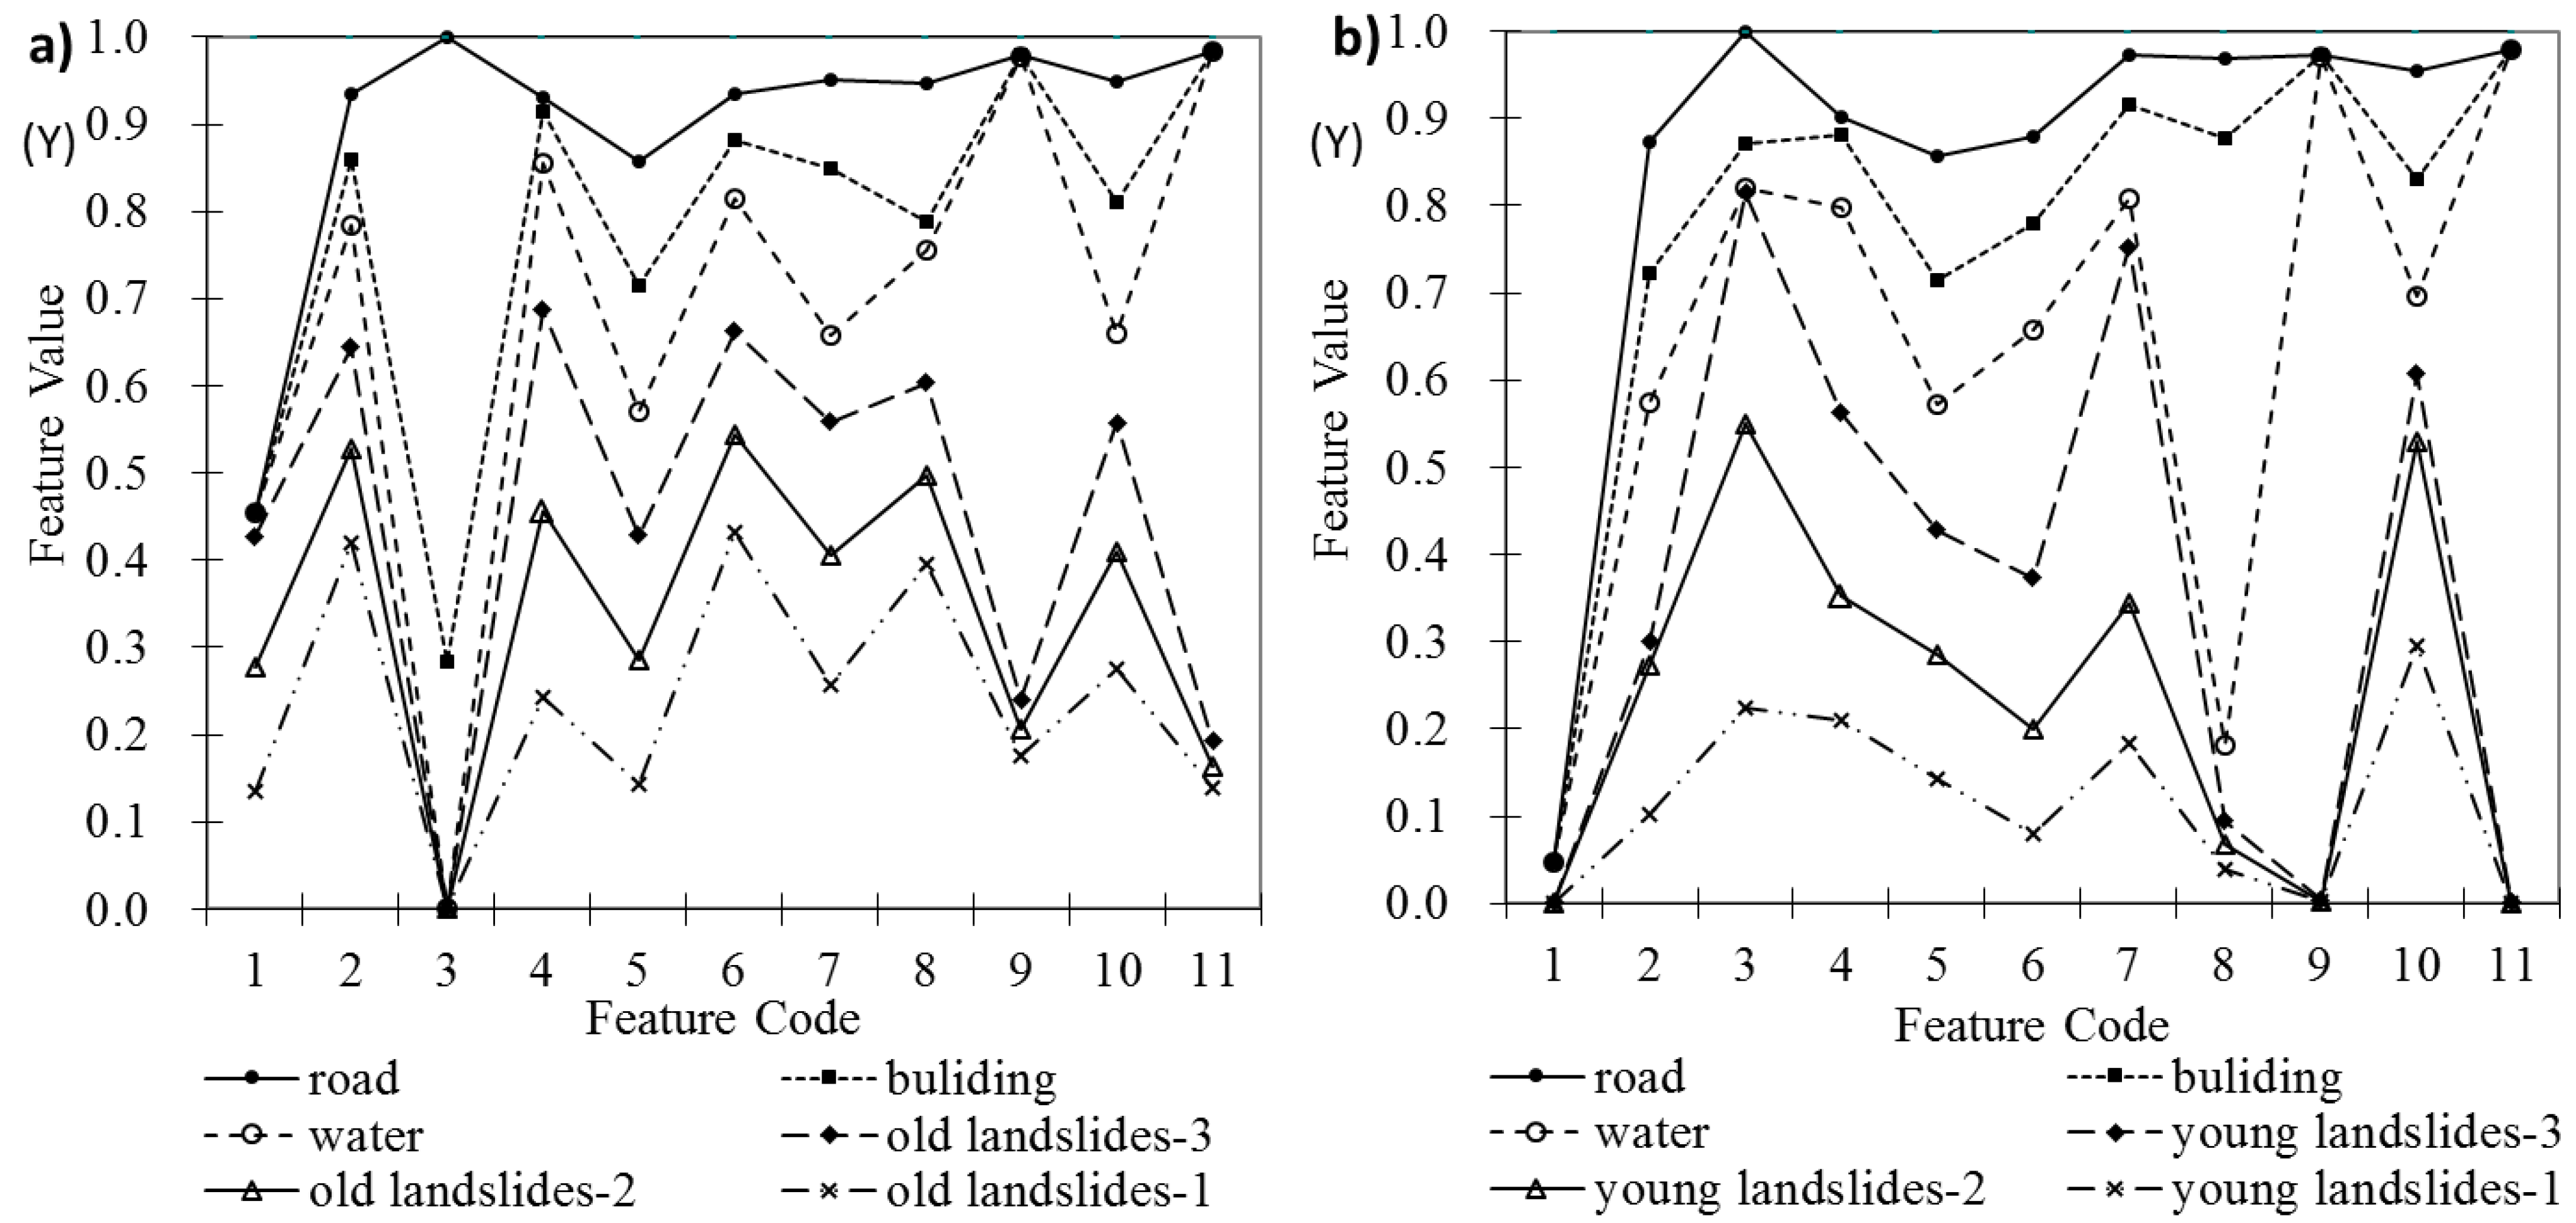
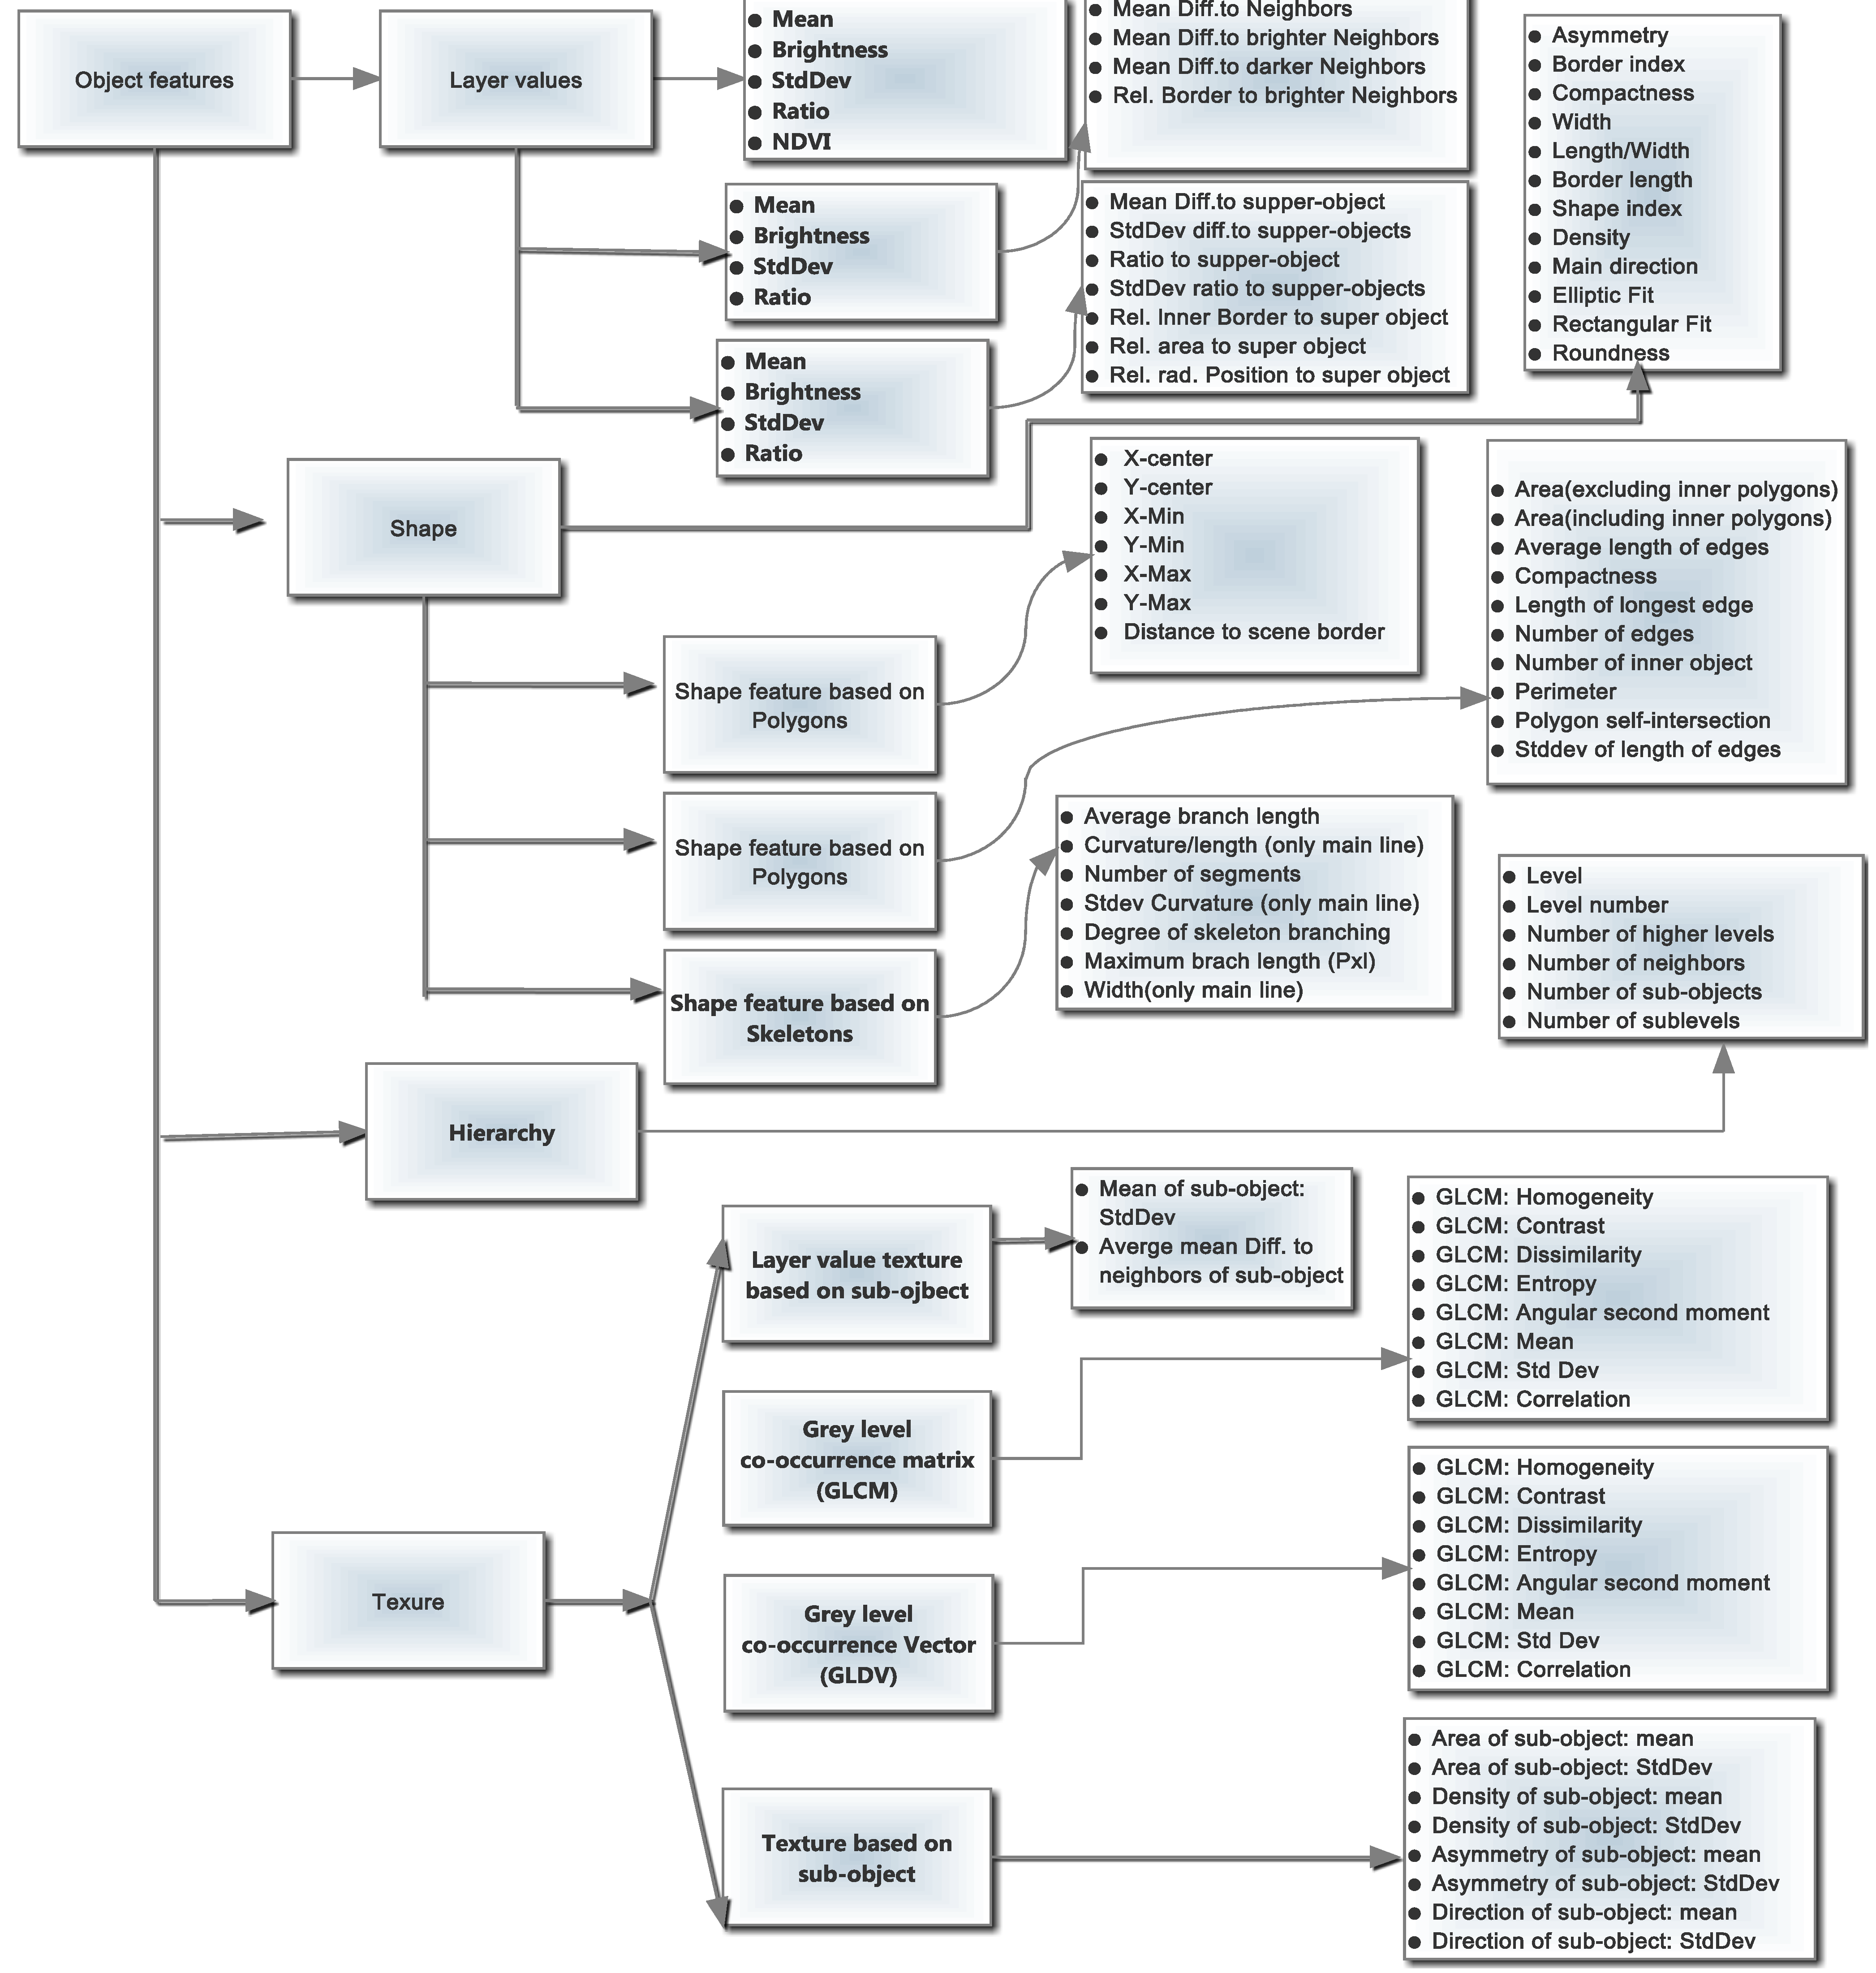
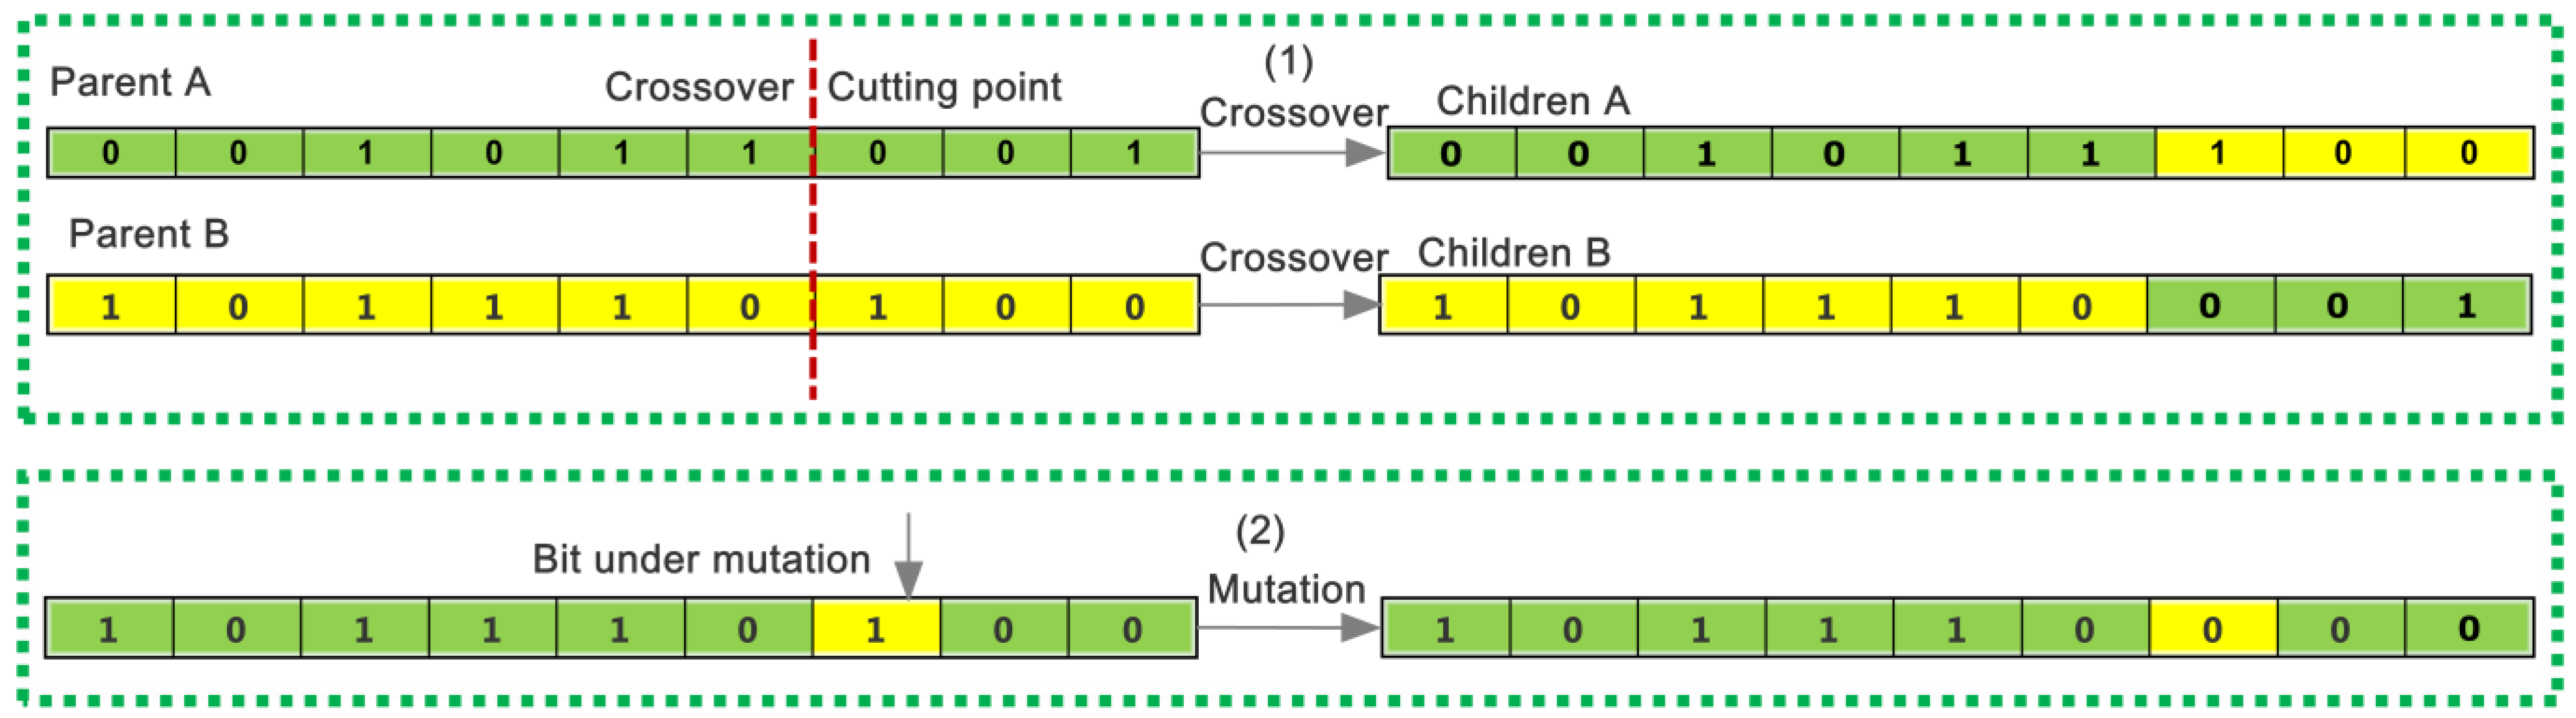
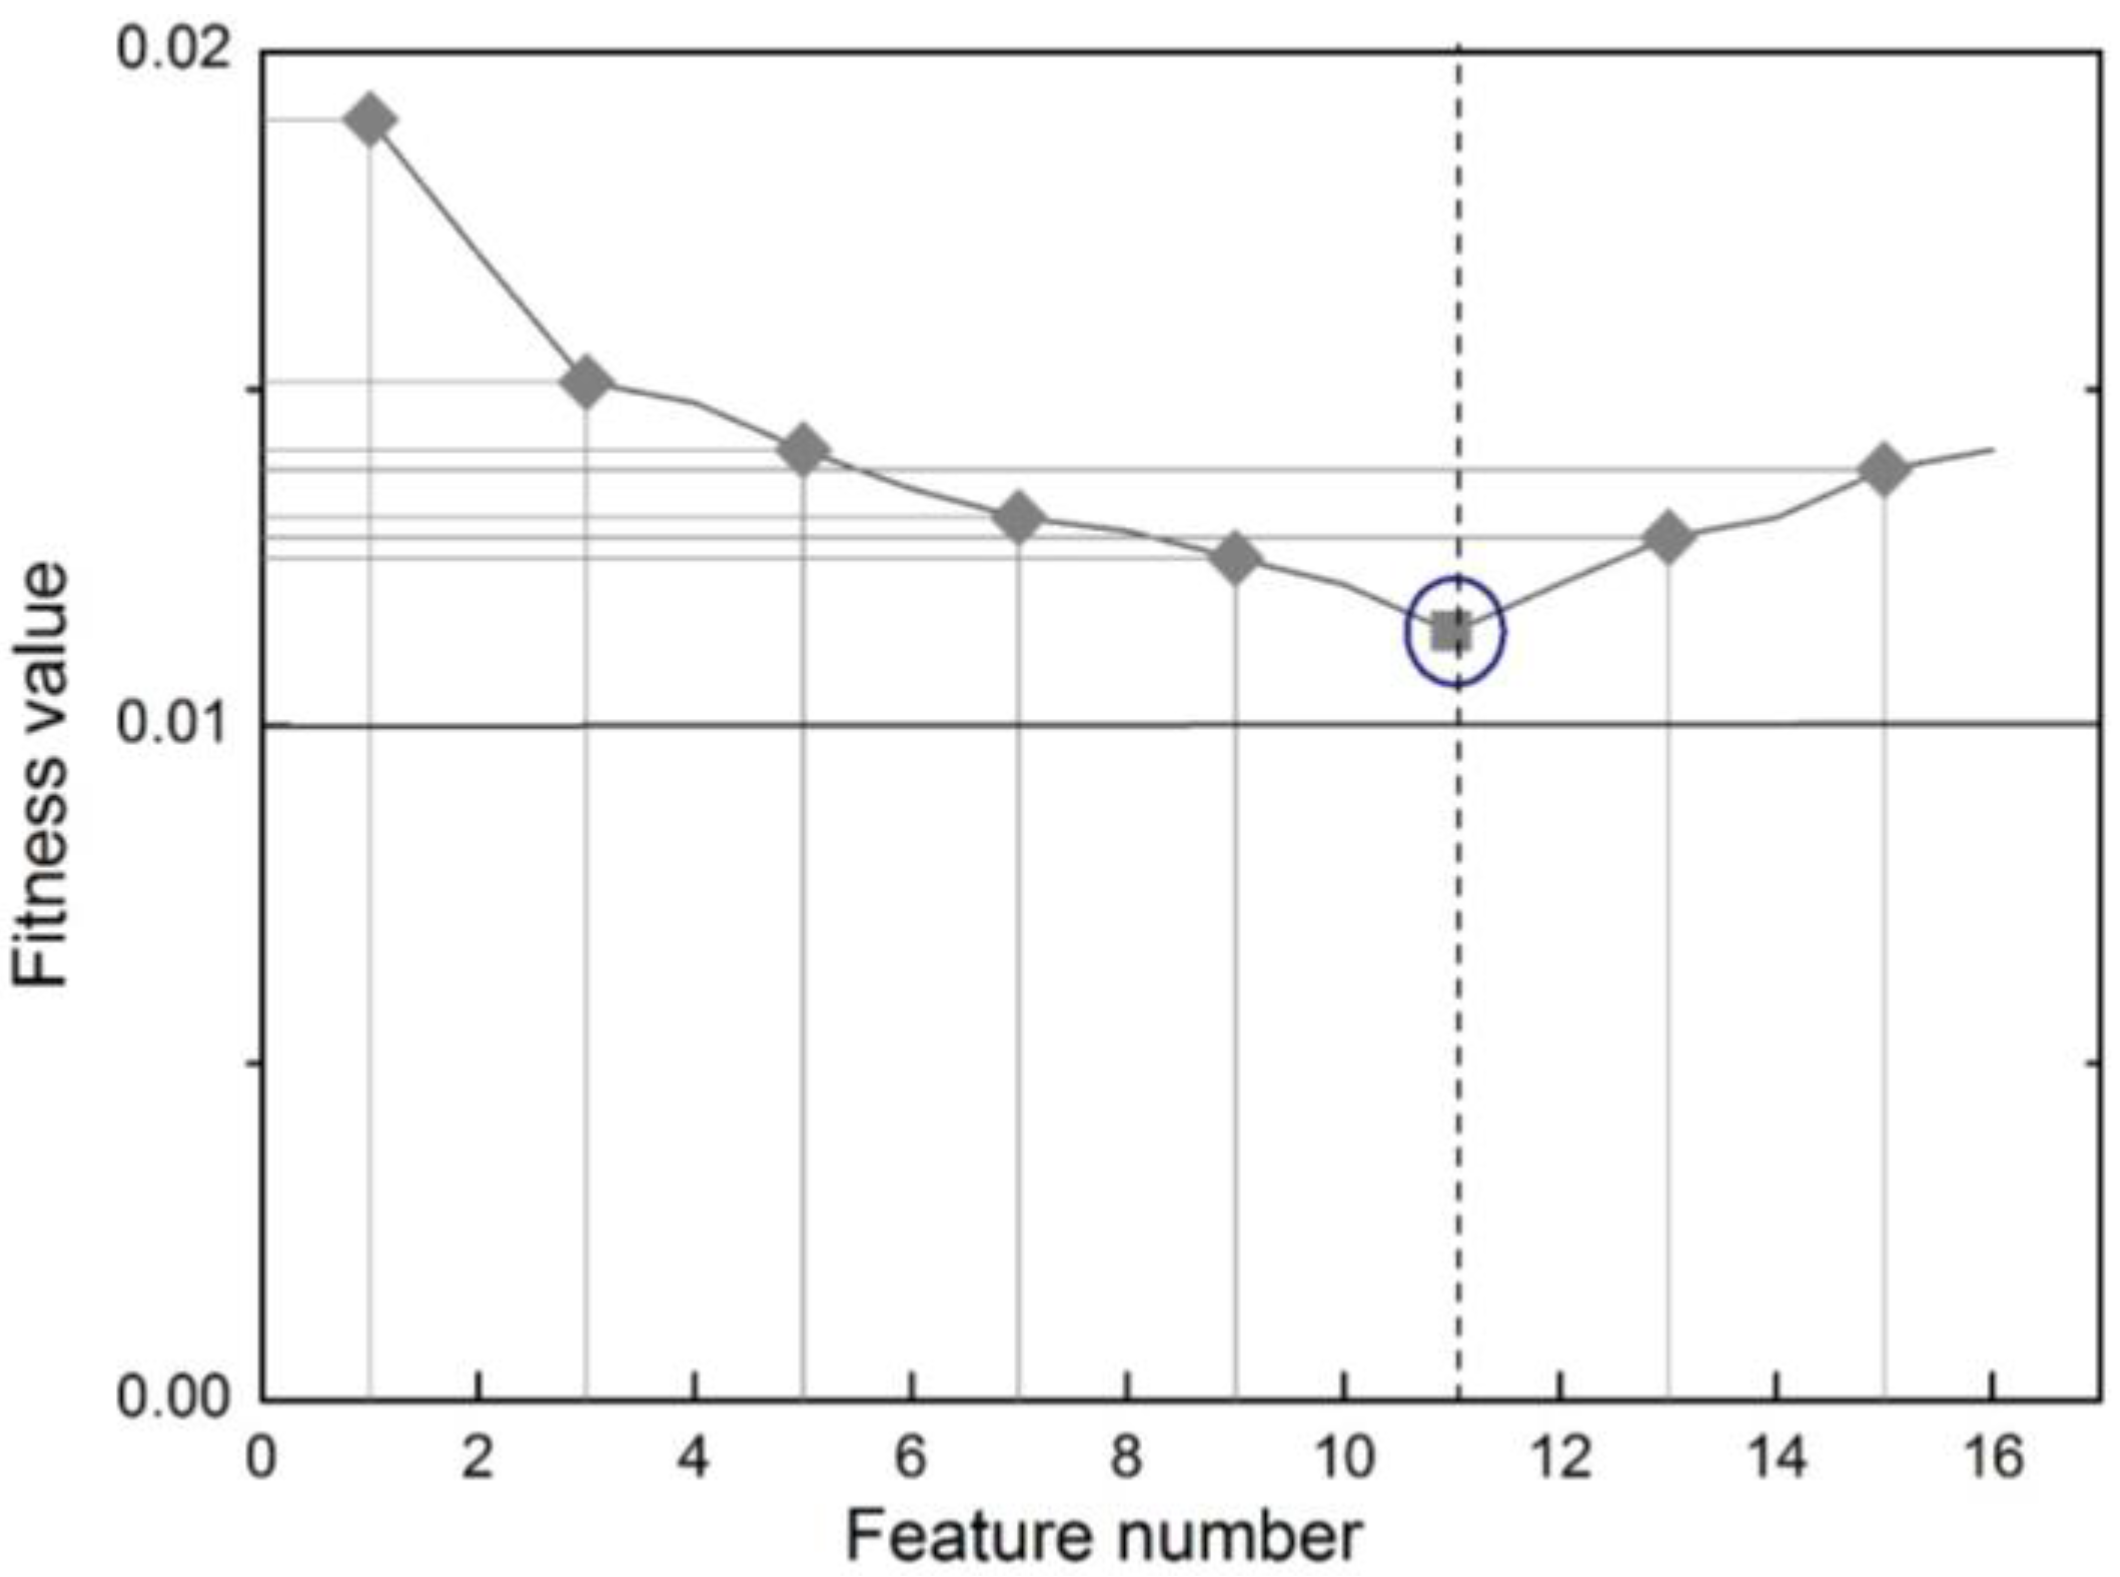
3.2. GAs-Based Optimization of Feature Selection
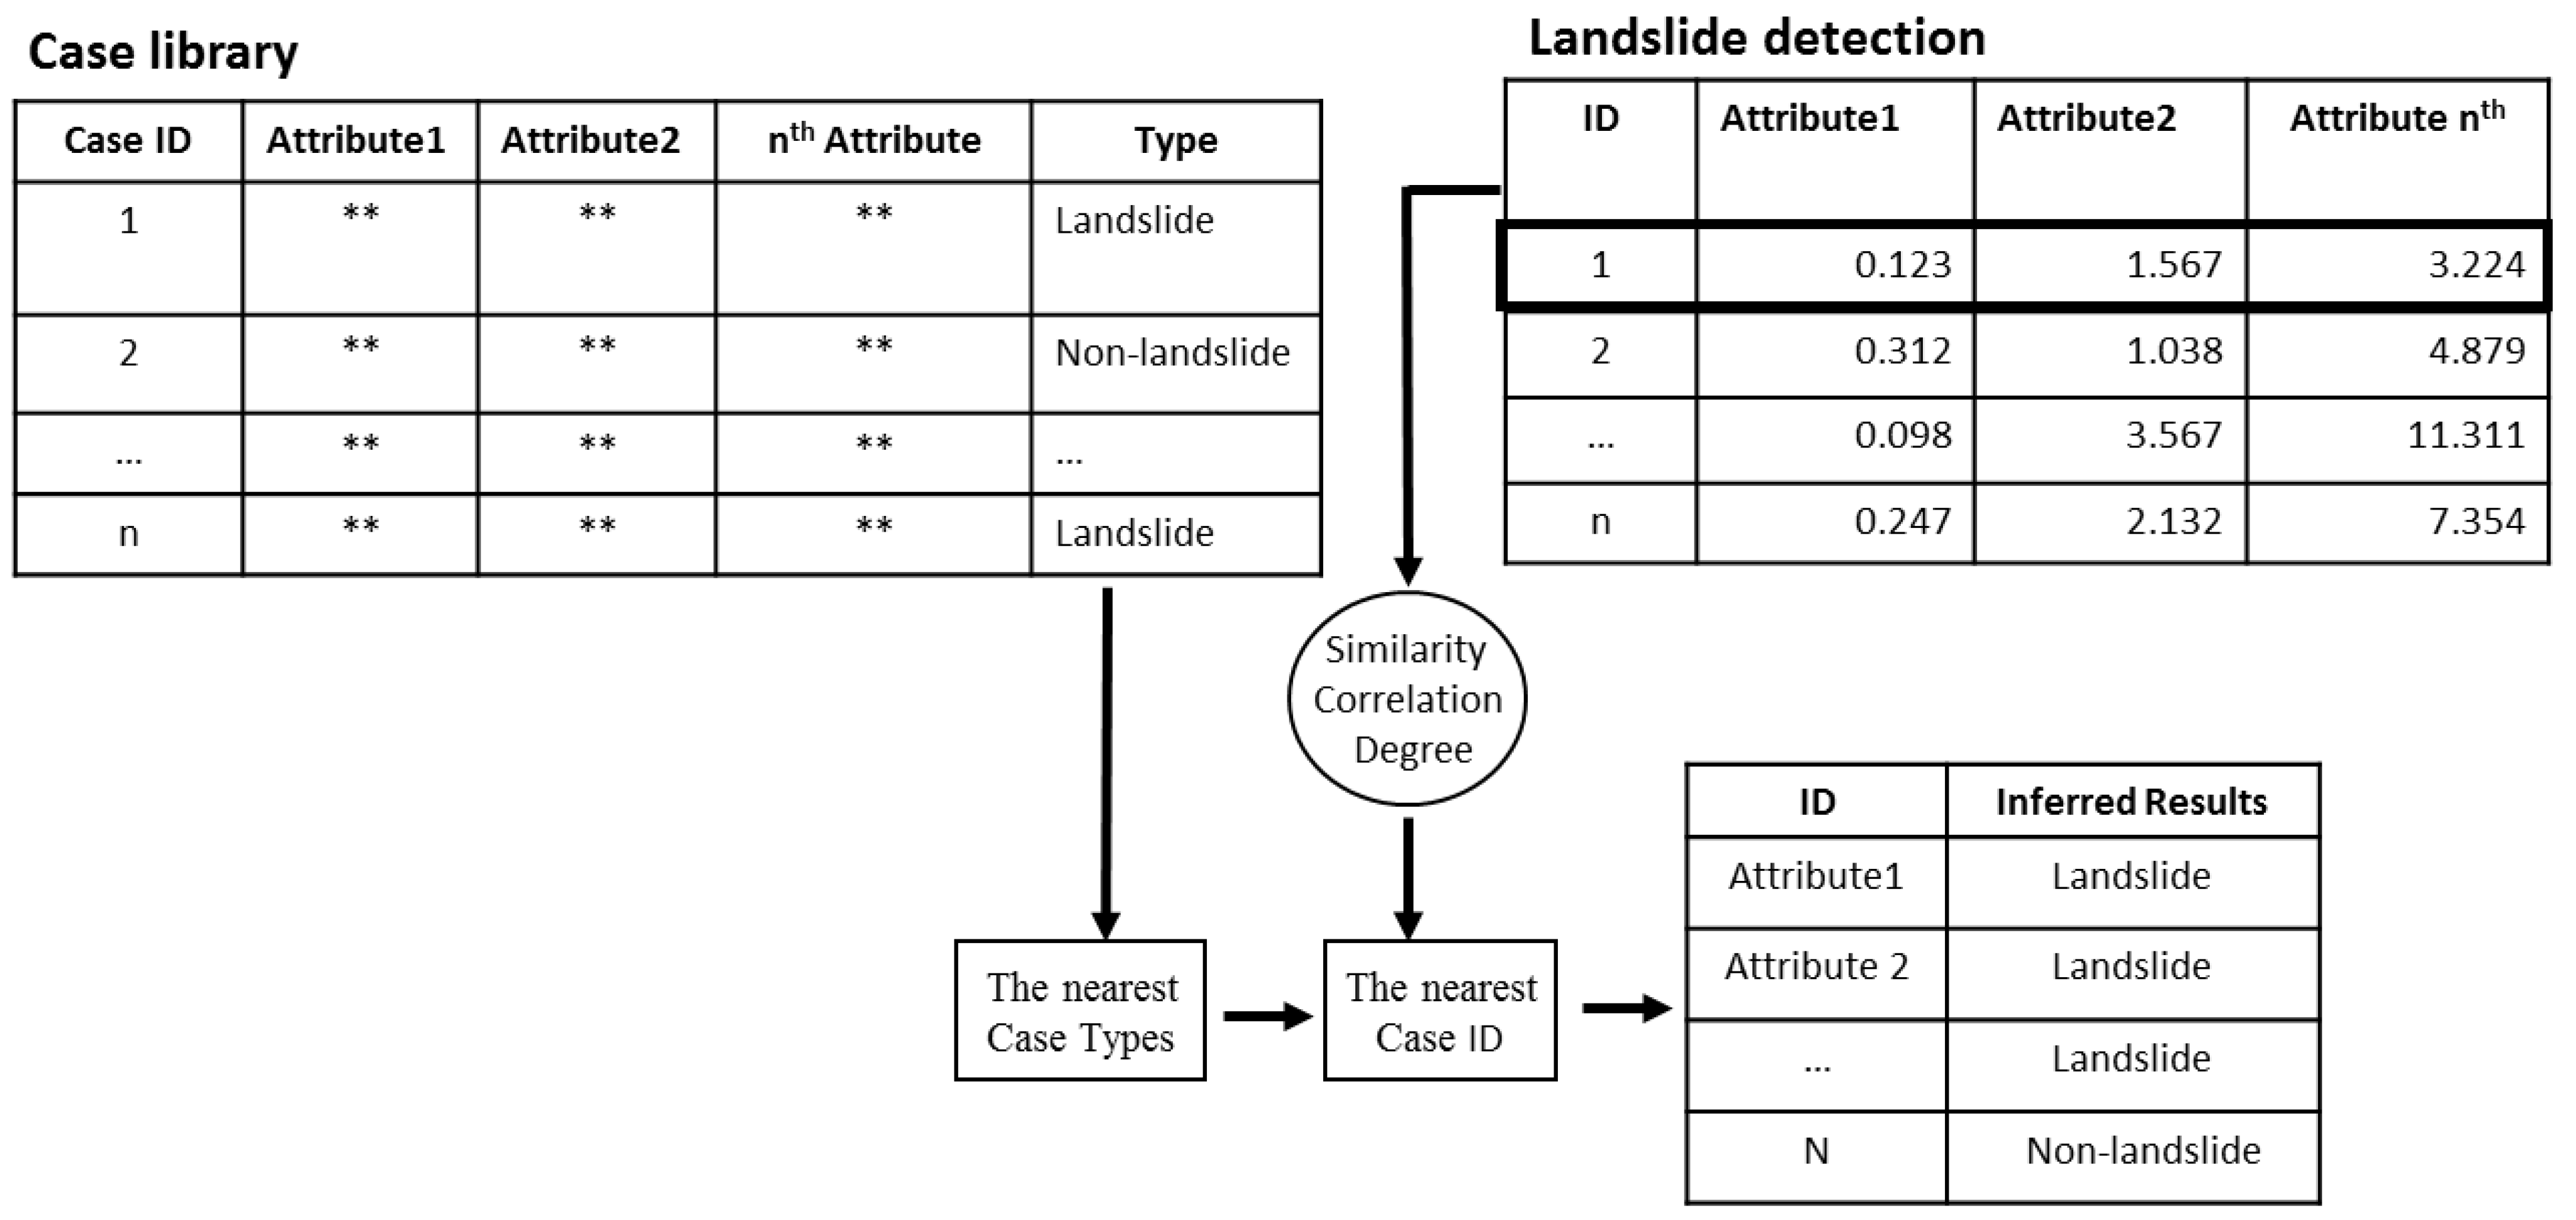
3.3. CBR for Landslide Detection


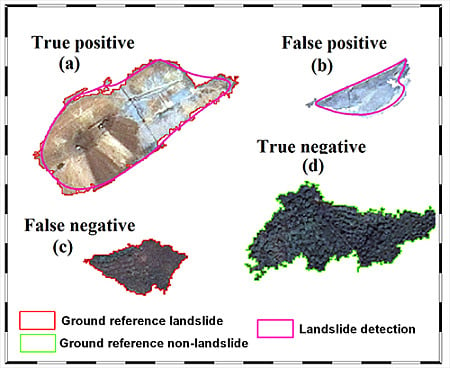
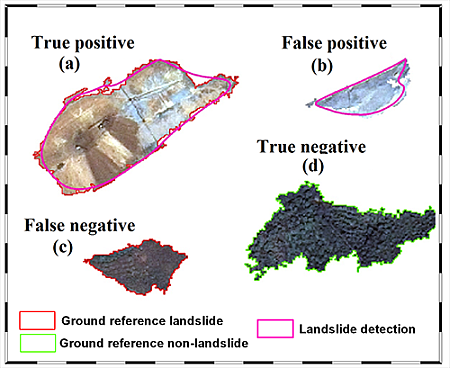
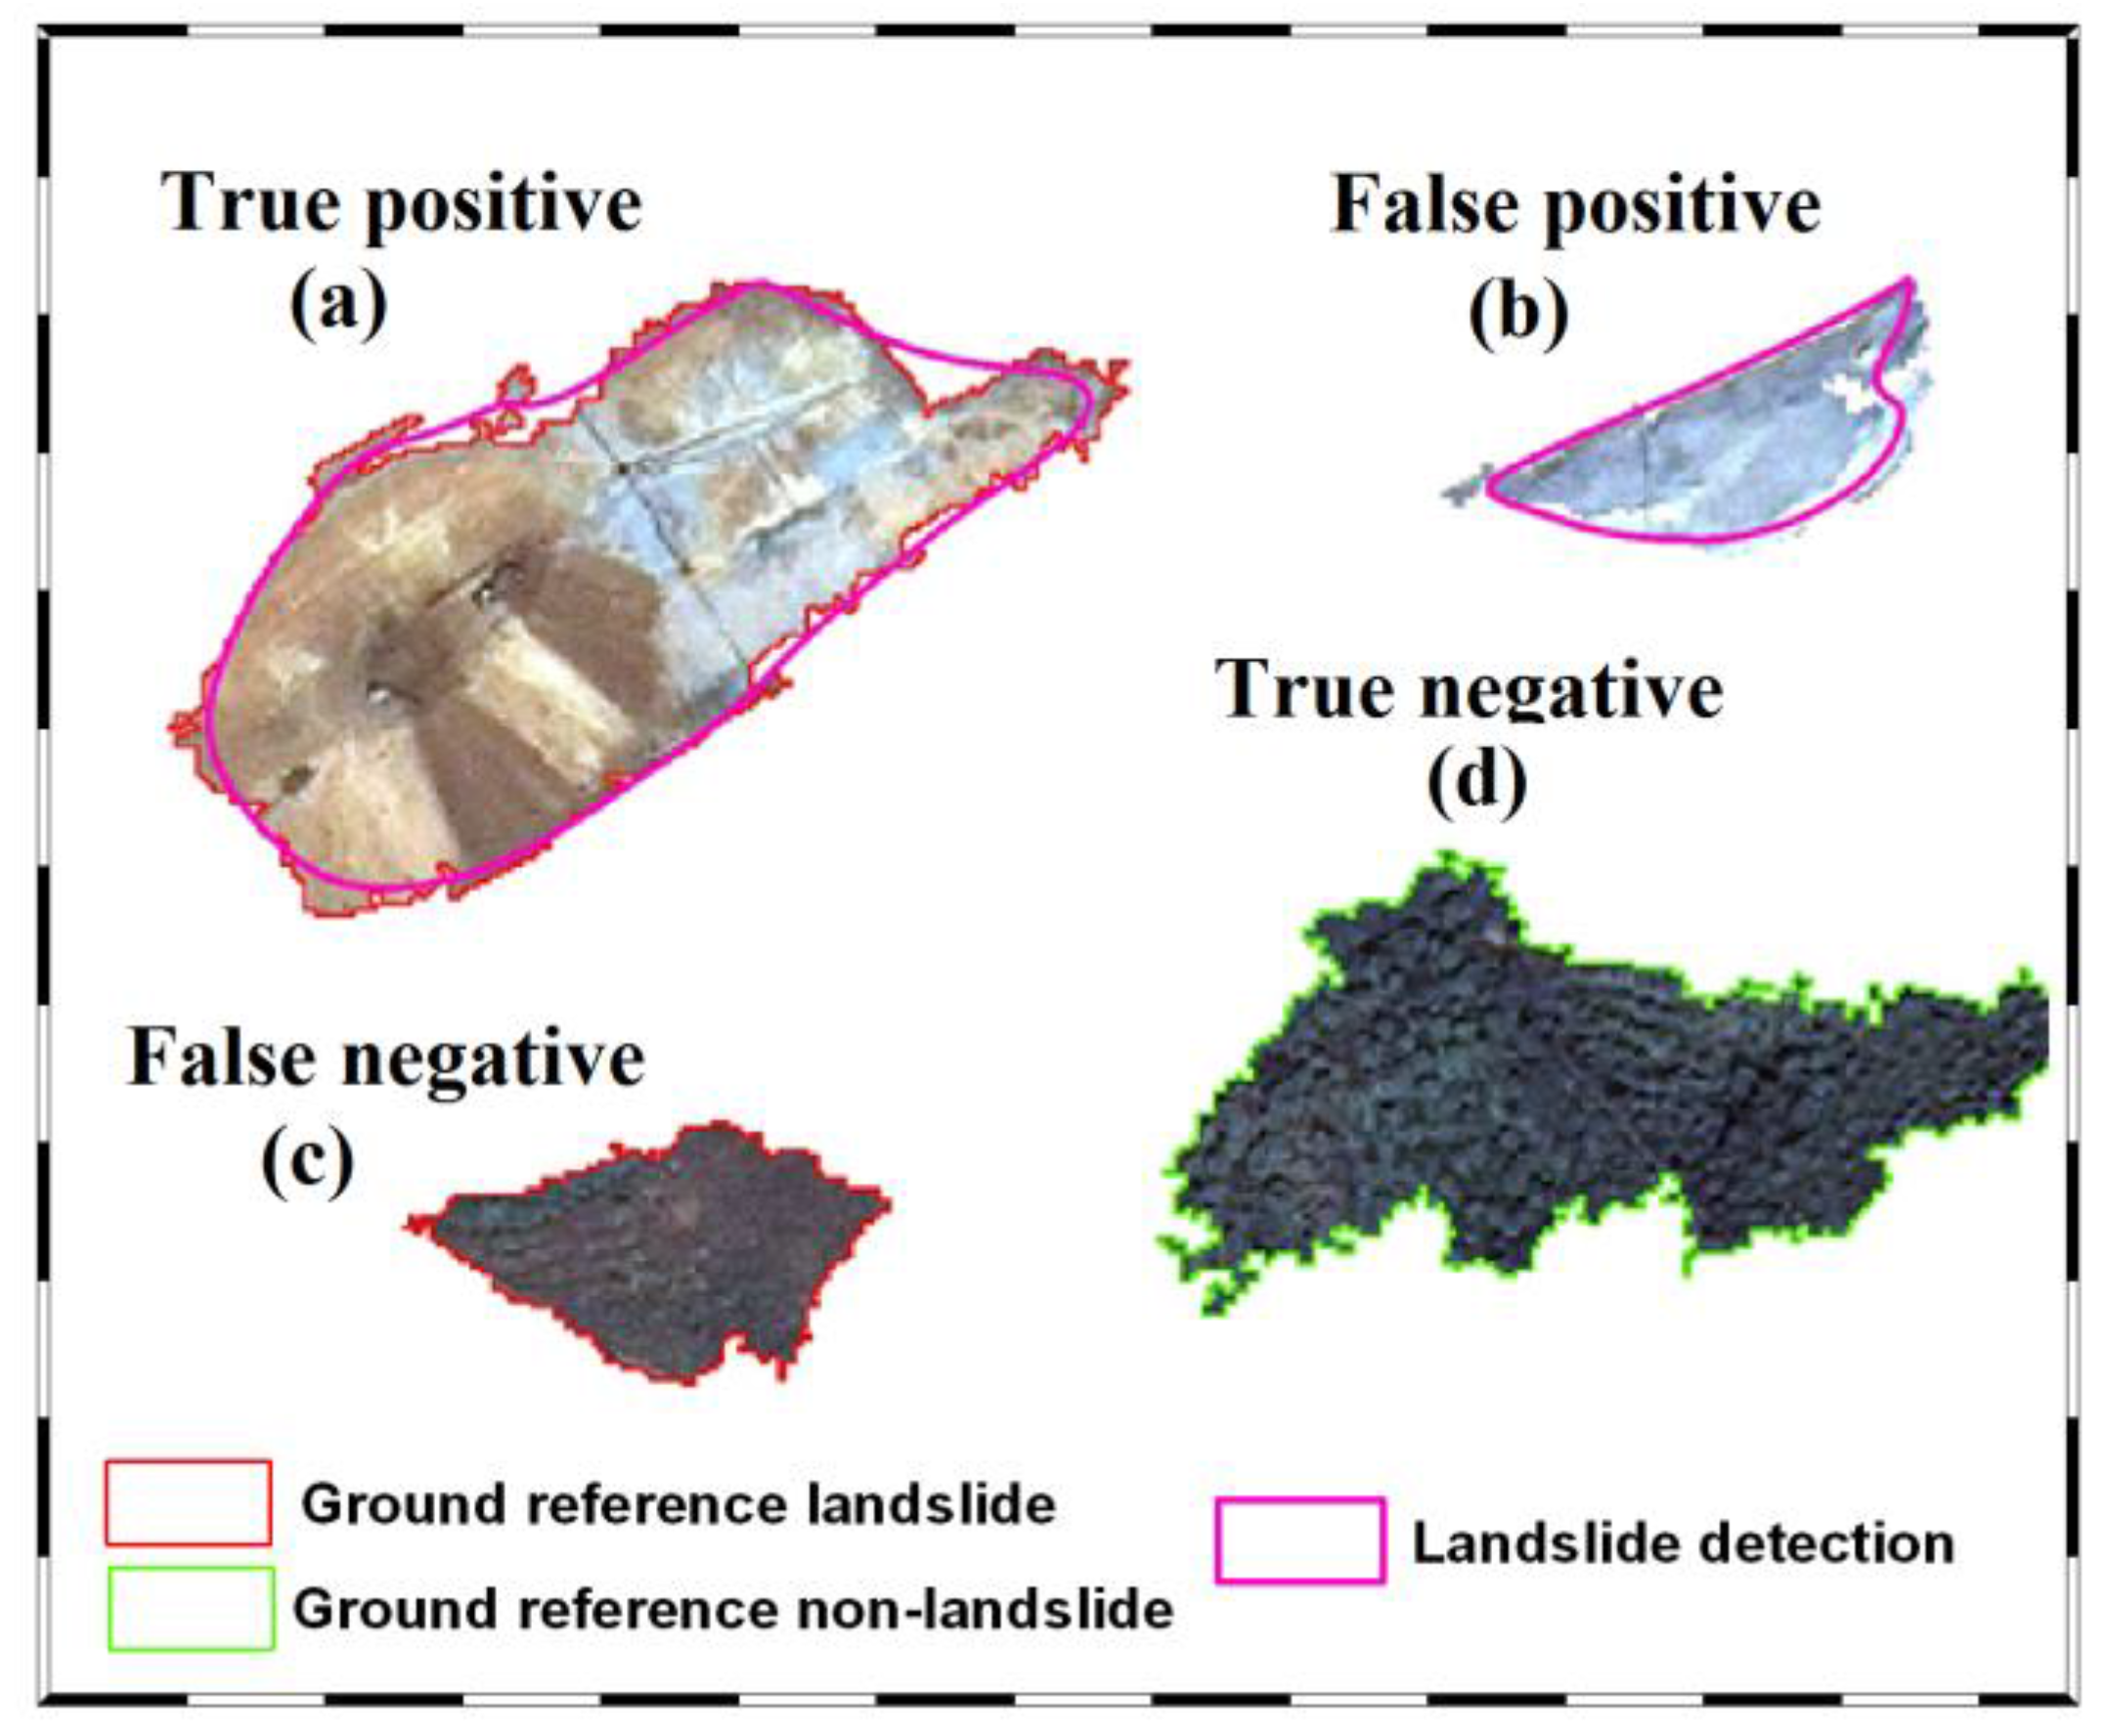
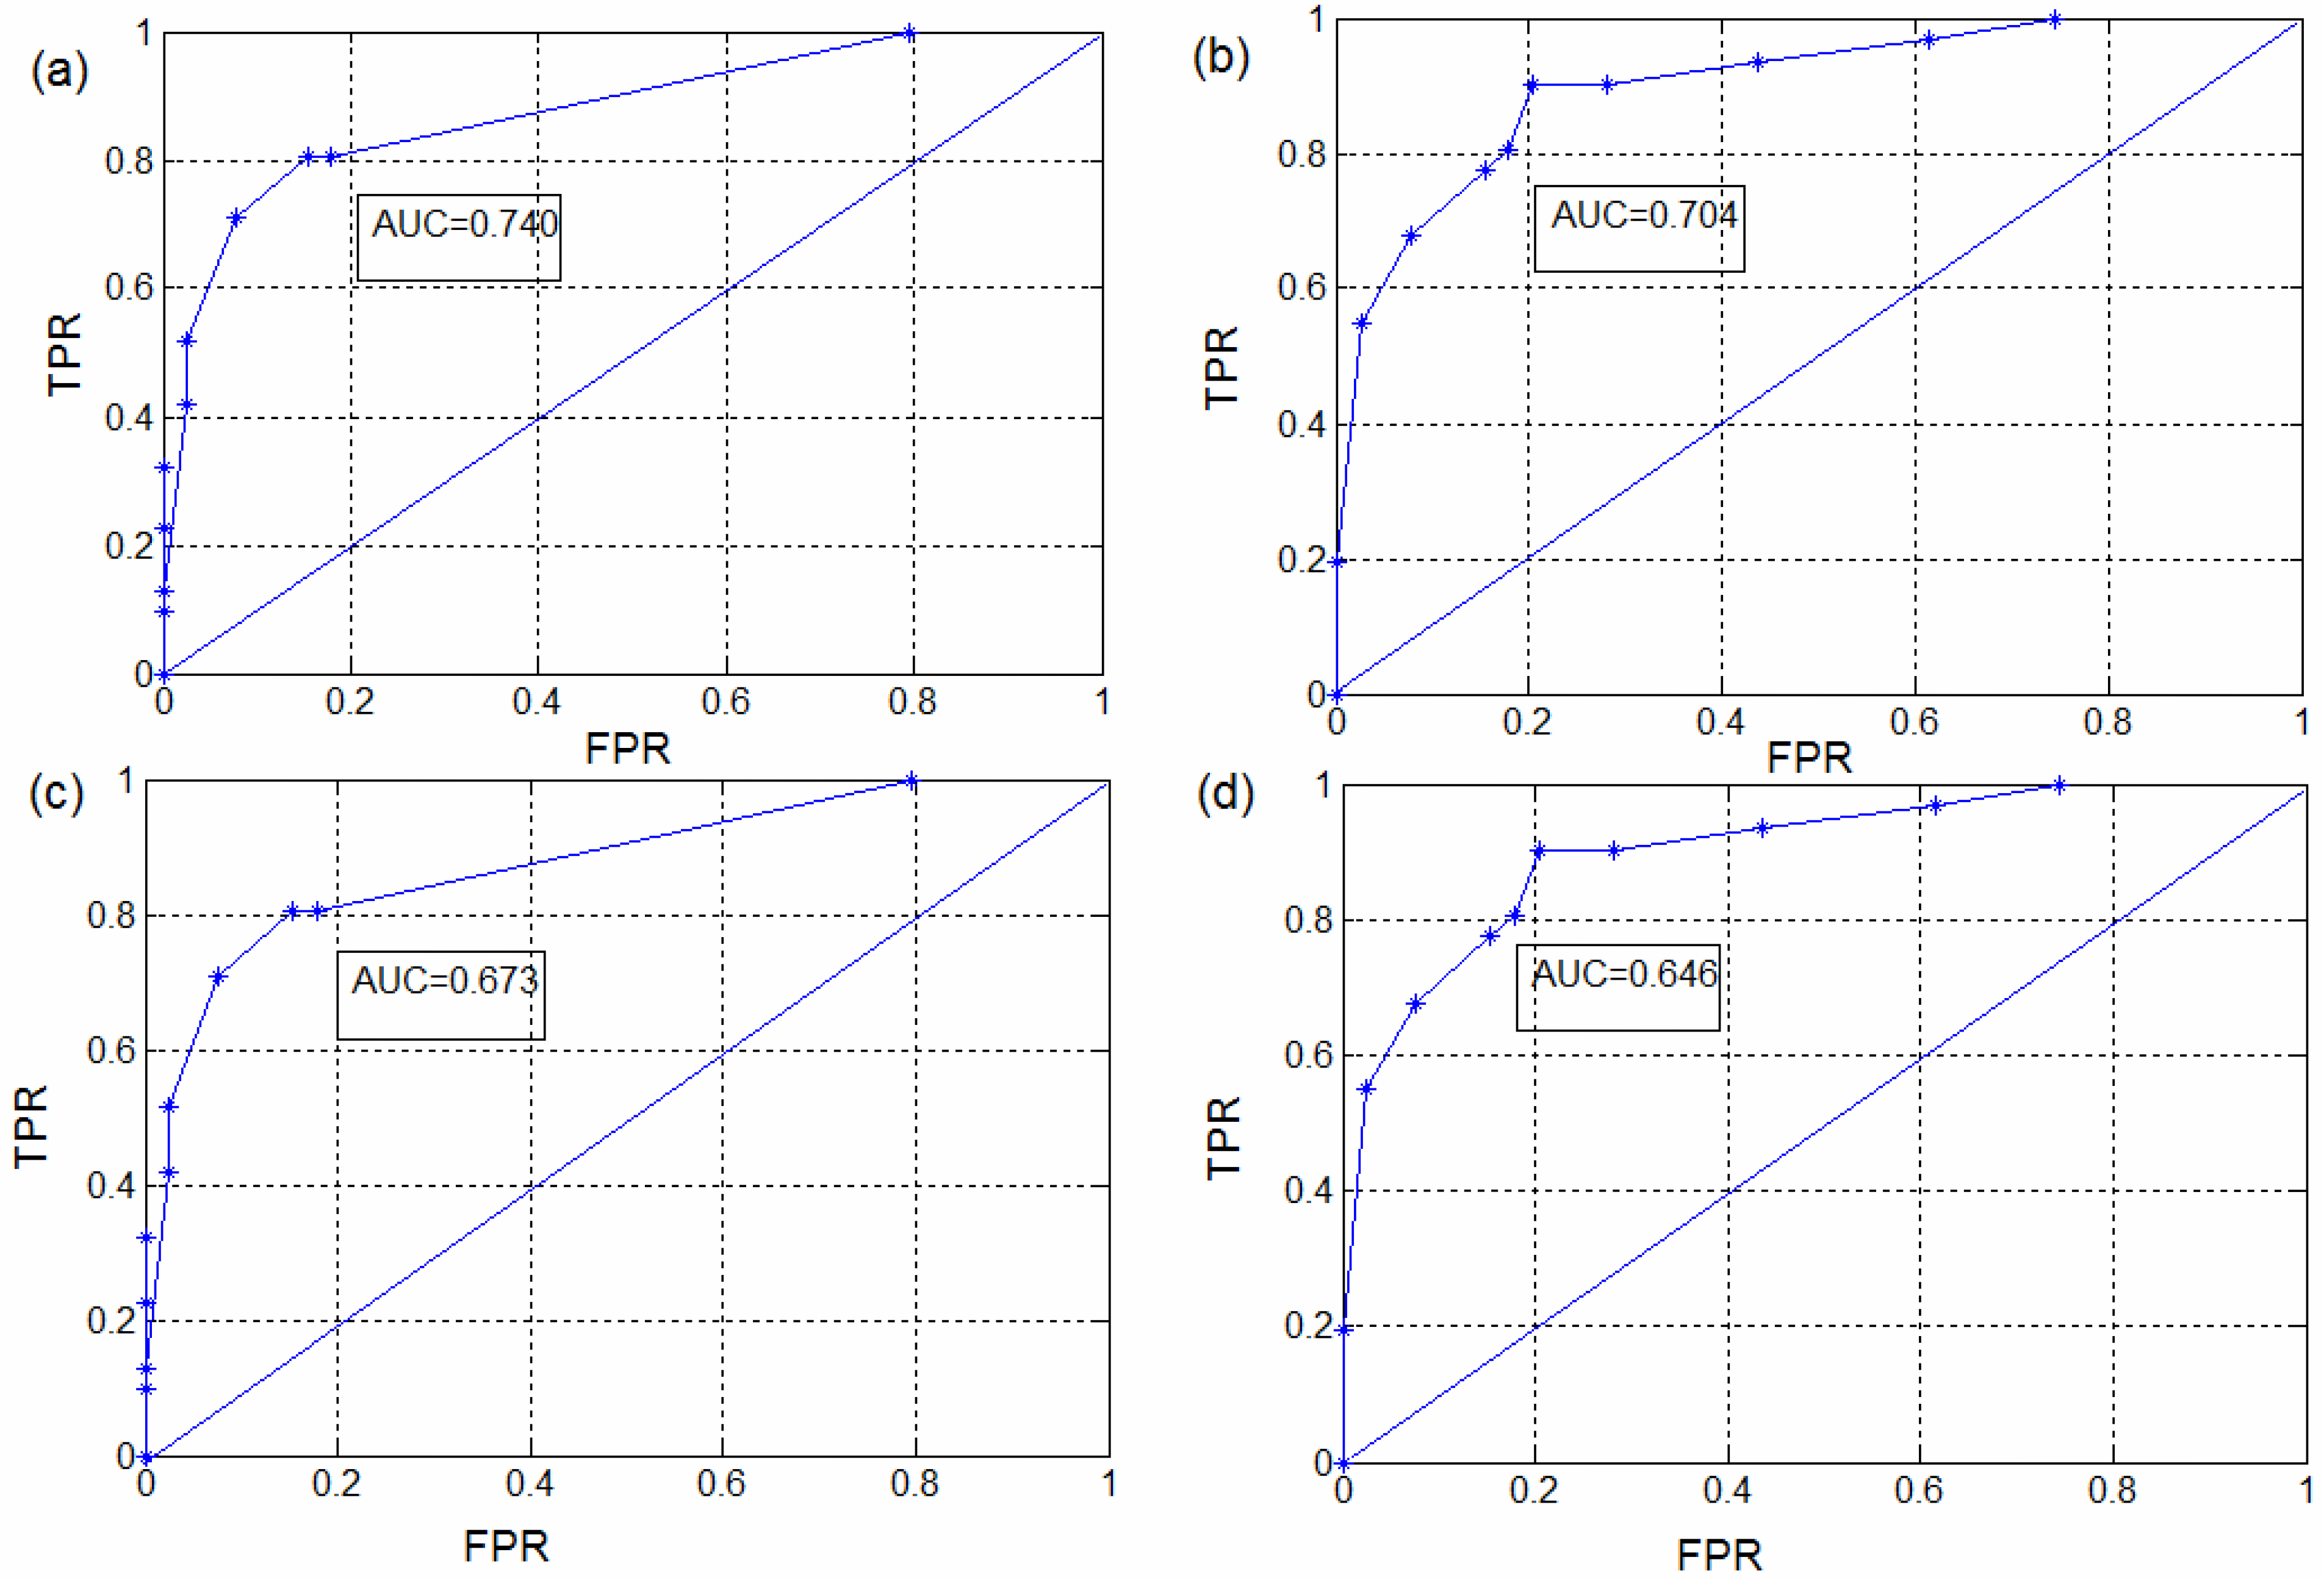
3.4. Accuracy Estimation and Validation

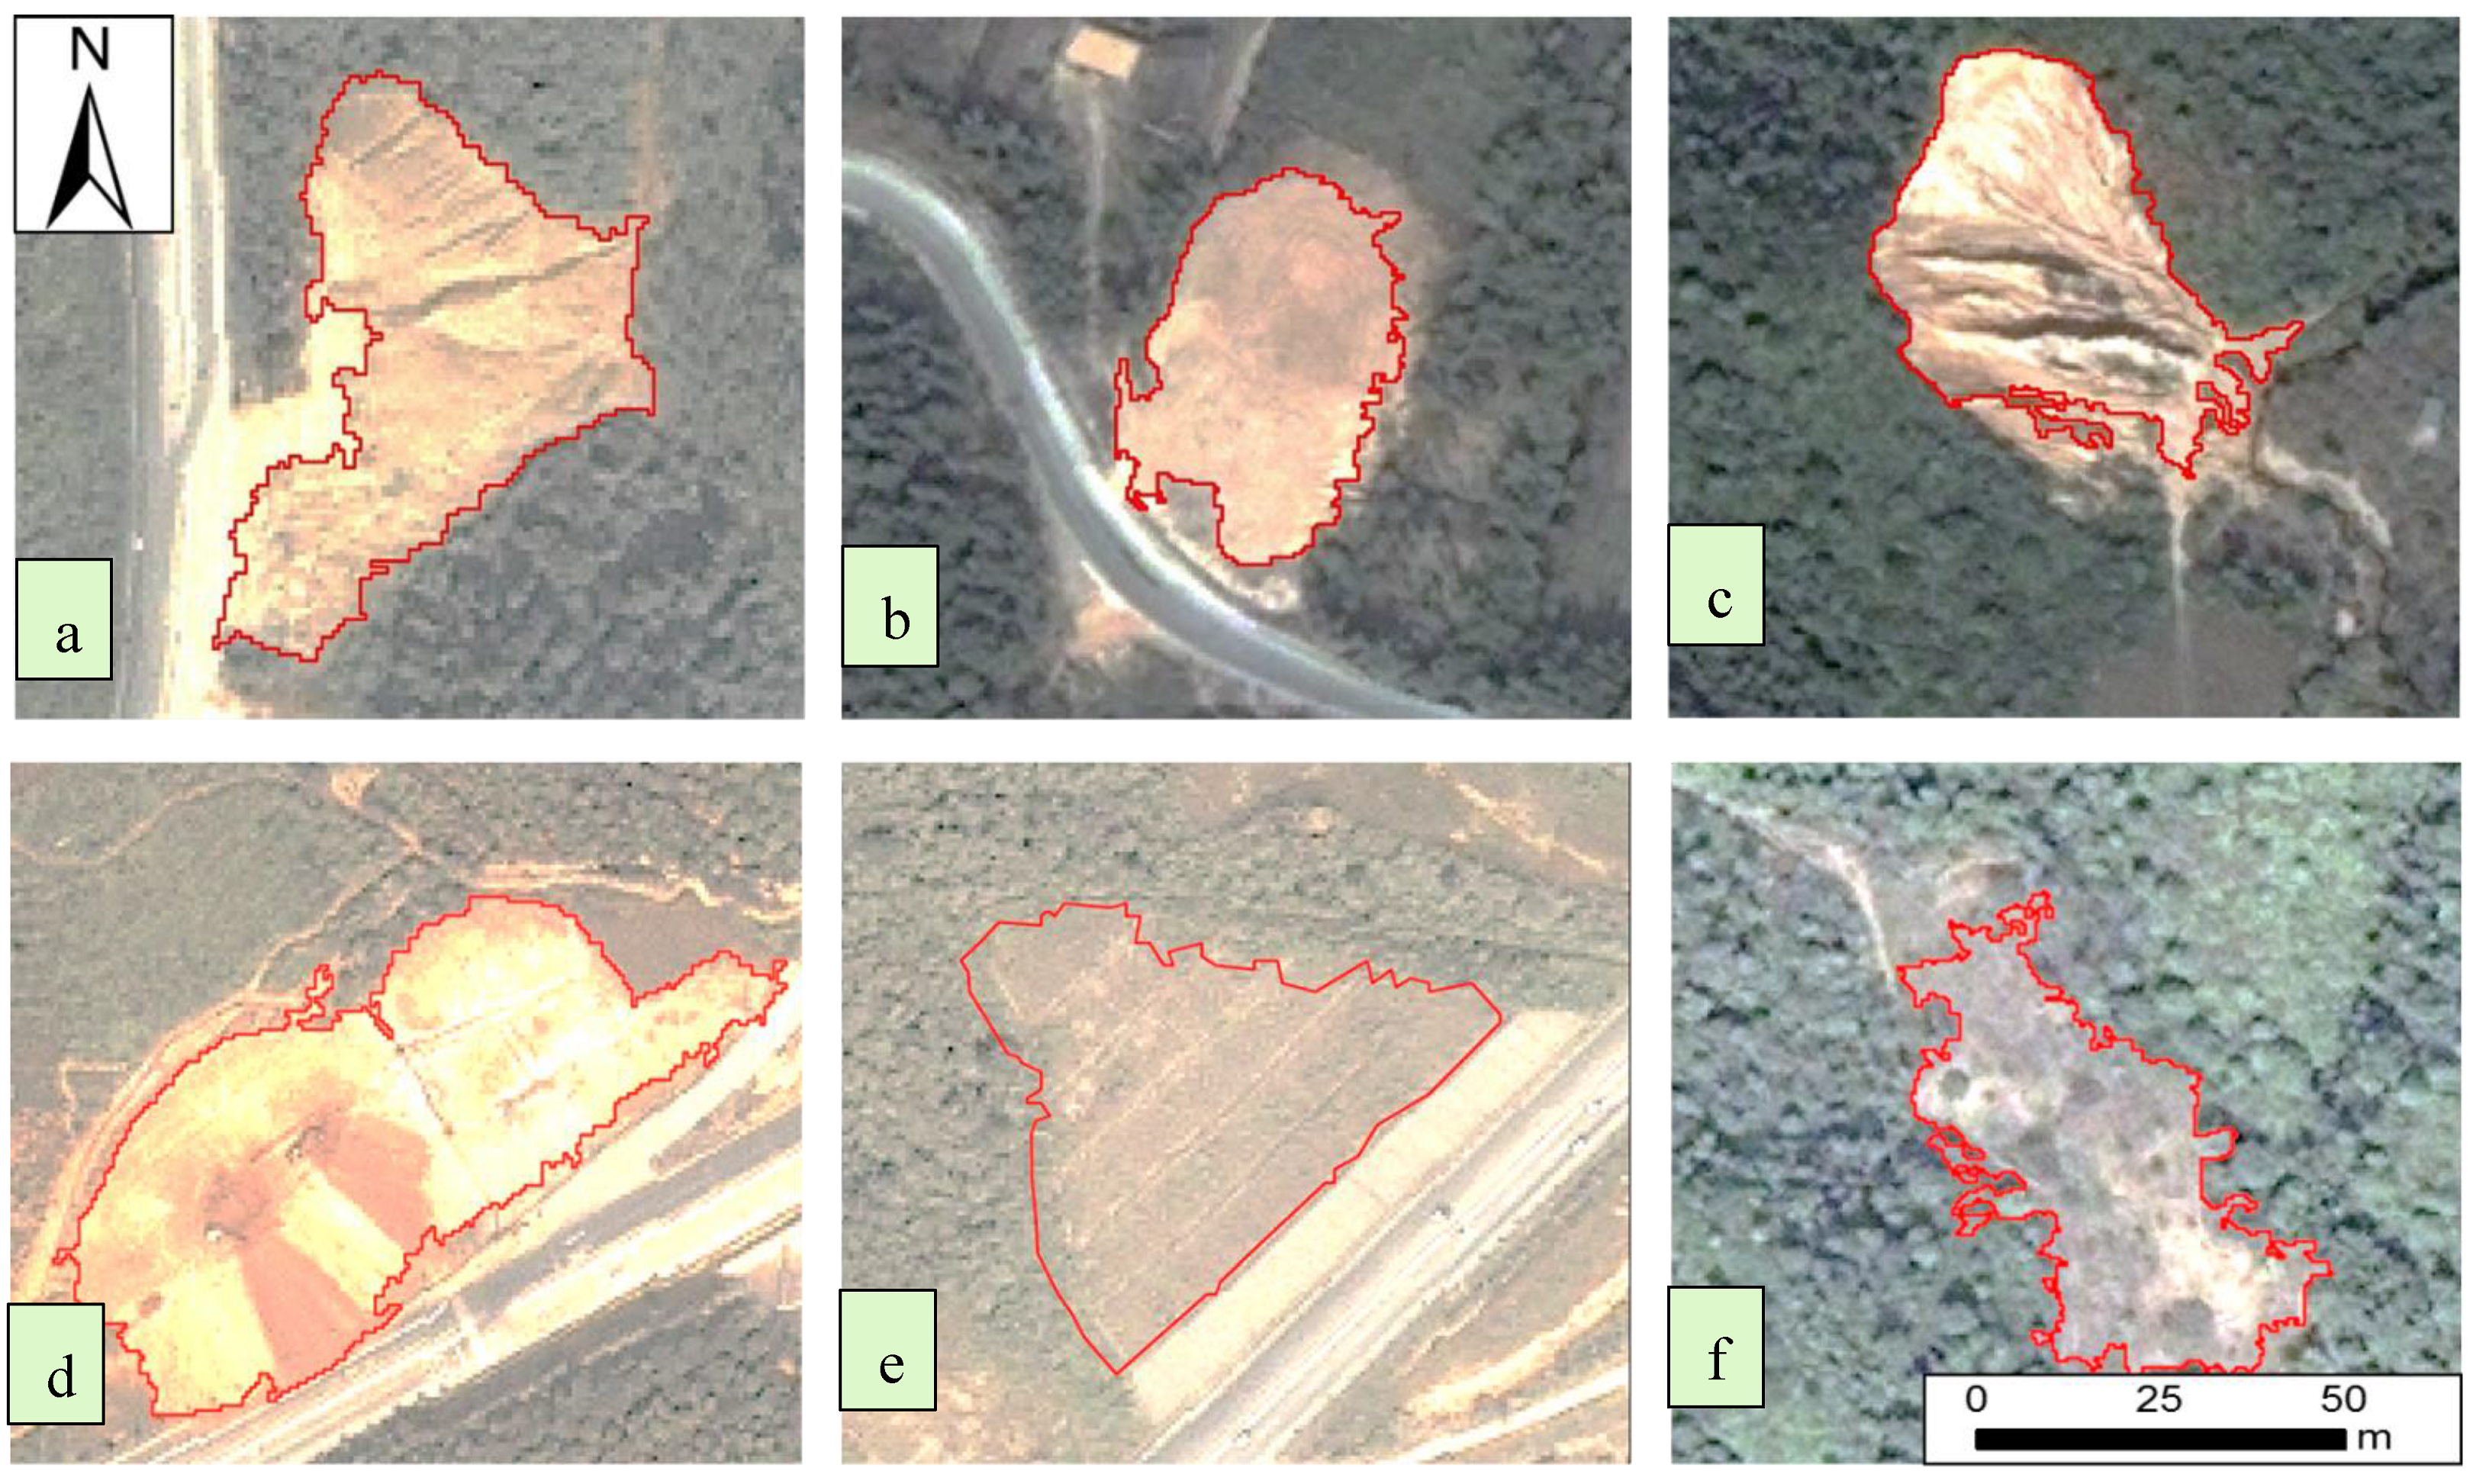
4. Application and Resultant Analysis
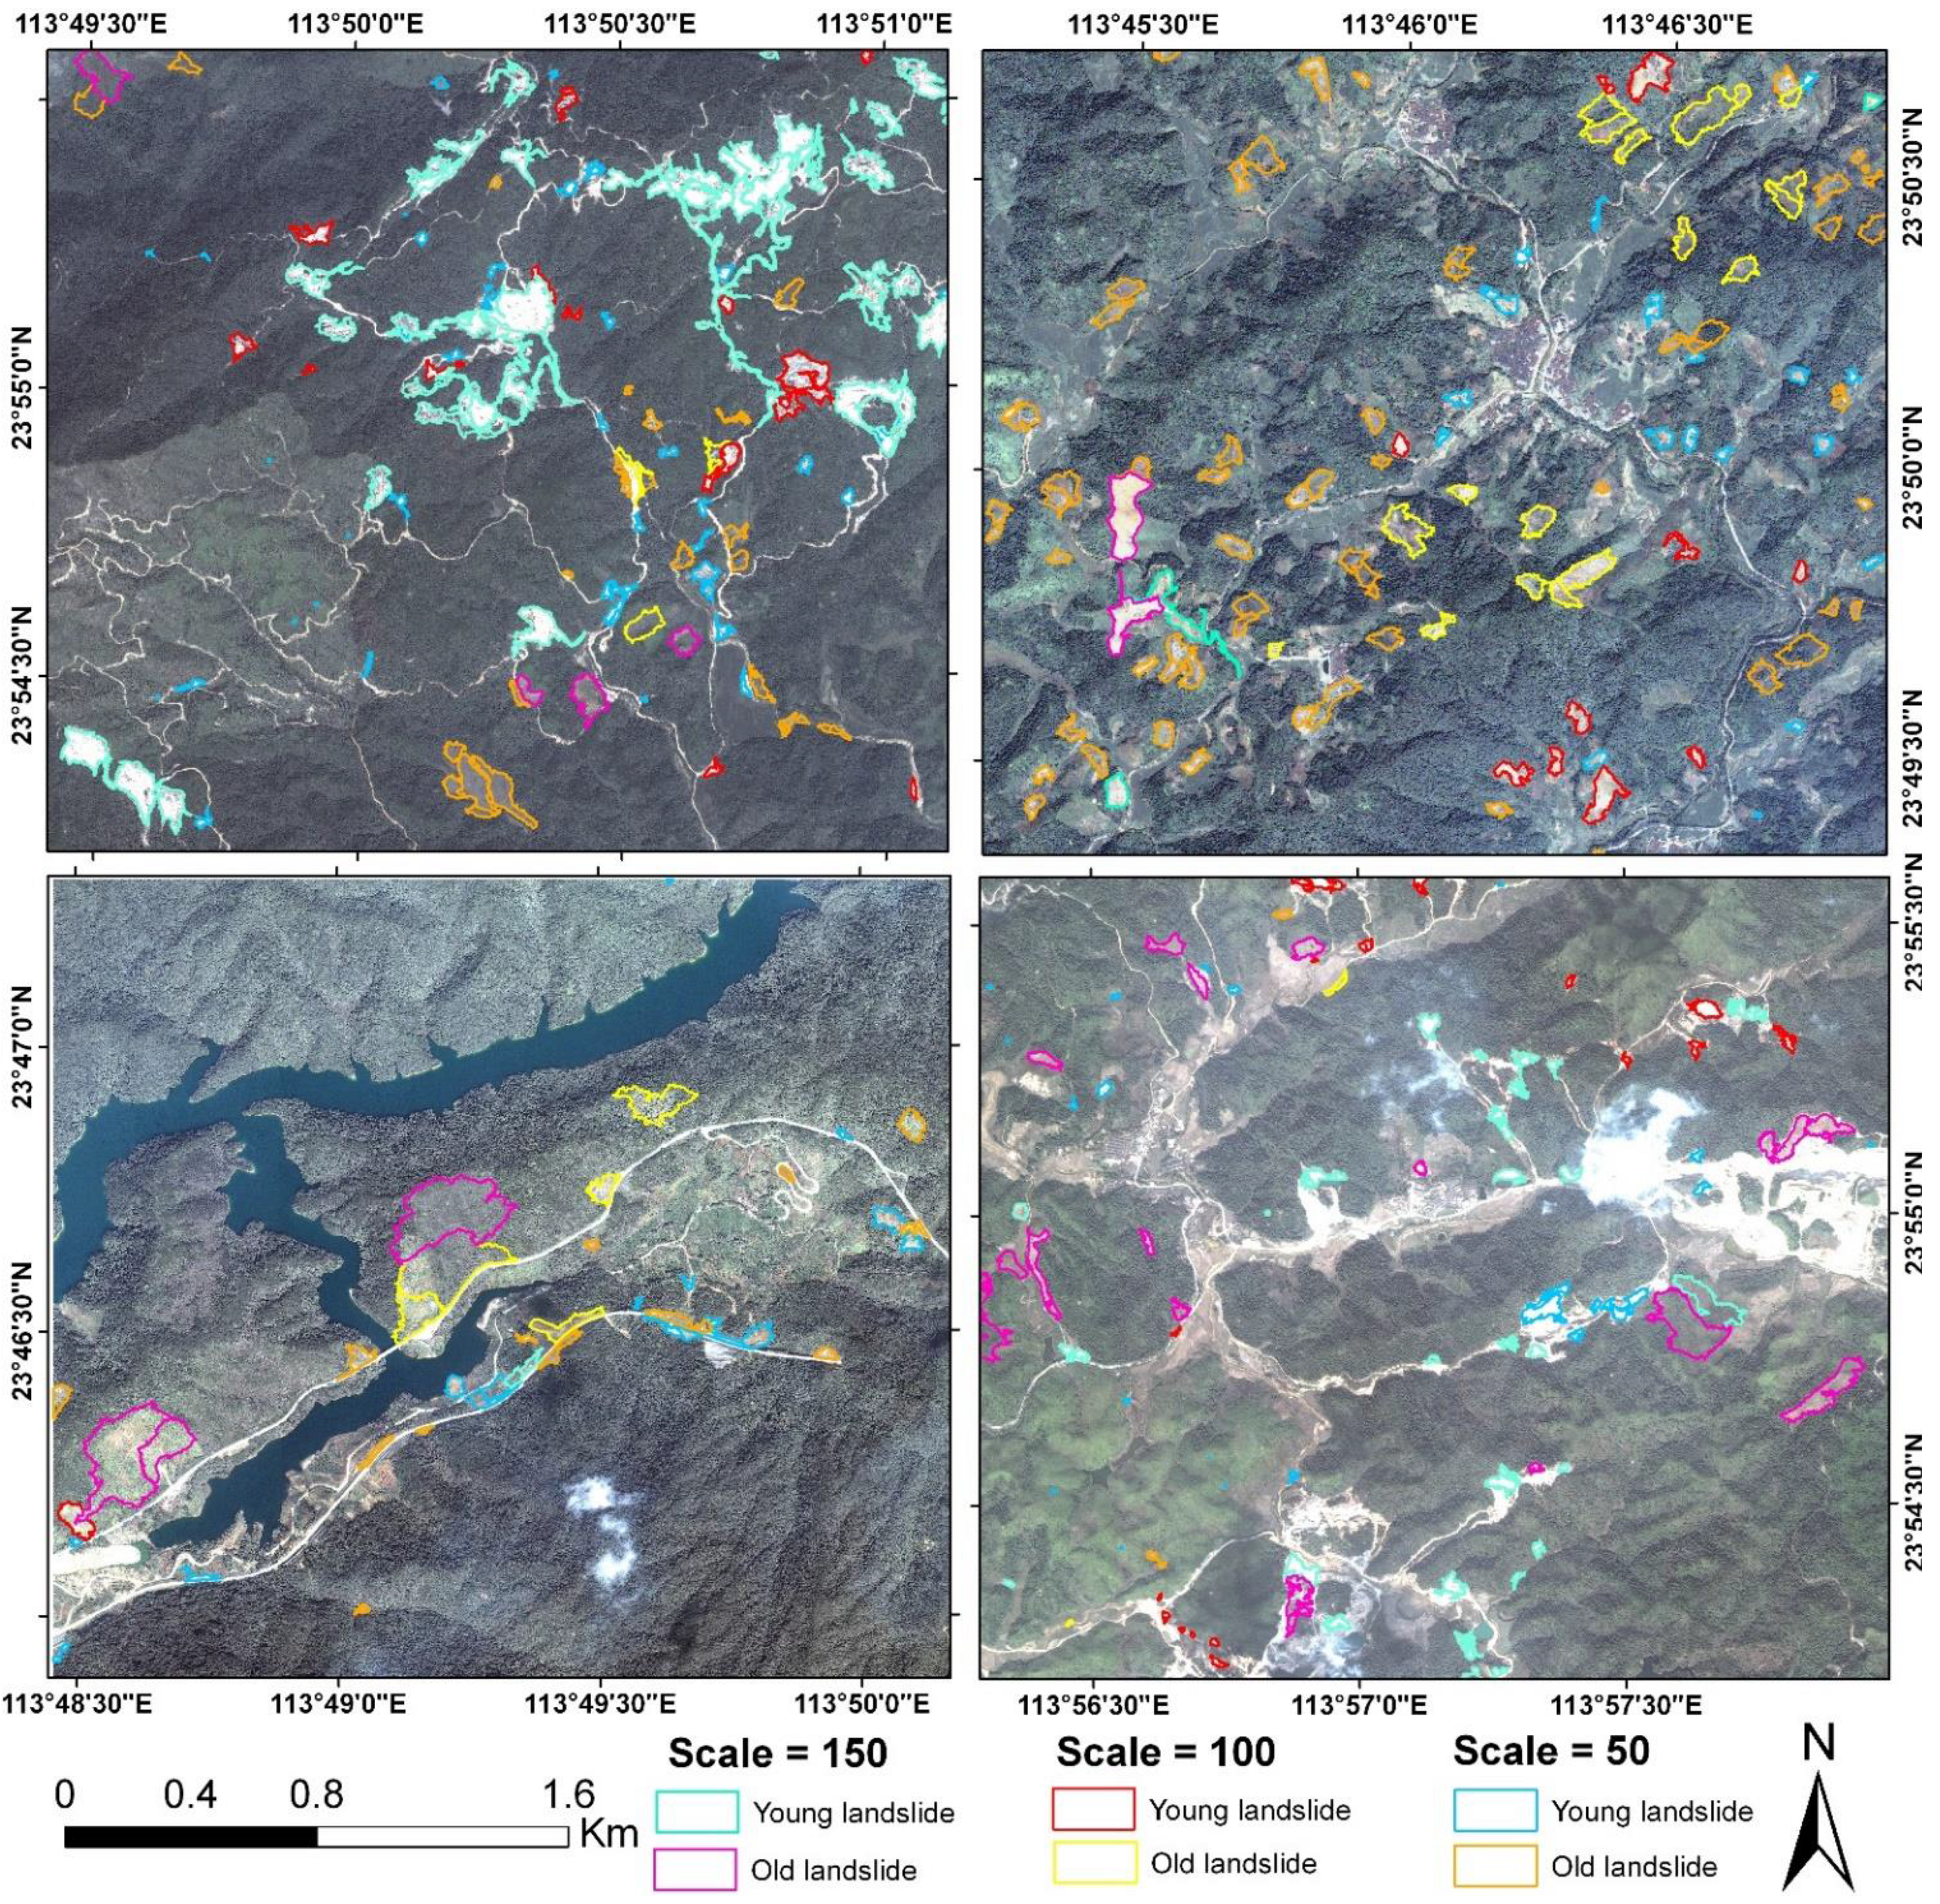
4.1. CBR-Based Multi-Scale Landslide Detection
| Code | Feature Factors | Depiction |
|---|---|---|
| 1 | Mean diff to neighbors | For each neighboring object, the layer mean difference is computed and weighted with regard to the length of the border between the objects. |
| 2 | Ratio to scene | Ratio to scene of Layer L is the Layer L mean value of an image object divided by the Layer L mean value of the whole scene. |
| 3 | Length/Width | In the feature “Length/width (only main line),” the length of an object is divided by its width. |
| 4 | GLCM Std Dev(all dir) | The grey level co-occurrence matrix the layer values of all n pixels forming an image object. Feature value range: [0; depending on bit depth of data]. |
| 5 | GLCM Homogeneity | If the image is locally homogenous, the value is high if GLCM is concentrated along the diagonal. |
| 6 | GLCM Dissimilarity | Texture measurement of the amount of local variation in the image objects by the grey level co-occurrence matrix (GLCM). It increases linearly and is high if the object has a high contrast. |
| 7 | GLDV Entropy (all dir) | The grey level difference vector the values are high if all elements have similar values. |
| 8 | GLCM Ang2nd moment | High if some elements are large and the remaining elements are small. |
| 9 | NDVI | Vegetation index, NDVI= (NIR − R)/(NIR+R), value range: [−1, 1]. |
| 10 | Elevation | Elevation affects the distribution of vegetation and landslides typically occur at comparatively high elevation. |
| 11 | Slope | Slope = Raise/Run, [0, 90°], affects the stability of slope failure. |

4.2. Accuracy Assessment

| Accuracy | User’s Accuracy | Producer’s Accuracy | Omission Error | Commission Error | Overall Accuracy |
|---|---|---|---|---|---|
| Old landslide | 0.82 | 0.85 | 0.15 | 0.18 | 0.87 |
| Young landslide | 0.86 | 0.89 | 0.11 | 0.14 |

| Accuracy | User’s Accuracy | Producer’s Accuracy | Omission Error | Commission Error | Overall Accuracy |
|---|---|---|---|---|---|
| Old landslide | 0.82 | 0.85 | 0.15 | 0.18 | 0.75 |
| Young landslide | 0.86 | 0.89 | 0.11 | 0.14 |
| Accuracy | User’s Accuracy | Producer’s Accuracy | Omission Error | Commission Error | Overall Accuracy |
|---|---|---|---|---|---|
| Old landslide | 0.65 | 0.62 | 0.38 | 0.35 | 0.68 |
| Young landslide | 0.67 | 0.63 | 0.37 | 0.33 |
5. Discussion
6. Conclusions
Acknowledgments
Author Contributions
Conflicts of Interest
References
- Turner, A.K.; Schuster, R. Landslides: Investigation and Mitigation; Transportation Research Board: Washington, DC, USA, 1996. [Google Scholar]
- Alexander, D.E. A brief survey of GIS in mass-movement studies, with reflections on theory and methods. Geomorphology 2008, 94, 261–267. [Google Scholar] [CrossRef]
- García-Rodríguez, M.J.; Malpica, J.A.; Benito, B.; Díaz, M. Susceptibility assessment of earthquake-triggered landslides in El Salvador using logistic regression. Geomorphology 2008, 95, 172–191. [Google Scholar] [CrossRef]
- Guzzetti, F.; Mondini, A.C.; Cardinali, M.; Fiorucci, F.; Santangelo, M.; Chang, K.-T. Landslide inventory maps: New tools for an old problem. Earth-Sci. Rev. 2012, 112, 42–66. [Google Scholar] [CrossRef]
- Wang, L.-J.; Sawada, K.; Moriguchi, S. Landslide-susceptibility analysis using light detection and ranging-derived digital elevation models and logistic regression models: A case study in Mizunami City, Japan. J. Appl. Remote Sens. 2013, 7, 073561. [Google Scholar] [CrossRef]
- Assilzadeh, H.; Levy, J.K.; Wang, X. Landslide catastrophes and disaster risk reduction: A GIS framework for landslide prevention and management. Remote Sens. 2010, 2, 2259–2273. [Google Scholar] [CrossRef]
- Dou, J.; Oguchi, T.; Hayakawa, Y.S.Y.; Uchiyama, S.; Saito, H.; Paudel, U. GIS-based landslide susceptibility mapping using a certainty factor model and its validation in the Chuetsu Area, Central Japan. In Landslide Science for a Safer Geoenvironment; Springer International Publishing: Berlin, Germany, 2014; pp. 419–424. [Google Scholar]
- Wu, Q.; Zhang, H.; Chen, F.; Dou, J. A web-based spatial decision support system for spatial planning and governance in the Guangdong Province. In Proceedings of the 2008 Geoinformatics and Joint Conference on GIS and Built Environment, Guangzhou, China, 28–29June 2008; Volume 7144, p. 12.
- Zhou, S.; Fang, L. Support vector machine modeling of earthquake-induced landslides susceptibility in central part of Sichuan province, China. Geoenviron. Disasters 2015, 2, 1–12. [Google Scholar] [CrossRef]
- Lu, P.; Stumpf, A.; Kerle, N.; Casagli, N. Object-oriented change detection for landslide rapid mapping. IEEE Geosci. Remote Sens. Lett. 2011, 8, 701–705. [Google Scholar] [CrossRef]
- McKean, J.; Roering, J. Objective landslide detection and surface morphology mapping using high-resolution airborne laser altimetry. Geomorphology 2004, 57, 331–351. [Google Scholar] [CrossRef]
- Dou, J.; Qian, J.; Zhang, H.; Chen, S.; Zheng, X.; Zhu, J.; Xie, Z.; Zou, Y. Landslides detection: A case study in Conghua city of Pearl River delta. In Proceedings of the Second International Conference on Earth Observation for Global Changes, Chengdu, China, 25–29 May 2009; p. 11.
- Myint, S.W.; Gober, P.; Brazel, A.; Grossman-Clarke, S.; Weng, Q. Per-pixel vs. object-based classification of urban land cover extraction using high spatial resolution imagery. Remote Sens. Environ. 2011, 115, 1145–1161. [Google Scholar] [CrossRef]
- Li, X.; Yeh, A.G. Multitemporal SAR images for monitoring cultivation systems using case-based reasoning. Remote Sens. Environ. 2004, 90, 524–534. [Google Scholar] [CrossRef]
- Dou, J.; Zheng, X.; Qian, J.; Liu, R.; Wu, Q. Intelligence based automatic detection and classification of ground collapses using object-based image analysis method: A case study in Paitan of Pearl River delta. Proc. SPIE. 2008. [Google Scholar] [CrossRef]
- Dou, J.; Zheng, X.; Qian, J.J.; Liu, R.; Wu, Q.; Chen, S.; Zhen, X. Object-based and case-based reasoning method for ground collapses detection. J. Image Graph. 2010, 15, 900–910. [Google Scholar]
- Anders, N.S.; Seijmonsbergen, A.C.; Bouten, W. Segmentation optimization and stratified object-based analysis for semi-automated geomorphological mapping. Remote Sens. Environ. 2011, 115, 2976–2985. [Google Scholar] [CrossRef]
- Chang, K.-T.; Liu, J.; Wang, C. An object-oriented analysis for characterizing the rainfall-induced shallow landslide. J. Mar. Sci. Technol. 2012, 20, 647–656. [Google Scholar]
- Qian, J.; Liu, R.; Chen, S.; Dou, J. Man-made ground collapse detection using high resolution Aerial image and object-based classification: Example of Pearl River Delta. In Proceedings of the Second International ISCRAM Workshop on Information Systems for Crisis Response and Management, Harbin, China, 26–27 August 2007; pp. 1–6.
- Martha, T.R.; Kerle, N.; Jetten, V.; van Westen, C.J.; Kumar, K.V. Characterising spectral, spatial and morphometric properties of landslides for semi-automatic detection using object-oriented methods. Geomorphology 2010, 116, 24–36. [Google Scholar] [CrossRef]
- Yang, M. A genetic algorithm (GA) based automated classifier for remote sensing imagery. Can. J. Remote Sens. 2007, 33, 203–213. [Google Scholar] [CrossRef]
- Vancoillie, F.; Verbeke, L.; Dewulf, R. Feature selection by genetic algorithms in object-based classification of IKONOS imagery for forest mapping in Flanders, Belgium. Remote Sens. Environ. 2007, 110, 476–487. [Google Scholar] [CrossRef]
- Minor, M.; Bergmann, R.; Görg, S. Case-based adaptation of workflows. Inf. Syst. 2014, 40, 142–152. [Google Scholar] [CrossRef]
- Ahn, H.; Kim, K.; Han, I. Hybrid genetic algorithms and case-based reasoning systems for customer classification. Expert Syst. 2006, 23, 127–144. [Google Scholar] [CrossRef]
- Du, Y.; Wu, D.; Liang, F.; Li, C. GIScience & Remote Sensing integration of case-based reasoning and object-based image classification to classify SPOT images: A case study of aquaculture land use mapping in coastal areas of Guangdong province, China. GISci. Remote Sens. 2013, 50, 574–589. [Google Scholar]
- Varnes, D.J. Slope movement types and processes. Natl. Acad. Sci. Transp. Res. Board Spec. Rep. 1978, 176, 12–33. [Google Scholar]
- Baatz, M.; Benz, U.; Dehghani, S.; Heynen, M. ECognition User Guide_4.0; Definiens Imagine GmbH: Munich, Germany, 2004. [Google Scholar]
- Benz, U.C.; Hofmann, P.; Willhauck, G.; Lingenfelder, I.; Heynen, M. Multi-resolution, object-oriented fuzzy analysis of remote sensing data for GIS-ready information. ISPRS J. Photogramm. Remote Sens. 2004, 58, 239–258. [Google Scholar] [CrossRef]
- Drǎguţ, L.; Tiede, D.; Levick, S.R. ESP: A tool to estimate scale parameter for multiresolution image segmentation of remotely sensed data. Int. J. Geogr. Inf. Sci. 2010, 24, 859–871. [Google Scholar] [CrossRef]
- Goldberg, D.E. Genetic Algorithms in Search, Optimization, and Machine Learning; Addison-Wesley: Boston, MA, USA, 1989; p. 432. [Google Scholar]
- Tang, A.M.; Quek, C.; Ng, G.S. GA-TSKfnn: Parameters tuning of fuzzy neural network using genetic algorithms. Expert Syst. Appl. 2005, 29, 769–781. [Google Scholar] [CrossRef]
- Iovine, G.; D’Ambrosio, D.; Di Gregorio, S. Applying genetic algorithms for calibrating a hexagonal cellular automata model for the simulation of debris flows characterised by strong inertial effects. Geomorphology 2005, 66, 287–303. [Google Scholar] [CrossRef]
- Kudo, M.; Sklansky, J. Comparison of algorithms that select features for pattern classifiers. Pattern Recognit. 2000, 33, 25–41. [Google Scholar] [CrossRef]
- Aamodt, A.; Plaza, E. Case-based reasoning: Foundational issues, methodological variations, and system approaches. AI Commun. 1994, 7, 39–59. [Google Scholar]
- Jonassen, D.H.; Hernandez-Serrano, J. Case-based reasoning and instructional design: Using stories to support problem solving. Educ. Technol. Res. Dev. 2002, 50, 65–77. [Google Scholar] [CrossRef]
- Deng, J.-L. Control problems of grey systems. Syst. Control Lett. 1982, 1, 288–294. [Google Scholar] [CrossRef]
- Matlab and Statistics Toolbox, Computer software. The MathWorks Inc.: Natick, MA, USA, 2010.
- Radoux, J.; Bogaert, P. Accounting for the area of polygon sampling units for the prediction of primary accuracy assessment indices. Remote Sens. Environ. 2014, 142, 9–19. [Google Scholar] [CrossRef]
- Congalton, R.G. A review of assessing the accuracy of classifications of remotely sensed data. Remote Sens. Environ. 1991, 37, 35–46. [Google Scholar] [CrossRef]
- Yang, W.; Wang, M.; Shi, P. Using MODIS NDVI time series to identify geographic patterns of landslides in vegetated regions. IEEE Geosci. Remote Sens. Lett. 2013, 10, 707–710. [Google Scholar] [CrossRef]
- Pontius, R.G.; Millones, M. Death to Kappa: Birth of quantity disagreement and allocation disagreement for accuracy assessment. Int. J. Remote Sens. 2011, 32, 4407–4429. [Google Scholar] [CrossRef]
- Mondini, A.C.C.; Guzzetti, F.; Reichenbach, P.; Rossi, M.; Cardinali, M.; Ardizzone, F. Semi-automatic recognition and mapping of rainfall induced shallow landslides using optical satellite images. Remote Sens. Environ. 2011, 115, 1743–1757. [Google Scholar] [CrossRef]
- Swets, J.A. Measuring the accuracy of diagnostic systems. Science 1988, 240, 1285–1293. [Google Scholar] [CrossRef] [PubMed]
- Fawcett, T. An introduction to ROC analysis. Pattern Recognit. Lett. 2006, 27, 861–874. [Google Scholar] [CrossRef]
- Van den Eeckhaut, M.; Marre, A.; Poesen, J. Comparison of two landslide susceptibility assessments in the Champagne-Ardenne region (France). Geomorphology 2010, 115, 141–155. [Google Scholar] [CrossRef]
- Nichol, J.; Wong, M.S. Satellite remote sensing for detailed landslide inventories using change detection and image fusion. Int. J. Remote Sens. 2005, 26, 1913–1926. [Google Scholar] [CrossRef]
- Blaschke, T.; Feizizadeh, B.; Daniel, H. Object-based image analysis and digital terrain analysis for locating landslides in the Urmia Lake Basin, Iran. IEEE J. Sel. Top. Appl. Earth Obs. Remote Sens. 2014, 7, 1–12. [Google Scholar] [CrossRef]
© 2015 by the authors; licensee MDPI, Basel, Switzerland. This article is an open access article distributed under the terms and conditions of the Creative Commons Attribution license (http://creativecommons.org/licenses/by/4.0/).
Share and Cite
Dou, J.; Chang, K.-T.; Chen, S.; Yunus, A.P.; Liu, J.-K.; Xia, H.; Zhu, Z. Automatic Case-Based Reasoning Approach for Landslide Detection: Integration of Object-Oriented Image Analysis and a Genetic Algorithm. Remote Sens. 2015, 7, 4318-4342. https://doi.org/10.3390/rs70404318
Dou J, Chang K-T, Chen S, Yunus AP, Liu J-K, Xia H, Zhu Z. Automatic Case-Based Reasoning Approach for Landslide Detection: Integration of Object-Oriented Image Analysis and a Genetic Algorithm. Remote Sensing. 2015; 7(4):4318-4342. https://doi.org/10.3390/rs70404318
Chicago/Turabian StyleDou, Jie, Kuan-Tsung Chang, Shuisen Chen, Ali P. Yunus, Jin-King Liu, Huan Xia, and Zhongfan Zhu. 2015. "Automatic Case-Based Reasoning Approach for Landslide Detection: Integration of Object-Oriented Image Analysis and a Genetic Algorithm" Remote Sensing 7, no. 4: 4318-4342. https://doi.org/10.3390/rs70404318
APA StyleDou, J., Chang, K.-T., Chen, S., Yunus, A. P., Liu, J.-K., Xia, H., & Zhu, Z. (2015). Automatic Case-Based Reasoning Approach for Landslide Detection: Integration of Object-Oriented Image Analysis and a Genetic Algorithm. Remote Sensing, 7(4), 4318-4342. https://doi.org/10.3390/rs70404318