Article

Estimating Roof Solar Energy Potential in the Downtown Area Using a GPU-Accelerated Solar Radiation Model and Airborne LiDAR Data

1
Key Laboratory of Geographic Information Science, Ministry of Education, East China Normal University, Shanghai 200241, China
2
School of Geographic Sciences, East China Normal University, Shanghai 200241, China
3
Shanghai Surveying and Mapping Institute, 419 Wuning Rd, Shanghai 200063, China
*
Author to whom correspondence should be addressed.
Remote Sens. 2015, 7(12), 17212-17233; https://doi.org/10.3390/rs71215877
Submission received: 30 October 2015 / Revised: 3 December 2015 / Accepted: 8 December 2015 / Published: 18 December 2015

Abstract

:
Solar energy, as a clean and renewable resource is becoming increasingly important in the global context of climate change and energy crisis. Utilization of solar energy in urban areas is of great importance in urban energy planning, environmental conservation, and sustainable development. However, available spaces for solar panel installation in cities are quite limited except for building roofs. Furthermore, complex urban 3D morphology greatly affects sunlit patterns on building roofs, especially in downtown areas, which makes the determination of roof solar energy potential a challenging task. The object of this study is to estimate the solar radiation on building roofs in an urban area in Shanghai, China, and select suitable spaces for installing solar panels that can effectively utilize solar energy. A Graphic Processing Unit (GPU)-based solar radiation model named SHORTWAVE-C simulating direct and non-direct solar radiation intensity was developed by adding the capability of considering cloud influence into the previous SHORTWAVE model. Airborne Light Detection and Ranging (LiDAR) data was used as the input of the SHORTWAVE-C model and to investigate the morphological characteristics of the study area. The results show that the SHORTWAVE-C model can accurately estimate the solar radiation intensity in a complex urban environment under cloudy conditions, and the GPU acceleration method can reduce the computation time by up to 46%. Two sites with different building densities and rooftop structures were selected to illustrate the influence of urban morphology on the solar radiation and solar illumination duration. Based on the findings, an object-based method was implemented to identify suitable places for rooftop solar panel installation that can fully utilize the solar energy potential. Our study provides useful strategic guidelines for the selection and assessment of roof solar energy potential for urban energy planning.

Graphical Abstract

1. Introduction

Today’s global energy demand still relies largely on fossil fuels [1]. This results in rapid increase in anthropogenic greenhouse gas emissions and overexploitation of natural resources. The issues of global change, energy crisis, and environmental pollution caused by burning fossil fuels have drawn worldwide attention [2]. The pursuit of new renewable energy, such as solar, wind, biomass, nuclear, and hydropower, as substitutions for traditional fossil fuels is an urgent need [2,3]. As a clean and renewable energy source, solar energy has great potential because of its flexibility and sustainability [4]. It was reported that solar power generation grew rapidly (+58%) in the world in 2012, which is higher than the average growth rate of renewable energy used in power generation (15.2%) [5]. Solar energy is harnessed by using several types of technologies, such as solar heating, solar photovoltaic, and solar photochemistry. Common urban applications include the solar thermal collector for water heating and the solar photovoltaic panel placed on building roofs [6,7]. The estimation of the potential solar radiation on building roofs is significantly important for improving the efficiency of solar energy utilization in the urban environment.
The potential of solar energy utilization at a specific site in urban areas, especially in downtown areas, is determined by three factors: the amount of solar radiation reaching the ground, the accessibility of the receiving solar radiation at a specific location, and the space available for mounting the solar instruments. The amount and intensity of the shortwave solar radiation at ground level typically vary with geographic location (latitude), season of year, time of day, atmospheric condition (e.g., cloud coverage, atmospheric transparency), and original Earth surface topography [8,9]. Particularly for urban areas, the emergence of various artificial objects and natural features creates complex urban morphology, which has profound influence on the sunlight, shade, and solar radiation access within urban space [10,11]. Thus, the spatial distribution of solar radiation receiving surface at a given time and season is largely influenced by the complex urban morphology. In addition, the very limited space in urban environment also affects the space available for mounting solar instruments [12,13]. Therefore, to fully delineate and quantify the practical solar radiation in the urban area, an assessment framework needs to include a solar radiation simulation model that deals with various sky conditions, detailed and accurate urban morphological information, as well as the function to identify potential spaces where solar instruments can most utilize the received solar radiation.
Some spatially explicit solar flux models have been developed to simulate the topographical effects on solar radiation variations over time and space (e.g., [8,9,14]). Most of them were designed to model the spatio-temporal variations of solar radiation in natural mountainous terrains based on coarse resolution Digital Elevation Models (DEMs) [8,9]. However, coarse resolution surface topography data are unable to support a reliable and detailed analysis of urban 3D morphology. Besides, high-resolution surface topography data is still unavailable for most metropolitan areas. Thus, in previous studies, there has not been much discussion on the simulation of solar radiation in the urban built-up area. In the recent decade, digital photogrammetry and airborne Light Detection and Ranging (LiDAR) Remote Sensing technology have provided highly accurate and densely sampled topographic measurements for surface morphology surveying and mapping in urban environments. Photogrammetry requires true-orthophoto generation from aerial photographs, and the produced surface elevation largely depends on the geometrical resolution and the quality of the aerial images [15,16]. In contrast, surface elevation measurements obtained from airborne LiDAR are quicker and more effective than traditional photogrammetric techniques [17,18]. Since then, a number of studies have been conducted using LiDAR data on the urban 3D building modeling [19,20,21,22,23], urban vegetation identification and green volume estimation [24,25], and solar potential evaluation in the urban area [26,27,28,29,30]. For example, Yu, et al. [26] demonstrated that the integration of urban Digital Surface Model (DSM) from LiDAR data and a solar radiation flux model is able to investigate the spatio-temporal variations of solar radiation in downtown Houston. Their study provided a new effective and efficient way to model the impacts of urban 3D morphology on solar radiation in an urban built-up environment. Santos, et al. [27] estimated solar radiation on rooftops by employing GIS-based solar models and LiDAR data, and assessed the photovoltaic potential of residential buildings in Lisbon, Portugal. Despite valuable findings, these previous studies only focused on modeling solar radiation under a clear-sky condition although the atmospheric condition has a significant attenuation influence on solar radiation transmission [31]. It has been shown that solar radiation transmission through the atmosphere is normally attenuated by atmospheric turbidity and cloud cover [32]. Turbidity attenuation is caused by aerosols and atmospheric gases, which are highly variable in both time and space and often infeasible to be measured at the desired resolution for solar radiation simulation at urban scale [33]. For cloud cover, this has the greatest influence on ground level irradiance attenuation [31], particularly for coastal or tropical urban areas. Thanks to the development in satellite technology, cloud cover at urban level can now be monitored successfully using meteorological satellite data, such as FengYun-2F. FengYun-2F is the fourth geostationary meteorological satellite operated by China and was launched on 13 January 2012. It provides a visible image and four infrared images hourly in normal periods and every 30 min in the flood season. By utilizing FengYun data, cloud influence can be determined and integrated into the clear-sky solar flux model for handling different sky conditions.
In addition, as high-resolution airborne LiDAR data is employed to represent complex urban 3D morphology, high-performance computation techniques are required for fast and accurate solar radiation estimation. A number of high performance geospatial computation approaches have been taken to process large remote sensing data, such as cluster computing and hardware-based acceleration [34]. However, applications of computer clusters are largely restricted by their high cost. The use of a parallel hardware structure makes high-performance computation possible for general purposes, and various techniques have been developed, among which is the GPU (Graphic Processing Unit) technique that has been increasingly popular in parallel computation. GPU is initially designed to work with CPU (Central Processing Unit) to speed up graphic rendering, and now it can also be employed as a parallel structure for computation due to its unique design feature [35]. Normally a GPU has a much greater number of cores than a CPU, which means that the memory access latency can almost be ignored when running a large number of threads simultaneously [36]. Therefore, although the clock rate of a single GPU core is lower than that of a single CPU core, the overall efficiency of parallel computation on GPU can be much higher. There are two main GPU programming architectures available so far, namely NVIDIA’s Compute Unified Device Architecture (CUDA) and ATI’s Close To the Metal (CTM). Hu, et al. [36] compared the efficiency of fast filtering of LiDAR data using the Open Multi-Processing (OpenMP) method, a technology of multiprocessing in CPU, and NVIDIA’s CUDA, and found that CUDA can increase computational efficiency to a much larger extent when compared with OpenMP. CUDA has also been used for solar radiation simulation. For example, Lukač and Žalik [37] employed CUDA and used LiDAR data to estimate the roof’s direct and diffuse solar radiance potential in two test locations in Slovenia. A multiresolutional shadowing approach was taken where the urban area was treated with higher resolution and the surrounding hilly area with lower resolution. The influence of the vegetation was also considered. Their results show that the GPU-based CUDA is faster and more efficient compared with the multi-core CPU approach for solar irradiance computation. To our best knowledge, no research has been reported to simulate the solar radiation (including direct, reflect, and diffuse radiation) under various cloudy conditions using a GPU-accelerated method.
The objective of this paper was two-fold. Firstly, by integrating high-resolution airborne LiDAR data and FengYun meteorological data, we proposed a new GPU-based solar radiation model, named SHORTWAVE-C, which is updated from the SHORTWAVE model developed by Kumar, et al. [8], to evaluate solar radiation intensity under cloudy condition. The GPU acceleration method ensures that the simulation of solar radiation in large spatial scale is practically feasible. Secondly, in terms of practical application, an object-based method was adopted to segment building roofs and identify suitable roofs for enhancing the utilization of solar energy. The next sections are organized as follows. Section 2 introduces the case study area and data collection method. In Section 3, the GPU-based solar radiation model and the object-based method for selecting suitable building roofs are described in detail. In Section 4, the spatio-temporal pattern of solar radiation, efficiency of GPU-accelerated estimation, and selection of suitable roofs are analyzed and discussed. The last section draws some conclusions.

2. Case Study Area and Data Collection

2.1. Case Study Area

Shanghai, the economic center and the largest city of China, is located in the east of the Yangtze River Delta, and has a total population of 24 million. It has a humid subtropical climate with a rainy spring and summer. In this study, a rectangular area in downtown Shanghai, the Lujiazui region was selected for case study (Figure 1). The Lujiazui region is located in the west of Shanghai Pudong New District and is one of the most prosperous financial centers in China. The study area is ca. 300 ha in size, and has a relatively flat terrain with average elevation height of about 3.5 m. This area represents the most complex urban landscapes in downtown Shanghai, which is a mixture of modern skyscrapers, residential buildings, and urban greening such as urban green belt and street trees. According to the height information obtained from airborne LiDAR measurements in 2006, the average building height of the study area is about 34.9 m, while the tallest building is up to 365.8 m. Two sample areas, Area A and Area B were selected to illustrate the influence of different urban morphology on the solar radiation variations (Section 4).
Figure 1. The geographic location and Digital Surface Model (DSM) from airborne Light Detection and Ranging (LiDAR) data of the Lujiazui region, Shanghai, China.
Remotesensing 07 15877 g001

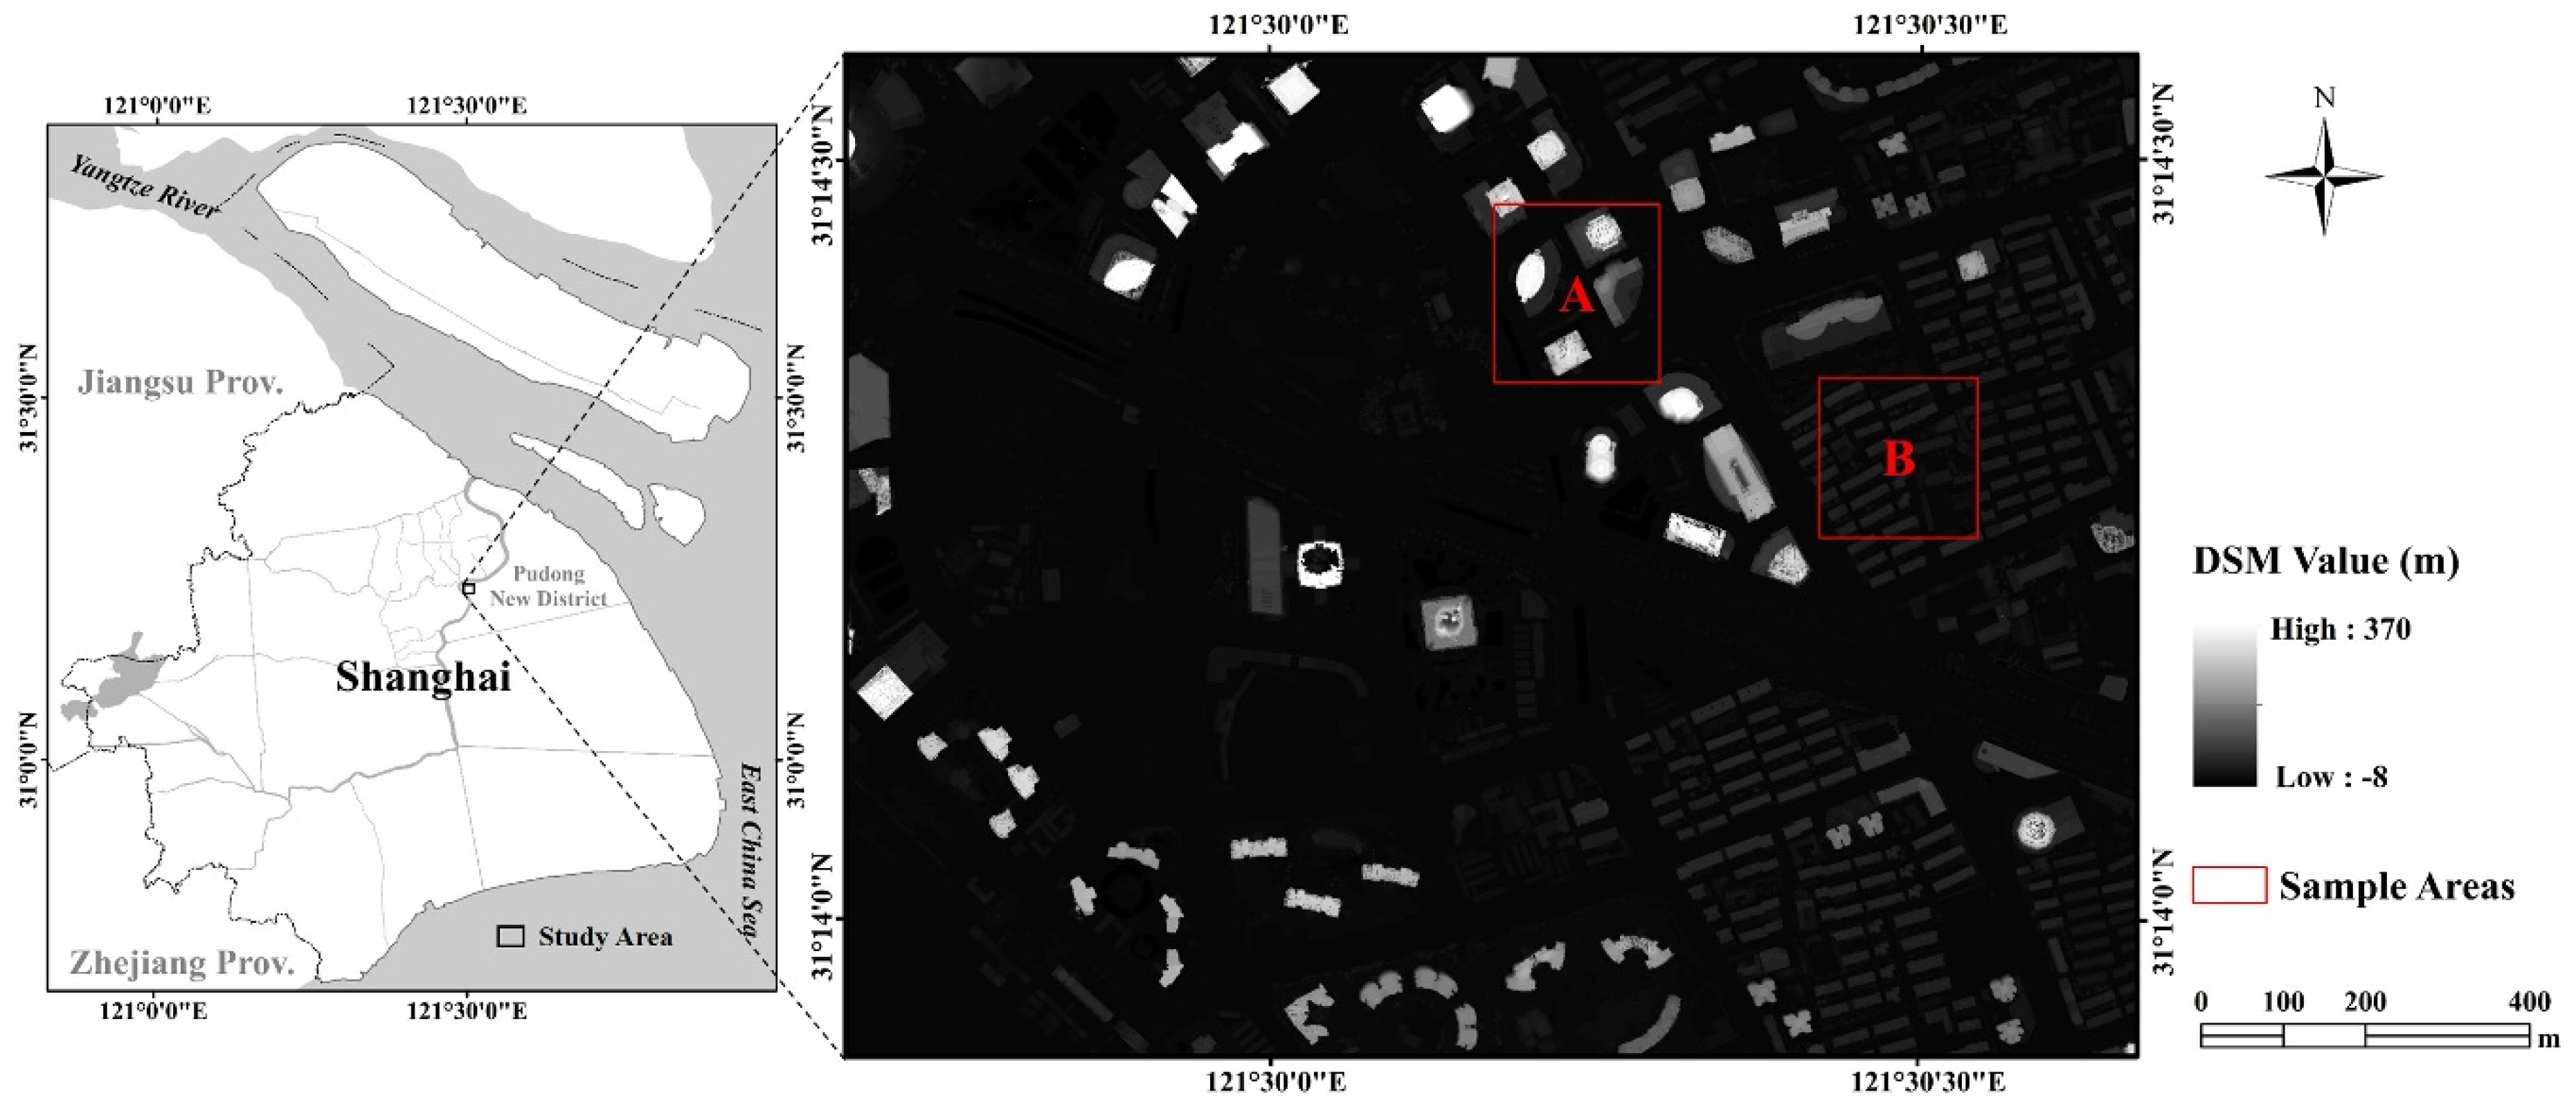
2.2. Data Collection

The airborne LiDAR data of the Lujiazui region were collected by the Geomatics Center at Shanghai Municipal Institute of Surveying and Mapping using the Optech ALTM 3100 system on February, 2006 [38]. The LiDAR point measurements of the last return were provided as x, y, z lists in ASCII files. According to the metadata, the mean accuracy of LiDAR measurements is estimated to be about 10 cm and the average sampling density is one point per 0.6 m2. First, a Triangle Irregular Network (TIN) was created from the original LiDAR points cloud. Then, a DSM grid with a 1 m cell size was interpolated by using the linear interpolation method. The DSM contains elevation information for all objects and ground features, including buildings and trees. The DSM was used as the input in solar radiation simulation. In addition, to select suitable roofs for solar panels, a normalized DSM (nDSM) data is required. The nDSM is the difference between the DSM and the digital terrain model (DTM), which provides the relative height information of man-made and natural objects above the ground. To generate nDSM, ground points were extracted from the original airborne LiDAR point cloud data by using a progressive morphological filter [39]. Then, these ground points were interpolated to form a DTM grid. After that, the nDSM data were extracted by removing the DTM value from the DSM grid.
The color infrared aerial photograph with 1 m spatial resolution was acquired in February, 2006. The image contains three spectral bands: green, red, and near-infrared. The Normalized Difference Vegetation Index (NDVI) calculated from the near-infrared band and red band is used to remove vegetation from nDSM.
Hourly cloud cover data of Shanghai (from December 2012 to November 2013) was downloaded from the FengYun Satellite Data Center (http://satellite.cma.gov.cn). The data were sensed by Visible and Infrared Spin Scan-Radiometer (VISSR) carried on the FengYun-2F satellite and converted to grid data with a spatial resolution of 0.1° × 0.1°. Since the case study area is smaller than one pixel of the grid data, the value of the pixel which covers the centroid of the study area is extracted as the cloud amount of the case study area.

3. Methods

3.1. GPU-Based Solar Radiation Model—SHORTWAVE-C

In our previous studies [26,40,41], we adopted and re-implemented the SHORTWAVE model, originally developed by Kumar, et al. [8] and later modified by Zimmermann [42], to simulate the variations of solar radiation over space and time on the assumption of a clear-sky condition. Although we used a much smaller time interval and a high-resolution DSM to adapt this model to complex urban context, the influence of atmospheric condition was ignored. To simulate solar radiation under different sky conditions, the influence of cloud is required. Some algorithms considering cloud influence have been developed in previous studies [43,44], but most of these algorithms are either directly fueled by climatic observations or need a subsequent cloud correction using in situ ground measurements after clear-sky simulation. For example, Redweik, et al. [43] calculated the solar energy on building roofs and facades by using a solar radiation model associating with observed hourly climatic data over 30 years from climatic observations. Although the meteorological measurements from in situ sensors and stations are accurate and temporally frequent, they are often limited to a small number of locations in urban areas. In recent decades, meteorological satellite data is capable to provide cloud coverage with sufficiently high temporal and spatial resolution at medium and large scales. Based on DSM and FengYun meteorological data, we developed a GPU-based solar radiation model named SHORTWAVE-C by extending the SHORTWAVE model. The GPU acceleration method ensures the speed and efficiency of the solar radiation simulation.
Figure 2 shows the workflow of the SHORTWAVE-C model. The model takes DSM, latitude, date, interval time, and hourly cloud amount image as input, and estimates direct, diffuse, reflected solar radiations, and solar duration under cloudy condition. DSM is obtained from airborne LiDAR data, and is employed to calculate topographic parameters, such as hillshade, slope, and aspect. Date and altitude are important parameters to calculate solar position. Interval time is set to 10 min. Hourly cloud amount is acquired from FengYun-2F satellite data. Firstly, a relationship is established between cloud amount and cloud penetration to obtain the atmospheric clearness index. Then solar radiation under cloudy condition can be calculated from clear-sky radiation and its corresponding atmospheric clearness index. To accelerate solar radiation calculation, we assigned different tasks for CPU and GPU. The following sections give a detailed description of our solar radiation algorithm and GPU acceleration implementation.
Figure 2. The workflow of the Graphic Processing Unit (GPU)-based SHORTWAVE-C model for calculating daily solar radiation.
Remotesensing 07 15877 g002

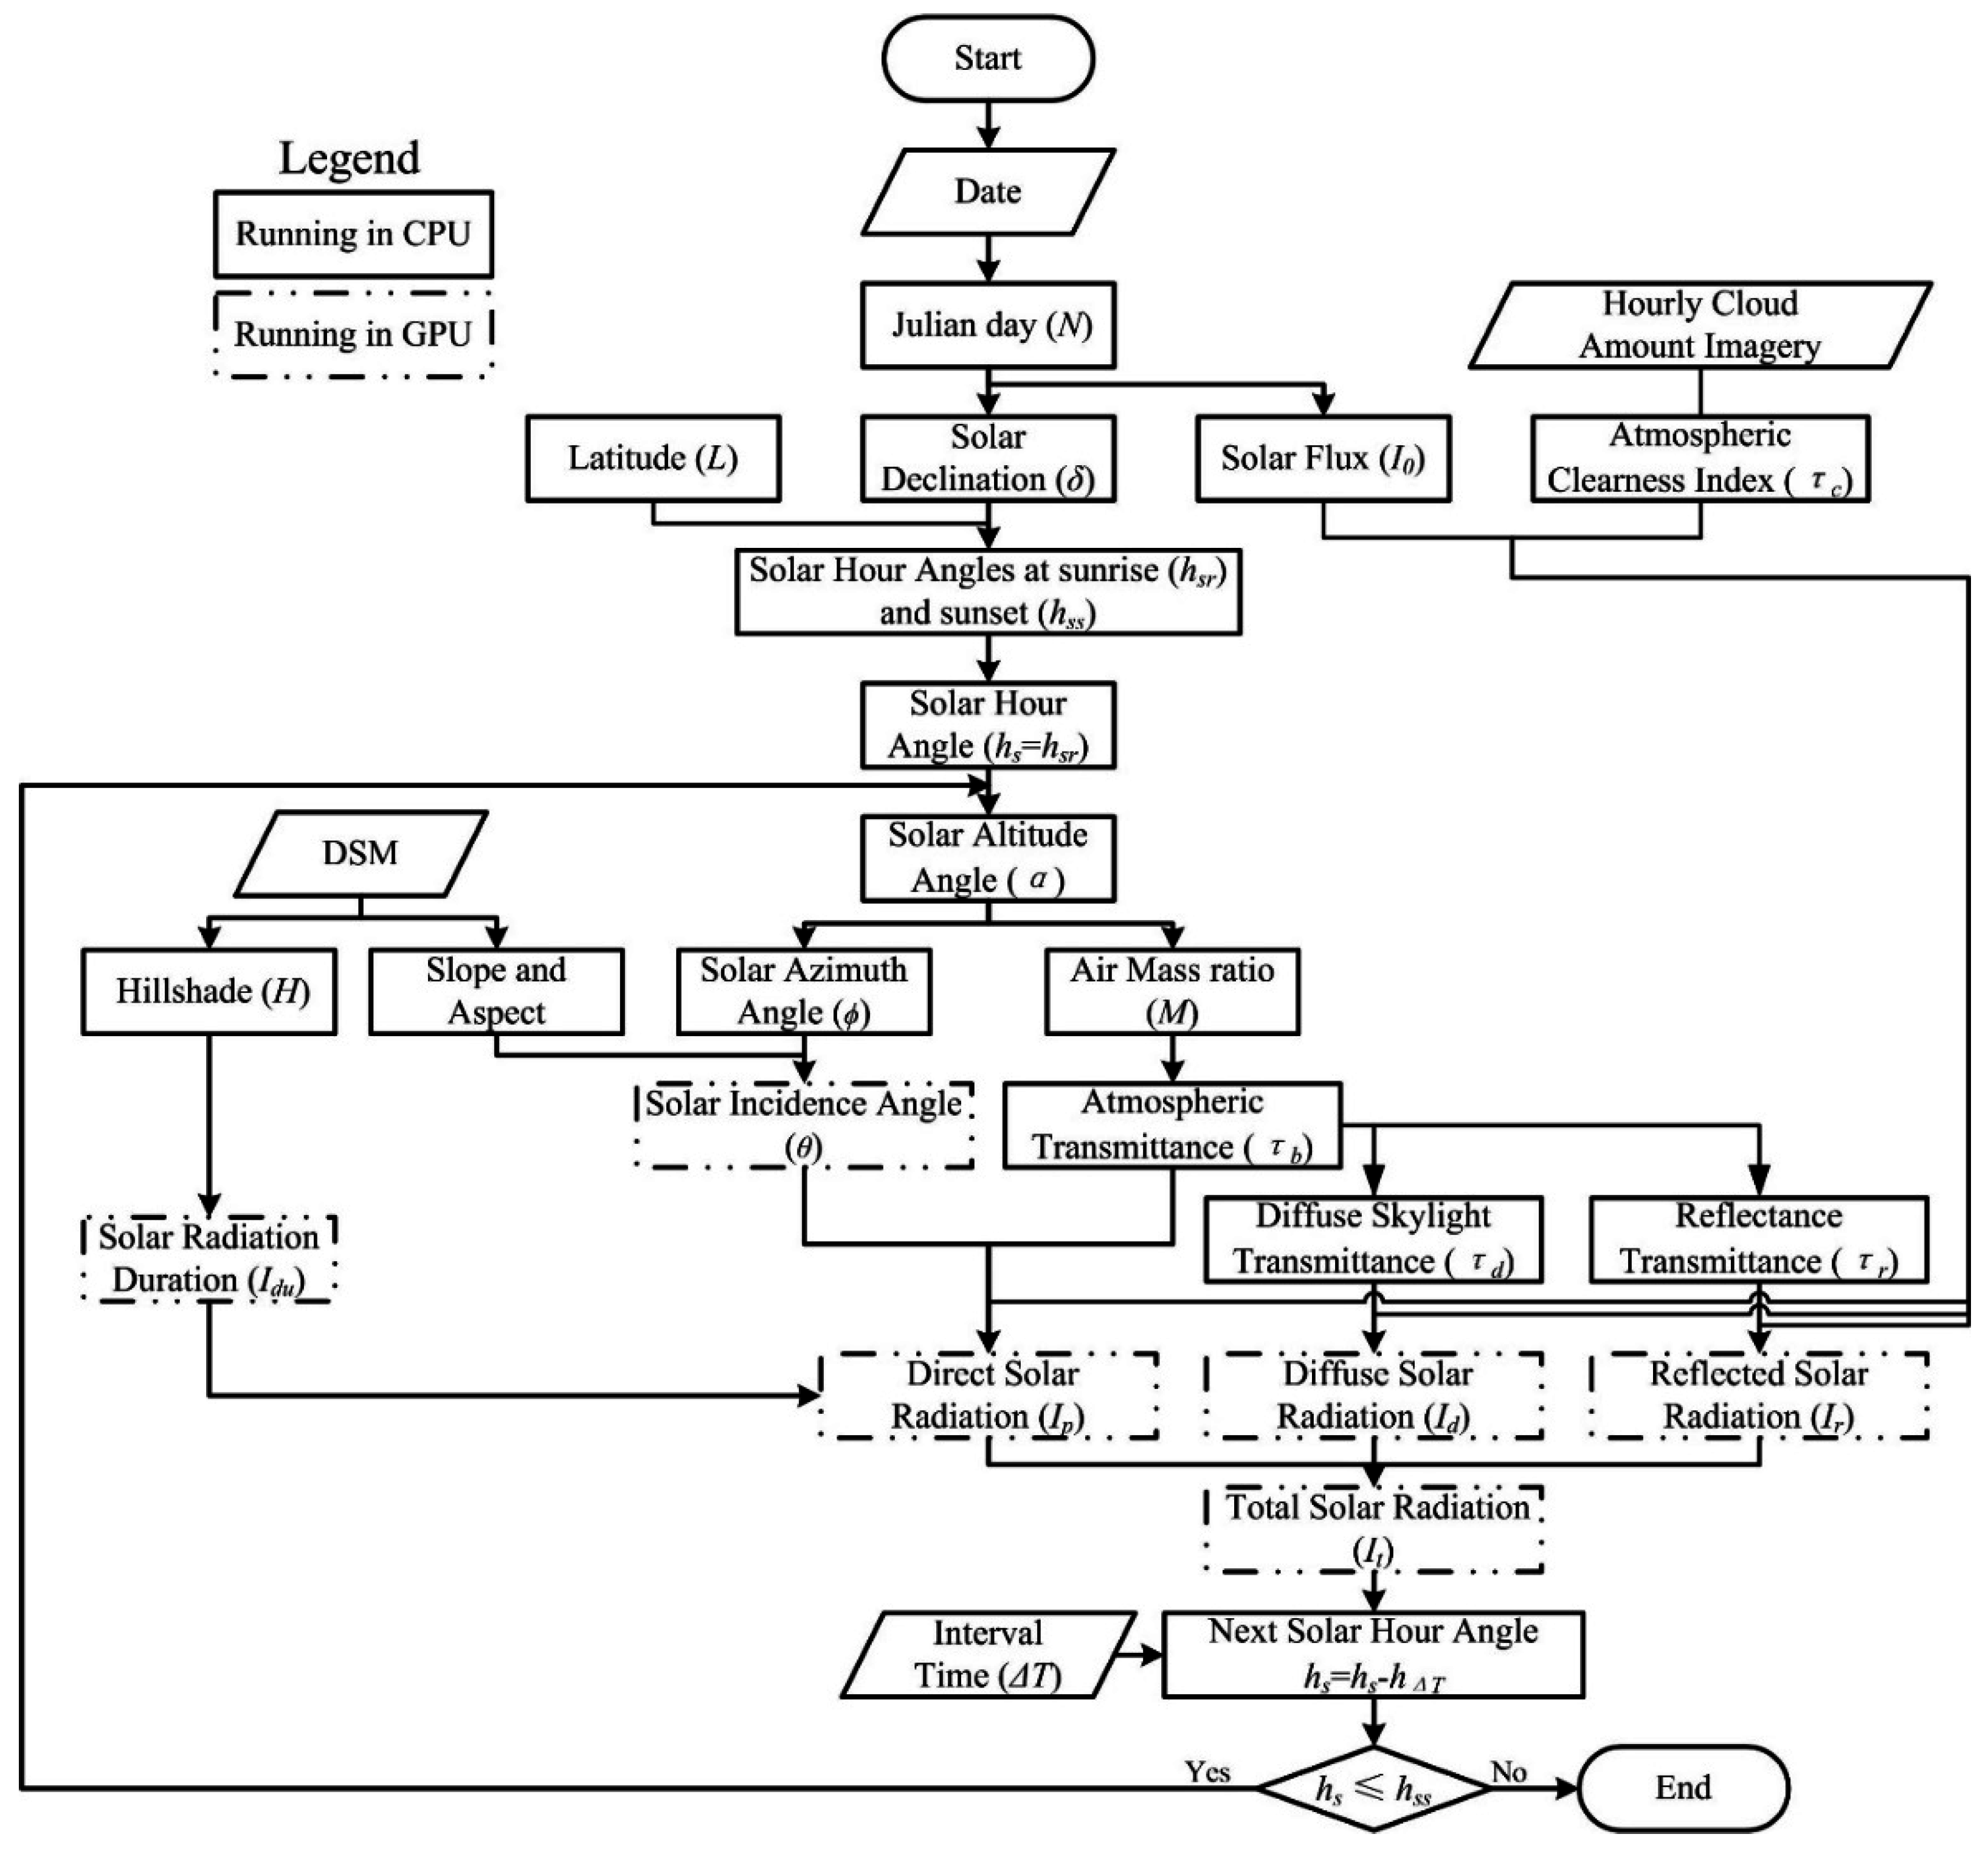
3.1.1. SHORTWAVE-C Algorithm

Compared with the SHORTWAVE model, our SHORTWAVE-C model incorporates an atmospheric clearness index to establish the relationship between clear-sky solar radiation and cloudy-sky solar radiation. The basic algorithm for calculating clear-sky solar radiation is the same as for the calculation of the SHORTWAVE model. The detailed theoretical basis of the SHORTWAVE model has already been introduced in Kumar, et al. [8]. Here, we only present the main equations used in the SHORTWAVE-C algorithm with an emphasis on our atmospheric clearness index calculation.
Given the Julian day (N) and the central latitude of the study area ( L ), the solar position parameters, such as solar declination ( δ ) and solar hour angle at sunrise ( h s r ) and sunset ( h s s ), can be calculated from Equations (1)–(3):
δ = 23.45 sin ( 360 ( 284 + N ) / 365 )
h s r =   cos 1 ( tan L tan δ )
h s s =   h s r
Solar radiation intensity for each grid cell is a time-integrated quantity. In order to compute the total radiation amount for one day, the day is subdivided into a consecutive series of equal discrete time intervals. The radiation quantity for each time interval is presumed to be homogenous and its value is estimated. Then these values are cumulated from the sunrise to sunset to obtain the total radiation for the day. Determination of the appropriate time interval is a balance between accuracy requirement and the roughness of the terrain. Smaller time intervals normally lead to higher accuracy, but also require larger computational resources. Because of the complex terrain characteristics in urban areas, the time interval for an urban area should be much smaller than that for natural regions [26]. Yu, et al. [26] proved that the appropriate time interval for the high-relief urban area is 10 min, which is much smaller than that which Kumar, et al. [8] and Antonic [45] suggested for mountainous terrains when using the same accuracy criteria (better than 1%). In this study, we also set 10 min as the appropriate time interval. The current solar hour angles ( h s ), which is initialized as h s r , is employed to calculate current solar position, including solar altitude angle ( α ), solar azimuth angle ( ϕ ), and air mass ratio ( M ) [46,47] using Equations (4)–(6):
sin α =  sin L sin δ + cos L cos δ cos h s
sin ϕ = cos δ sin h s / cos α
M = [ 1229 + ( 614 sin α ) 2 ]   1 / 2 614 sin α
The solar flux outside the atmosphere ( I 0 ) is calculated by using Equation (7) [48]:
I 0 = S c ( 1 + 0.0344 cos ( 360 N / 365 ) )
where S c is the solar constant. In this research, we accepted a solar constant value of 1367 W/m2, which is same as the value adopted by the World Radiation Center.
Then, we estimate the atmospheric transmittance ( τ b ), diffuse skylight transmittance ( τ d ) and reflectance transmissivity ( τ r ) based on Equations (8)–(10) [8]:
τ b = 0.56 ( e 0.65 M + e 0.095 M )
τ d = 0.271 0.294 τ b
τ r = 0.271 + 0.706 τ b
To calculate the cloud cover influence on the solar radiation, we incorporate an atmospheric clearness index ( τ c ) into our solar radiation model. τ c can be calculated by Equation (11) [49]:
τ c =   1 A   ( C / 8 ) B
where C is the cloudy amount with unit of okta, A and B are two constant coefficients, which are 0.75 and 3.4 respectively [50].
The solar incidence angle ( θ ) between the solar illumination ray and the normal of terrain surface is not only influenced by the solar position but also by the topographic features. It can be measured based on solar altitude angle ( α ), solar azimuth angle ( ϕ ), surface slope ( β ), and surface aspect ( ω ) from Equation (12). The surface slope and surface aspect were both generated from DSM data.
cos θ =   sin β cos α cos ( ϕ   ω )   +   cos β sin α
Assume that the atmospheric clearness index affect direct, diffuse, and reflected solar radiation in an equal way, so the direct ( I p ), diffuse ( I d ), reflected ( I r ), and total ( I t ) solar radiation can be estimated from following equations:
I p =   I 0 τ b τ c cos θ
I d =   I 0 τ d τ c cos 2 β / 2 sin α
I r =   γ I 0 τ r τ c sin 2 β / 2 sin α
I t =   I p +   I d +   I r
where γ is the surface reflectance coefficient. In this model, γ is set to 0.2 [8].
In addition, hillshade analysis was executed using DSM data with the current solar position calculated above. The topographical blocking effect on direct solar radiation is considered in our study. If a grid cell faces away from the solar beam and its slope is larger than solar altitude angle, the solar beam is below the horizon. In this case, the grid cell has negative cos θ and is in the shadow cast by itself. Shadows cast by surrounding terrain are performed by using the hillshade analysis from ArcGIS. The direct solar radiation for grid cells that are shadowed by themselves or surrounding terrain features are set to zero. After the hillshade analysis, a pixel with zero hillshade value indicates that this pixel is in shadow, while a pixel with a non-zero hillshade value indicates that pixel is exposed to the sun [26]. If a pixel is in shadow, the location at this temporal interval ( Δ T ) does not receive any direct solar radiation so its illumination duration should be zero. If it is not in shadow, this location is good to receive solar radiations so its illumination duration should be recorded as ΔT. The solar illumination time from sunrise and sunset for a certain day can be calculated using Equations (17) and (18):
D ( k ) =   { 0   i f   t h i s   p i x e l   i s   i n   s h a d o w Δ T   o t h e r w i s e
I d u =   k = 1 N D ( k )
where D ( k ) is the sun illumination duration for one pixel at the k th time interval, k (=1, 2,…, N) is the sequential number of time intervals from the sunrise to sunset in one day, and I d u is the daily solar illumination duration.
The calculation iterates for each time interval. Finally, the solar radiations and the solar illumination duration from sunrise to sunset in one day were accumulated to achieve daily values. In a similar way, the monthly, seasonal, and yearly solar radiation amount were also simulated.

3.1.2. GPU Acceleration

In order to reduce the computational expense and keep the same accuracy for the solar radiation simulation, an effective way to calculate tremendous datasets is required. In this study, we used the CUDA combined Python (CUDA-Python) method to accelerate the solar radiation estimation. CUDA is a convenient and efficient way to implement GPU acceleration because of its enormous computational ability and high memory bandwidth [36]. The logical memory in CUDA is structured hierarchically. Thread is the basic unit in CUDA structure, and these individual threads are typically organized into thread blocks. The highest level is thread grid, which consists of several thread blocks. In addition, the memory type in CUDA is diverse, ranging from local memory to shared memory, and global memory. Each thread has its own private local memory. If the threads are in the same thread block, they can communicate with each other via shared memory. The global memory is used for communication between each thread block and host [51]. In CUDA, the function that is called by CPU but runs in GPU is named the kernel [52].
In this study, to make maximum use of computational resources, we assigned different tasks for CPU and GPU, respectively (Figure 2). The main coding workflow of GPU acceleration includes four steps: preparing data in CPU, copying data to GPU, running kernel in GPU, and returning data to CPU. Firstly, we used CPU to load topography data and solar position parameters. Topography data like hillshade, slope, and aspect are obtained from DSM data as raster format using ArcPy, which is a Python package for GIS analysis. In order to easily allocate the threads for each pixel, the shape of the raster data is changed from two dimension to one dimension. Before running kernel, data need to be copied to the GPU global memory from the CPU dynamic random access memory (DRAM) through CUDA-Python. After predetermining the size of thread grid and thread block, we can call the kernel function by CPU. The size of thread grid refers to the number of thread blocks in the thread structure. In this study, four thread blocks are employed to work collaboratively. Each block has its own distinct job, including calculating the direct radiation, the diffuse radiation, the reflected radiation, and the solar radiation duration. Because of the limited computation capability of GPU, the size of the thread block is set to be 1024, which means that 1024 pixels are processed at the same time. Finally, the results need to be transferred to CPU DRAM from GPU global memory and then saved in the hard disk, while the input data should be cleared to free the GPU memory.

3.2. Object-Based Method to Locate Suitable Roofs for Utilization of Solar Energy

In this study, we proposed an object-based method to locate suitable spaces where solar instruments can most utilize the received solar radiation. Our method contains three key technical components: (1) extract building footprints by using an automated object identification method; (2) segment building roofs into individual roof planes; and (3) select suitable roof planes for enhancing utilization of solar energy.

3.2.1. Automated Extraction of Building Footprints

The urban landscape is a complex mosaic consisting of a diversity of man-made objects such as high-rise buildings and skyscrapers as well as natural features such as trees. Such limited space in the urban area makes building roofs the desirable places to install solar panels. In order to focus on the estimation of solar radiation on building roofs, we used an automated object identification algorithm [53] to extract a building footprint from original nDSM.
First, a threshold-based segmentation is used to transform the original nDSM to a segmented binary image by incorporating vegetation information from color infrared image and height information from nDSM. Those pixels whose NDVI are equal and lower than 0 and relative height are equal or larger than 3.5 m are recoded as the foreground pixels with a value of 1, while the pixels whose NDVI are larger than 0 and relative height are less than 3.5 m are recoded as the background pixels with a value of 0. The selection of appropriate threshold values for NDVI and relative height were demonstrated by Huang, et al. [24] and Yu, et al. [53], respectively. After segmentation, each spatially interconnected region of foreground pixels is identified as an individual building object. Then, to eliminate the spurious objects and to smooth the rough boundaries of footprint objects, the filling operation and closing operation are adopted to obtain reliable and clean building footprints. The extracted building footprints are indexed with a unique identification numbers.

3.2.2. Segmentation of Roof Planes

Traditionally, building roofs are composed of one or more flat planar surfaces, depending on different roof types. Thus, pixels belonging to the same planar faces should have a similar orientation and topographic gradient, which can be estimated based on aspect and slope from nDSM. A region-growing algorithm [41] was utilized to segment building footprint objects into individual roof planes. The first pixels of each building footprint object are seen as seed points for the region-growing process. If the neighbor pixel in eight directions of each seed point meets all the following three conditions: (1) this pixel is unlabeled; (2) this pixel belongs to the same footprint object as seed point; (3) slope and aspect difference between this test neighbor pixel and the seed pixel is smaller than a specified threshold value, this neighbor pixel will be labeled and marked with the same identification number as its corresponding seed pixel. After that, we search the new first pixels from the unlabeled pixels and repeat the abovementioned steps until all pixels are labeled. The detailed algorithm and pseudo-code for segmenting roof planes can be found in [41].
After segmentation with the region-growing algorithm, original building footprint objects are transformed to individual roof planes with homogeneous aspect and slope. Being similar to the extraction of building footprints, a series of morphologic operations including filling operation and closing operation are used to acquire the reliable roof planes.

3.2.3. Selection of Suitable Locations for Solar Panel Installation

Based on individual roof plane objects, we derived three sets of attributes for each roof plane: (1) geometric attributes; (2) topographic attributes; and (3) solar radiation attributes. Geometric attributes include the geographical location of plane centroid point, roof plane perimeter, and roof plane area. Topographic attributes include average slope and average aspect of roof plane. Solar radiation attributes include monthly, seasonal, and yearly average total solar radiation and solar illumination duration. The numerical definitions of these attributes are shown in Table 1. These attributes together give a comprehensive description of roof solar energy potential in the urban environment.
Table 1. Definition of geometric, topographic, and solar radiation attributes of roof planes.
AttributesDefinition
Geometric attributesRoof plane centroid point ( x c p ; y c p ) x c p = 1 n i = 1 n x i ; y c p = 1 n i = 1 n y i
Roof plane perimeter (P) P = a r + 2 b r
Roof plane area (S) S = n r 2
Topographic attributesAverage slope (A_slope) A _ s l o p e = 1 n i = 1 n s l o p e i
Average aspect (A_aspect) A _ a s p e c t = 1 n i = 1 n a s p e c t i
Solar radiation attributesMonthly average total solar radiation (MA_TSR) M A _ T S R = 1 n i = 1 n M A _ T S R i
Seasonal average total solar radiation (SA_TSR) S A _ T S R = 1 n i = 1 n S A _ T S R i
Yearly average total solar radiation (YA_TSR) Y A _ T S R = 1 n i = 1 n Y A _ T S R i
Monthly average solar illumination duration (MA_SID) M A _ S I D = 1 n i = 1 n M A _ S I D i
Seasonal average solar illumination duration (SA_SID) S A _ S I D = 1 n i = 1 n S A _ S I D i
Yearly average solar illumination duration (YA_SID) Y A _ S I D = 1 n i = 1 n Y A _ S I D i
where n is the number of cells consisting of roof plane, ( x i ,   y i ) are the row and column coordinates of the ith cell of the roof plane object, a is the number of boundary cells in horizontal or vertical orientation, b is the number of boundary cells in diagonal step, r is the grid cell size, s l o p e i is the slope value of the ith cell of the roof plane, a s p e c t i is the aspect value of the ith cell of the roof plane, M A _ T S R i is the monthly average total solar radiation of the ith cell of the roof plane, S A _ T S R i is the seasonal average total solar radiation of the ith cell of the roof plane, Y A _ T S R i is the yearly average total solar radiation of the ith cell of the roof plane, M A _ S I D i is the monthly average solar illumination duration of the ith cell of the roof plane, S A _ S I D i is the seasonal average solar illumination duration of the ith cell of the roof plane, Y A _ S I D i is the yearly average solar illumination duration of the ith cell of the roof plane.
To select suitable locations for solar panels, Chaves, et al. [54] presented a multi-criteria strategy to determine the desired characteristics of a suitable location, considering suitable elevation, aspect, slope, and high solar radiation. Their study aims to find rooftops facing south or flat and having not too steep a slope. In addition, the sites should receive at least some minimum threshold of yearly average solar radiation. Huang, et al. [41] pointed out that the roof plane area is also an important indicator when installing solar panels because of the installation cost. Besides those previous findings, we also incorporated the sunlight duration when choosing the desirable roof planes. Based on the characteristics of the Lujiazui region, we proposed the following desired requirements:
  • Suitable roof plane area. In terms of practical installation of the solar panel on roof planes, the area of roof plane should not be too small. We defined 10 m2 as the threshold value for our case study. If the roof plane area is equal or larger than 10 m2, it will be considered as a potential installation location.
  • Suitable roof plane slope. If the roof plane has a slope that is too steep, it is not appropriate to install solar panels. Thus, we chose roof planes whose slope is equal or lower than 45 degrees for installing solar panels.
  • Suitable roof plane aspect. As Shanghai is located in the North hemisphere, roof planes facing south receive a higher solar radiation than those north-facing. In this study, the aspect should be south, southeast, southwest facing, or horizontal.
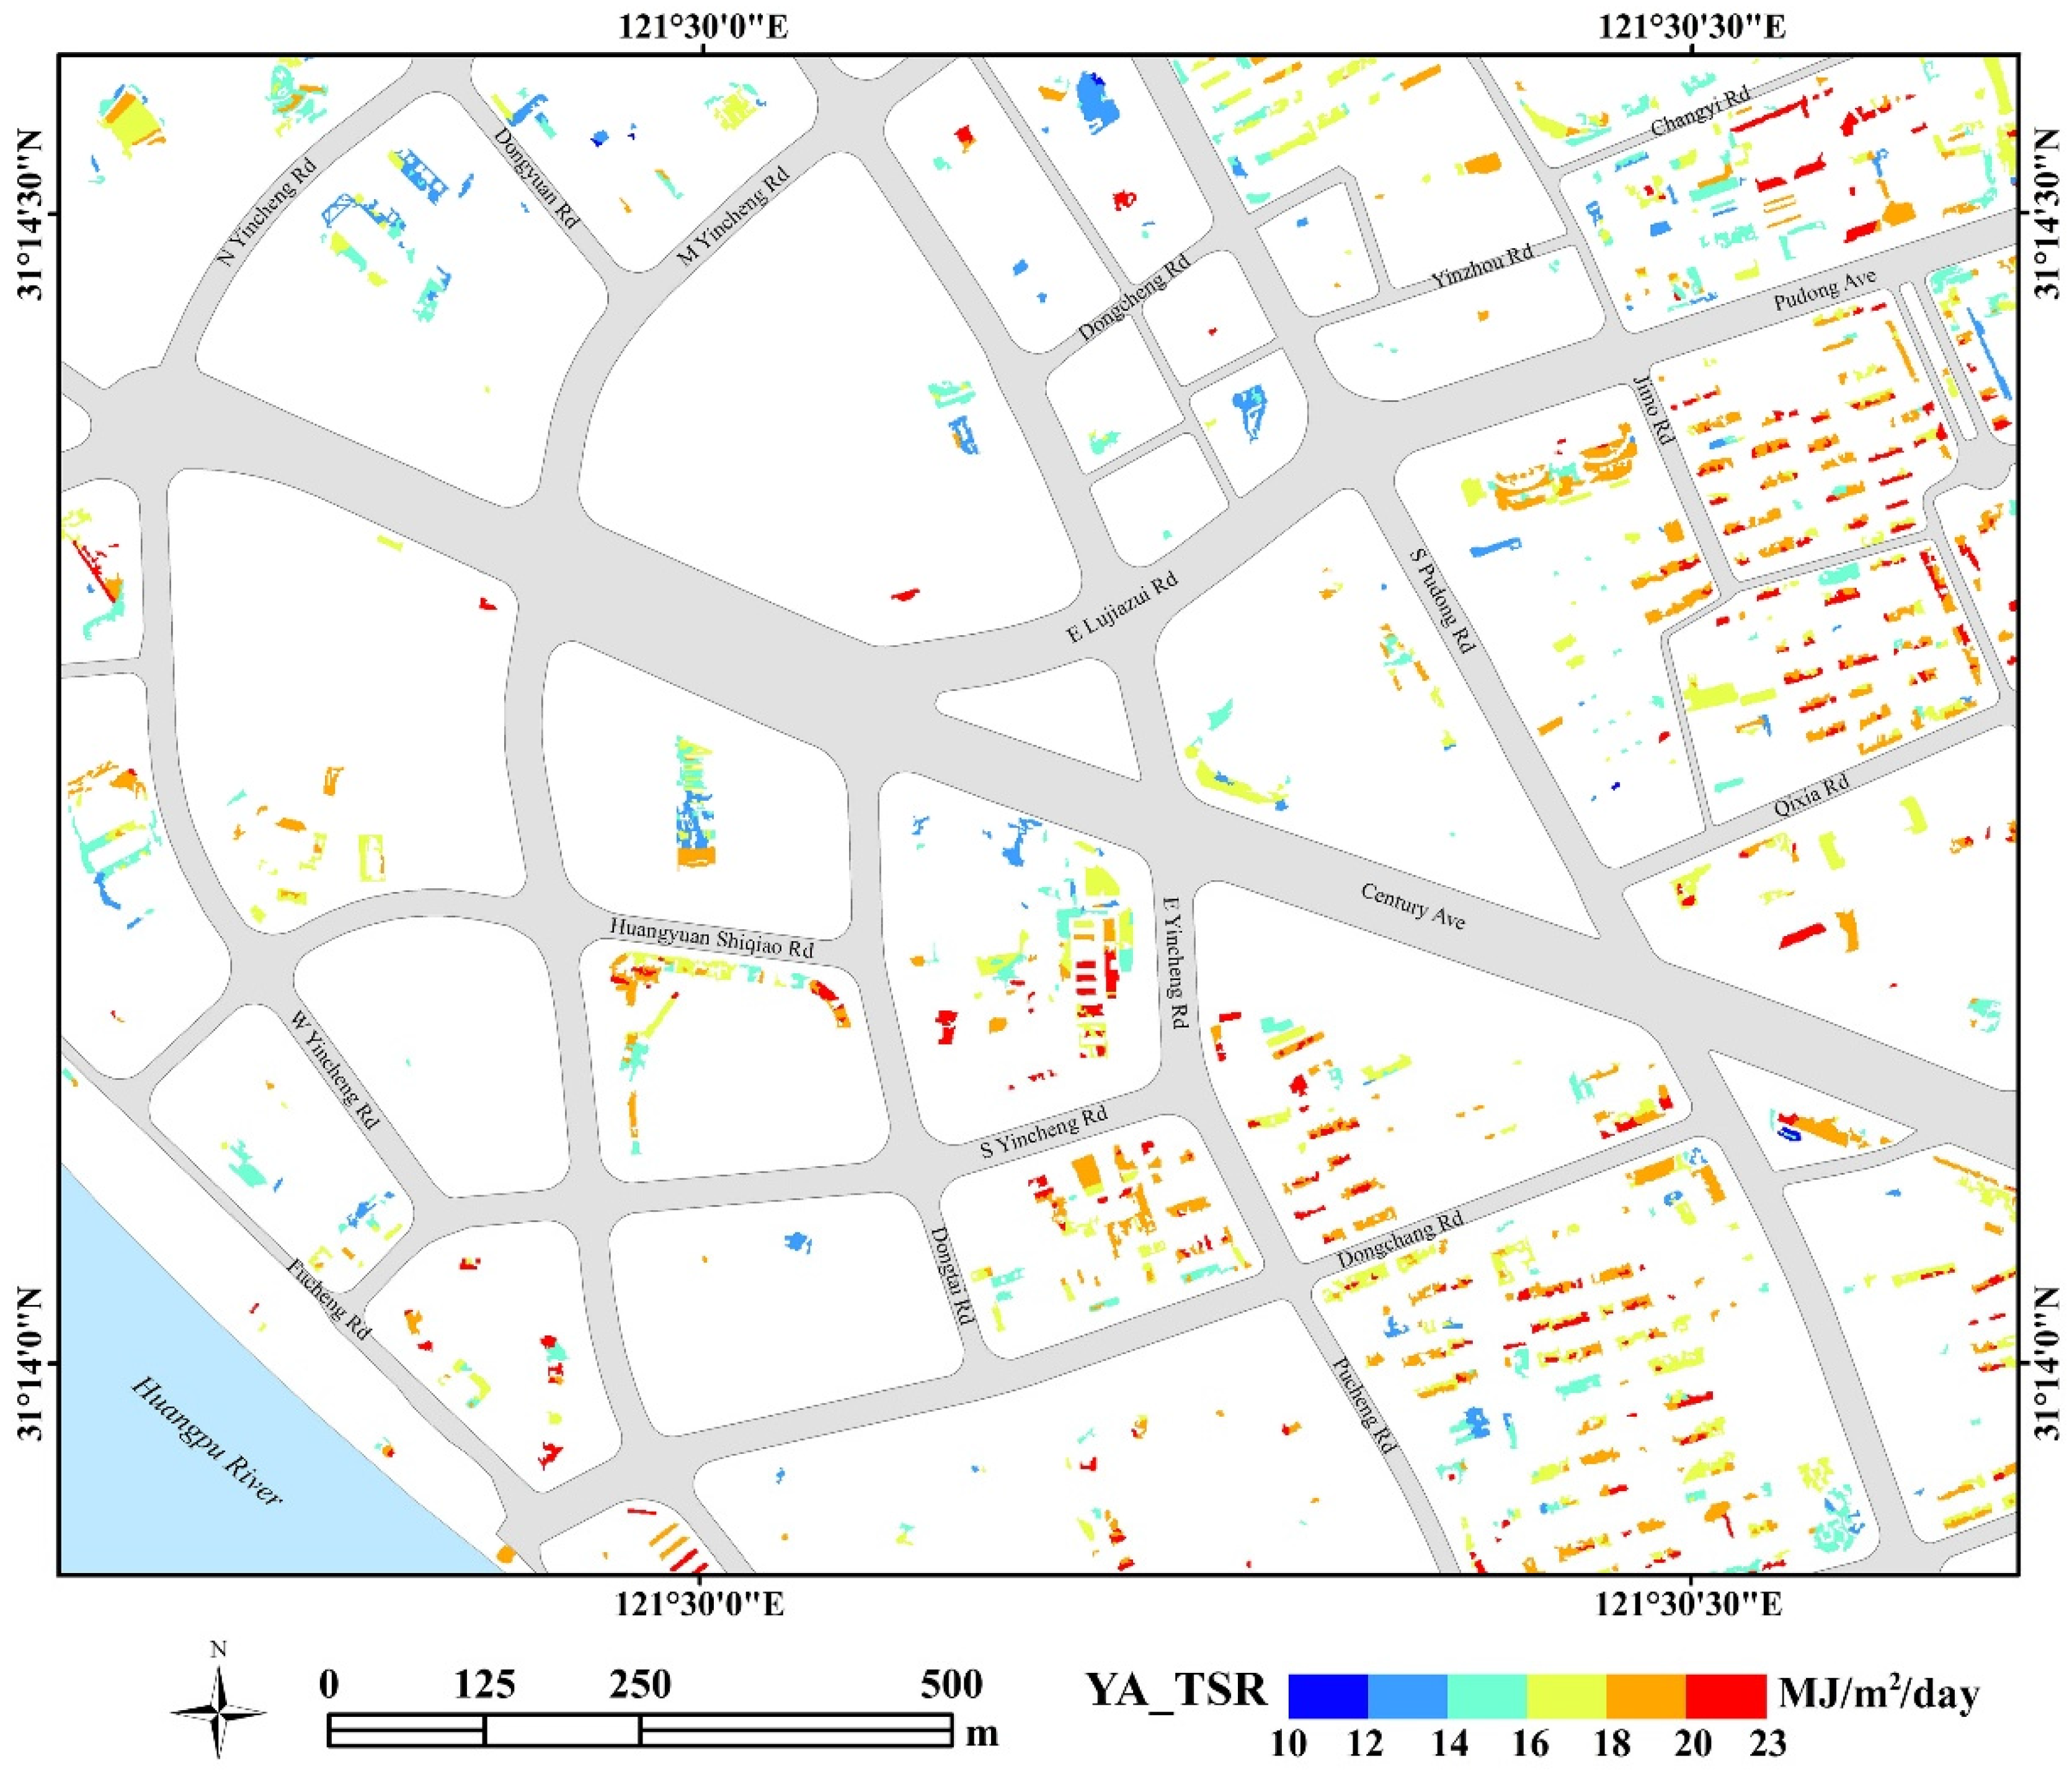
  • High yearly average total solar radiation. The selected positions should receive at least some minimum yearly average solar radiation. The yearly average total solar radiation of building rooftops in Lujiazui region ranges from 2.0 to 23.8 MJ/m2/day, and the mean value is around 13.1 MJ/m2/day. Thus, we selected 10 MJ/m2/day as the threshold value for the yearly average total solar radiation.
  • Long sunlight duration. To receive stable solar radiation for a long time, the desirable rooftops should have long average daily sunlight duration all year round. For building roofs in Lujiazui region, the maximum, minimum, and mean value of yearly average solar illumination duration is 11.9, 0, and 5.8 h, respectively. The sites that can receive more than 5 h sunlight are chosen as potential locations.

4. Results and Discussion

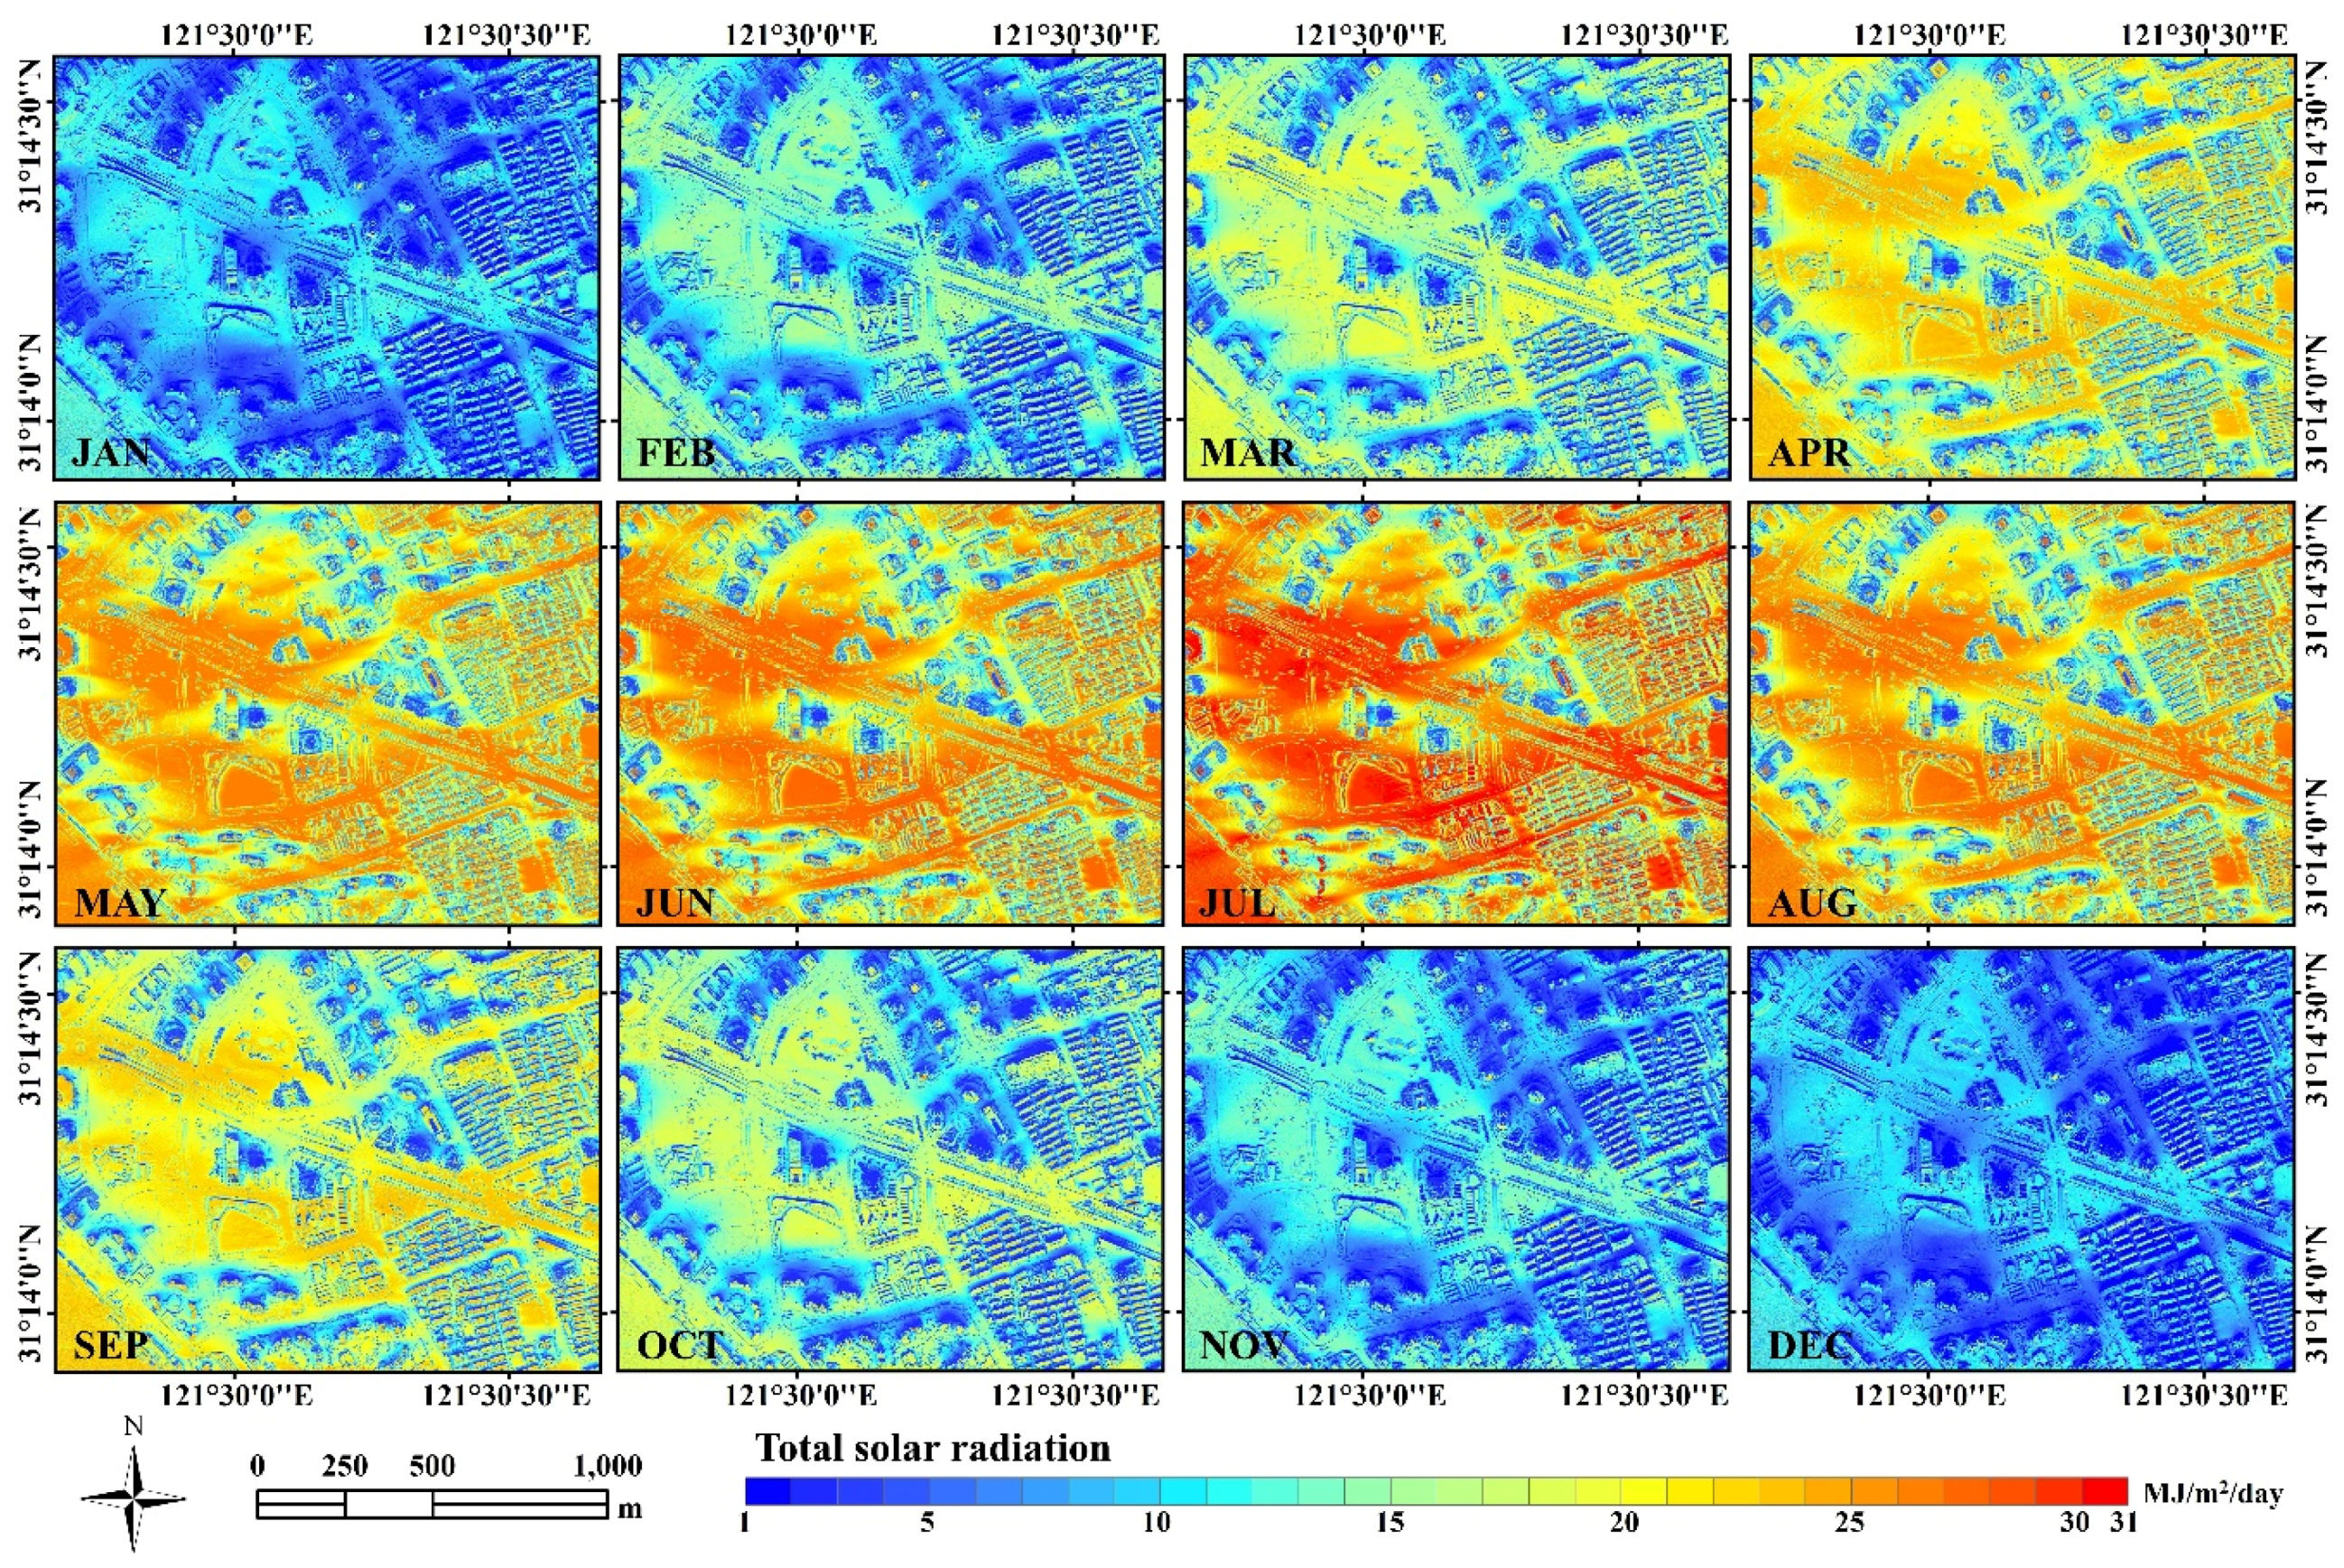
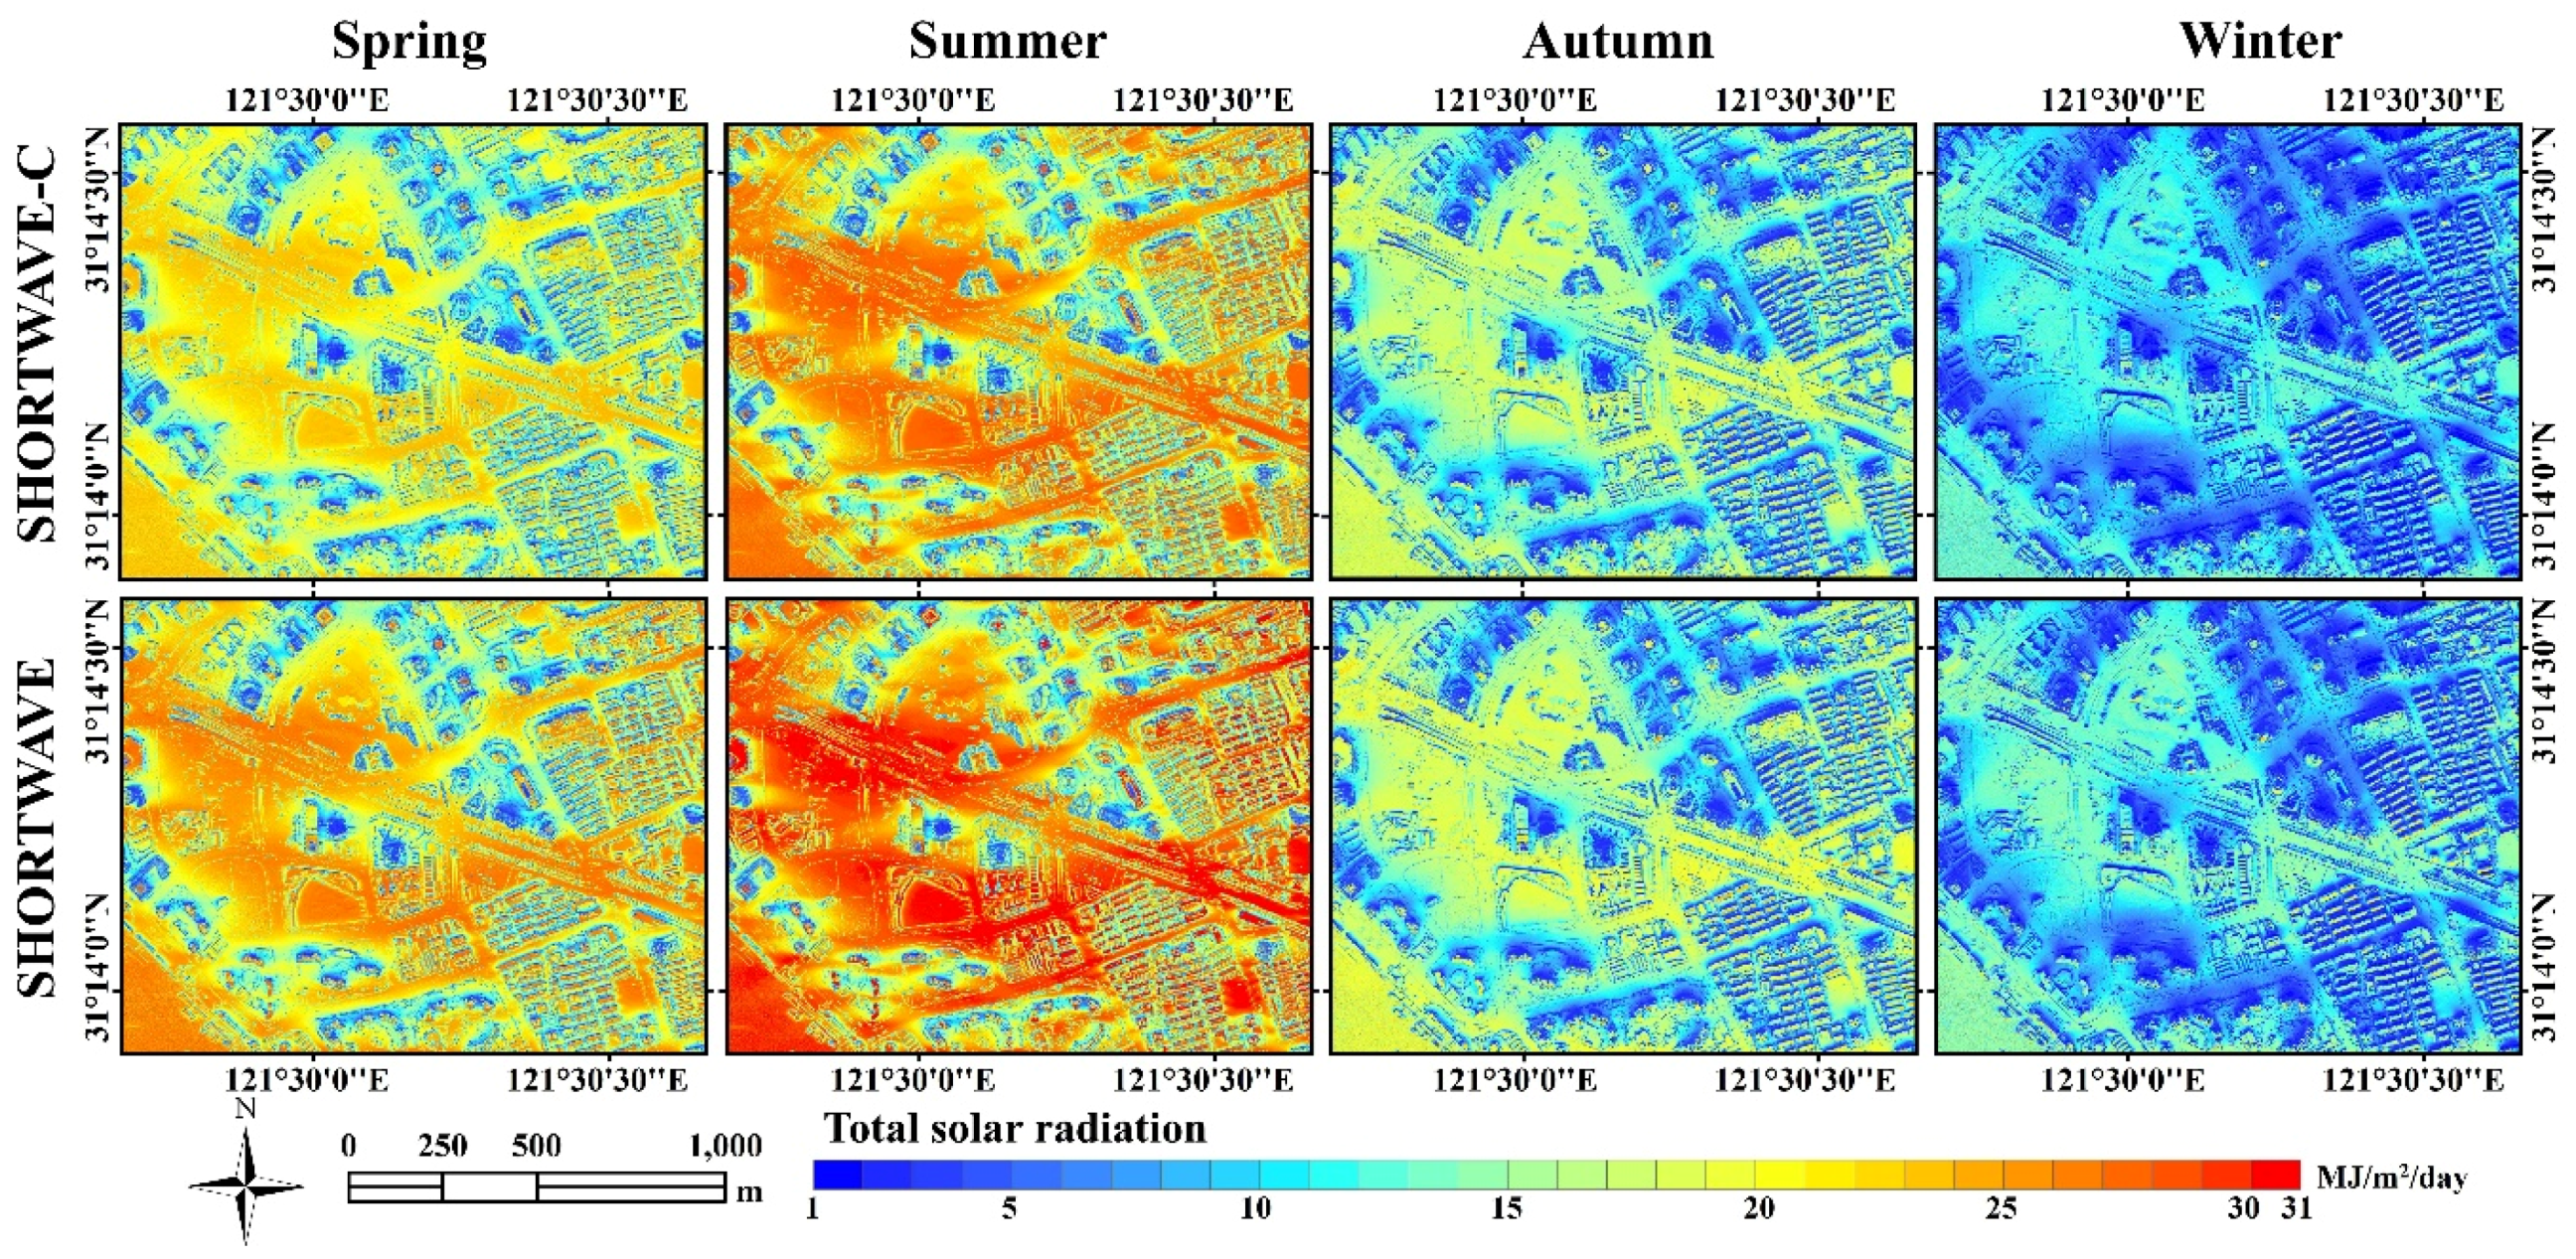
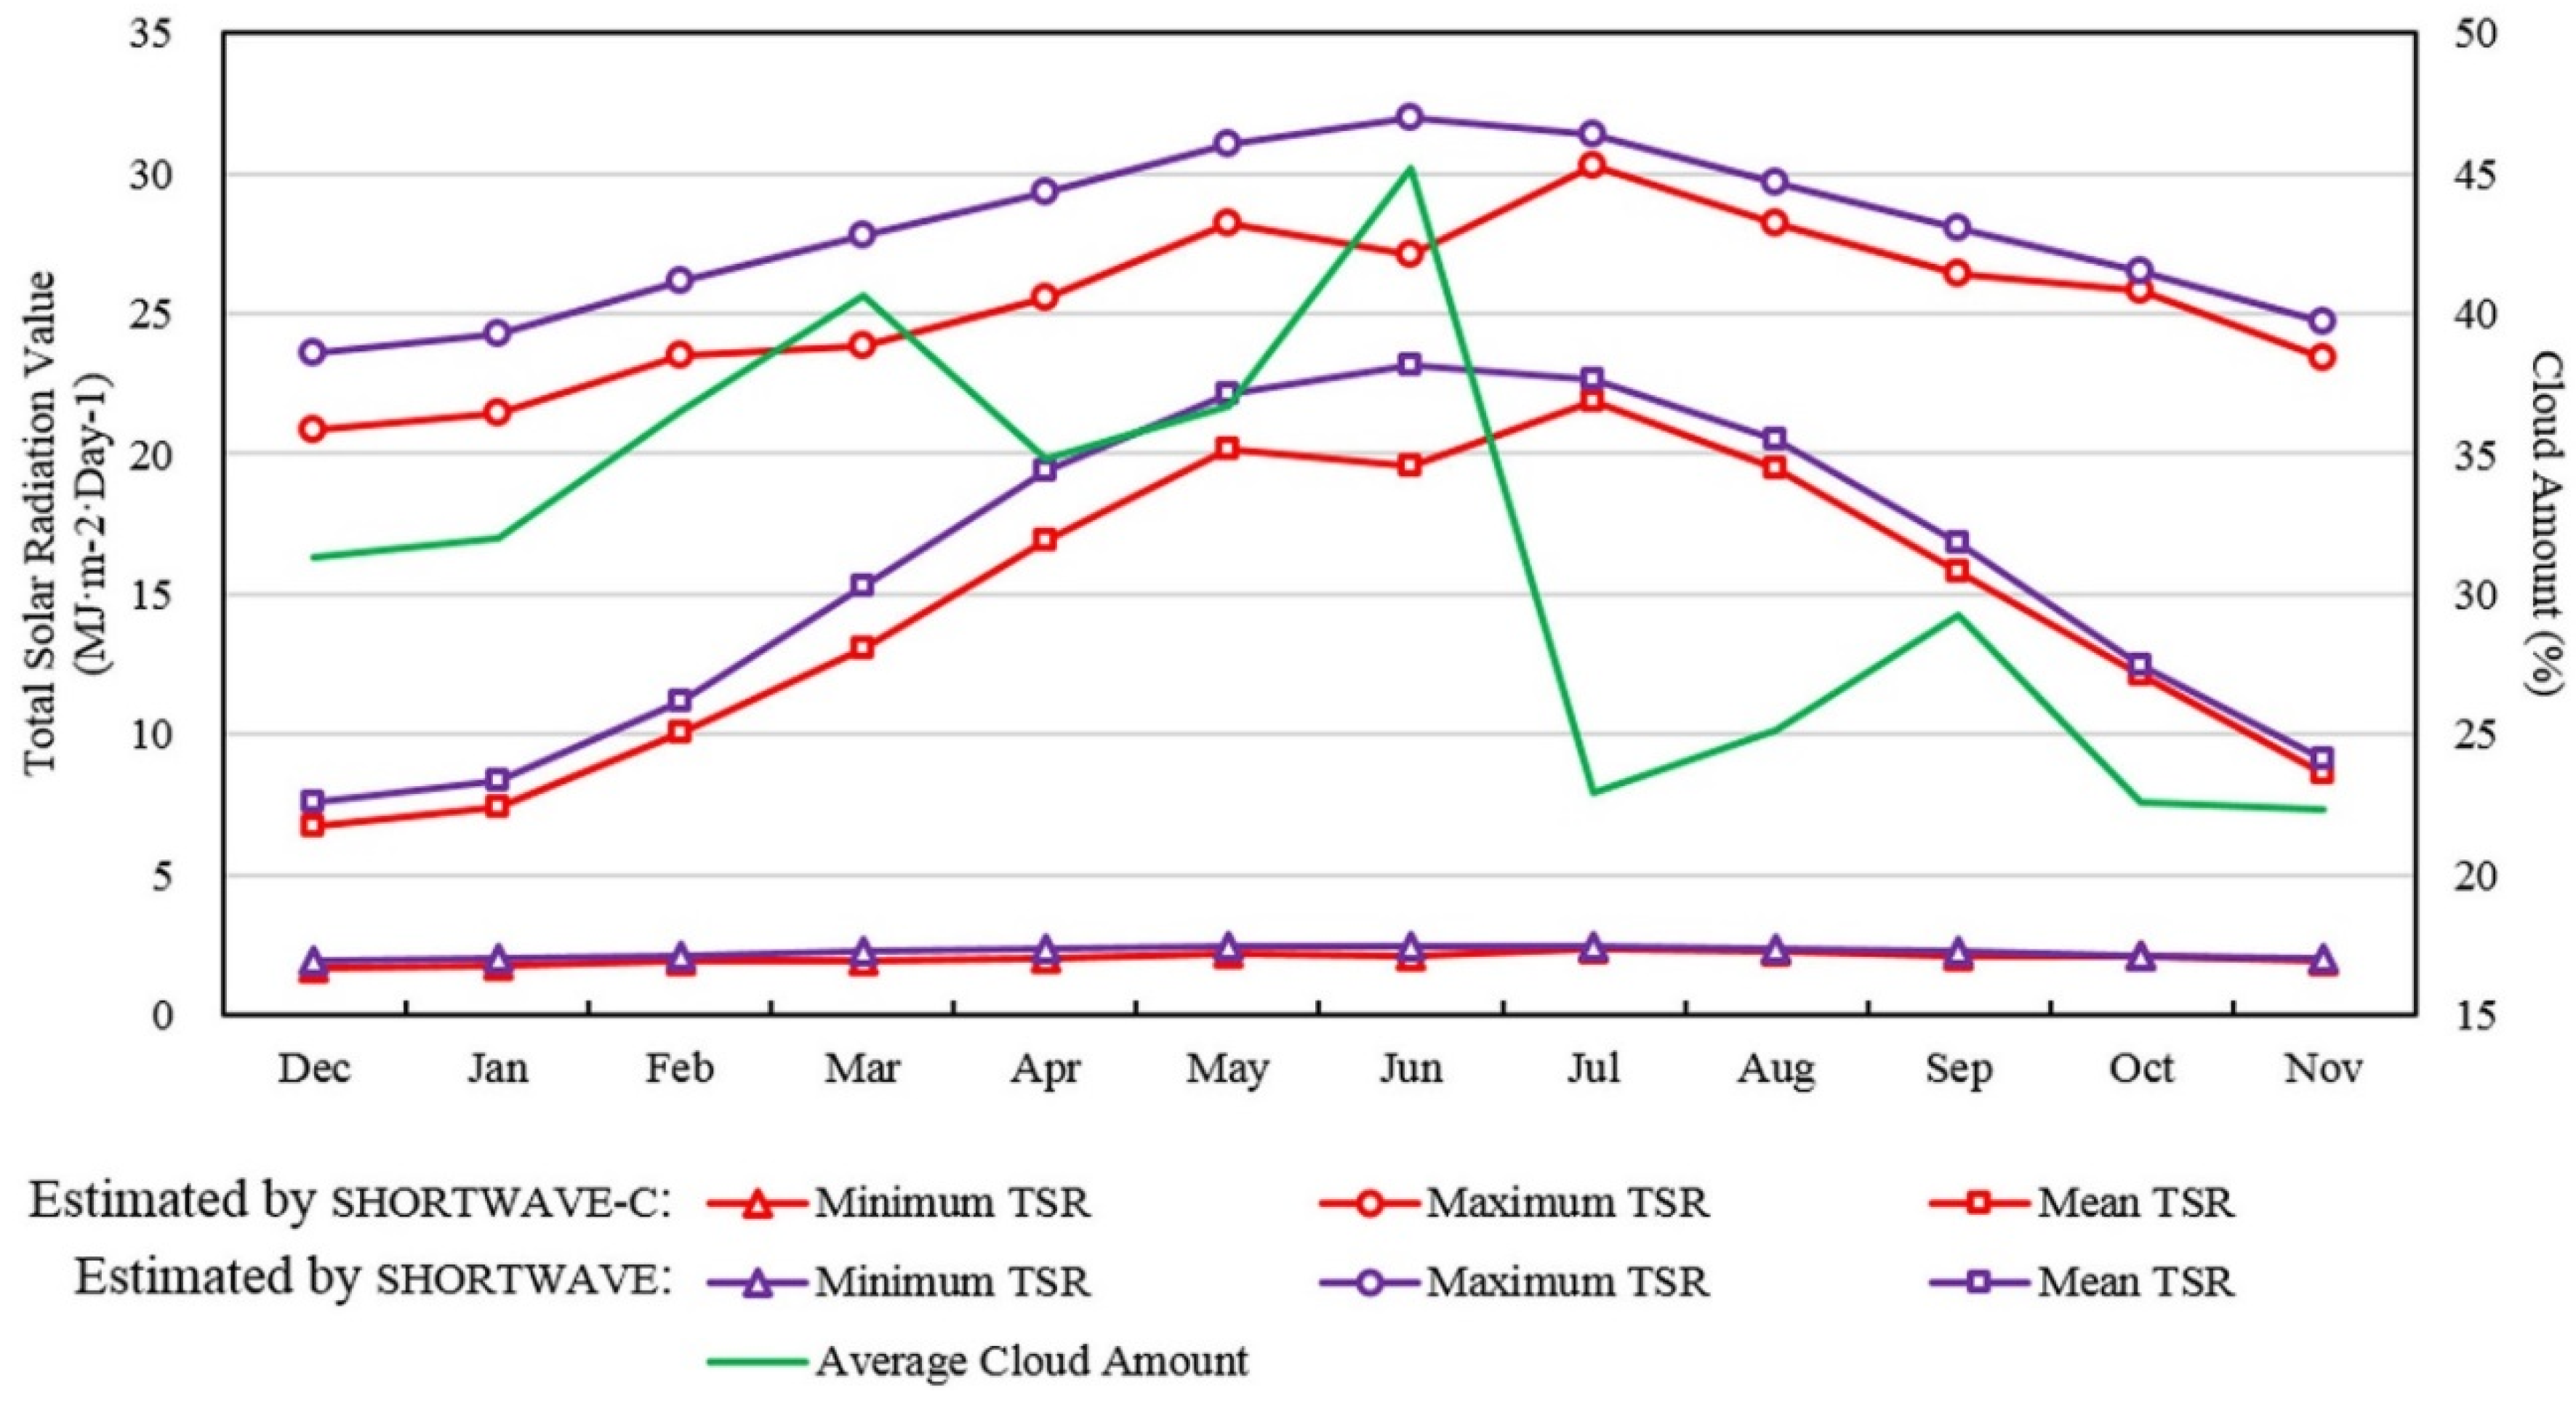
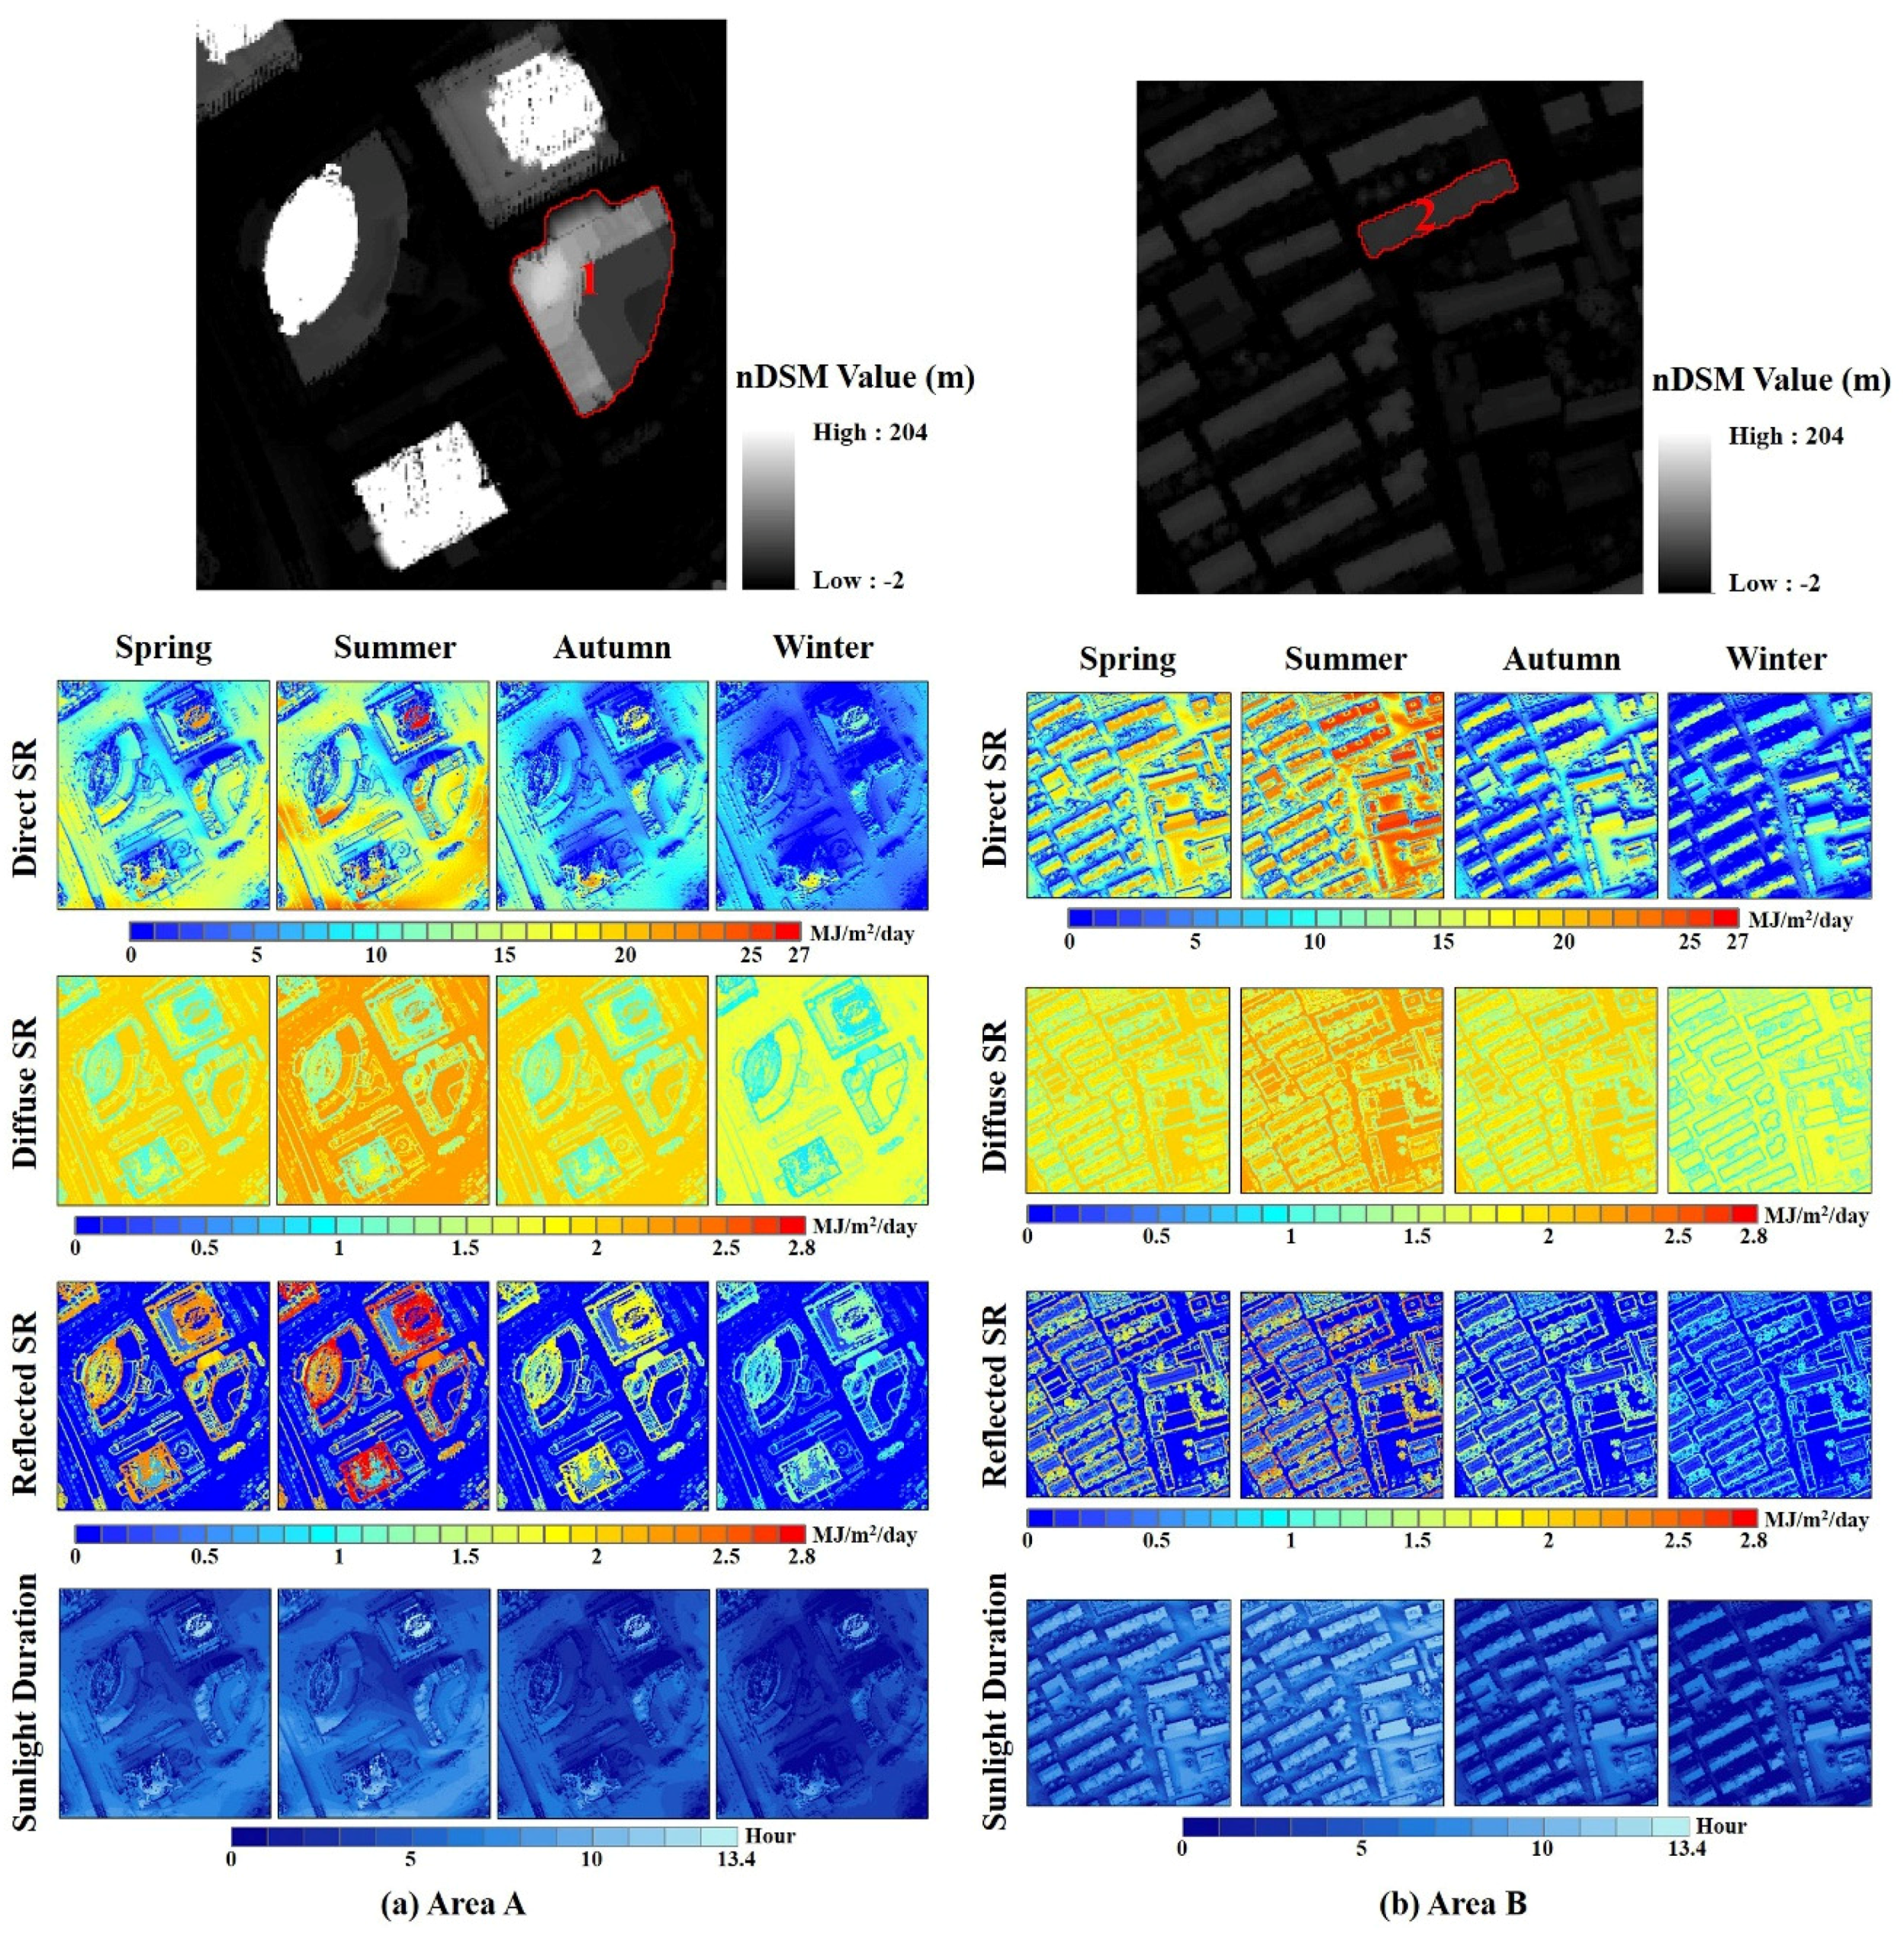
4.1. Spatio-Temporal Distribution of Solar Radiation

By employing the SHORTWAVE-C model and the DSM from airborne LiDAR data, we computed direct, diffuse, reflected solar radiation as well as the solar illumination duration for each grid cell for every 10 min from December 2012 to November 2013. The calculated radiations and durations are then summated from sunrise to sunset to obtain the total amount for one day. The daily solar radiation are further summated to get monthly and seasonal average radiation intensity. Figure 3 shows the spatial distribution of monthly average total solar radiation (including direct, diffuse, and reflected radiation) for the Lujiazui region. To analyze the cloud influence on total solar radiation, we also calculated the seasonal mean total solar radiation simulated by using the SHORTWAVE model, and compared the radiation with the amount obtained from the SHORTWAVE-C model (Figure 4).
Figure 3. Monthly average total solar radiation distribution estimated by SHORTWAVE-C model in the Lujiazui region.
Remotesensing 07 15877 g003
Figure 4. Seasonal average total solar radiation distribution estimated by SHORTWAVE-C model and SHORTWAVE model in the Lujiazui region.
Remotesensing 07 15877 g004
As shown in Figure 3, the total solar radiation in the Lujiazui region shows a relatively large variation from January to December, with the largest mean solar intensity in July (21.8 MJ/m2/day) and the lowest mean intensity in December (6.7 MJ/m2/day). The average total solar radiation in July is over three times the amount in December. For the whole year, direct radiation is the most predominant component, generally accounting for 85.4% of the total solar radiation. In contrast, the reflected radiation only makes up less than 2.4% of the total amount, which is the smallest component between these three radiation sources. The contribution of the diffuse radiation ranges from 12.1% in July and 26.6% in December, showing an increasing trend from warmer months to colder months.
Solar radiation under cloudy condition displays a similar seasonal pattern to that simulated under clear-sky condition, with the highest radiation intensity in summer, and the lowest amount in winter over a year round (Figure 4). However, the total solar radiation under cloudy condition is generally lower than that estimated under clear-sky condition, especially in spring and summer. To investigate the influence from cloud on the total solar radiation, we summarized the monthly minimum, maximum, and average total solar radiation calculated by SHORTWAVE and SHORTWAVE-C model, as well as the cloud amount for each month (Figure 5). The minimum radiation value of each month in one year is close to 0 MJ/m2/day. It indicates that some street canyons between high-rise buildings in Lujiazui region cannot receive any incident sun light, even in the summer months when this region receives very intense solar radiation. The maximum total radiation amount shows a similar pattern to the average total radiation, both under clear-sky condition and cloudy condition. Because the SHORTWAVE-C model takes cloud influence into account, solar radiation simulated by this model is generally lower than that obtained from the SHORTWAVE model. This difference is positively associated with cloud amount. Particularly in June when the cloud amount reaches its maximum value (45.2%) all over the year, the average solar radiation under cloudy condition is 3.6 MJ/m2/day lower than that under clear-sky condition. Besides, if we do not consider the cloud influence, the most intense total solar radiation received by the Lujiazui region is in June. However, due to the highest amount of cloud in June, the solar radiation actually reaching the land surface is lower than that in July.
To evaluate the accuracy of our simulation radiance, we compared our results under both cloudy and clear-sky conditions with in situ solar radiation measurements at the Shanghai meteorological station, which is located near the study site. We analyzed the monthly average observations and monthly average simulations from December 2012 to November 2013, and then calculated the Root Mean Squared Error (RMSE) and mean error. Linear regression is also used to obtain the coefficient of determination (R2) between the simulated radiation and in situ radiation (Figure 6). The results show that the R2 between simulated value and in situ observations are 0.72 for SHORTWAVE-C and 0.62 for SHORTWAVE. The RMSE values for SHORTWAVE-C and SHORTWAVE are 2.8 MJ/m2/day and 4.1 MJ/m2/day, respectively. The mean error for cloudy results is 0.8 MJ/m2/day, which is 1.4 MJ/m2/day lower than clear-sky results. This indicates that the reliability and accuracy of our solar radiation simulated by the SHORTWAVE-C model are significantly better than clear-sky solar estimates.
Figure 5. Monthly average total solar radiation simulated by SHORTWAVE-C and SHORTWAVE models, and monthly cloud amount in the Lujiazui region.
Remotesensing 07 15877 g005
Figure 6. Comparison of in situ monthly total solar radiation and simulated monthly total solar radiation from December 2012 to November 2013. (a) Comparison with total solar radiation simulated by SHORTWAVE-C; (b) Comparison with total solar radiation simulated by SHORTWAVE.
Remotesensing 07 15877 g006
The spatial distribution of solar radiation in the Lujiazui region is largely influenced by complex urban morphology (Figure 3 and Figure 4). For the open space consisting of streets and open plots with sparsely distributed trees, the spatial variation of solar radiation is quite small, although the radiation shows apparent monthly and seasonal variations. In contrast, the dense skyscrapers and high-rise buildings obstruct sunlight, creating long shades and shadows in business districts and residential areas, especially in winter months when the sun is located at a lower solar elevation angle. The solar radiation intensity received by skyscraper and residential building rooftops is different. Due to the complex shape of the skyscraper rooftop itself and the different heights of the surrounding tall buildings, the solar radiation on the skyscraper rooftop is different. In this case, parts of the skyscraper rooftop might be in shadow while other parts are in sunlight. However, solar radiation on residential building rooftops has moderate spatial variation for all seasons because of the relatively simple and regular structures.
Figure 7. The direct, diffuse, reflected solar radiation and sunlight duration for four seasons in two sample areas: Area A (31°14′21′′N-31°14′28′′N, 121°30′10′′E-121°30′18′′E) and Area B (31°14′15′′N-31°14′20′′N, 121°30′25′′E-121°30′32′′E).
Remotesensing 07 15877 g007
To quantitatively illustrate the spatio-temporal variations of solar radiation on different building rooftops, two sample areas, Area A and Area B in the Lujiazui region were selected, as shown in Figure 1. Area A is a typical business district consisting of dense skyscrapers and high-rise buildings. Area B is a part of residential district and with mid-rise buildings as major elements. Since we focused on the radiance intensity on building rooftops, we also identified two building roofs, roof 1 in Area A and roof 2 in Area B, to analyze the solar radiation variation. The direct, diffuse, and reflected solar radiance, as well as the daily sunlight duration were summarized for four seasons within these two sample areas (Figure 7). The results show that the direct radiation is the most important radiation component both for skyscraper and residential rooftops over the four seasons. However, the residential building rooftops can receive more direct sun light and longer hours of sun illumination than skyscraper rooftops. In summer, the direct radiance amount on rooftop 2 is 19.9 MJ/m2/day, more than 1.7 times higher than that received on rooftop 1. The difference of average daily solar illumination duration is over 4 h between roof 1 and roof 2. This is because the building heights in the residential district are more similar than those in the business district. The smaller height difference between them allows the roof surfaces to receive more direct solar energy, avoiding shadows cast by nearby higher-rise buildings. In addition, most of the street canyons and building boundaries in the business and residential district show relatively lower direct solar radiation and short periods of illumination duration. Since diffuse radiation is the indirect radiance intensity scattered by atmospheric constituents, the skyscrapers and residential building rooftops show similar diffuse intensity during all four seasons. Higher diffuse radiation is found on roof planar surfaces while a lower value is found on building boundaries. In contrast, although the dense skyscrapers block direct sunlight, they contribute to a higher reflected radiance than that on residential rooftops. Even in winter, the reflected radiation of rooftop 1 accounts for 8.9% of the total solar radiation, presenting a higher percentage (+6.1%) in comparison with that of rooftop 2. This indicates that the distance and height difference between neighboring buildings, as well as the rooftop structure itself are important for the roof solar energy estimation and thermal environment analysis in down town areas.

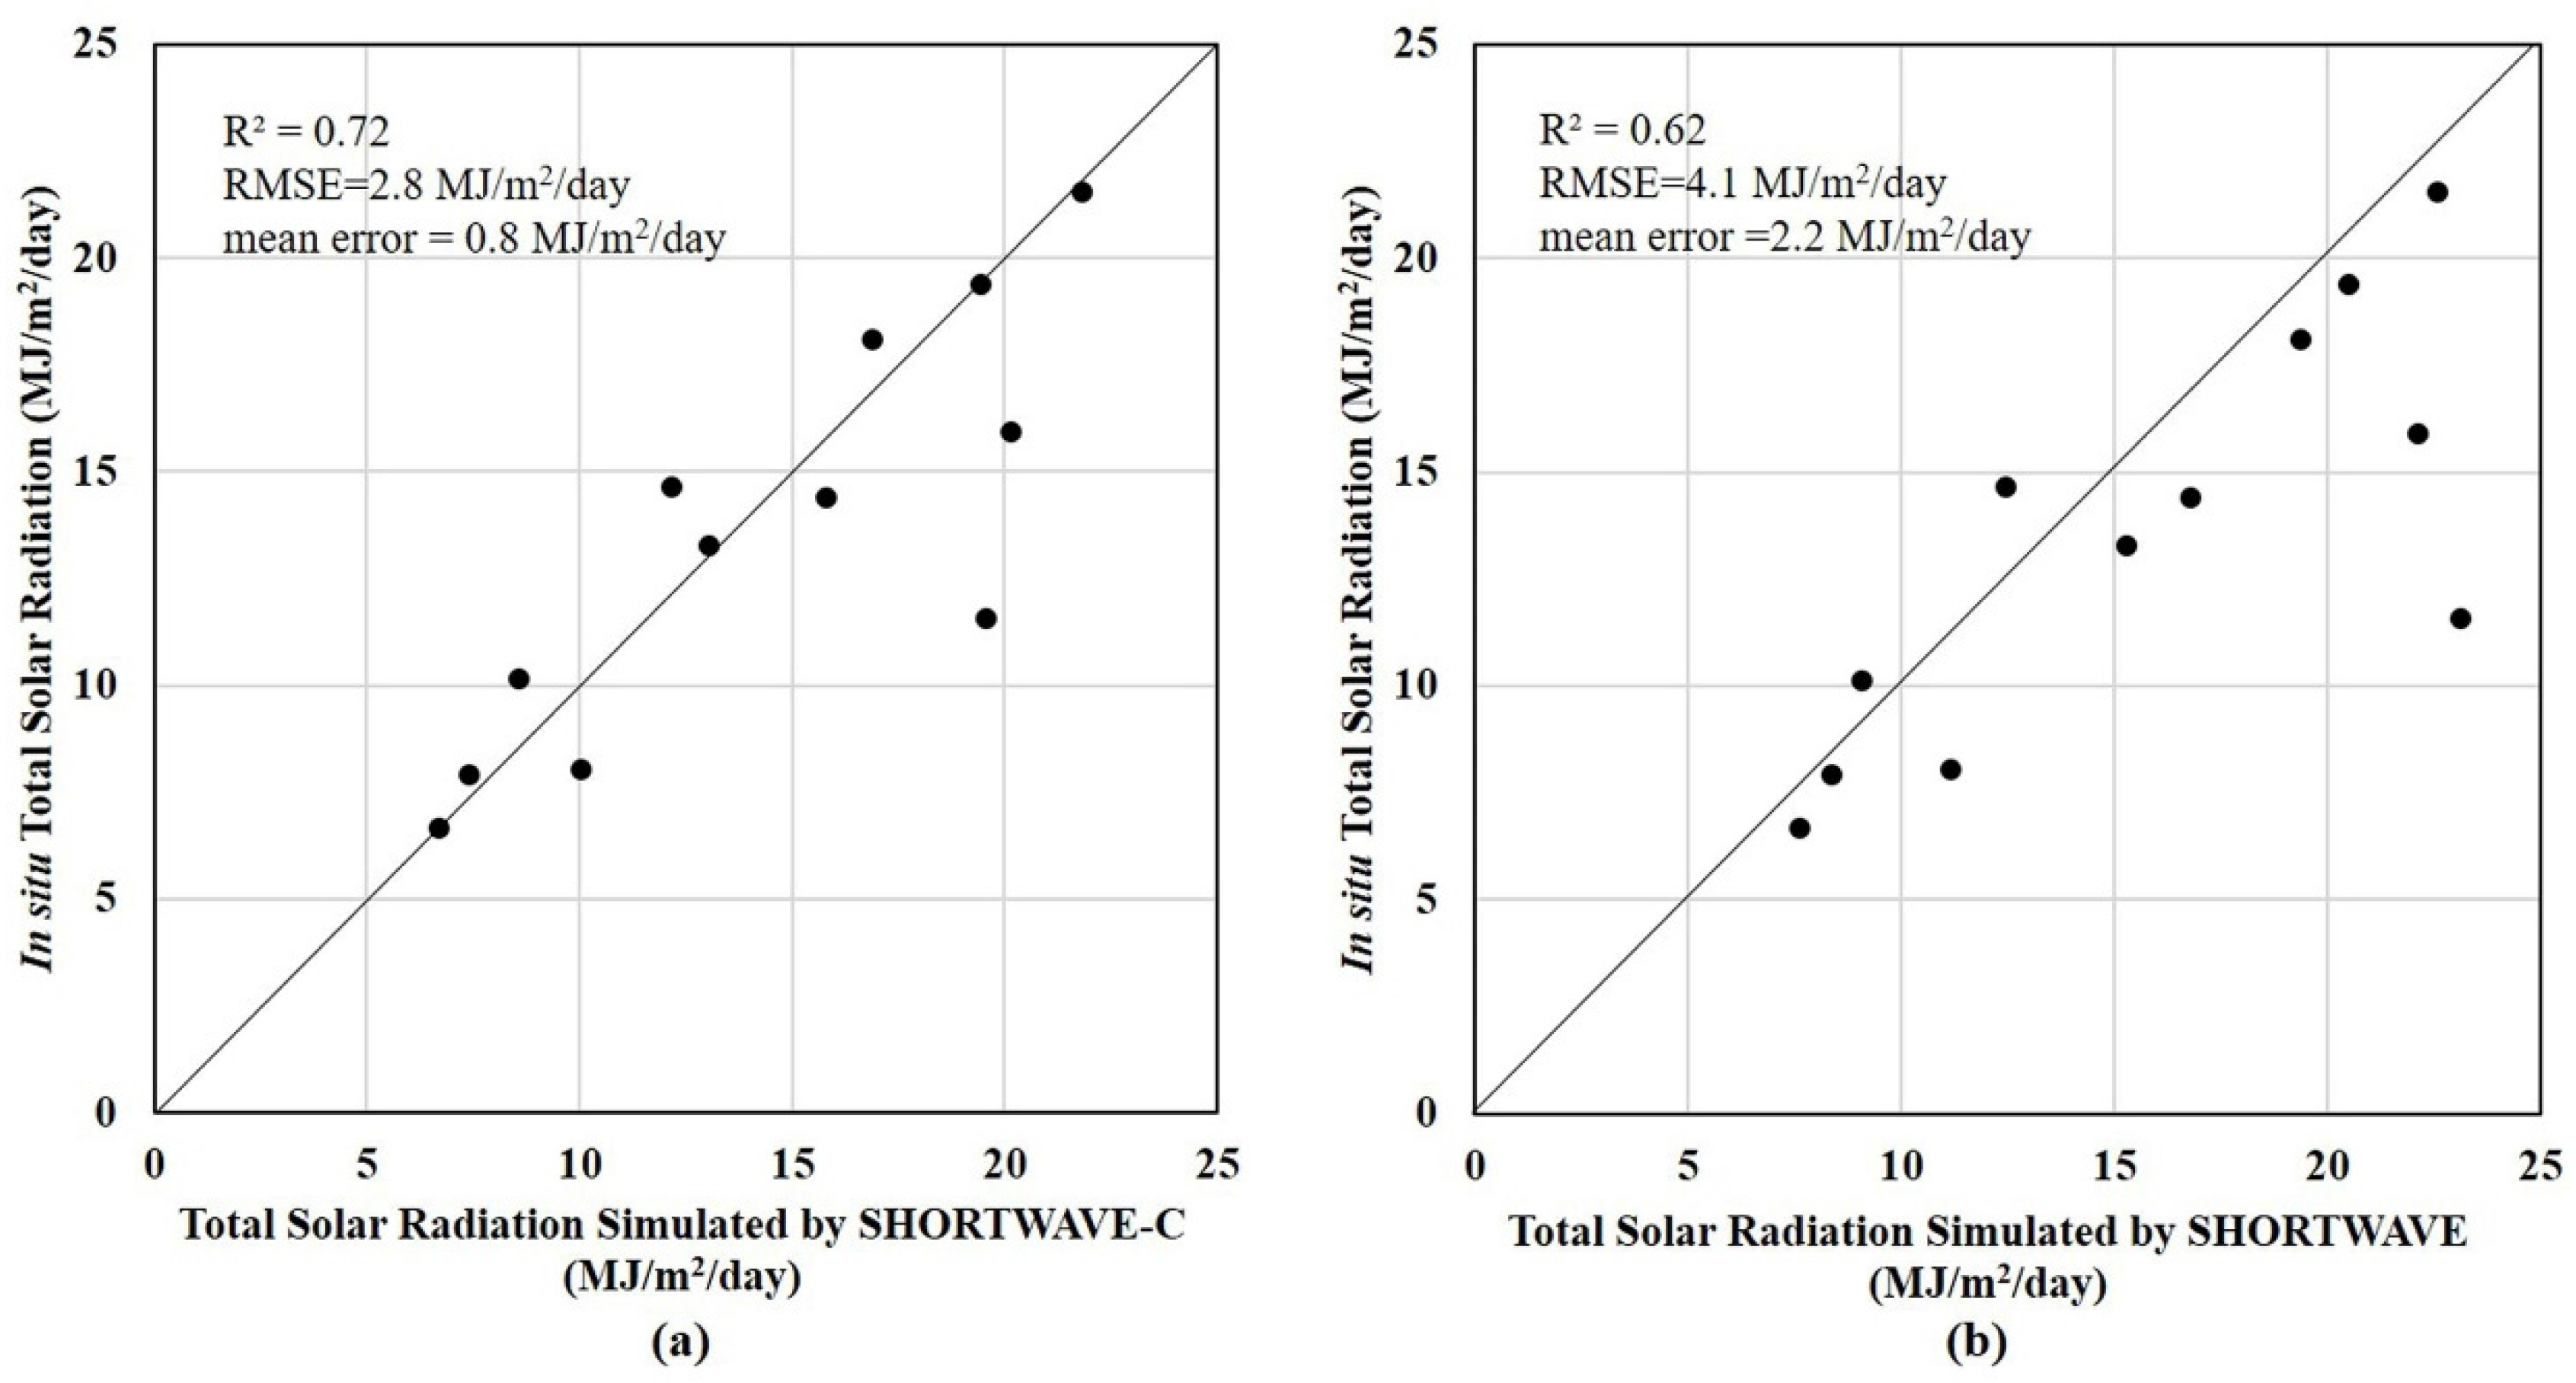
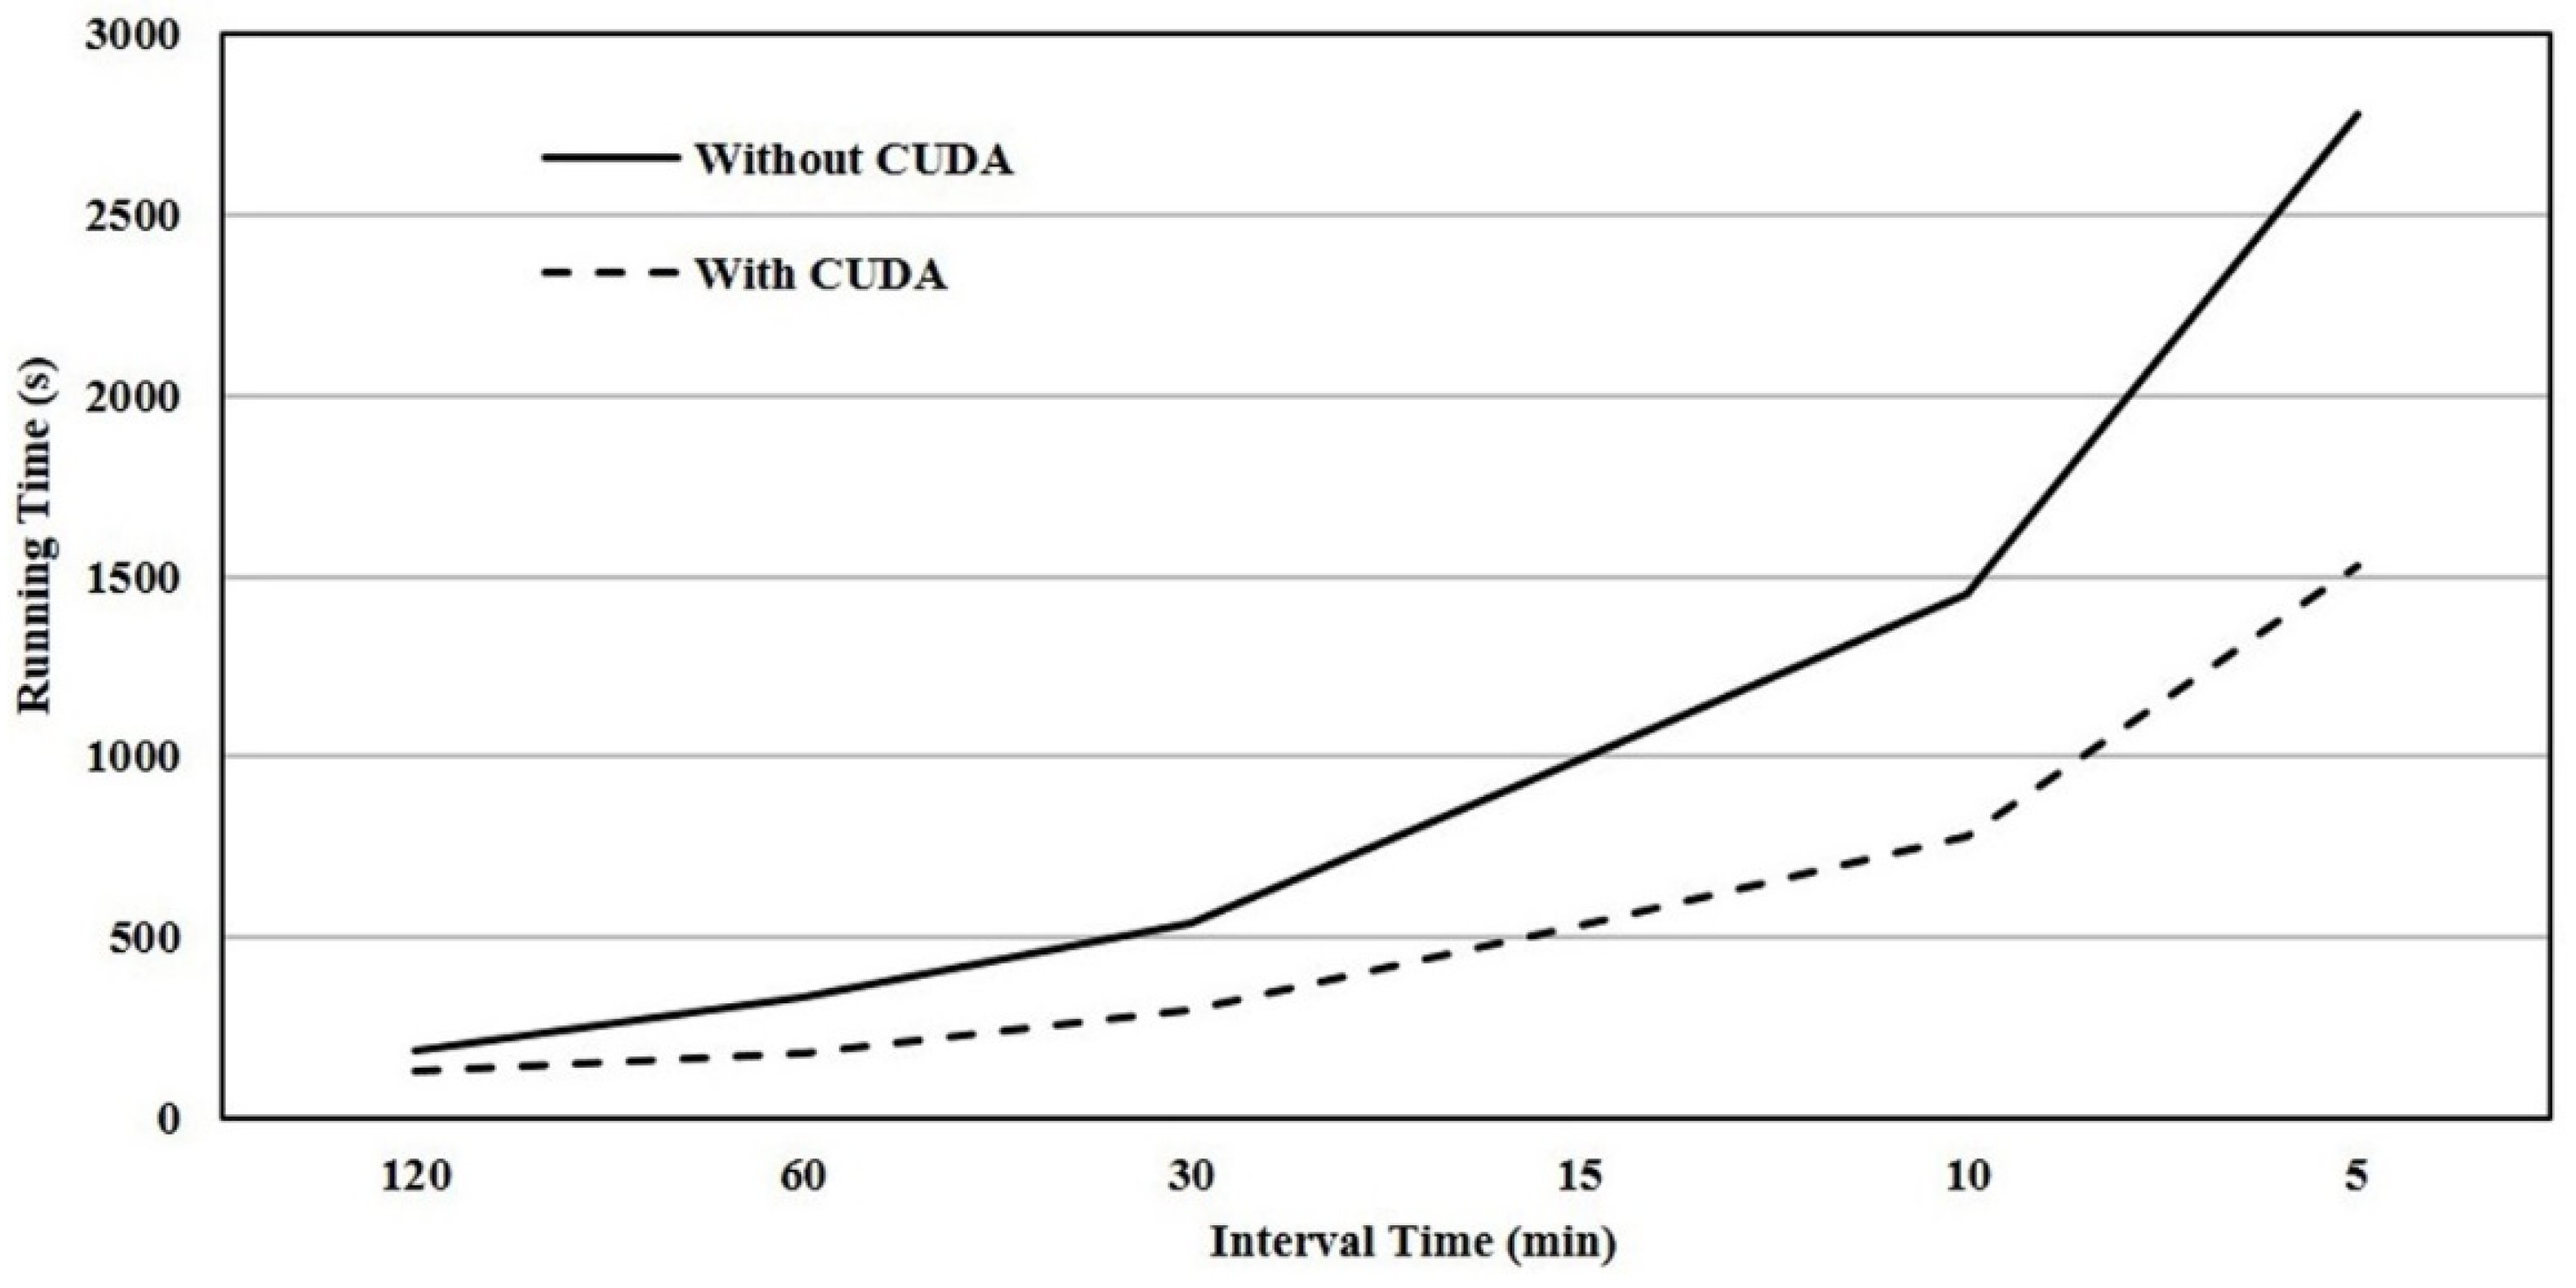
4.2. Efficiency of GPU-Accelerated Solar Radiation Model

A general-purpose personal computer is used to test the parallel computational efficiency. The computer has an Intel Core™ 2 Quad CPU Q9400 (four cores and max clock rate is at 2.66 GHz), an NVIDIA GeForce GTX 650 GPU Card with 384 cores and 1024 MB global memory, and Windows 7 Ultimate 64-bit Operation System. We computed solar radiation for one day (1 July 2013) using six different time intervals ( Δ T = 5, 10, 15, 30 60 and 120 min), then compared the running time and speedup ratio with or without CUDA, as shown in Table 2. Speedup ratio defines the ratio between the speedup time (running time difference) with CUDA and running time duration without CUDA. A chart (Figure 8) was plotted to illuminate the relationship between the interval time and the running time.
Both Table 2 and Figure 8 indicate that using CUDA can significantly improve the computational power and increase computational efficiency. The CUDA is able to save more time as the interval time decreases. When using 120 min as the interval time, the speedup ratio is around 32.2%. While it reaches 46.3% when we select 10 min as time interval, which is 14.1% higher than 120 min. The speedup ratio increases quickly when the interval time is larger than 60 min and becomes steady around 45%~46% when the interval time is less than 60 min. Lukač and Žalik [37] tested their GPU and multi-core CPU approach on 0.73 km2 part of Maribor city in Slovenia. When they used 15 min time step and 1 m2 per cell resolution, the speedup (the ratio between the running time for CPU processors and GPU processors) was 37 times. In our case, when we used 15 min interval time and 1 m2 (1 m × 1 m) per cell resolution on the 3 km2 downtown Shanghai, the speedup was only about 1.9 times. The possible reason for this lower speedup ratio might be that our solar radiation model called hillshade analysis using ArcPy in ArcGIS for each time interval and cannot work in CUDA framework (Figure 2). Thus, most of the time cost in our model is to perform hillshade analysis multiple times a day. In the future, we will try to implement hillshade analysis in GPU to improve the calculation efficiency.
Table 2. Running time with or without Compute Unified Device Architecture (CUDA) and speedup ratio.
Interval Time (min)Running Time (s)Speedup Ratio (%)
Without CUDAWith CUDA
120187.896127.40732.2
60331.692181.38545.3
30537.467297.85844.6
15991.275530.28546.5
101447.410776.73146.3
52778.0641529.49144.9
Figure 8. Trend of running time with or without Compute Unified Device Architecture (CUDA).
Remotesensing 07 15877 g008

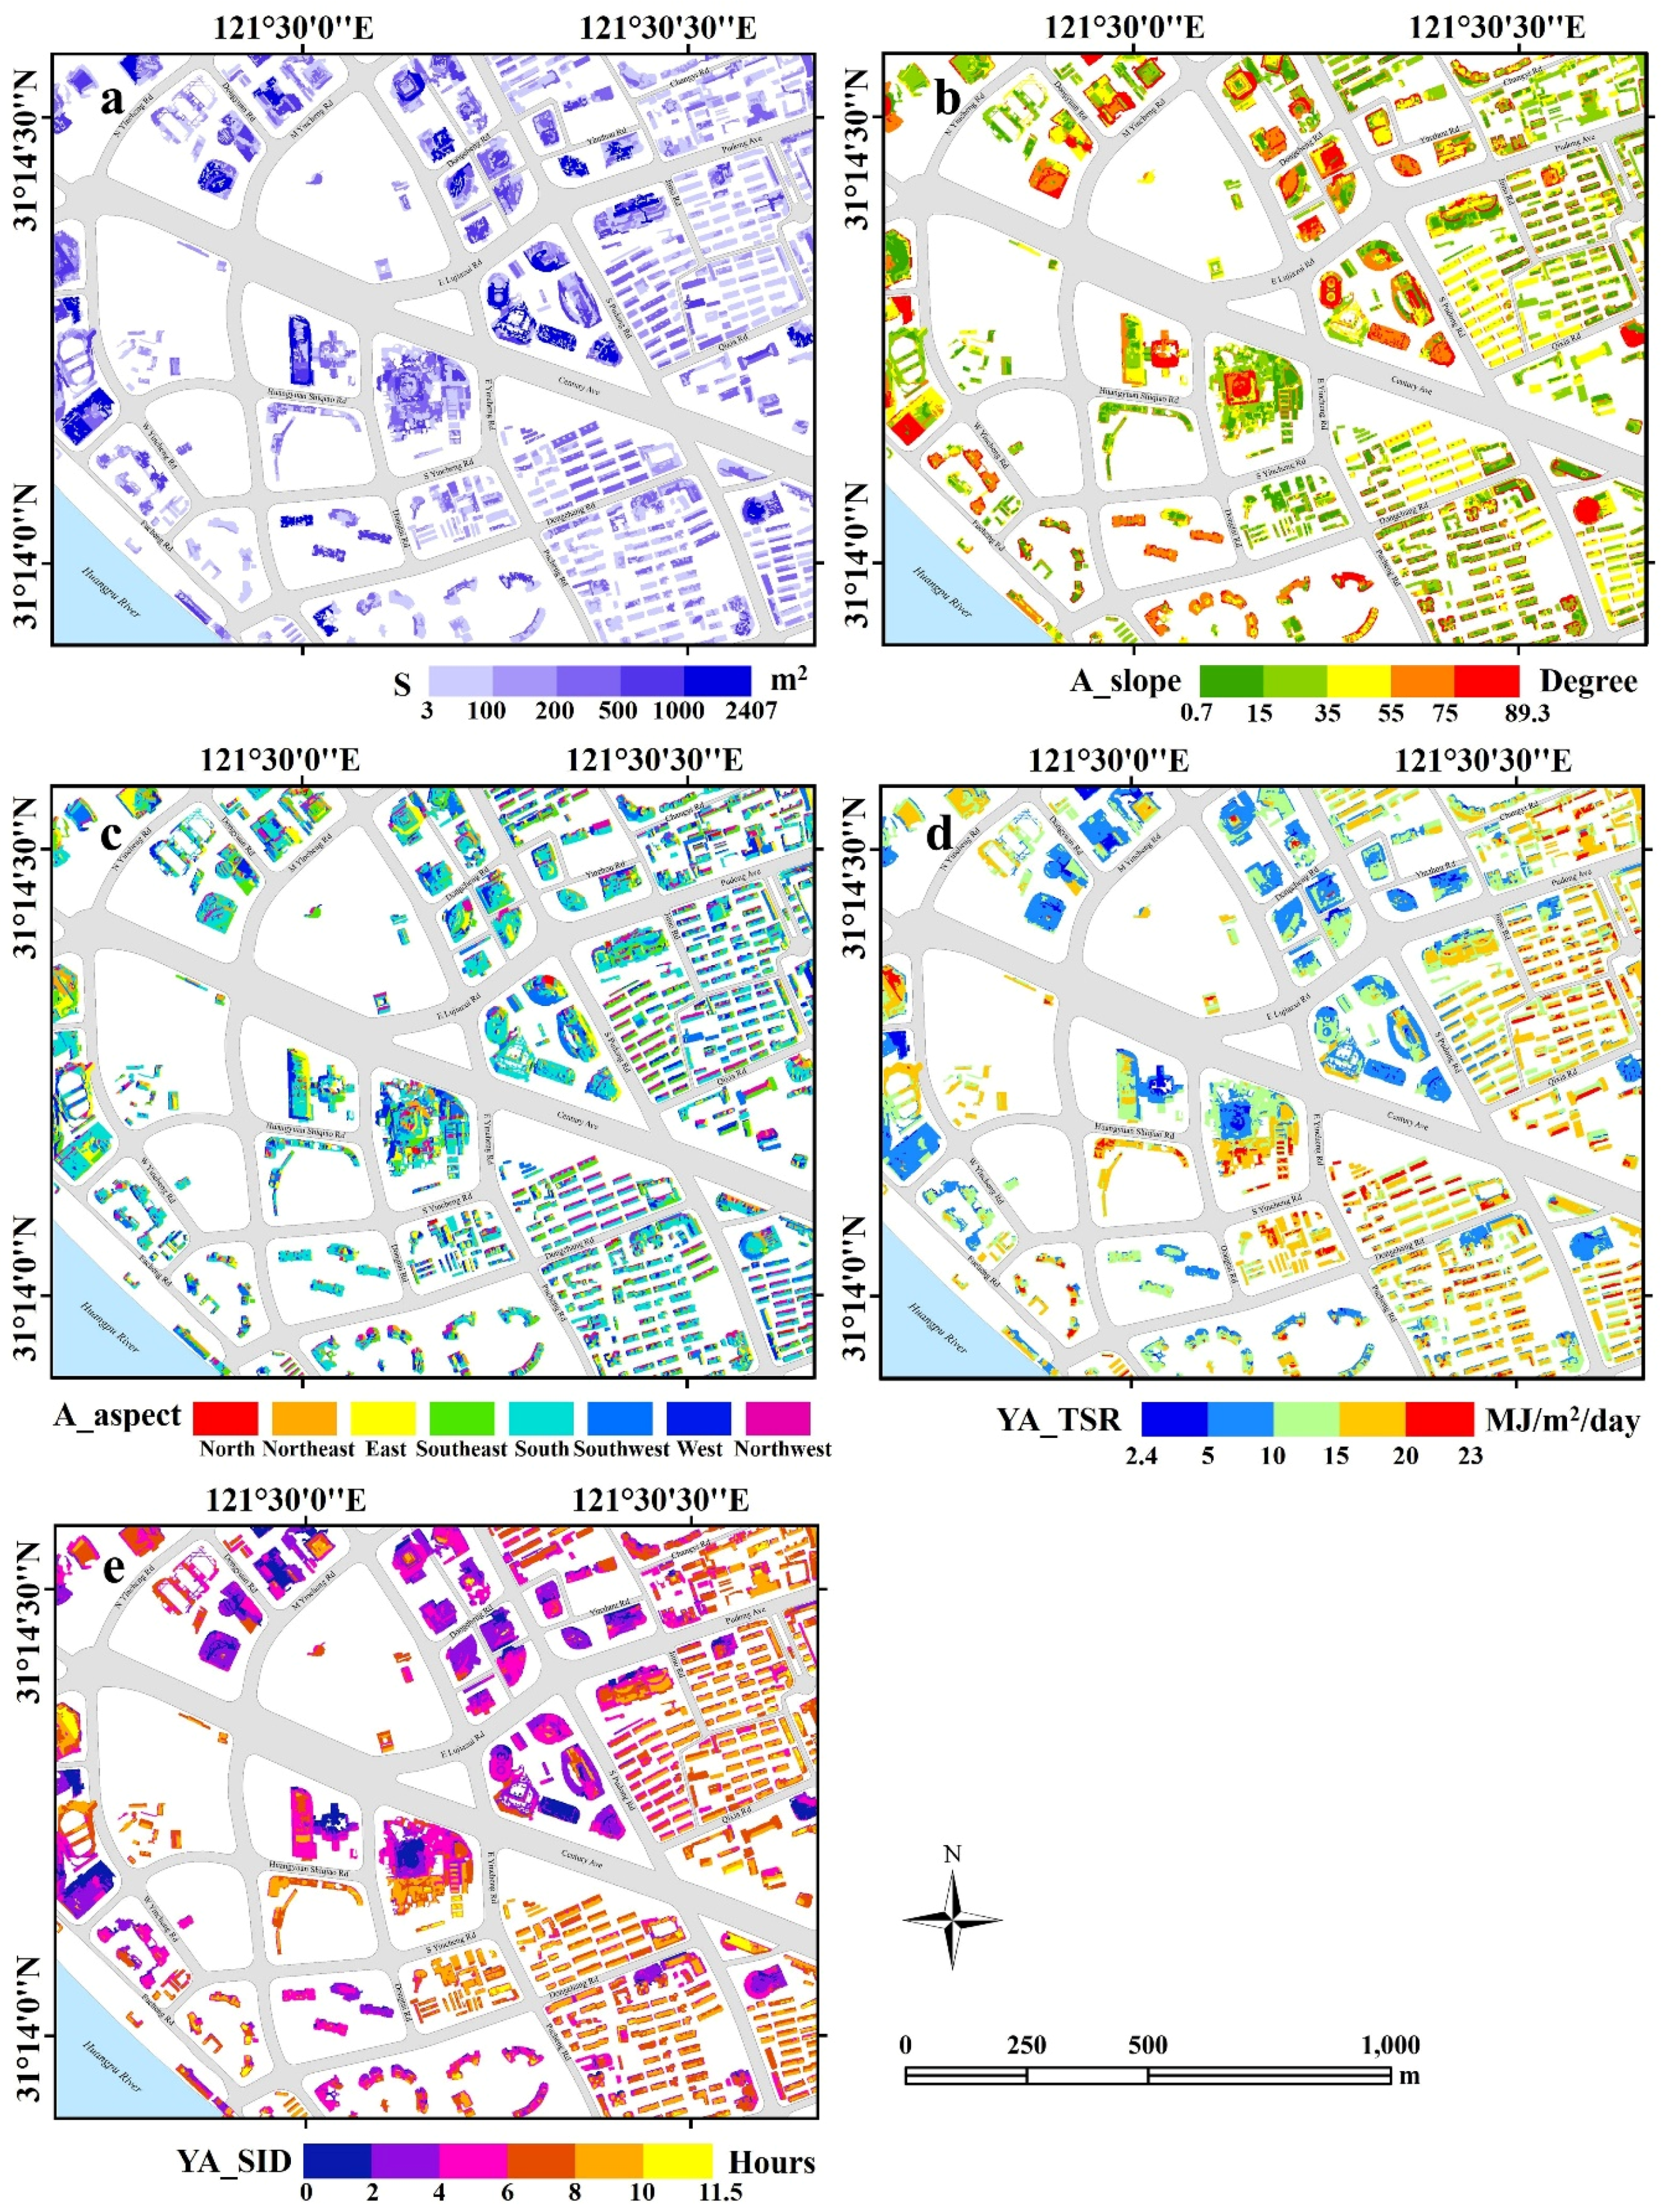
4.3. Suitable Roofs for Utilization of Solar Energy in the Lujiazui Region

A total of 7698 roof planes were identified in the Lujiazui region. To help determine selection requirements for solar panels, we summarized and mapped the area, average slope, average aspect, yearly average total solar radiation, and yearly average solar illumination duration of individual roof planes within the Lujiazui region (Figure 9). The roof planes area varies from 3 m2 to 2407 m2, with larger plane area in skyscrapers near N Yincheng Rd, Dongyuan Rd, M Yincheng Rd, Dongcheng Rd, E Lujiazui Rd, and Huangyuan Shiqiao Rd (Figure 9a). For most of the residential buildings, their roof plane slope ranges from 0.7 degree to 55 degree, showing smaller variations compared to skyscrapers roof planes (Figure 9b). The mean aspect of roof planes illustrates that the skyscraper roof tops have a more complicated structure than traditional buildings (Figure 9c). In addition, the roof planes of residential buildings present higher solar radiation (+5~10 MJ/m2/day) and longer illumination duration (+2~4 h) than high-rise buildings located in business districts (Figure 9d,e). Table 3 shows the minimum, maximum, and mean value of roof plane area, slope, yearly total solar radiation, and yearly average solar illumination duration in the Lujiazui region. A set of appropriate threshold values was determined to choose suitable roof planes for enhancing the utilization of solar energy, as mentioned in Part 2 Section 3.
Figure 10 shows the distribution and yearly average total solar radiation of suitable roof planes in the Lujiazui region. 1729 roof planes were selected by considering desirable plane area, slope, aspect, solar radiation intensity, and solar illumination duration. Most of the sunward planes on residential rooftops were identified as desirable positions to install solar panels, especially for the residential districts near Jimo Rd, S Pudong Rd, Qixia Rd, Dongchang Rd, and Pucheng Rd. The yearly average solar radiance in these areas reaches as high as 18–23 MJ/m2/day. In contrast, there are less suitable roof planes on skyscraper rooftops because of the steeper slope and changing orientation. Besides that, as we discussed before, the larger height differences between high-rise buildings in business districts often block direct sun light, causing long shades and shadows on street canyons and maybe parts of the rooftops. Thus, the skyscraper roof planes cannot receive more solar radiance than residential rooftops. The selection results would be useful for providing strategies to improve energy efficiency in the urban environment.
Figure 9. Five parameters of roof planes for identifying suitable places for rooftop solar panel installation in the Lujiazui region. (a) Area (S); (b) Average slope (A_slope); (c) Average aspect (A_aspect); (d) Yearly average total solar radiation (YA_TSR); and (e) Yearly average solar illumination duration (YA_SID).
Remotesensing 07 15877 g009
Table 3. The minimum, maximum, and mean value for roof plane attributes in the Lujiazui region.
AttributesMinMaxMean
S (m2)3240753
A_slope (degree)0.789.344.6
YA_TSR (MJ/m2/day)2.423.013.3
YA_SID (hours)011.55.9
Figure 10. The distribution and yearly average total solar radiation of suitable roof planes in the Lujiazui region.
Remotesensing 07 15877 g010

5. Conclusions

Solar energy is becoming increasingly important as an alternative to traditional fossil fuel to deal with the worldwide energy crisis and environmental pollution. The potential of solar energy utilization in urban areas is largely influenced by solar position, atmospheric influence, complex urban 3D morphology, and the space available for mounting solar instruments. Thus, an efficient and accurate method to estimate solar radiation and select suitable places to install solar panels is fundamental in the urban environment. In this study, we proposed a GPU-based solar radiation model, named SHORTWAVE-C, to simulate solar radiation under various sky conditions. Cloud influence acquired from FengYun-2F meteorological satellite data was integrated into our solar flux model. The GPU acceleration method was utilized to improve the solar radiation calculation. Besides that, an object-based method was adopted to locate suitable roof planes for enhancing utilization of solar energy.
By using airborne LiDAR data along with hourly cloud amount data from FengYun-2F, we simulated direct, diffuse, and reflected solar radiation as well as the solar illumination duration in the Lujiazui region with consideration of cloud influence. Then we summarized monthly, seasonal, and yearly solar radiation, and compared our results with the radiation amount calculated under clear-sky condition. The monthly average total solar radiation shows a relatively large variation from January to December, with the highest radiation intensity in July (21.8 MJ/m2/day) and the lowest intensity in December (6.7 MJ/m2/day). Direct radiation is the predominant component over a year, contributing more than 85% to the total solar radiation. Since we took cloud amount into account, our estimation presents relatively lower total solar radiation compared with results under clear-sky condition, especially in spring and summer. In addition, complex urban 3D morphology plays an important role on the spatial distribution of solar radiation in the downtown area. Open space like streets and open plots can receive more direct sunlight, showing higher total solar radiation than other spaces. Since the skyscrapers and high-rise buildings obstruct sunlight and cause long shades and shadows, the street canyons among high-rise buildings often show relatively lower solar radiation, particularly in winter when the sun is located at a lower solar altitude angle. The solar radiation intensity on skyscraper rooftops and residential building rooftops is different. Due to the complex rooftop structure and large height difference among surrounding tall buildings, skyscrapers receive less direct sun light and shorter hours of solar illumination than residential buildings. However, they account for more than 6.1% reflected radiance compared with traditional buildings.
In our research, the GPU acceleration has proved to be a good solution to enhance the efficiency of solar radiation estimation. Using CUDA is able to save more computation time as interval time decreases. The speedup ratio reaches up to 46% when we use 10 min as interval time in our case. The results also show that the speedup ratio grows quickly if the interval time is larger than 60 min, but keeps steady (45%–46%) when the time step is less than 60 min.
An object-based method was adopted to segment roof planes and locate suitable planes for enhancing utilization of solar energy. In terms of suitable roof plane area, slope, aspect, total solar radiation, and solar illumination duration, 1729 roof planes were identified in the Lujiazui region. The spatial distribution of suitable locations for solar planes shows that the desirable positions are mostly located on the sunward roof planes in residential districts. The yearly average total solar radiation of those roof planes is more than 16 MJ/m2/day. There are less suitable roof planes on skyscrapers because of the complex rooftop structure and lower solar radiation received on their rooftops. This study provides useful strategic guidelines for urban energy planning and sustainable development.
There are still some limitations in our study. FengYun-2F data have been collected since 2012, while our LiDAR data was collected in 2006. So we have to use the DSM in 2006 to simulate solar radiation in 2013, which might have some differences to the real elevation information in 2013. Besides that, although our GPU-based SHORTWAVE-C model is effective and efficient, it called the hillshade analysis function from ArcGIS for each time interval, which takes a much longer time than directly processing in GPU. In addition, we only employed five threshold-based criteria to select the suitable roofs for utilization of solar panels. In future research, we will try to adopt other algorithms for identifying desirable roof planes, such as machine learning and object-based classification.

Acknowledgments

This study is supported by the National Natural Science Foundation of China (No. 41471449 and No. 41301087), the Natural Science Foundation of Shanghai (No. 14ZR1412200), the Innovation Program of Shanghai Municipal Education Commission (No. 15ZZ026), and the Fundamental Research Funds for the Central Universities of China. The authors thank China National Satellite Meteorological Center for providing the FengYun satellite data and China Meteorological Data Sharing Service System for providing the in situ solar radiation measurements.

Author Contributions

Bailang Yu and Jianping Wu conceived and supervised this study. Yan Huang, Zuoqi Chen, Bin Wu, and Bailang Yu designed the data processing procedures. Yan Huang, Zuoqi Chen, Bin Wu, Weiqing Mao, Feng Zhao, and Junhan Wu processed the data. Yan Huang, Zuoqi Chen, Liang Chen, and Bailang Yu analyzed the results and wrote the paper.

Conflicts of Interest

The authors declare no conflict of interest.

References

  1. Van der Hoeven, M. World Energy Outlook 2013; International Energy Agency: Tokyo, Japan, 2013. [Google Scholar]
  2. Ramachandra, T.V.; Shruthi, B.V. Spatial mapping of renewable energy potential. Renew. Sustain. Energy Rev. 2007, 11, 1460–1480. [Google Scholar] [CrossRef]
  3. Bull, S.R. Renewable energy today and tomorrow. Proc. IEEE 2001, 89, 1216–1226. [Google Scholar] [CrossRef]
  4. Solangi, K.H.; Islam, M.R.; Saidur, R.; Rahim, N.A.; Fayaz, H. A review on global solar energy policy. Renew. Sustain. Enery Rev. 2011, 15, 2149–2163. [Google Scholar] [CrossRef]
  5. British Petrol. Statistical Review of World Energy 2013; British Petrol: London, UK, 2013. [Google Scholar]
  6. Hassan, M.A.; Beliveau, Y. Design, construction and performance prediction of integrated solar roof collectors using finite element analysis. Constr. Build. Mater. 2007, 21, 1069–1078. [Google Scholar] [CrossRef]
  7. Camargo, L.R.; Zink, R.; Dorner, W.; Stoeglehner, G. Spatio-temporal modeling of roof-top photovoltaic panels for improved technical potential assessment and electricity peak load offsetting at the municipal scale. Comput. Environ. Urban Syst. 2015, 52, 58–69. [Google Scholar] [CrossRef]
  8. Kumar, L.; Skidmore, A.K.; Knowles, E. Modelling topographic variation in solar radiation in a GIS environment. Int. J. Geogr. Inf. Sci. 1997, 11, 475–497. [Google Scholar] [CrossRef]
  9. Dubayah, R.; Rich, P.M. Topographic solar radiation models for GIS. Int. J. Geogr. Inf. Syst. 1995, 9, 405–419. [Google Scholar] [CrossRef]
  10. Robinson, D. Urban morphology and indicators of radiation availability. Sol. Energy 2006, 80, 1643–1648. [Google Scholar] [CrossRef]
  11. Li, D.H.W.; Wong, S.L. Daylighting and energy implications due to shading effects from nearby buildings. Appl. Energy 2007, 84, 1199–1209. [Google Scholar] [CrossRef]
  12. Levinson, R.; Akbari, H.; Pomerantz, M.; Gupta, S. Solar access of residential rooftops in four California cities. Sol. Energy 2009, 83, 2120–2135. [Google Scholar] [CrossRef]
  13. Zhai, X.Q.; Wang, R.Z. Experiences on solar heating and cooling in China. Renew. Sustain. Energy Rev. 2008, 12, 1110–1128. [Google Scholar] [CrossRef]
  14. Fu, P.; Rich, P.M. A geometric solar radiation model with applications in agriculture and forestry. Comput. Electron. Agric. 2002, 37, 25–35. [Google Scholar] [CrossRef]
  15. Barazzetti, L.; Brumana, R.; Oreni, D.; Previtali, M.; Roncoroni, F. True-orthophoto generation from UAV images: Implementation of a combined photogrammetric and computer vision approach. ISPRS Ann. Photogramm. Remote Sens. Spat. Inf. Sci. 2014, 1, 57–63. [Google Scholar] [CrossRef]
  16. Szabó, S.; Enyedi, P.; Horváth, M.; Kovács, Z.; Burai, P.; Csoknyai, T.; Szabó, G. Automated registration of potential locations for solar energy production with Light Detection And Ranging (LiDAR) and small format photogrammetry. J. Clean. Prod. 2015. [Google Scholar] [CrossRef]
  17. Gamba, P.; Houshmand, B. Digital surface models and building extraction: A comparison of IFSAR and LIDAR data. IEEE Trans. Geosci. Remote Sens. 2000, 38, 1959–1968. [Google Scholar] [CrossRef]
  18. Priestnall, G.; Jaafar, J.; Duncan, A. Extracting urban features from LiDAR digital surface models. Comput. Environ. Urban Syst. 2000, 24, 65–78. [Google Scholar] [CrossRef]
  19. Sun, S.; Salvaggio, C. Aerial 3D building detection and modeling from airborne LiDAR point clouds. IEEE J. Sel. Top. Appl. Earth Obs. Remote Sens. 2013, 6, 1440–1449. [Google Scholar] [CrossRef]
  20. Sun, S. Automatic 3D Building Detection and Modeling from Airborne LiDAR Point Clouds. Ph.D. Thesis, Institute of Technology, New York, NY, USA, 2013. [Google Scholar]
  21. Zhou, Q.Y.; Neumann, U. Fast and extensible building modeling from airborne LiDAR data. In Proceedings of the 16th ACM SIGSPATIAL International Conference on Advances in Geograpic Information Systems, Irvine, CA, USA, 5–7 November 2008; pp. 1–8.
  22. Lafarge, F.; Descombes, X.; Zerubia, J.; Pierrot-Deseilligny, M. Automatic building extraction from DEMs using an object approach and application to the 3D-city modeling. ISPRS J. Photogramm. Remote Sens. 2008, 63, 365–381. [Google Scholar] [CrossRef] [Green Version]
  23. Arefi, H. Levels of detail in 3D building reconstruction from LiDAR data. Int. Arch. Photogramm. Remote Sens. Spat. Inf. Sci. 2008, 37, 485–490. [Google Scholar]
  24. Huang, Y.; Yu, B.; Zhou, J.; Hu, C.; Tan, W.; Hu, Z.; Wu, J. Toward automatic estimation of urban green volume using airborne LiDAR data and high resolution remote sensing images. Front. Earth Sci. 2013, 7, 43–54. [Google Scholar] [CrossRef]
  25. Wu, B.; Yu, B.; Yue, W.; Shu, S.; Tan, W.; Hu, C.; Huang, Y.; Wu, J.; Liu, H. A voxel-based method for automated identification and morphological parameters estimation of individual street trees from mobile laser scanning data. Remote Sens. 2013, 5, 584–611. [Google Scholar] [CrossRef]
  26. Yu, B.; Liu, H.; Wu, J.; Lin, W. Investigating impacts of urban morphology on spatio-temporal variations of solar radiation with airborne LIDAR data and a solar flux model: A case study of downtown houston. Int. J. Remote Sens. 2009, 30, 4359–4385. [Google Scholar] [CrossRef]
  27. Santos, T.; Gomes, N.; Freire, S.; Brito, M.; Santos, L.; Tenedório, J. Applications of solar mapping in the urban environment. Appl. Geogr. 2014, 51, 48–57. [Google Scholar] [CrossRef]
  28. Verso, A.; Martin, A.; Amador, J.; Dominguez, J. GIS-based method to evaluate the photovoltaic potential in the urban environments: The particular case of Miraflores de la Sierra. Sol. Energy 2015, 117, 236–245. [Google Scholar] [CrossRef]
  29. Martín, A.M.; Domínguez, J.; Amador, J. Applying LiDAR datasets and GIS based model to evaluate solar potential over roofs: A review. AIMS Energy 2015, 11, 326–343. [Google Scholar] [CrossRef]
  30. Jo, J.H.; Rose, Z.; Cross, J.; Daebel, E.; Verderber, A.; Kostelnick, J.C. Application of airborne LiDAR data and geographic information systems (GIS) to develop a distributed generation system for the town of normal, IL. AIMS Energy 2015, 3, 173–183. [Google Scholar] [CrossRef]
  31. Kim, D.; Ramanathan, V. Solar radiation budget and radiative forcing due to aerosols and clouds. J. Geophys. Res. Atmos. 2008, 113. [Google Scholar] [CrossRef]
  32. Tooke, T.R.; Coops, N.C.; Christen, A.; Gurtuna, O.; Prevot, A. Integrated irradiance modelling in the urban environment based on remotely sensed data. Sol. Energy 2012, 86, 2923–2934. [Google Scholar] [CrossRef]
  33. Kasten, F. The linke turbidity factor based on improved values of the integral rayleigh optical thickness. Sol. Energy 1996, 56, 239–244. [Google Scholar] [CrossRef]
  34. Lee, C.A.; Gasster, S.D.; Plaza, A.; Chang, C.I.; Huang, B. Recent developments in high performance computing for remote sensing: A review. IEEE J. Sel. Top. Appl. Earth Obs. Remote Sens. 2011, 4, 508–527. [Google Scholar] [CrossRef]
  35. Zhang, J.; You, S. High-performance quadtree constructions on large-scale geospatial rasters using GPGPU parallel primitives. Int. J. Geogr. Inf. Sci. 2013, 27, 2207–2226. [Google Scholar] [CrossRef]
  36. Hu, X.; Li, X.; Zhang, Y. Fast filtering of LiDAR point cloud in urban areas based on scan line segmentation and GPU acceleration. IEEE Geosci. Remote Sens. Lett. 2013, 10, 308–312. [Google Scholar]
  37. Lukač, N.; Žalik, B. GPU-based roofs’ solar potential estimation using LiDAR data. Comput. Geosci. 2013, 52, 34–41. [Google Scholar] [CrossRef]
  38. Feng, Y.; Guo, R.; Cheng, Y. Research on three dimentional city model reconstruction based on LiDAR. Geomat. Spat. Inf. Technol. 2008, 31, 8–11. (In Chinese) [Google Scholar]
  39. Zhang, K.; Chen, S.; Whitman, D.; Shyu, M.; Yan, J.; Zhang, C. A progressive morphological filter for removing nonground measurements from airborne LiDAR data. IEEE Trans. Geosci. Remote Sens. 2003, 41, 872–882. [Google Scholar] [CrossRef]
  40. Hu, Z.; Wu, J.; Wu, B.; Shu, S.; Yu, B. Simulating and mapping the variations of solar radiation at the Lujiazui region of shanghai using airborne LiDAR data. In Proceedings of the 2010 International Conference on Remote Sensing, Hangzhou, China, 5–6 October 2010; pp. 305–308.
  41. Huang, Y.; Yu, B.; Hu, Z.; Wu, J.; Wu, B. Locating suitable roofs for utilization of solar energy in downtown area using airborne LiDAR data and object-based method: A case study of the Lujiazui region, Shanghai. In Proceedings of the 2012 Second International Workshop on Earth Observation and Remote Sensing Applications (EORSA), Shanghai, China, 8–11 June 2012; pp. 322–326.
  42. Zimmermann, N.E. Calculation of Direct Solar Radiation (n-lat_ corrected). Available online: http://www.wsl.ch/staff/niklaus.zimmermann/programs/aml.html (accessed on 20 October 2007).
  43. Redweik, P.; Catita, C.; Brito, M. Solar energy potential on roofs and facades in an urban landscape. Sol. Energy 2013, 97, 332–341. [Google Scholar] [CrossRef]
  44. Ruiz-Arias, J.A.; Tovar-Pescador, J.; Pozo-Vázquez, D.; Alsamamra, H. A comparative analysis of DEM-based models to estimate the solar radiation in mountainous terrain. Int. J. Geogr. Inf. Sci. 2009, 23, 1049–1076. [Google Scholar] [CrossRef]
  45. Antonic, O. Modelling daily topographic solar radiation without site-specific hourly radiation data. Ecol. Model. 1998, 113, 31–40. [Google Scholar] [CrossRef]
  46. Kreith, F.; Kreider, J.F. Principles of Solar Engineering; Hemisphere Publishing Corporation: Washington, DC, USA, 1978. [Google Scholar]
  47. Cartwright, T.J. Modeling the World in a Spreadsheet: Environmental Simulation on a Microcomputer; Johns Hopkins University Press: Baltimore, MD, USA, 1993. [Google Scholar]
  48. Duffie, J.A.; Beckman, W.A. Solar Engineering of Thermal Processes; Wiley: New York, NY, USA, 1980. [Google Scholar]
  49. Kasten, F.; Czeplak, G. Solar and terrestrial radiation dependent on the amount and type of cloud. Sol. Energy 1980, 24, 177–189. [Google Scholar] [CrossRef]
  50. Gul, M.S.; Muneer, T.; Kambezidis, H.D. Models for obtaining solar radiation from other meteorological data. Sol. Energy 1998, 64, 99–108. [Google Scholar] [CrossRef]
  51. NVIDIA Corporation. NVIDIA Compute Unified Device Architecture Programming Guide Version 2.0; NVIDIA Corporation: Santa Clara, CA, USA, 2008. [Google Scholar]
  52. Kirk, D. NVIDIA CUDA software and GPU parallel computing architecture. In Proceedings of the 6th International Symposium on Memory management, Montreal, QC, Canada, 21–22 October 2007; pp. 103–104.
  53. Yu, B.; Liu, H.; Wu, J.; Hu, Y.; Zhang, L. Automated derivation of urban building density information using airborne LiDAR data and object-based method. Landsc. Urban Plan. 2010, 98, 210–219. [Google Scholar] [CrossRef]
  54. Chaves, A.; Bahill, A.T. Locating sites for photovoltaic solar panels. ArcUser 2010, 13, 24–27. [Google Scholar]

