Abstract
Satellite precipitation products are a means of estimating rainfall, particularly in areas that are sparsely equipped with rain gauges. The Guiana Shield is a region vulnerable to high water episodes. Flood risk is enhanced by the concentration of population living along the main rivers. A good understanding of the regional hydro-climatic regime, as well as an accurate estimation of precipitation is therefore of great importance. Unfortunately, there are very few rain gauges available in the region. The objective of the study is then to compare satellite rainfall estimation products in order to complement the information available in situ and to perform a regional analysis of four operational precipitation estimates, by partitioning the whole area under study into a homogeneous hydro-climatic region. In this study, four satellite products have been tested, TRMM TMPA (Tropical Rainfall Measuring Mission Multisatellite Precipitation Analysis) V7 (Version 7) and RT (real time), CMORPH (Climate Prediction Center (CPC) MORPHing technique) and PERSIANN (Precipitation Estimation from Remotely-Sensed Information using Artificial Neural Network), for daily rain gauge data. Product performance is evaluated at daily and monthly scales based on various intensities and hydro-climatic regimes from 1 January 2001 to 30 December 2012 and using quantitative statistical criteria (coefficient correlation, bias, relative bias and root mean square error) and quantitative error metrics (probability of detection for rainy days and for no-rain days and the false alarm ratio). Over the entire study period, all products underestimate precipitation. The results obtained in terms of the hydro-climate show that for areas with intense convective precipitation, TMPA V7 shows a better performance than other products, especially in the estimation of extreme precipitation events. In regions along the Amazon, the use of PERSIANN is better. Finally, in the driest areas, TMPA V7 and PERSIANN show the same performance.
1. Introduction
In the current context of climate change, it is essential to improve our understanding of spatial and temporal rainfall dynamics, both globally and regionally. Rainfall is an essential part of the global water cycle, and measurements are especially crucial for predicting extreme weather events, such as floods, high water and droughts. Precipitation can be measured on the ground using several instruments, such as rain gauges, radar and disdrometers [1,2]. Gauges are the major instruments used to build reference precipitation datasets. They are inexpensive and easy to install and calibrate. However, these instruments are restricted by some technical and practical limitations [2]. Technical limitations may be exposed during heavy rainfall events, when water can accumulate faster than the calibration trough is capable of draining it, or, on the contrary, during low rainfall, when water can evaporate from the collector. The technical limitations of these instruments arise from the challenge of installing and maintaining a dense network in areas that are difficult to access, such as mountains, deserts and primary forests [2,3]. In addition, rain gauge data may, in some countries, be very difficult to access because they are often privately operated.
Over such regions, for over fifteen years, meteorological satellites have provided a viable opportunity to monitor the spatial and temporal distributions of precipitation. The two most widely-used satellite techniques for rainfall estimation are based on observations from passive microwave (PMW) and infrared (IR) sensors. Infrared imagers enabled the first precipitation satellite estimates, via the cloud top temperature, which is indirectly connected to precipitation [4]. Since the 1980s, the development of microwave imagers has allowed a more direct measurement of precipitation via emission, absorption and diffusion signals of hydrometeors (composition and size) [2,5], but with sparse temporal and spatial resolutions than is available from IR data. Therefore, algorithms have been developed that combine more direct observations from PMW sensors and frequently-available observations from IR sensors. A summary of these different products and these different algorithms is given on the site of the International Precipitation Working [6].
All of these blended rainfall products are subject to different types of errors depending on the quality of measurements by the measuring devices, the climate, the seasons and the local climate regime. Thus, the satellite precipitations products, due to their indirect nature of estimation, are prone to errors and need to be verified against in situ observations to improve their quality and confident application in water cycle research, mainly to support hydrologic modeling and disaster monitoring in remote areas where in situ data are sparse or lacking [7,8].
Several studies address the validation of these products in different geographic regions of the world based on the intensity of precipitation and/or seasonal precipitation. A number of them showed that low intensities are overestimated and high intensities are underestimated in Africa [4,9,10], in United States [11,12], in South America [13,14] and in Asia [15,16,17,18]. In terms of seasonality, products are better in the rainy season [4,18,19] or in summer [20,21,22,23,24], when the precipitation is warm and convective. These comparisons based on the intensity and seasonality criteria have been widely studied, and the obtained results confirm the generalities previously validated by many authors.
The validations of the satellite rainfall products on a regional basis from datasets that are representative of various climate regimes is also important, because the different climates may have different implications for satellite rainfall-retrieval algorithms. For example, in China, Yong et al. [25] compared the efficacy of Tropical Rainfall Measuring Mission Multisatellite Precipitation Analysis (TMPA) real time (V6 and V7) and TMPA post-real time (V6 and V7) in two watersheds located at different latitudes and in different climatic regimes. The authors stated that all products overestimate precipitation in high latitudes and underestimate in the lower latitudes. Qiao et al. [11] studied the performance of TMPA V6 and V7 in two Oklahoma basins. They included a drier western basin (~700 mm/year) and a wetter eastern basin (~1000 mm/year). They concluded that the TRMM-V7 TMPA product slightly overestimated rainfall in the wet basin and underestimated rainfall in the drier basin. In Iran, Moazami et al. [26] compared different products over several climatic regimes. They found that PERSIANN underestimates the precipitation in a warm and tropical climate, where the precipitation is almost always convective, while TMPA gives reasonably accurate estimation. In a temperate climate, they show that where the rainfall type is almost always stratiform, PERSIANN tends to underestimate the precipitation, and TMPA-real time (RT) shows low bias. In Central Asia, Guo et al. [24] compared several products for different hydro-climatic regions and show that over the near a big lake areas, all of the PMW-based satellite-based precipitation products (TMPA V7, CMORPH-CRT (Corrected), GsMaP-MVK (Global Satellite Mapping of Precipitation with Moving Vector with Kalman Filter) and PERSIANN-CDR (Climate Data Records)) overestimate precipitation, while the IR-based PERSIANN products avoid this overestimation problem. These studies highlighted that satellite products have variable accuracy in different climatic regions.
Some studies have been already conducted on precipitation in the Amazon Basin with the TRMM TMPA V6, TRMM TMPA V7, CMORPH or PERSIANN precipitation products [13,27,28,29,30], but the satellite rainfall product validation over the northern part of this basin has not yet been explored.
In this study, we investigate four satellite precipitation products: TRMM TMPA (Tropical Rainfall Measuring Mission Multisatellite Precipitation Analysis), developed by the National Aeronautics and Space Administration (NASA), available in its research version (V7) and in real time (RT) [21,31,32]; CMORPH (CPC MORPHing technique) developed at the CPC (Climate Prediction Center) [33]; and PERSIANN (Precipitation Estimation from Remotely-Sensed Information using Artificial Neural Network) developed by the Center for Hydrometeorology and Remote Sensing (CHRS) [34]. Our aim is to identify and quantify, in the first part, the differences in terms of temporal dynamics (wet and dry season) and intensity of precipitation based on the comparison with in situ data from 93 gauges; in the second part, to identify and quantify the spatial heterogeneities of these products, based on the six hydro-climatic regimes of our study area.
2. Materials and Methods
2.1. Study Area
The Guiana plateau, also called the Guiana Shield, is a region in South America located north of the Amazon River and east of the Orinoco River. This area is over 2 million km². It spans seven countries: Colombia, Venezuela, Guyana, Suriname, French Guiana and northern Brazil (Amapá, Roraima and Pará). The Guiana Shield can be described as an old rock area, whose soil is poor, with an extensive river system and dense primary rainforest [35]. This area accounts for 13% of the surface of the South American continent. In this study, the area taken into account lies between 2° S and 6° N latitude and 62° W and 45° W longitude (Figure 1).
The main factors controlling the South American climate are the subtropical high pressure zones in the South Atlantic (Saint Helena anticyclone) and the South Pacific (Easter Island anticyclone), as well as their seasonal oscillations [36]. However, the semi-stationary North Atlantic high pressure zone, which is located north of the equator (Azores High), also impacts the study area. These high pressure areas determine the location of winds and clouds, hence the oscillation of the inter-tropical convergence zone (ITCZ). The ITCZ is the meeting area of trade winds. Air masses weakened by trade winds will become saturated with water vapor over the oceans [37]. These hot and humid cloud masses expand under the influence of heat and are pushed aloft by convective activity. They then undergo a cooling process and lose their water vapor via condensation, thus creating heavy precipitation [38]. When the South Atlantic is warmer (colder) than the North Atlantic during the austral summer (winter), the ITCZ shifts to a more southern (northern) latitude. Marengo et al. [39,40] show that the intensification of northeast trade winds may result in improved moisture transport in the tropical North Atlantic boundary layer toward the Amazon Basin. Moreover, Satyamurty et al. [41] showed that an evapotranspiration rate of approximately 3.0 mm/day is responsible for over 30% of regional precipitation in the Amazon Basin. Many studies have been conducted in the Amazon [30,42,43,44,45,46], especially in connection with deforestation [47], wind, humidity circulation [46] and river breeze circulation [30,48]. During the rainy season in the Amazon Basin, high amounts of precipitation are due to more frequent rather than higher intensity rain [30]. Only one study focused on climate variability in the Guiana Shield . It utilized ground data and re-analyses to identify seasonal rainfall and river isotopic chemistry patterns in part of Guyana using TRMM and ERA-Interim [49]. The results suggested that re-analyses provide a consistent and precise spatial temperature distribution, but a less accurate precipitation distribution.
Figure 2 shows the daily rainfall averages from 2001–2012 for the four products. The in situ data were spatially interpolated. The triangulation-based linear interpolation [50] method was used with a regular grid of 25 km° × 25 km°. The coastline data come from the GSHHS (Global Self-consistent, Hierarchical, High-resolution Geography Database). Data over the ocean are not considered.
In situ stations exhibit a greater average daily intensity (10–12 mm/d) from the East Guyanese coast to the mouth of the Amazon. Relatively high intensities also exist on Marajó Island (~9 mm/day), as well as intermediate intensities NW of Pará (~7 mm/day). The two TRMM-TMPA products exhibit daily intensity patterns that differ from the PERSIANN and CMORPH products. The TMPA product shows spatial intensities that generally agree with in situ data, particularly TMPA V7. However, TMPA RT tends to overestimate intensities in the NW regions of Pará and North Amazonas. CMORPH and especially PERSIANN exhibit the highest daily intensities in the NE regions of the Amazon, Marajó Island and Marajó Bay. However, they greatly underestimate coastal precipitation. This may be due to poor rainfall detection over coastal areas, as was previously noted by Huffman et al. [21].
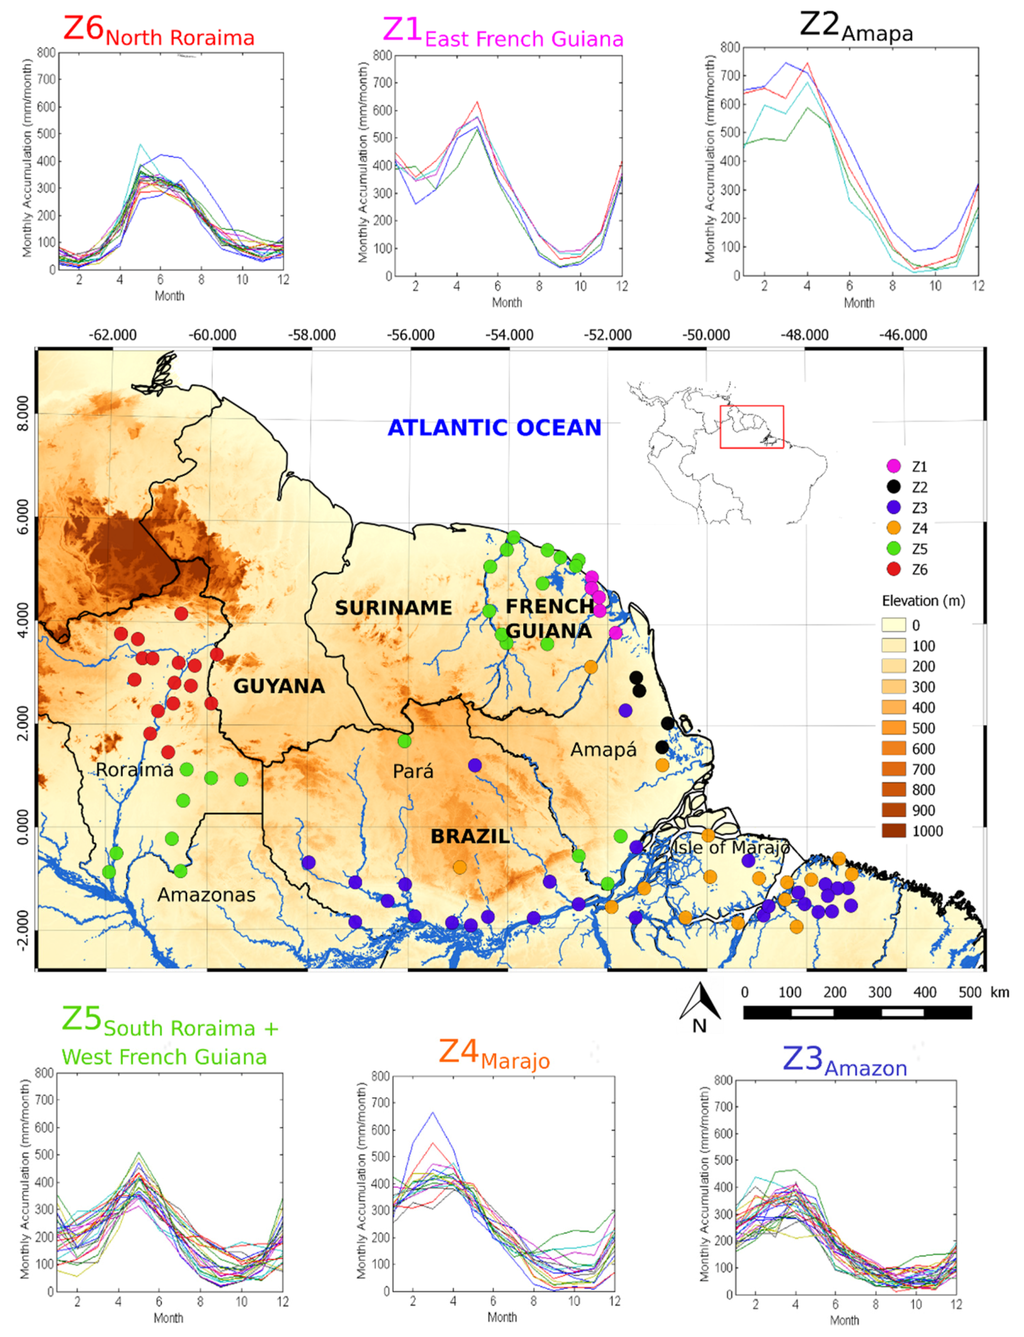
Figure 1.
An elevation map of the Guiana Shield. The SRTM30 (Shuttle Radar Topography Mission) is available at http://www.diva-gis.org/gdata. The dots represent the in situ gauges available in French Guiana and northern Brazil. The six different colors stand for the six hydro-climatic regimes identified according to ascending hierarchical clustering. For each of the areas, the annual precipitation (mm/month) is indicated. The six areas are: Z1East French Guiana; Z2Amapá; Z3Amazon; Z4Marajó; Z5South Roraima+West French Guiana; and Z6North Roraima.
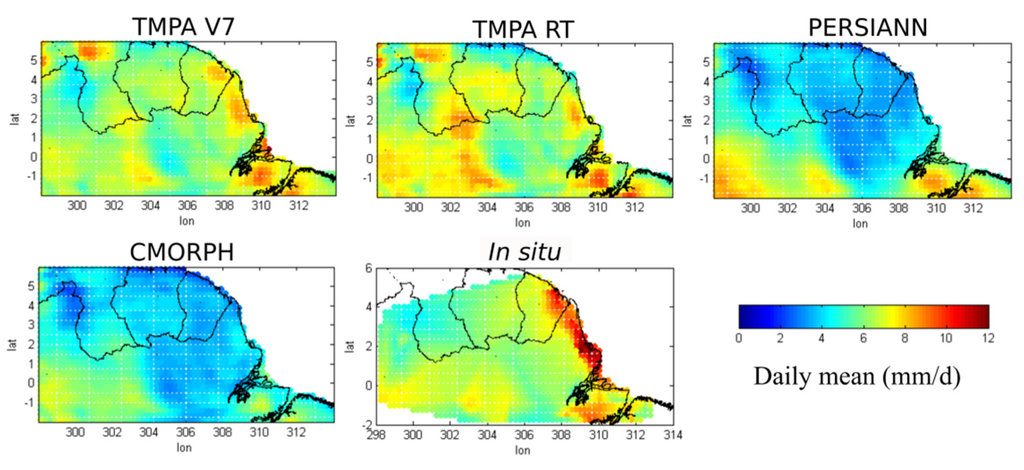
Figure 2.
Average daily precipitation (mm/d) from 2001–2012 for all four satellite products and triangulation-based linear interpolation for in situ stations. TMPA V7, Tropical Rainfall Measuring Mission Multisatellite Precipitation Analysis Version 7; RT, real time.
We are interested in product performance based on different rainfall patterns (Figure 1). Six areas, in different hydro-climatic regimes, were identified: Z1East French Guiana; Z2Amapá; Z3Amazon; Z4Marajó; Z5South Roraima+West French Guiana; and Z6North Roraima. These six areas were selected using a hierarchical ascendant classification [51,52] based on monthly average precipitation totals (Figure 1). This classification proceeds via successive steps, which converge objects into a group. At the end of each stage, we recalculated the Euclidean distances between the newly-created group and the rest of the objects. The process is repeated until all objects have converged into one group. Our choice for the dissimilarity index will be the Euclidean distance, and the choice of index aggregation is Ward’s method. Areas Z1East French Guiana and Z5South Roraima+West French Guiana exhibit a bimodal regime with two dry seasons and two rainy seasons. The other areas are subject to a unimodal system, with a dry season and a rainy season. The rainy season occurs at different times in all of the areas. However, the onset of rains occurs along a NW-SE gradient, which is likely related to ITCZ movements. The areas south of the Guiana Shield, Z3Amazon and Z4Marajó, are subject to maximum rainfall intensities in March, when the ITCZ reaches its lowest position. At this time, we observe a small dry period in Z1East French Guiana, further north. When the ITCZ moves back to the north, Z2Amapá is subject to maximum rainfall intensities, mainly during the month of April. These maximum rainfall intensities start in May for Z1East French Guiana and Z5South Roraima+West French Guiana, then in June for Z6North Roraima. The coastline is subject to significant precipitation, with average monthly station measurements reaching 600 mm in Z1East French Guiana and 750 mm in Z2Amapá.
Comparing the two most rainy regions (Z1East French Guiana and Z2Amapá), we see that it rains more often in Eastern Guiana than in Amapá, but average intensities in Eastern Guiana are lower, resulting in a lower yearly total to date.
Table 1 shows the hydro-climatic zones in descending order of average annual total rainfall (mm/year). For each zone, we have included the value of the simple day intensity index (SDII), which represents the daily average of rainy days and the percentage of rainy days. The Amapá coast (Z2Amapá) is the wettest area, with 4101 mm/year on average. Northern Roraima (Z6North Roraima) receives the least amount of precipitation, with an average rainfall of 1809 mm/year. Note that the SDII does not decrease with the yearly aggregate. For instance, South Roraima (Z5South Roraima+West French Guiana) and North Roraima (Z6North Roraima) exhibit an annual rainfall difference of approximately 630 mm. However, North Roraima’s SDII is larger (15 mm) than that of South Roraima (12.6 mm). Therefore, although Northern Roraima is the least rainy region (34% rainy days), it is subject to medium intensity rainfall that is longer and more intense than in the south.

Table 1.
The average annual total simple day intensity index (SDII) (mm/year) accounting for the daily average of rainy days and the percentage of rainy days. Areas are ranked in descending order of the average annual aggregate.
| Zones | Average Yearly Aggregate (mm/y) | SDII (mm/d) | Rainy (%) |
|---|---|---|---|
| Z2Amapá | 4101 | 19.6 | 59 |
| Z1East French Guiana | 3581 | 13.5 | 74 |
| Z4Marajó | 2855 | 15.3 | 54 |
| Z5South Roraima + West French Guiana | 2446 | 12.6 | 55 |
| Z3Amazon | 2153 | 13.5 | 46 |
| Z6North Roraima | 1809 | 15 | 34 |
2.2. Precipitation Products
A brief description of the four satellite products’ estimation is given below. Each of these products is compared to the in situ gauges data over a period of 12 years, between 2001 and 2012. The products have been tested across the world, and all of the studies agree that products calibrated with in situ data provide better estimates than those uncalibrated with in situ data [4,16,24,53]. Moreover, in our study area, over the period 2001–2012, only 15 rain gauges from the GPCC (Global Precipitation Climatology Center) are used to calibrate TMPA V7.
2.2.1. TRMM-TMPA V7 and TRMM-TMPA RT
The TRMM TMPA algorithm, which was developed by NASA, is a rainfall estimation product from the TRMM mission that combines satellite and ground data [17,21,31,32,54,55]. The main sources for TMPA-3B42V7 are infrared GOES-W (Geostationary Operational Environmental Satellite-West), GOES-E (East), GMS (Geostationary Meteorological Satellite), Meteosat-5, Meteosat-7 and NOAA-12 geostationary satellites, as well as passive microwave radiometers from TMI/TRMM (TRMM Microwave Imager), SSMI/DMSP (Special Sensor Microwave Imager/Defense Meteorological Satellite Program), AMSU/NOAA (Advanced Microwave Sounding Unit/National Oceanic and Atmospheric Administration) and AMSR-E/Aqua (Advanced Microwave Scanning Radiometer-EOS) low orbit satellites.
Two datasets are produced from the TMPA-3B42 algorithm. The first is TRMM 3B42 TMPA-V7, the research version, which is available approximately two months after the observation. The second is TRMM 3B42-TMPA RT-V7, the real-time version, which is available approximately 6–9 h after the observation. There are several differences between TMPA RT and TMPA V7 [32]. First, it is not possible to apply precipitation gauge data to the near-real-time TMPA RT product. Second, because TMPA RT focuses on a quick turnaround time, the near-real time data are not reprocessed as upgrades are made to the sampling procedure. Third, whereas TMPA V7 is based on an IR calibration period of the calendar month of the samples, the TMPA RT period is a trailing 30-day accumulation. Finally, the TMPA RT calibration standard utilizes a real-time version of the Goddard profiling algorithm (GPROF)-TMI.
For the last 10 years, the TMPA algorithm has undergone three important updates due to new sensors used with the algorithm [17]. The 3B42 algorithm runs in 4 stages [9]: (1) passive microwave precipitation estimates are calibrated and combined; (2) infrared precipitation estimates are generated using the calibrated data from the passive microwave; (3) the IR and PMW data are combined; and (4) the data are rescheduled on a monthly basis using the rain gauge data [21]. Furthermore, TRMM TMPA uses precipitation estimates directly from PMW data when available, and inserts the IR data when PMW are not available [19]. TMPA-3B42 algorithm output data have a 3-hour time resolution, with rainfall amounts expressed in mm/h. The covered geographical area extends from latitude 50° N–50° S for 3B42V7 and from 60° S–60° N for 3BR2RT-V7, with a 0.25° × 0.25° spatial grid resolution. 3B42V7 product data have been available since 1 January 1998 (through the present day) [56]. 3B42 RT has been available since 1 March 2000 (through the present day) [57].
2.2.2. PERSIANN
The Precipitation Estimation algorithm from Remotely-Sensed Information using an Artificial Neural Network (PERSIANN) was developed by the Center for Hydrometeorology and Remote Sensing (CHRS). The algorithm is based on a classification procedure using an artificial neural network [34]. Input data include brightness temperatures, which are measured from IR channels (10.2–11.2 μm) obtained from GOES-8, GOES-9/10, GOES-12, GMS-5, Meteosat-6 and Meteosat-7 geostationary satellite images, as provided by NOAA. The TMI product (TRMM Microwave Imager) 2A12 measures the instantaneous precipitation rate based on the TRMM data and is used in the learning phase of the neural network. PERSIANN uses a neural network approach to statistically adjust IR-derived precipitation rates and to mimic the behavior of the PMW-derived estimates. Using this technique, the final estimates are directly derived from the IR. The resulting rainfall rates are then forced to fit the PMW-derived precipitation characteristics [19]. Rainfall is measured every 30 min, and data are aggregated based on 3 (and 6) -hour accumulated rainfall (unit: mm.3 h−1). The output data have a 0.25° × 0.25° spatial resolution and a 3 (and 6) -hour temporal resolution. The geographical area covered by the algorithm extends from latitude 60° N–60° S, and the product has been available since 2 March 2000 [58].
2.2.3. CMORPH
The CPC MORPHING (CMORPH) technique was developed at the NOAA Climate Prediction Center (CPC) [33]. The CMORPH satellite product uses rainfall estimates derived from PMW satellite observations. These IR data come from the US GOES-8 and -10, European Meteosat-5 and -7 and Japanese GMS-5 geostationary satellites. CMORPH mixes IR and PMW in two stages: (1) the atmospheric motion vectors from two successive IR images are generated every 30 min; and (2) the derived motion field is used to propagate the precipitation estimates from various microwave data. Quantitatively, rainfall estimates are based only on microwave data. IR data are not used to estimate rainfall, but rather to obtain a motion field used to propagate the estimates derived from PMW. IR is considered as spatially and temporally interpolated [9,19]. The CMORPH V1.0 product has been available as three-hour data since 1 January 1998, at a 0.25° × 0.25° spatial resolution and with a 60° N–60° S overall coverage [59].
2.3. Rain Gauges
There are 93 rain gauges distributed between French Guiana and northern Brazil (Figure 1), including 18 in the Guyanese territory. North Brazilian data come from the Brazil National Water Agency (ANA). They are freely available online [60]. French Guiana rainfall data are provided by Météo France. Both data sources required data verification via detailed quality control, the details of which can be found in the next paragraph.
2.4. Data Quality Control
The satellite product data were downloaded in files with three-hour time steps (00H, 03H, 06H, 09H, 12H, 15H, 18H, 21H), based on the GMT 0:00 time zone. Daily totals were generated by summing the tri-hourly files. The study area falls within the −03H00 GMT time zone. Therefore, it was necessary to sum the tri-hourly totals to best represent the daily aggregate of the study area. If a tri-hourly file were missing for a particular day, that day was not taken into account.
A data quality control analysis was conducted on both satellite and in situ data series for the study period between 1 January 2001 and 30 December 2012. Negative values in the in situ and satellite datasets have been deleted. Values greater than the 99.999th percentile + 1.5 × (Q3 − Q1), where Q3 is the third quartile and Q1 is the first quartile, were considered outliers and removed from both series. We also conducted homogeneity tests between the rain gauge records and the co-located satellite grid values.
2.5. Methodology
We chose four quantitative statistical criteria to analyze the product's ability to estimate precipitation: the correlation coefficient (CC), bias, relative bias and root mean square error (RMSE) [51]. Contingency statistics identify classifications errors and are used to control the estimator's capability to detect precipitation. This verification is based on a 2 × 2 contingency table (Table 2).
Table 2.
Contingency table. "A" represents detected rain events and verified rainfalls. "B" represents the estimated and unobserved rainfalls. "C" represents the undetected rainfalls. "D" corresponds to undetected, but well-classified rainfalls.
| In Situ | |||
|---|---|---|---|
| Rain | No Rain | ||
| Satellites | Rain | A | B |
| No rain | C | D | |
The "A" and "D" values represent the correctly-detected events. The "B" and "C" values rate the detection errors. "B" values indicate that no rain is observed, but that the estimator reports some rainfall. Conversely, "C" values indicate that rain is observed, but that the estimator does not detect rainfall. The POD (probability of detection) measures the correct detection rate when it rains and PODno-rain when it does not rain (Table 3). A perfectly estimated POD is represented by a value of 1. The FAR (false alarm ration) measures the rate of false alarms (Table 3). A value of 0 represents a perfect estimate by the satellite product.
Table 3.
Quantitative error metrics formulas. POD, PODno-rain and FAR.
| Probability of Detection (POD) of rainy days | A/(A + C) |
| Probability of correct no-rain detection | D/(D + B) |
| False alarme ratio FAR | B/(A + B) |
3. Results and Discussion
3.1. Overall Comparison of Rainfall Products
Table 4 shows the results of the statistical comparison between the in situ and satellite series for the entire study period. Negative bias values indicate that all products underestimate precipitation. TMPA V7 exhibits the smallest bias, the best correlation and the best FAR. CMORPH exhibits the lowest RMSE and the best POD. However, its bias is largely negative (approximately 10-times that of TMPA V7). TMPA RT shows a bias that is relatively similar to V7, but the largest RMSE. PERSIANN exhibits the worst correlation, intermediate bias and errors, as well as the worst FAR. Nevertheless, the POD and FAR values are very similar between products. There are no significant differences. There is a real difference in the estimation of rainfall (bias), but not detection (POD and FAR).
In conclusion, all products underestimate precipitation. TMPA V7 best estimates rainfall with the fewest false alarms. CMORPH exhibits the lowest standard deviations, but greatly underestimates precipitation.
Table 4.
Statistical validation between in situ and satellite datasets. Values were averaged overall all stations and the entire period (from 1 January 2001 and 30 December 2012). The best scores are shown in bold.
| Correlation | Bias (mm/d) | RMSE (mm/d) | POD | FAR | |
|---|---|---|---|---|---|
| TMPA V7 | 0.401 | −0.238 | 14.627 | 0.667 | 0.301 |
| TMPA RT | 0.365 | −0.295 | 14.888 | 0.649 | 0.310 |
| PERSIANN | 0.348 | −1.430 | 13.693 | 0.669 | 0.331 |
| CMORPH | 0.380 | −2.313 | 13.356 | 0.674 | 0.305 |
The large CMORPH bias may be caused by the failure of this product to differentiate the irradiance properties of the ocean from those of the continent [61]. In particular, the complex processes associated with coastal rainfall are poorly captured [62,63]. Furthermore, the relatively smooth propagation of precipitation events resulting from the "morphing" process might have missed the intermittent characteristics of the precipitation [64]. Short events, such convective rainfalls occurring between PMW scans, will be missed by this procedure. Tian et al. [64] suggested that TMPA-3B42 did not show an advantage over CMORPH on a daily time scale. Moreover, they compared the two products in the United States where the hydro-climatic regime is different than the Guiana Shield. However, various factors, such as topography, snow cover, precipitation regimes (convective vs. stratiform) and ground reference data quality, may affect the precipitation estimations [64]. Most microwave techniques depend on high frequencies (>85 GHz), which are more suitable for the detection of ice particles than for detecting liquid particles over land, which explains why microwave satellites overlook most low intensity rainfall events. Moreover, Adler et al. [65] showed that PMW-based estimates of instantaneous precipitation are more accurate than IR-based algorithms because of the strong relationship between microwave radiance and precipitation. Yong et al. [17] found that for low latitudes, TMPA V7 yielded a better result. In addition, TMPA RT has significantly improved over time thanks to the incorporation of SSMIS data (Special Sensor Microwave Imager Sounder), making it nearly as effective as TMPA V7.
3.2. Comparison of Daily Averages
Figure 3a shows the daily average for each month over all of the stations for both the in situ rain gauges and satellite estimated products from 2001–2012. Figure 3b–g depicts the statistical results of the correlation, the bias, the RMSE, the POD, the PODno-rain and the FAR of the daily averages for each month between the in situ rain gauges and satellite estimated products.
During low rainfall months, estimates between the four products exhibit a similar behavior. Biases are close to zero (Figure 3c). The correlation values approach one (Figure 3b), and the RMSE values are low (Figure 3d). The probability to detect rain (Figure 3e) is low (~0.5), to detect daily with no rain (Figure 3f) is high (0.8), but the number of false alarms (Figure 3g) is important (0.6). Only PERSIANN exhibits a singular behavior in its bias value, with an overestimation of rainfall during the dry season.
During the months of heavy rainfall, a similar behavior between all product is found for POD, PODno-rain and FAR, with good values of POD (0.8) and FAR (0.2). For correlation, bias and RMSE; TMPA V7 and TMPA RT show a different pattern from PERSIANN and CMORPH. For TMPA, the correlation remains close to one, bias close to zero and RMSE values relatively low. However, PERSIANN and CMORPH exhibit singular behaviors, with largely negative bias values. The correlation of PERSIANN is lower compared to the other three products. In addition, CMORPH exhibits large error variances, about three times that of TMPA-V7.
Products are more efficient in the dry season than the rainy season. However, regarding the detection of events (POD and FAR), the rainy season shows a better detection of rainfall events with fewer false alarms. In addition, the behavior between products is more similar during the dry season. However, during rainy seasons, PERSIANN and CMORPH exhibit peculiar behaviors. During both seasons, TMPA V7 yields estimates that are of better quality than the other products.
Thiemig et al. [9] compared different products across Africa and suggest that products exhibit better performance in tropical climate regimes than in semi-arid and mountainous areas. The worst scores typically occurred during the rainy season, particularly for CMORPH.
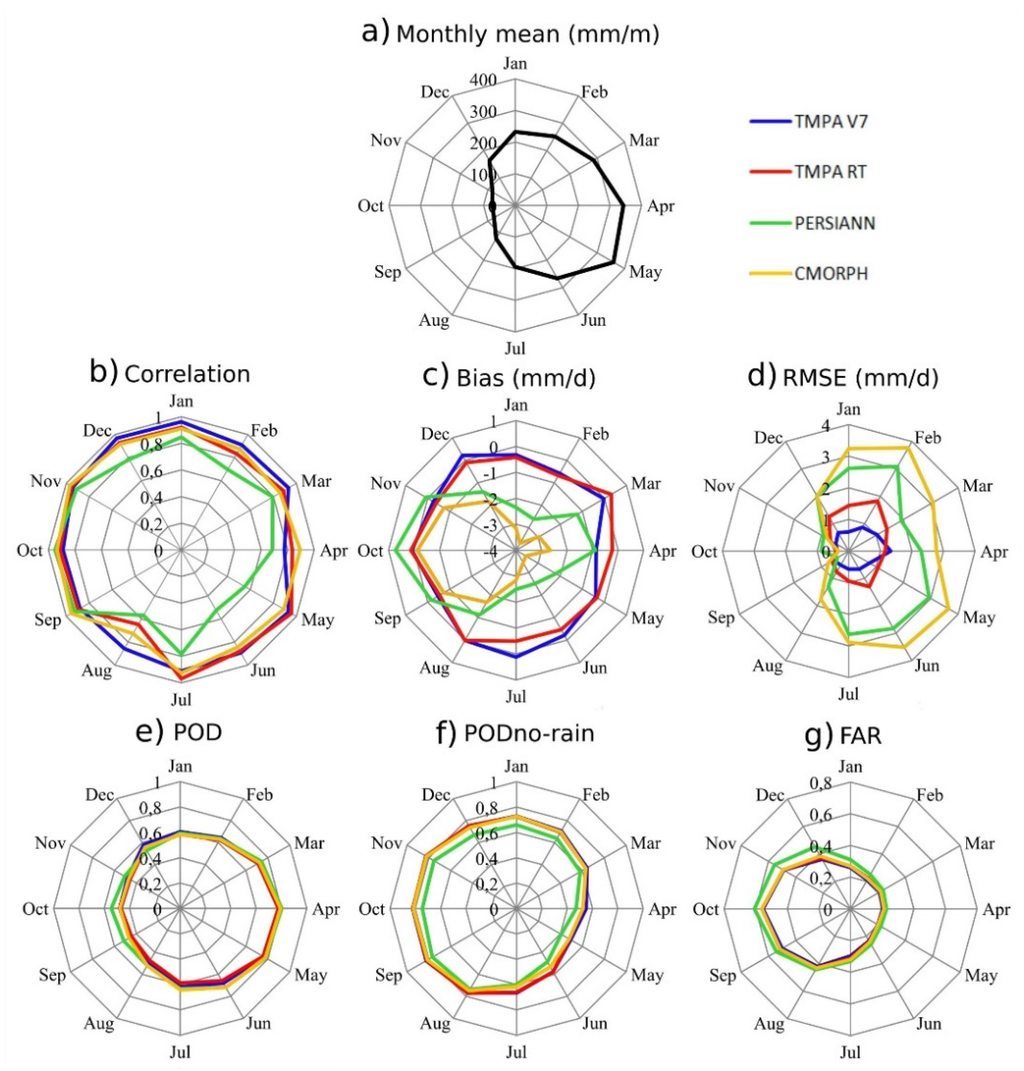
Figure 3.
Monthly statistical comparison from the daily averages between the in situ rain gauges and satellite estimated products. (a) The average monthly accumulation (mm/month) for the entire study area. The others graphs depict the daily statistical errors: (b) correlation, (c) bias (mm/d), (d) RMSE (mm/d), (e) POD, (f) PODno-rain and (g) FAR. Months have been shortened, Jan = January, Feb = February, Mar = March, Apr = April, May, Jun = June, Jul = July, Aug = August, Sep = September, Oct = October, Nov = November and Dec = December.
3.3. Comparison of Rainfall Intensity Categories
Figure 4 shows (a) relative bias in %; (b) RMSE in mm/d; (c) POD and (d) FAR for different classes of daily intensities: 0–1 mm, 1–2 mm, 2–3 mm, 3–4 mm, 4–5 mm, 5–10 mm, 10–20 mm, 20–50 mm, 50–100 mm and >100 mm. All products exhibit a similar pattern of relative bias depending on intensity, represented by a large positive relative bias for very low precipitation levels (0–1 mm), a bias close to 0% for medium precipitation levels and a negative relative bias for heavy rainfall. There is an inverse behavior between changes in precipitation intensity (0; +100 mm/d) and the evolution of the relative bias value (+4%; −1%), with a high value of relative bias occurring for precipitation events between 0 and 1 mm/d (Figure 4a). For very low intensities, the estimation is poor (relative bias approximately 4%). Satellite products tends to overestimate light precipitation; they capture some of the rain that individual stations may not [66]. The underestimation of heavy rainfall may be caused by the low sampling frequency and consequently missed short-duration precipitation events between satellite measurements [28]. However, our region is more likely to experience flooding events than drought events. Therefore, we focus on the estimation of extreme precipitation events by satellite products.
When intensity increases, the POD of all products also increases (Figure 4c), and FAR decreases (Figure 4d). For class 0–1 mm, POD and FAR are relatively good, 0.7 and 0.3, respectively. When intensity increases, the RMSE of all products increases (Figure 4b). Therefore, for precipitation events of more than 5 mm/d, the satellite products exhibit large error variances as intensity increases. However, the satellite products better detect precipitation and exhibit fewer false detections as intensity increases.
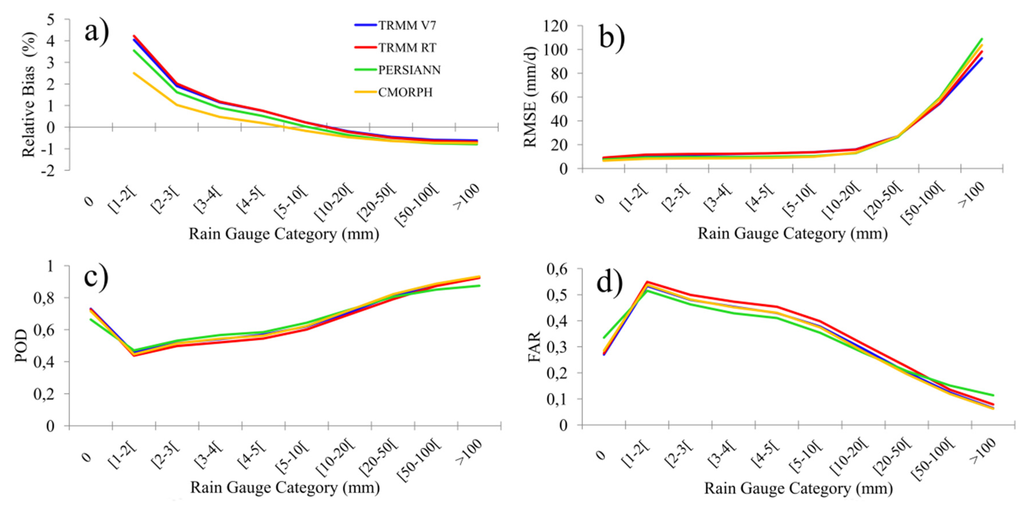
Figure 4.
Statistical comparison between in situ rain gauges and satellite products for different classes of daily intensities: 0–1 mm, 1–2 mm, 2–3 mm, 3–4 mm, 4–5 mm, 5–10 mm, 10–20 mm, 20–50 mm, 50–100 mm and >100 mm. Statistical criteria: (a) relative bias in %; (b) RMSE in mm/d; (c) POD and (d) FAR.
For very low intensity events (<2 mm/d), CMORPH is the most effective product. Its values of relative bias and RMSE are lowest (2.5% and 8 mm/d, respectively). For medium intensities (5–10 mm/d), all of the products are equivalent. For medium events, CMORPH and PERSIANN exhibit lower RMSE values than TMPA. However, CMORPH becomes less accurate for large rainfall events. Overall, TRMM-V7 TMPA yields the highest quality estimates. The products exhibit a greater dispersion for extreme intensity events. Extreme rains are better estimated by TMPA V7, which exhibits the lowest RMSE. The relative bias and POD values are similar between products for extreme events, except for PERSIANN, which exhibits a lower POD. This is because the incorporation of imagery data from geostationary satellites is suited to convective precipitation (strong intensities) rather than stratiform precipitation [27,29,49].
We observe that for large precipitation intensities, products detect rain more accurately, but poorly estimate amounts. Thiemig et al. [9] and Toté et al. [4] also found a lack of precision in extreme events and a general underestimation from these satellite products.
3.4. Spatial Analysis
3.4.1. Comparison of Precipitation Probability Distributions
Figure 5 shows comparisons between the probabilistic densities of daily precipitation from in situ measurements and densities found in satellite precipitation products for the six areas. Probabilistic densities were calculated using Parzen–Rosenblatt's method, commonly called the kernel density. This is a nonparametric method for estimating the probabilistic density of a random variable [67,68]. A nonparametric probability density estimate has the advantage of being developed directly from the data and, hence, reflects the attributes represented by the sample [68]. It is defined as:
where there are n data samples, K( ) is the kernel function and h a parameter called the "window", which defines the location on which the empirical distribution is averaged. In this study, a Gaussian kernel function is used, and h = 100. The kernel densities of in situ data are shown with the dotted line.
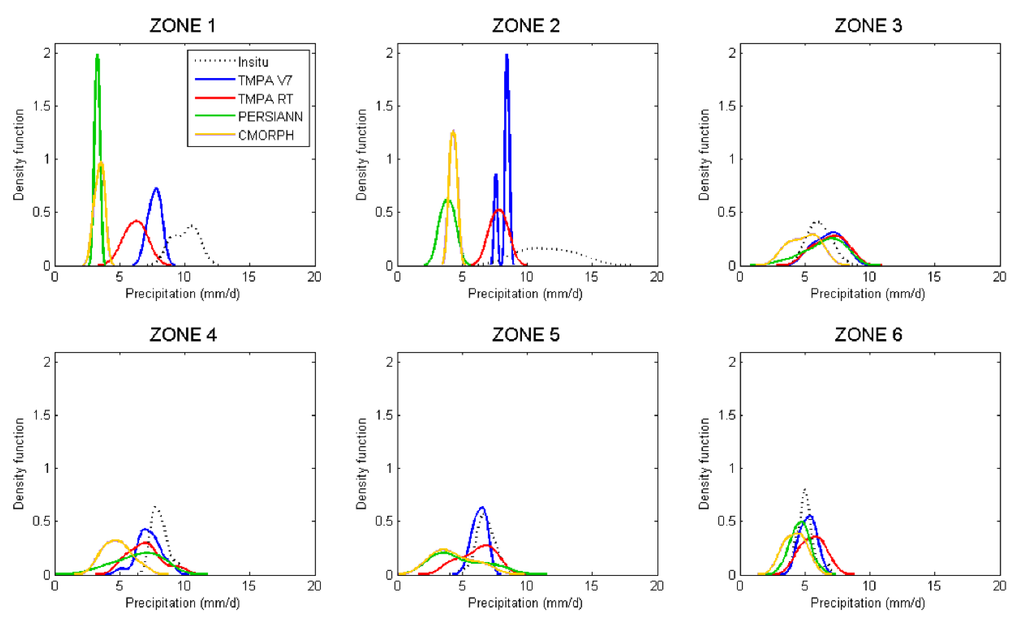
Figure 5.
Comparison of the kernel probabilistic density of daily data between in situ and the satellite-based products in each zone.
For Z1East French Guiana, the in situ distribution is bimodal, with two maxima (9 and 11 mm/d). The modes are positioned beyond the modes of the satellite distributions. The amplitude of the in situ distribution is roughly twice as low as those of the satellites distributions (up to four times compared to PERSIANN). For Z2Amapá, the distribution is unimodal (ymax = 0.2), with a mode positioned beyond both of the satellite distributions and a mode amplitude substantially lower than that of the satellite products (three times lower than TMPA RT and PERSIANN and roughly ten times lower than TMPA V7). For Z3Amazon, the distribution is unimodal, with a mode positioned below those of the satellite distributions and a mode amplitude similar to that of the satellite products. For Z4Marajó, the distribution is unimodal, with a mode positioned beyond the satellite distribution modes. However, the amplitude of the in situ mode is similar to that of the satellite products. Z5South Roraima+West French Guiana exhibits a correct superposition of in situ density with TMPA V7 densities. The other satellite distributions exhibit lower amplitudes and lower modes. Z6North Roraima exhibits a unimodal distribution, with a mode position close to those of the satellite products and a mode amplitude similar to that of the products. Tian and Peters-Lidard [69] identified systematic anomalies of rainfall retrieval over inland pixels containing small water bodies, such as rivers, lakes and reservoirs. These anomalies are caused by the poor characterization of the differences in emissivity and temperature of water surfaces in the PMW frequencies used by the retrievals. The PMW retrievals are known to be sensitive to land surface heterogeneity, including contrasts in temperature and emissivity [69].
The density analysis allows for the identification of four cases: The first case occurs in areas Z1East French Guiana and Z2Amapá. Satellite products estimate the data measured in these areas as low amplitude precipitation (between 4 and 8 mm/d) that occurs fairly frequently. However, these areas are actually subject to higher precipitation intensities (9–11 mm/d in Z1 and up to 15 mm/d in Z2), but infrequent events. For some satellite products, this seems to reflect an increase in the estimated frequencies, but not an increase in the estimated intensities. Therefore, a convective precipitation regime with an intensity greater than 8–9 mm/d is difficult for satellite products to replicate. Furthermore, Z1East French Guiana and Z2Amapá include rain gauges located along the coast. Thus, the significant density differences between the in situ and the satellite products can possibly be explained by how microwaves are affected near water surfaces.
The second case occurs in areas Z4Marajó and Z5South Roraima+West French Guiana. The satellite products interpret rainfall in these areas to have a wide intensity distribution (from 2–10 mm/d), but a low frequency of events. In reality, these areas are subject to greater and more frequent intensities (6–10 mm/d in Z4 and 5–9 mm/d in Z5). In some satellite products, this type of precipitation seems to reflect decreased estimated frequencies and decreased estimated intensities. However, in Z5South Roraima+West French Guiana, the TMPA V7 product exhibits an amplitude and a mode similar to in situ.
The third case occurs in Z3Amazon. Satellite products interpret the data measured in this area as having infrequent, average amplitude (between 2 and 11 mm/d) rainfall events. Although this area is subject to average intensity events (4–10 mm/d), they occur more frequently than what was estimated by the satellite products. Satellite products for this type of rainfall regime generally reflect a slight decrease in estimated frequencies and a slight increase in estimated intensities, particularly over larger bodies of water or rivers, such as the Amazon.
The fourth and last case is occurs in Z6North Roraima. Satellite products correctly interpret the rainfall intensities in the area (between 3 and 7 mm/s), but at a less frequent rate. This relatively low intensity rainfall, which is present in the hinterland, is reflected in some satellite products as slightly underestimated frequencies, but correctly estimated intensities. In terms of intensity and frequency, satellite products must better estimate low intensity rainfall.
Tian and Peters-Lidard [70] show that current satellite-based products are more reliable over areas with strong convective precipitation and flat surfaces, as is the case in our study area. In addition, they found that the uncertainty is relatively small in South America, which is similar to the uncertainty above the oceans. Nevertheless, the differences between satellite products and local measurements are largely due to the inabilities of satellite products to accurately estimate precipitation over coastlines and inland water bodies.
3.4.2. Error Metrics
Figure 6 shows the quantitative error metric results in different zones. These tests measure the occurrence errors. We observed that the lower the annual accumulation found in the area, the more accurate the POD and PODno-rain, a result also highlighted by Katiraie-Boroujerdy et al. [71]. However, the lower the yearly aggregate of an area, the worse the FAR. In areas with less surface water, products properly detect rainy days (~70%), but poorly detect dry days (~40%). However, these areas exhibit more false alarms. POD values are greater than those of PODno-rain, and satellite products exhibit a greater ability to detect rainy days than days without rain.
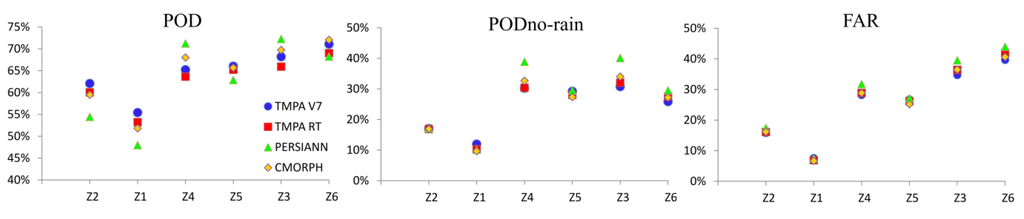
Figure 6.
Probability of detection of rainy days (POD), dry days (PODno-rain) and false alarm ratio (FAR) for each zone. Zones are ranked in descending order of annual accumulation.
Figure 7 shows the result of the quantitative statistical tests of the four products in different zones. Note that the lower the annual accumulation, the closer to zero the bias and the lower the RMSE. However, no link is observed between rainfall patterns and correlation. In areas with the least amount of surface water, products correctly estimated precipitation (bias close to zero) and with a lower error variance. In the wettest areas, products underestimate rainfall and with larger error variances.
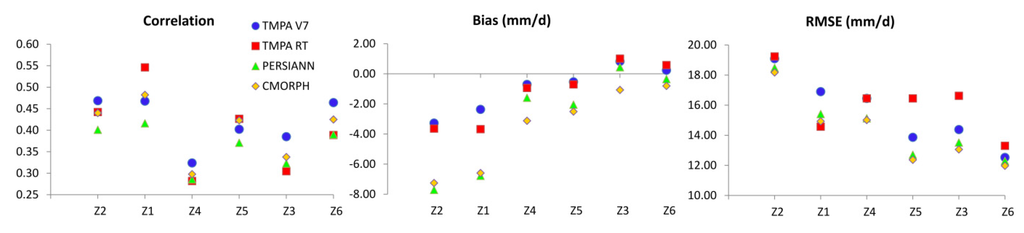
Figure 7.
Correlation, bias (mm/d) and RMSE (mm/d) in each zone. Zones are ranked in descending order of annual accumulation.
Product estimation efficiency is mainly related to precipitation intensity, as previously seen in Figure 3, but also related to hydro-climatic conditions (Figure 5, Figure 6 and Figure 7).
In Z1East French Guiana and Z2Amapá, the rainiest coastal areas, some products do not give satisfactory results. There is a large difference in product performance. CMORPH and PERSIANN show an underestimation three times larger than TMPA. The error variances are similar between products, but show wide values. These results can be explained by the presence, in most cases, of significant convective rainfall intensity, but with variable amplitude. Indeed, heavy rainfall intensities are widely underestimated; this result reduces the overall performance of the products for these areas, largely subject to convective rainfall.
In Z4Marajó and Z5South Roraima+West French Guiana, near large bodies of water, such as the mouth of the Amazon and near coastal areas, the bias for TMPA V7 is close to zero.
In Z3Amazon, the distribution of precipitation shows that all products are similar in terms of the frequency of distribution. PERSIANN shows the best bias with a slight overestimation, low error variance and the best score for the events’ detection. In these areas, the interannual variability in terms of rainy intensity is less important.
In Z6North Roraima, all products are similar. The distribution of precipitation is alike in situ, with a similar average amplitude, but less frequent. The bias is close to zero for PERSIANN and TMPA V7 with the best scores for RMSE. Precipitation being less convective and weaker, the products are more accurate, but show greater detection error associated with low intensities.
In all areas, the difference between TMPA RT and V7 is very low. Yong et al. [25] showed that TMPA RT has almost reached the accuracy level of the post-real-time research products due to the incorporation of SSMIS sensor data in the current Version 7, which significantly improved the accuracy of TMPA real-time precipitation estimates. An additional result is for the drier area TMPA V7 (calibrated with only 15 GPCC rain gauges) having a similar performance as PERSIANN (not calibrated with GPCC rain gauges). We can assume that the TMPA V7 calibration with very few rain gauges from the GPCC available in the region (here 15) does not allow a significant improvement of the product in the estimation of rainfall.
4. Conclusions
This study compares four satellite precipitation products, TRMM-TMPA V7, TRM-TMPA RT, PERSIANN and CMORPH, in French Guiana and North Brazil from 1 January 2001 to 30 December 2012. The objective of this study was to evaluate the quality of these products by comparing them with in situ precipitation data. Different types of analyses were conducted using daily data and according to the various hydro-climatic regions observed in the study area. Consistent with the existing literature, overall, we show that the satellite precipitation products generally underestimate precipitation on a daily scale. All products exhibited better performances during the dry season (August–December). All products greatly overestimated very low intensities (<4 mm) and underestimated very high intensities (>50 mm).
Comparing these products through the entire study area does not allow one to correctly analyze the responses of each product. We have shown that the products response is dependent on the hydro-climatic regime. The hierarchical ascendant classification analysis detected six different areas. The major findings of this study are summarized as follows:
- (1)
- The probabilistic density analyses for the six different areas indicate that products exhibit a greater degree of accuracy in the least rainy areas. Convective-type rainfall (Z1East French Guiana and Z2Amapá.) is more poorly estimated by satellite products.
- (2)
- In Z4Marajó and Z5South Roraima+West French Guiana, near large bodies of water, the bias for TMPA V7 is close to zero.
- (3)
- In Z3Amazon, over the areas near a big river, PERSIANN shows the best bias with a slight overestimation, low error variance and the best score for the events’ detection.
- (4)
- In Z6North Roraima, the drier area, all products have satisfying performances with very little difference between them. PERSIANN and TMPA V7 showed the same performance.
In regions where few gauging station are available through the online database, satellite estimates constitute a valuable source of meteorological information, but need area-specific calibration and validation. We found a greater difference between in situ and satellites estimates in coastal areas against inland areas, probably due to the nature of convective rainfall that is fast, intense and localized. In regions close to large rivers, or bodies of water, the use of PERSIANN is better. Finally, in the driest areas, inland, TMPA V7 and PERSIANN are equally effective. In conclusion, the identification and quantification of the performances of TRMM-TMPA V7, TRMM-TMPA RT, PERSIANN and CMORPH in French Guiana and North Brazil should provide useful information for various hydrological applications and could facilitate taking better mitigation measures for extreme rain events by stakeholders.
Acknowledgments
This project has received funding from Fonds Européen de Développement Régional (FEDER-Guyane/PHEUS Project: Suivi des Phénomènes Hydrologiques Extrêmes par Utilisation de données Satellites en Guyane). We thank DS BIODIVA program (Données spatiales pour la gestion intégrée de la biodiversité et des ressources en eau). We acknowledge Météo France and Agência Nacional de Àguas for providing the daily precipitation data. Finally, special thanks are due to the original producers of all four evaluated precipitation products for providing free downloadable precipitation products.
Author Contributions
Justine Ringard performed the analysis and drafted the manuscript. Melanie Becker and Laurent Linguet collected data. All of the authors commented on the manuscript and contributed to the discussion and conclusions.
Conflicts of Interest
The authors declare no conflict of interest.
References
- Michaelides, S.; Levizzani, V.; Anagnostou, E.; Bauer, P.; Kasparis, T.; Lane, J.E. Precipitation: Measurement, remote sensing, climatology and modeling. Atmos. Res. 2009, 94, 512–533. [Google Scholar] [CrossRef]
- Tapiador, F.J.; Turk, F.J.; Petersen, W.; Hou, A.Y.; García-Ortega, E.; Machado, L.A.T.; Angelis, C.F.; Salio, P.; Kidd, C.; Huffman, G.J.; et al. Global precipitation measurement: Methods, datasets and applications. Atmos. Res. 2012, 104–105, 70–97. [Google Scholar] [CrossRef]
- Derin, Y.; Yilmaz, K.K. Evaluation of multiple satellite-based precipitation products over complex topography. J. Hydrometeorol. 2014, 15, 1498–1516. [Google Scholar] [CrossRef]
- Toté, C.; Patricio, D.; Boogaard, H.; van der Wijngaart, R.; Tarnavsky, E.; Funk, C. Evaluation of satellite rainfall estimates for drought and flood monitoring in Mozambique. Remote Sens. 2015, 7, 1758–1776. [Google Scholar] [CrossRef]
- Kidd, C. Satellite rainfall climatology: A review. Int. J. Climatol. 2001, 21, 1041–1066. [Google Scholar] [CrossRef]
- International Precipitation Working Group. Available online: http://www.isac.cnr.it/~ipwg/ (accessed on 2 December 2015).
- Barrett, E.C. Precipitation measurement by satellites: Towards community algorithms. Adv. Space Res. 1993, 13, 119–136. [Google Scholar] [CrossRef]
- Yilmaz, K.K.; Hogue, T.S.; Hsu, K.; Sorooshian, S.; Gupta, H.V.; Wagener, T. Intercomparison of rain gauge, radar, and satellite-based precipitation estimates with emphasis on hydrologic forecasting. J. Hydrometeorol. 2005, 6, 497–517. [Google Scholar] [CrossRef]
- Thiemig, V.; Rojas, R.; Zambrano-Bigiarini, M.; Levizzani, V.; De Roo, A. Validation of satellite-based precipitation products over sparsely gauged African river basins. J. Hydrometeorol. 2012, 13, 1760–1783. [Google Scholar] [CrossRef]
- Roca, R.; Chambon, P.; Jobard, I.; Kirstetter, P.-E.; Gosset, M.; Bergès, J.C. Comparing satellite and surface rainfall products over West Africa at meteorologically relevant scales during the AMMA campaign using error estimates. J. Appl. Meteorol. Climatol. 2010, 49, 715–731. [Google Scholar] [CrossRef]
- Qiao, L.; Hong, Y.; Chen, S.; Zou, C.B.; Gourley, J.J.; Yong, B. Performance assessment of the successive Version 6 and Version 7 TMPA products over the climate-transitional zone in the southern Great Plains, USA. J. Hydrol. 2014, 513, 446–456. [Google Scholar] [CrossRef]
- Gervais, M.; Gyakum, J.R.; Atallah, E.; Tremblay, L.B.; Neale, R.B. How well are the distribution and extreme values of daily precipitation over North America represented in the community climate system model? A comparison to reanalysis, satellite, and gridded station data. J. Clim. 2014, 27, 5219–5239. [Google Scholar] [CrossRef]
- Delahaye, F. Analyse Comparative des Différents Produits Satellitaires D’estimation des Précipitations en Amazonie Bresilienne. Ph.D Thesis, Université Rennes, Rennes, France, 2013. [Google Scholar]
- Vila, D.A.; de Goncalves, L.G.G.; Toll, D.L.; Rozante, J.R. Statistical evaluation of combined daily gauge observations and rainfall satellite estimates over continental South America. J. Hydrometeorol. 2009, 10, 533–543. [Google Scholar] [CrossRef]
- Tan, M.; Ibrahim, A.; Duan, Z.; Cracknell, A.; Chaplot, V. Evaluation of six high-resolution satellite and ground-based precipitation products over Malaysia. Remote Sens. 2015, 7, 1504–1528. [Google Scholar] [CrossRef]
- Yang, X.; Yong, B.; Hong, Y.; Chen, S.; Zhang, X. Error analysis of multi-satellite precipitation estimates with an independent raingauge observation network over a medium-sized humid basin. Hydrol. Sci. J. 2015. [Google Scholar] [CrossRef]
- Yong, B.; Liu, D.; Gourley, J.J.; Tian, Y.; Huffman, G.J.; Ren, L.; Hong, Y. Global view of real-time TRMM multi-satellite precipitation analysis: Implication to its successor global precipitation measurement mission. Bull. Am. Meteorol. Soc. 2014, 96, 283–296. [Google Scholar] [CrossRef]
- Miao, C.; Ashouri, H.; Hsu, K.-L.; Sorooshian, S.; Duan, Q. Evaluation of the PERSIANN-CDR daily rainfall estimates in capturing the behavior of extreme precipitation events over China. J. Hydrometeorol. 2015, 16, 1387–1396. [Google Scholar] [CrossRef]
- Pereira Filho, A.J.; Carbone, R.E.; Janowiak, J.E.; Arkin, P.; Joyce, R.; Hallak, R.; Ramos, C.G.M. Satellite rainfall estimates over south America: Possible applicability to the water management of large watersheds. JAWRA J. Am. Water Resour. Assoc. 2010, 46, 344–360. [Google Scholar] [CrossRef]
- Rozante, J.R.; Moreira, D.S.; de Goncalves, L.G.G.; Vila, D.A. Combining TRMM and surface observations of precipitation: technique and validation over South America. Weather Forecast. 2010, 25, 885–894. [Google Scholar] [CrossRef]
- Huffman, G.J.; Bolvin, D.T.; Nelkin, E.J.; Wolff, D.B.; Adler, R.F.; Gu, G.; Hong, Y.; Bowman, K.P.; Stocker, E.F. The TRMM Multisatellite Precipitation Analysis (TMPA): Quasi-global, multiyear, combined-sensor precipitation estimates at fine scales. J. Hydrometeorol. 2007, 8, 38–55. [Google Scholar] [CrossRef]
- Ebert, E.E.; Janowiak, J.E.; Kidd, C. Comparison of near-real-time precipitation estimates from satellite observations and numerical models. Bull. Am. Meteorol. Soc. 2007, 88, 47–64. [Google Scholar] [CrossRef]
- Zhang, X.-X.; Bi, X.-Q.; Kong, X.-H. Observed diurnal cycle of summer precipitation over South Asia and East Asia based on CMORPH and TRMM satellite data. Atmos. Ocean. Sci. Lett. 2015, 8, 101. [Google Scholar]
- Guo, H.; Chen, S.; Bao, A.; Hu, J.; Gebregiorgis, A.; Xue, X.; Zhang, X. Inter-comparison of high-resolution satellite precipitation products over Central Asia. Remote Sens. 2015, 7, 7181–7212. [Google Scholar] [CrossRef]
- Yong, B.; Chen, B.; Gourley, J.J.; Ren, L.; Hong, Y.; Chen, X.; Wang, W.; Chen, S.; Gong, L. Intercomparison of the Version-6 and Version-7 TMPA precipitation products over high and low latitudes basins with independent gauge networks: Is the newer version better in both real-time and post-real-time analysis for water resources and hydrologic extremes? J. Hydrol. 2014, 508, 77–87. [Google Scholar]
- Moazami, S.; Golian, S.; Kavianpour, M.R.; Hong, Y. Comparison of PERSIANN and V7 TRMM Multi-satellite Precipitation Analysis (TMPA) products with rain gauge data over Iran. Int. J. Remote Sens. 2013, 34, 8156–8171. [Google Scholar] [CrossRef]
- Collischonn, B.; Collischonn, W.; Tucci, C.E.M. Daily hydrological modeling in the Amazon basin using TRMM rainfall estimates. J. Hydrol. 2008, 360, 207–216. [Google Scholar] [CrossRef]
- Zulkafli, Z.; Buytaert, W.; Onof, C.; Manz, B.; Tarnavsky, E.; Lavado, W.; Guyot, J.-L. A comparative performance analysis of TRMM 3B42 (TMPA) Versions 6 and 7 for hydrological applications over Andean–Amazon river basins. J. Hydrometeorol. 2014, 15, 581–592. [Google Scholar] [CrossRef]
- Clarke, R.T.; Buarque, D.C.; de Paiva, R.C.D.; Collischonn, W. Issues of spatial correlation arising from the use of TRMM rainfall estimates in the Brazilian Amazon. Water Resour. Res. 2011, 47. [Google Scholar] [CrossRef]
- Tanaka, L.M.; Satyamurty, P.; Machado, L.A.T. Diurnal variation of precipitation in central Amazon Basin. Int. J. Climatol. 2014, 34, 3574–3584. [Google Scholar] [CrossRef]
- Huffman, G.J.; Adler, R.F.; Bolvin, D.T.; Nelkin, E.J. The TRMM Multi-Satellite Precipitation Analysis (TMPA). In Satellite Rainfall Applications for Surface Hydrology; Gebremichael, M., Hossain, F., Eds.; Springer Netherlands: Dordrecht, The Netherlands, 2010; pp. 3–22. [Google Scholar]
- Huffman, G.J.; David, T. Bolvin TRMM and other Data Precipitation Data Set Documentation; NASA: Greenbelt, MD, USA, 2013. [Google Scholar]
- Joyce, R.J.; Janowiak, J.E.; Arkin, P.A.; Xie, P. CMORPH: A method that produces global precipitation estimates from passive microwave and infrared data at high spatial and temporal resolution. J. Hydrometeorol. 2004, 5, 487–503. [Google Scholar] [CrossRef]
- Sorooshian, S.; Hsu, K.-L.; Gao, X.; Gupta, H.V.; Imam, B.; Braithwaite, D. Evaluation of PERSIANN system satellite–based estimates of tropical rainfall. Bull. Am. Meteorol. Soc. 2000, 81, 2035–2046. [Google Scholar] [CrossRef]
- Hammond, D.S. Tropical Forests of the Guiana Shield: Ancient Forests in a Modern World; CABI: Oxfordshire, UK, 2005. [Google Scholar]
- Bovolo, C.I.; Pereira, R.; Parkin, G.; Kilsby, C.; Wagner, T. Fine-scale regional climate patterns in the Guianas, tropical South America, based on observations and reanalysis data. Int. J. Climatol. 2012, 32, 1665–1689. [Google Scholar] [CrossRef]
- Beltrando, G. Les Climats: Processus, Variabilité et Risques; Armand Colin: Paris, France, 2011. [Google Scholar]
- Burroughs, W.J. L’encyclopédie du Climat; Delachaux et Niestlé: Lausanne, Switzerland, 2000. [Google Scholar]
- Marengo, J.A. Interannual variability of surface climate in the Amazon basin. Int. J. Climatol. 1992, 12, 853–863. [Google Scholar] [CrossRef]
- Marengo, J.A. Interannual variability of deep convection over the tropical South American sector as deduced from ISCCP C2 data. Int. J. Climatol. 1995, 15, 995–1010. [Google Scholar] [CrossRef]
- Satyamurty, P.; da Costa, C.P.W.; Manzi, A.O. Moisture source for the Amazon Basin: a study of contrasting years. Theor. Appl. Climatol. 2013, 111, 195–209. [Google Scholar] [CrossRef]
- Negri, A.J.; Anagnostou, E.N.; Adler, R.F. A 10-yr climatology of amazonian rainfall derived from passive microwave satellite observations. J. Appl. Meteorol. 2000, 39, 42–56. [Google Scholar] [CrossRef]
- Fitzjarrald, D.R.; Sakai, R.K.; Moraes, O.L.L.; Cosme de Oliveira, R.; Acevedo, O.C.; Czikowsky, M.J.; Beldini, T. Spatial and temporal rainfall variability near the Amazon-Tapajós confluence. J. Geophys. Res. 2008, 113. [Google Scholar] [CrossRef]
- Buarque, D.C.; de Paiva, R.C.D.; Clarke, R.T.; Mendes, C.A.B. A comparison of Amazon rainfall characteristics derived from TRMM, CMORPH and the Brazilian national rain gauge network. J. Geophys. Res. 2011, 116. [Google Scholar] [CrossRef]
- Paiva, R.C.D.; Buarque, D.C.; Clarke, R.T.; Collischonn, W.; Allasia, D.G. Reduced precipitation over large water bodies in the Brazilian Amazon shown from TRMM data: TRMM rainfall reduction Amazon Rivers. Geophys. Res. Lett. 2011, 38. [Google Scholar] [CrossRef]
- Dos Santos, M.J.; Silva Dias, M.A.F.; Freitas, E.D. Influence of local circulations on wind, moisture, and precipitation close to Manaus City, Amazon Region, Brazil. J. Geophys. Res. Atmospheres 2014, 119, 233–249. [Google Scholar] [CrossRef]
- Cutrim, E.; Martin, D.W.; Rabin, R. Enhancement of cumulus clouds over deforested lands in Amazonia. Bull. Am. Meteorol. Soc. 1995, 76, 1801–1805. [Google Scholar] [CrossRef]
- Silva Dias, M.A.F.; Silva Dias, P.L.; Longo, M.; Fitzjarrald, D.R.; Denning, A.S. River breeze circulation in eastern Amazonia: Observations and modelling results. Theor. Appl. Climatol. 2004, 78, 111–121. [Google Scholar] [CrossRef]
- Pereira, R.; Bovolo, C.I.; Forsythe, N.; Pedentchouk, N.; Parkin, G.; Wagner, T. Seasonal patterns of rainfall and river isotopic chemistry in northern Amazonia (Guyana): From the headwater to the regional scale. J. South Am. Earth Sci. 2014, 52, 108–118. [Google Scholar] [CrossRef]
- Watson, D.F.; Philip, G.M. Triangle based interpolation. J. Int. Assoc. Math. Geol. 1984, 16, 779–795. [Google Scholar] [CrossRef]
- Ward, J.H. Hierarchical grouping to optimize an objective function. J. Am. Stat. Assoc. 1963, 58, 236–244. [Google Scholar] [CrossRef]
- Gordon, A.D. A review of hierarchical classification. J. R. Stat. Soc. 1987, 150, 119–137. [Google Scholar] [CrossRef]
- Ghajarnia, N.; Liaghat, A.; Daneshkar Arasteh, P. Comparison and evaluation of high resolution precipitation estimation products in Urmia Basin-Iran. Atmos. Res. 2015, 158–159, 50–65. [Google Scholar] [CrossRef]
- Yong, B.; Hong, Y.; Ren, L.-L.; Gourley, J.J.; Huffman, G.J.; Chen, X.; Wang, W.; Khan, S.I. Assessment of evolving TRMM-based multisatellite real-time precipitation estimation methods and their impacts on hydrologic prediction in a high latitude basin. J. Geophys. Res. 2012, 117. [Google Scholar] [CrossRef]
- Yong, B.; Ren, L.; Hong, Y.; Gourley, J.J.; Tian, Y.; Huffman, G.J.; Chen, X.; Wang, W.; Wen, Y. First evaluation of the climatological calibration algorithm in the real-time TMPA precipitation estimates over two basins at high and low latitudes: Validation of crucial algorithmic upgrade in NASA TMPA. Water Resour. Res. 2013, 49, 2461–2472. [Google Scholar] [CrossRef]
- NASA. Available online: ftp://disc2.nascom.nasa.gov/data/TRMM/Gridded/3B42_V7/ (accessed on 1 December 2015).
- NASA. Available online: ftp://disc2.nascom.nasa.gov/data/TRMM/Gridded/3B42RT/ (accessed on 1 December 2015).
- UCI. Available online: ftp://persiann.eng.uci.edu/pub/PERSIANN/tar_3hr/ (accessed on 1 December 2015).
- NOAA. Available online: http://ftp.cpc.ncep.noaa.gov/precip/CMORPH_V1.0/RAW/ (accessed on 1 December 2015).
- Hidroweb. Available online: http://www.snirh.gov.br/hidroweb/ (accessed on 2 December 2015).
- Kummerow, C.; Hong, Y.; Olson, W.; Yang, S.; Adler, R.; McCollum, J.; Ferraro, R.; Petty, G.; Shin, D.-B.; Wilheit, T. Evolution of the Goddard profiling algorithm (GPROF) for rainfall estimatin from passive microwave sensors. J. Appl. Meteorol. 2001, 40, 1801–1820. [Google Scholar] [CrossRef]
- Warner, T.T.; Mapes, B.E.; Xu, M. Diurnal patterns of rainfall in northwestern south America. Part II: Model simulations. Mon. Weather Rev. 2003, 131, 813–829. [Google Scholar] [CrossRef]
- Gianotti, R.L.; Zhang, D.; Eltahir, E.A.B. Assessment of the regional climate model version 3 over the maritime continent using different cumulus parameterization and land surface schemes. J. Clim. 2012, 25, 638–656. [Google Scholar] [CrossRef]
- Tian, Y.; Peters-Lidard, C.D.; Choudhury, B.J.; Garcia, M. Multitemporal analysis of TRMM-based satellite precipitation products for land data assimilation applications. J. Hydrometeorol. 2007, 8, 1165–1183. [Google Scholar] [CrossRef]
- Adler, R.F.; Negri, A.J.; Keehn, P.R.; Hakkarinen, I.M. Estimation of monthly rainfall over Japan and surrounding waters from a combination of low-orbit microwave and geosynchronous IR data. J. Appl. Meteorol. 1993, 32, 335–356. [Google Scholar] [CrossRef]
- Shepherd, J.M.; Grundstein, A.J.; Mote, T.L. An analysis of seasonal biases in satellite and reanalysis rainfall products in the Savannah River basin. Phys. Geogr. 2014, 35, 181–194. [Google Scholar] [CrossRef]
- Parzen, E. On estimation of a probability density function and mode. Ann. Math. Stat. 1962, 33, 1065–1076. [Google Scholar] [CrossRef]
- Sharma, A. Seasonal to interannual rainfall probabilistic forecasts for improved water supply management: Part 3−A nonparametric probabilistic forecast model. J. Hydrol. 2000, 239, 249–258. [Google Scholar] [CrossRef]
- Tian, Y.; Peters-Lidard, C.D. Systematic anomalies over inland water bodies in satellite-based precipitation estimates. Geophys. Res. Lett. 2007, 34. [Google Scholar] [CrossRef]
- Tian, Y.; Peters-Lidard, C.D. A global map of uncertainties in satellite-based precipitation measurements: Uncertainties in precipitation data. Geophys. Res. Lett. 2010, 37. [Google Scholar] [CrossRef]
- Katiraie-Boroujerdy, P.-S.; Nasrollahi, N.; Hsu, K.; Sorooshian, S. Evaluation of satellite-based precipitation estimation over Iran. J. Arid Environ. 2013, 97, 205–219. [Google Scholar] [CrossRef]
© 2015 by the authors; licensee MDPI, Basel, Switzerland. This article is an open access article distributed under the terms and conditions of the Creative Commons by Attribution (CC-BY) license (http://creativecommons.org/licenses/by/4.0/).