
High-Resolution Imagery of Earth at Night: New Sources, Opportunities and Challenges

 ,
, 
 ,
,
Abstract
:
1. Introduction
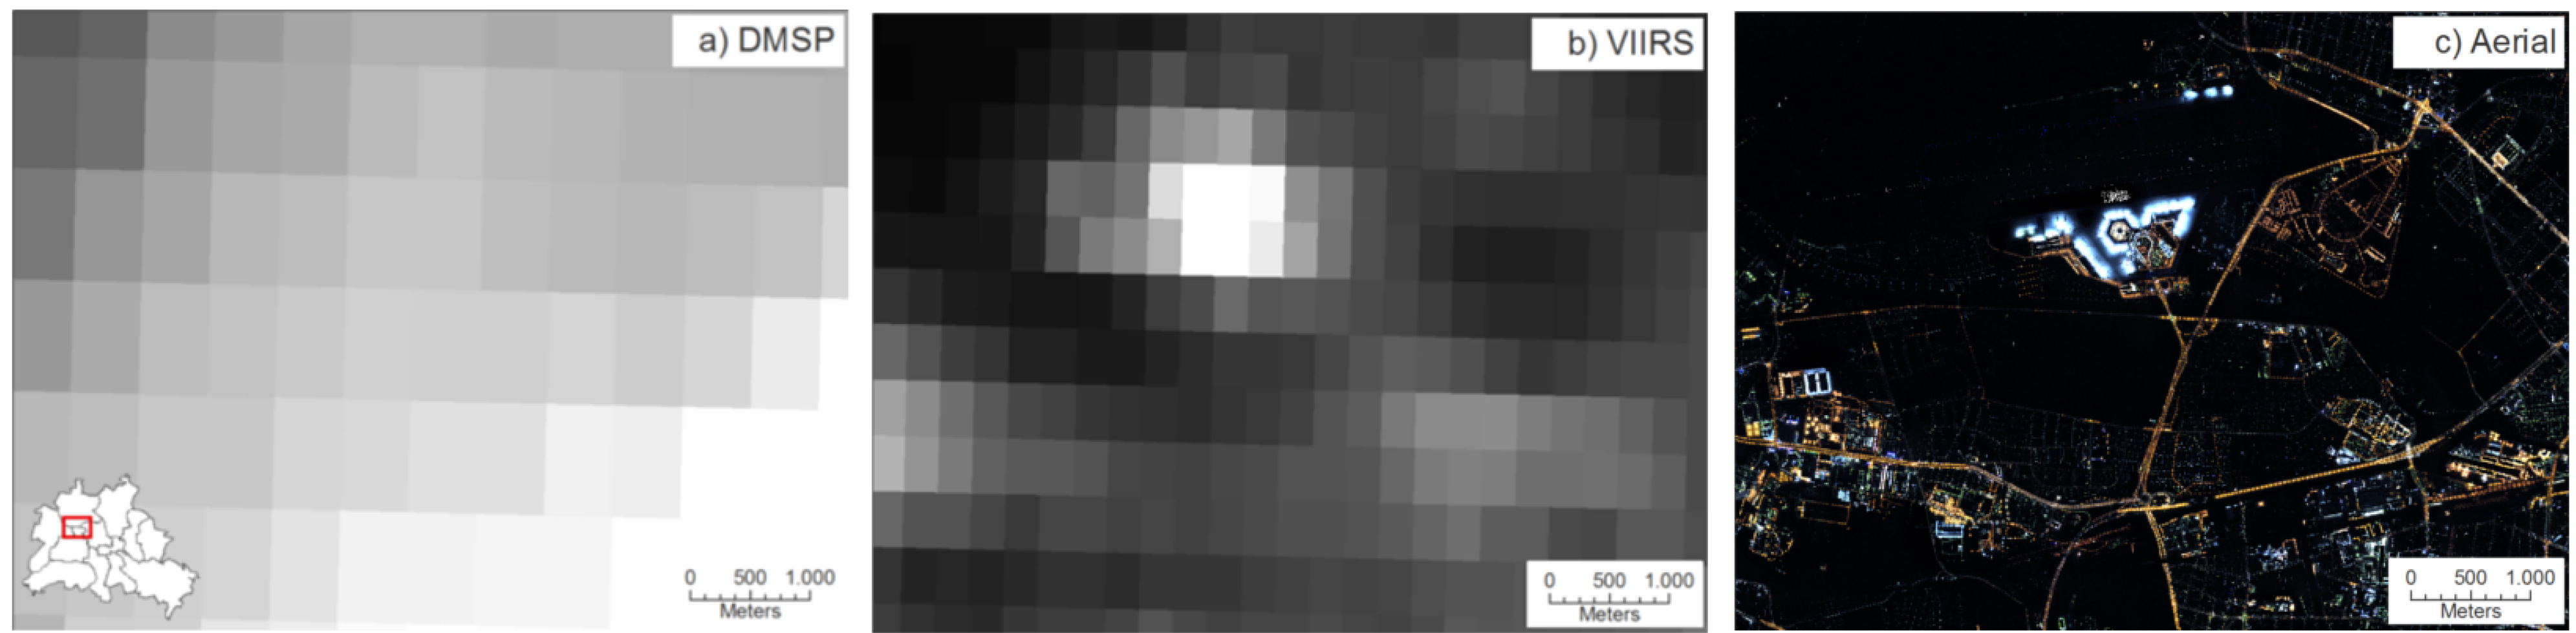
1.1. Data Sources
1.2. Sources of Light
2. Experimental Section
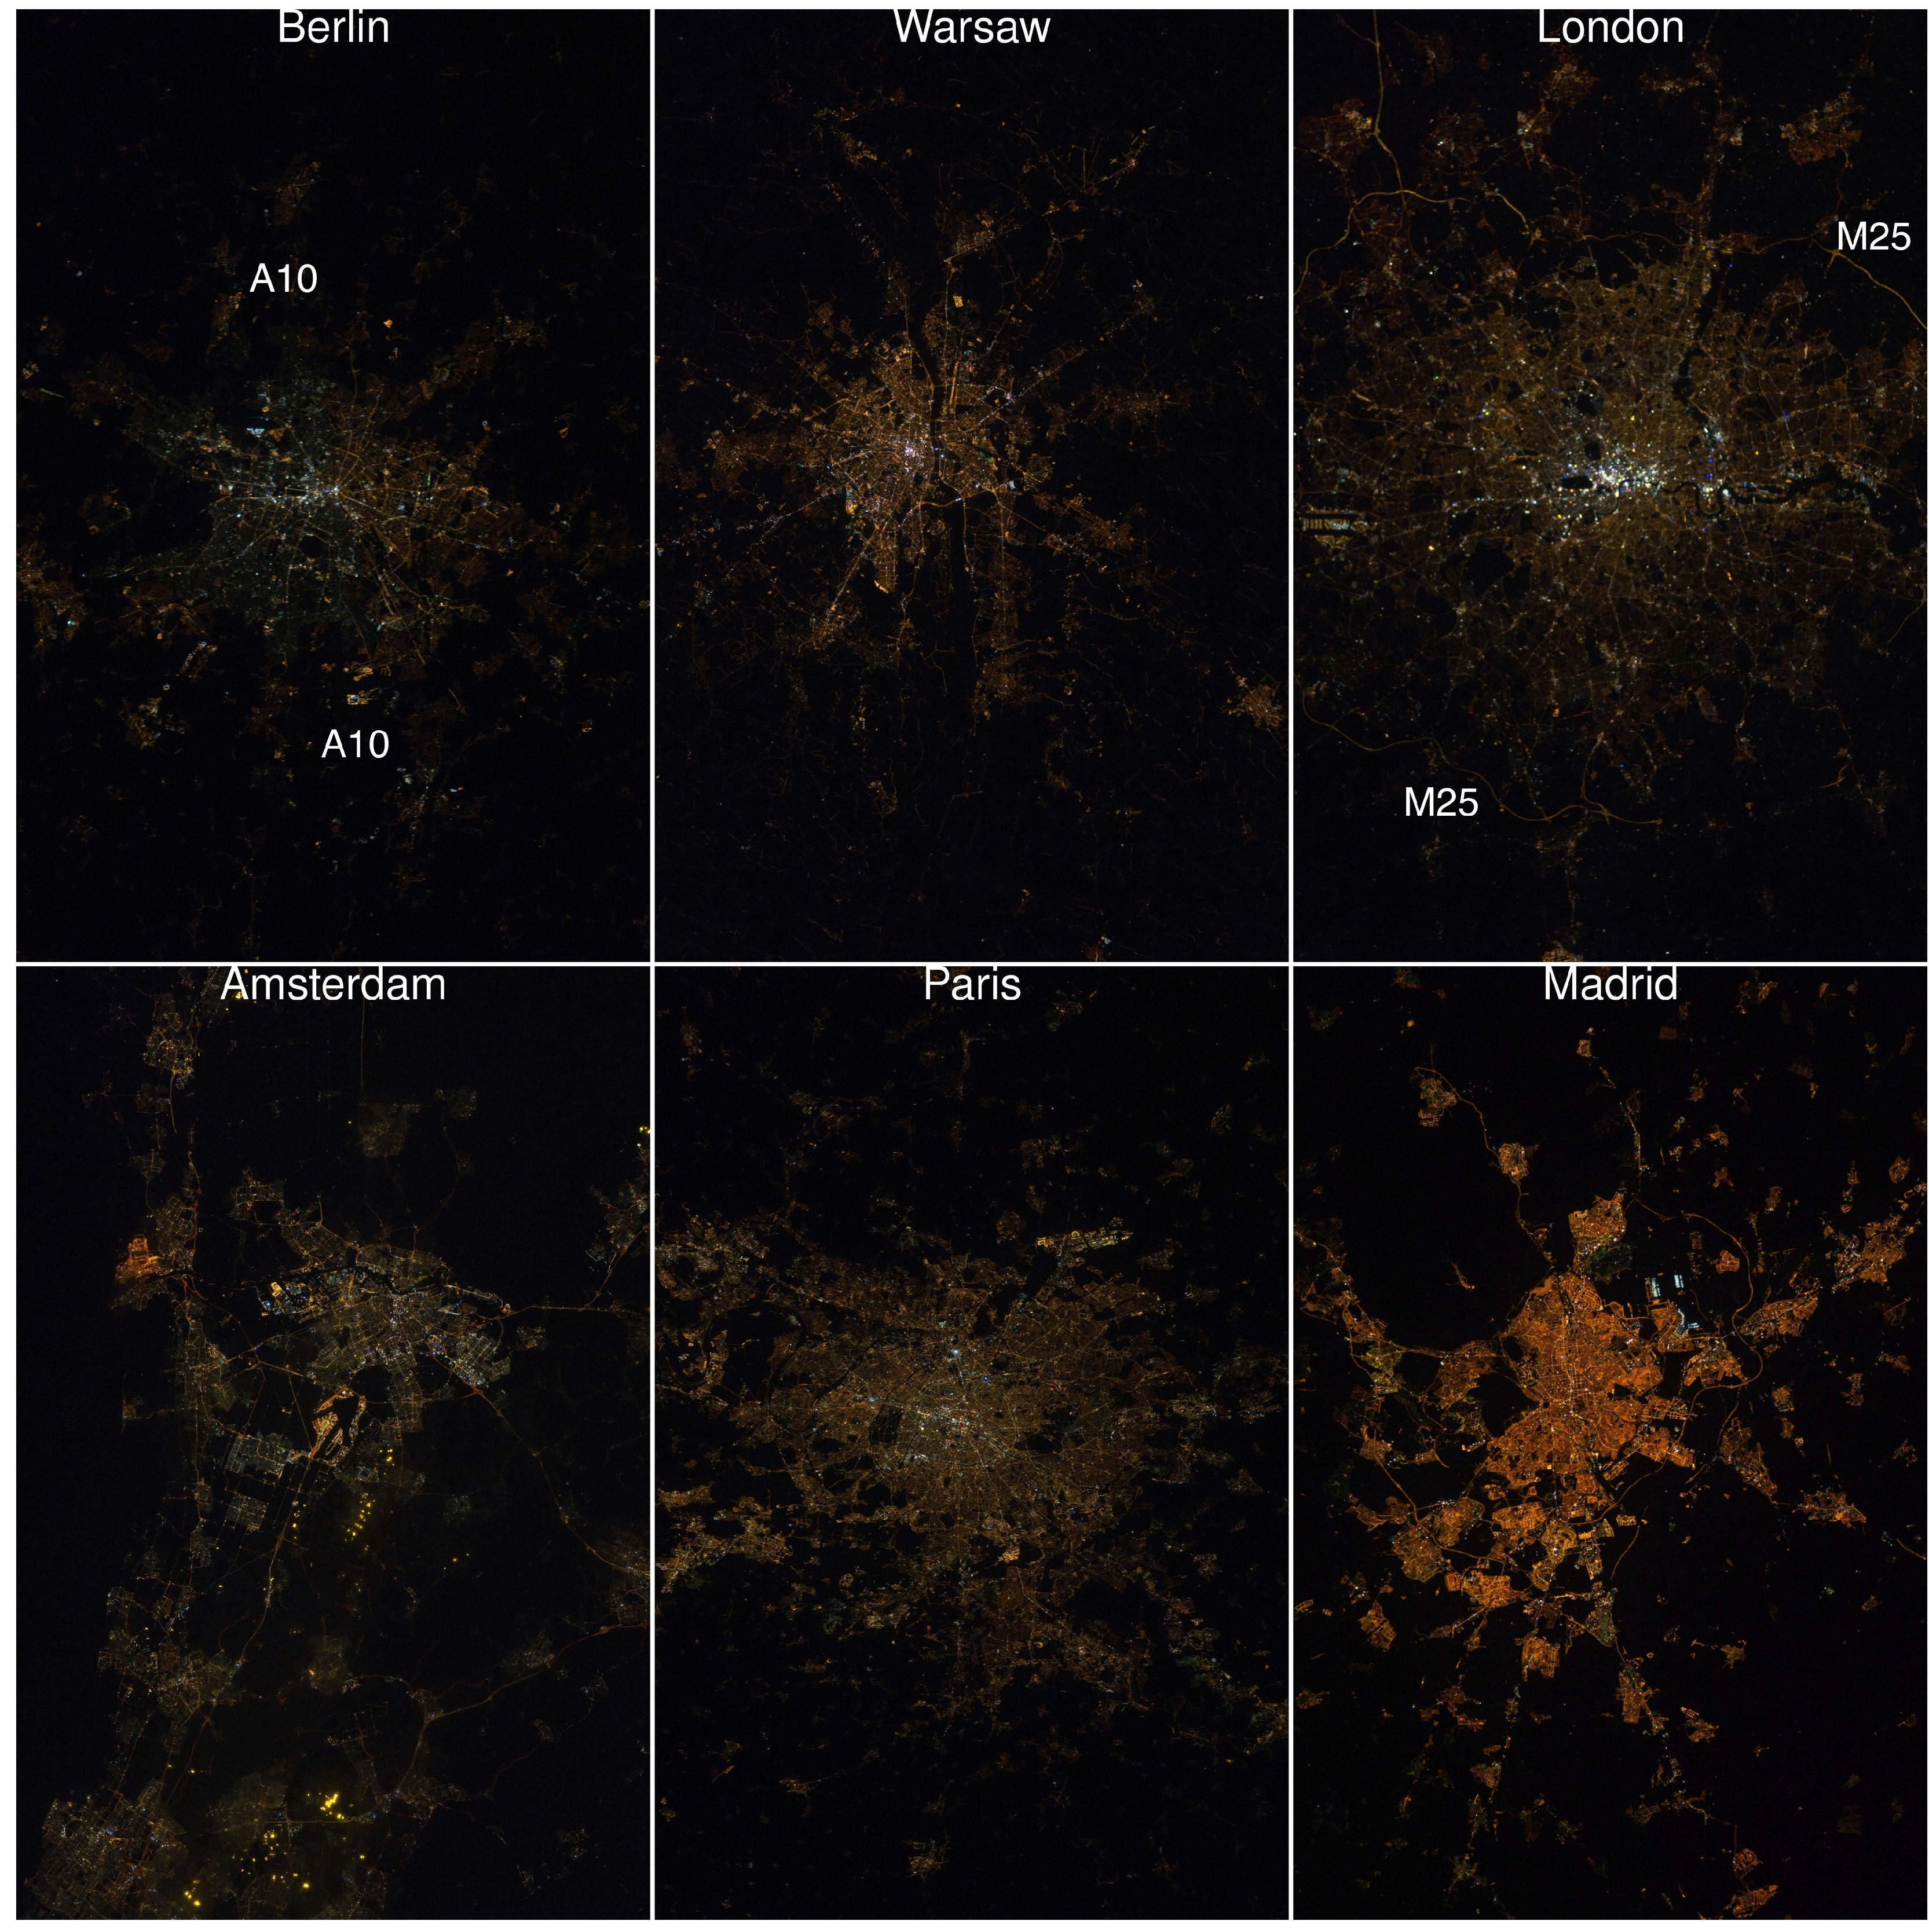
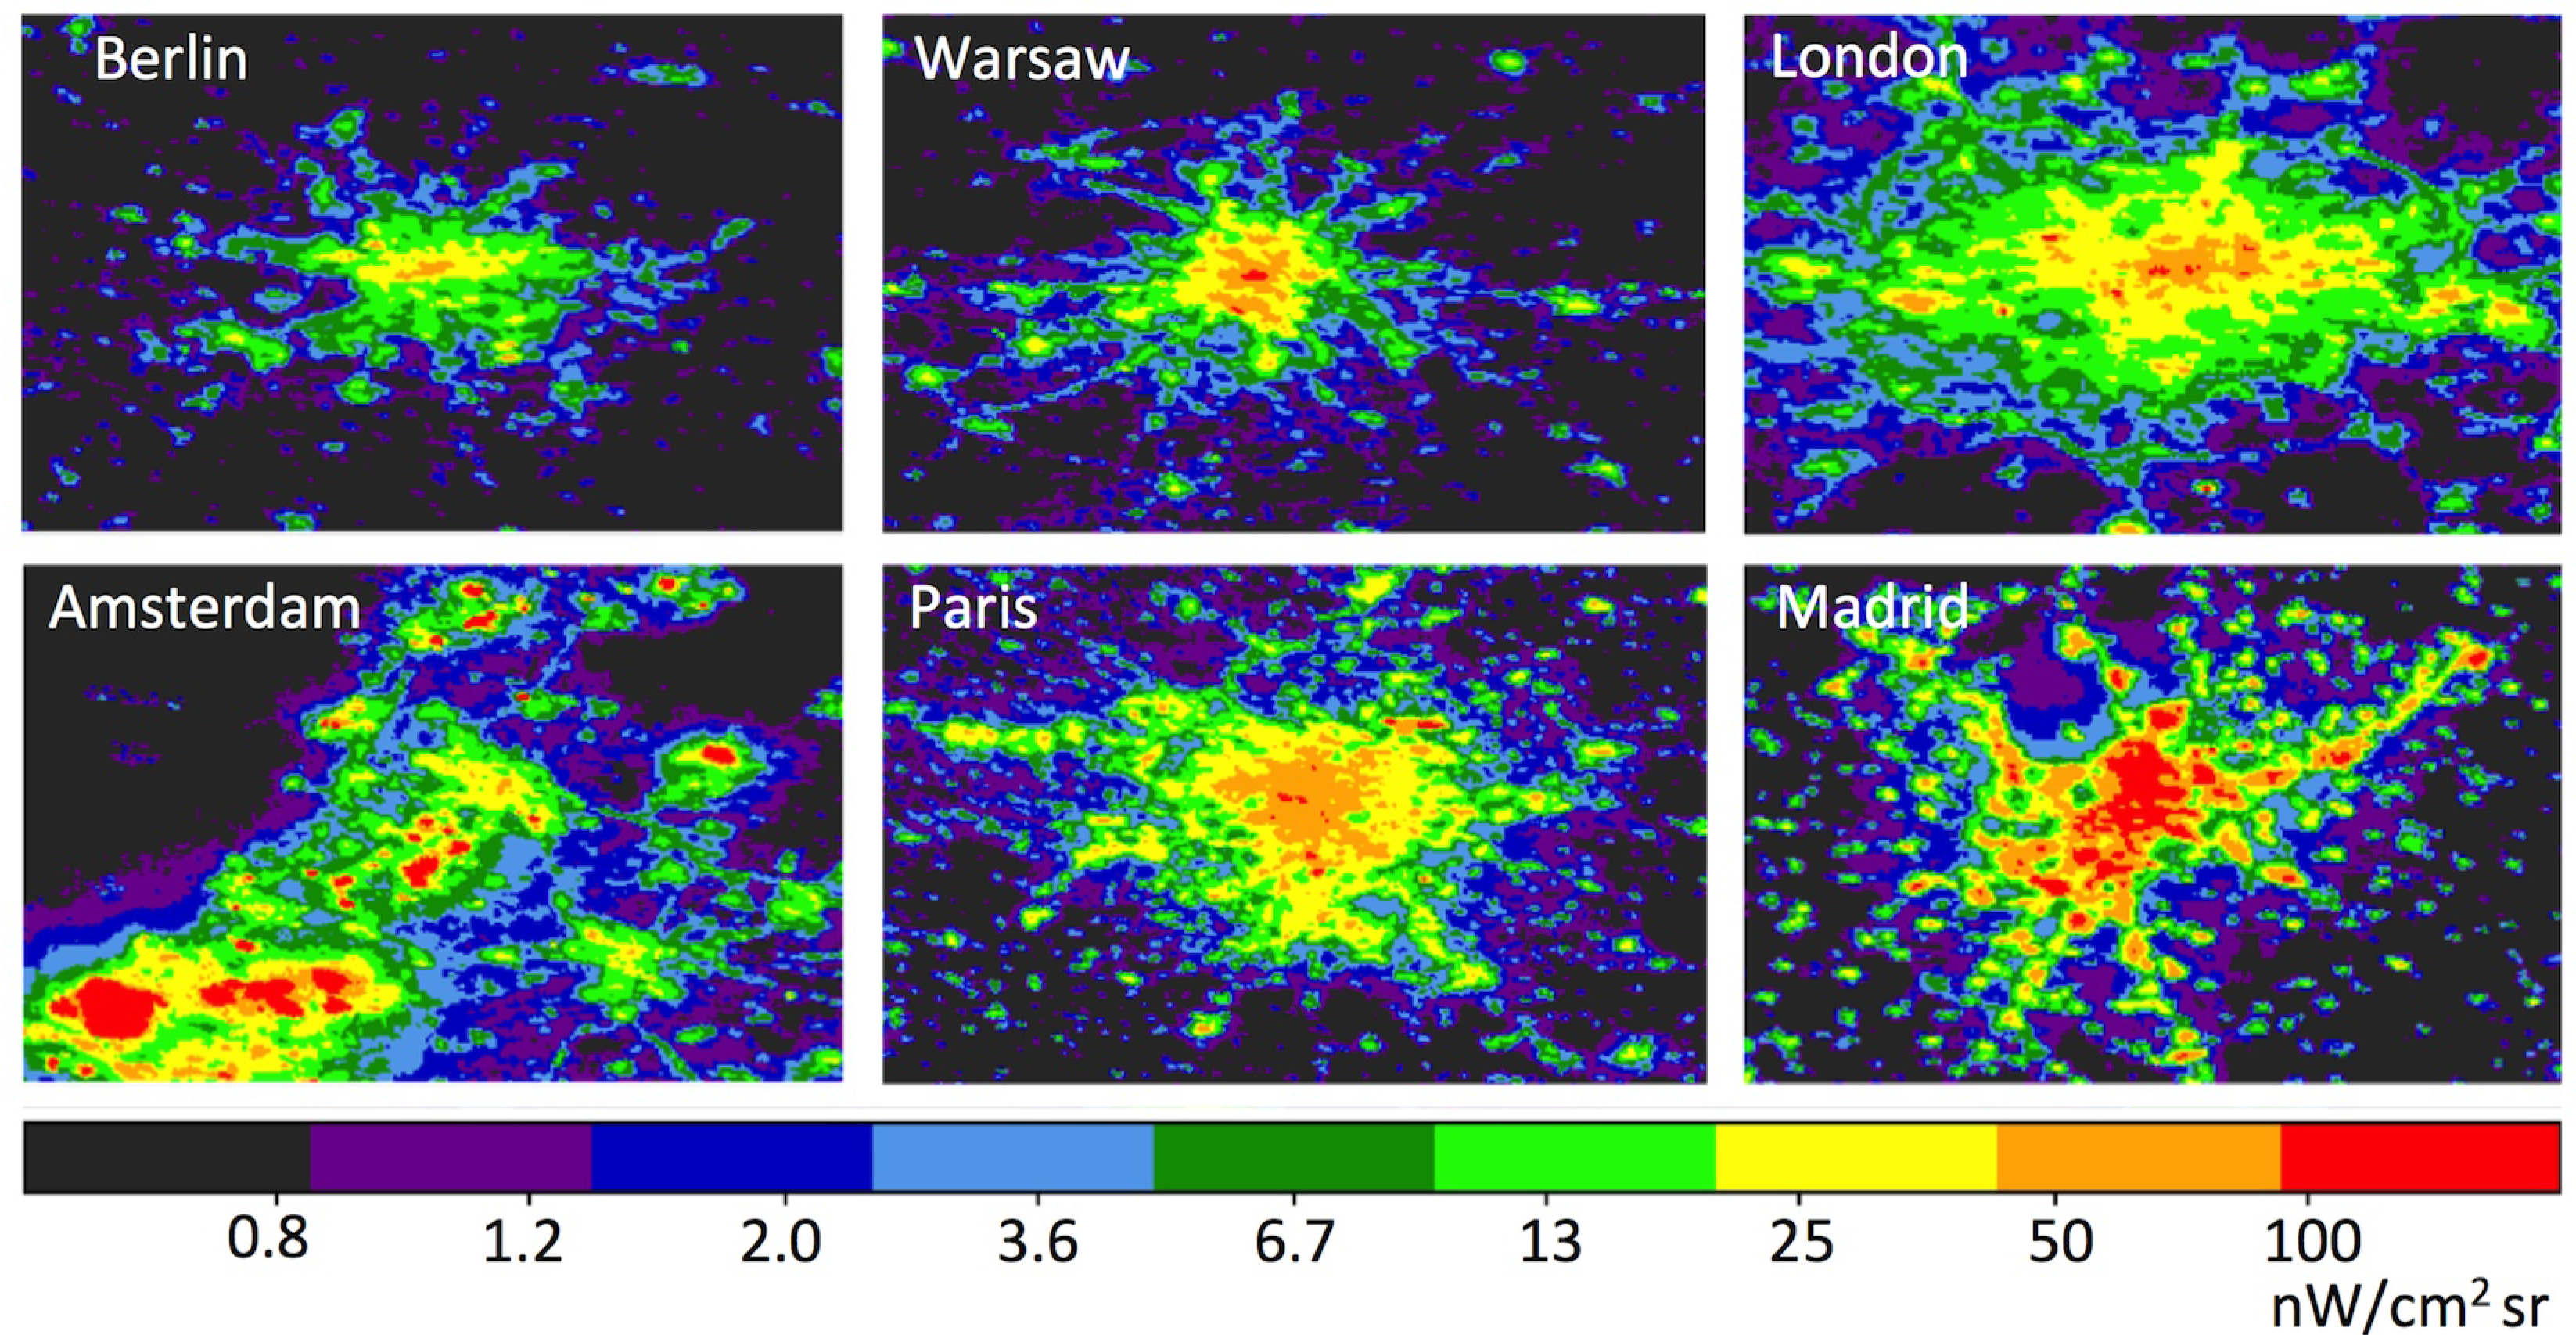
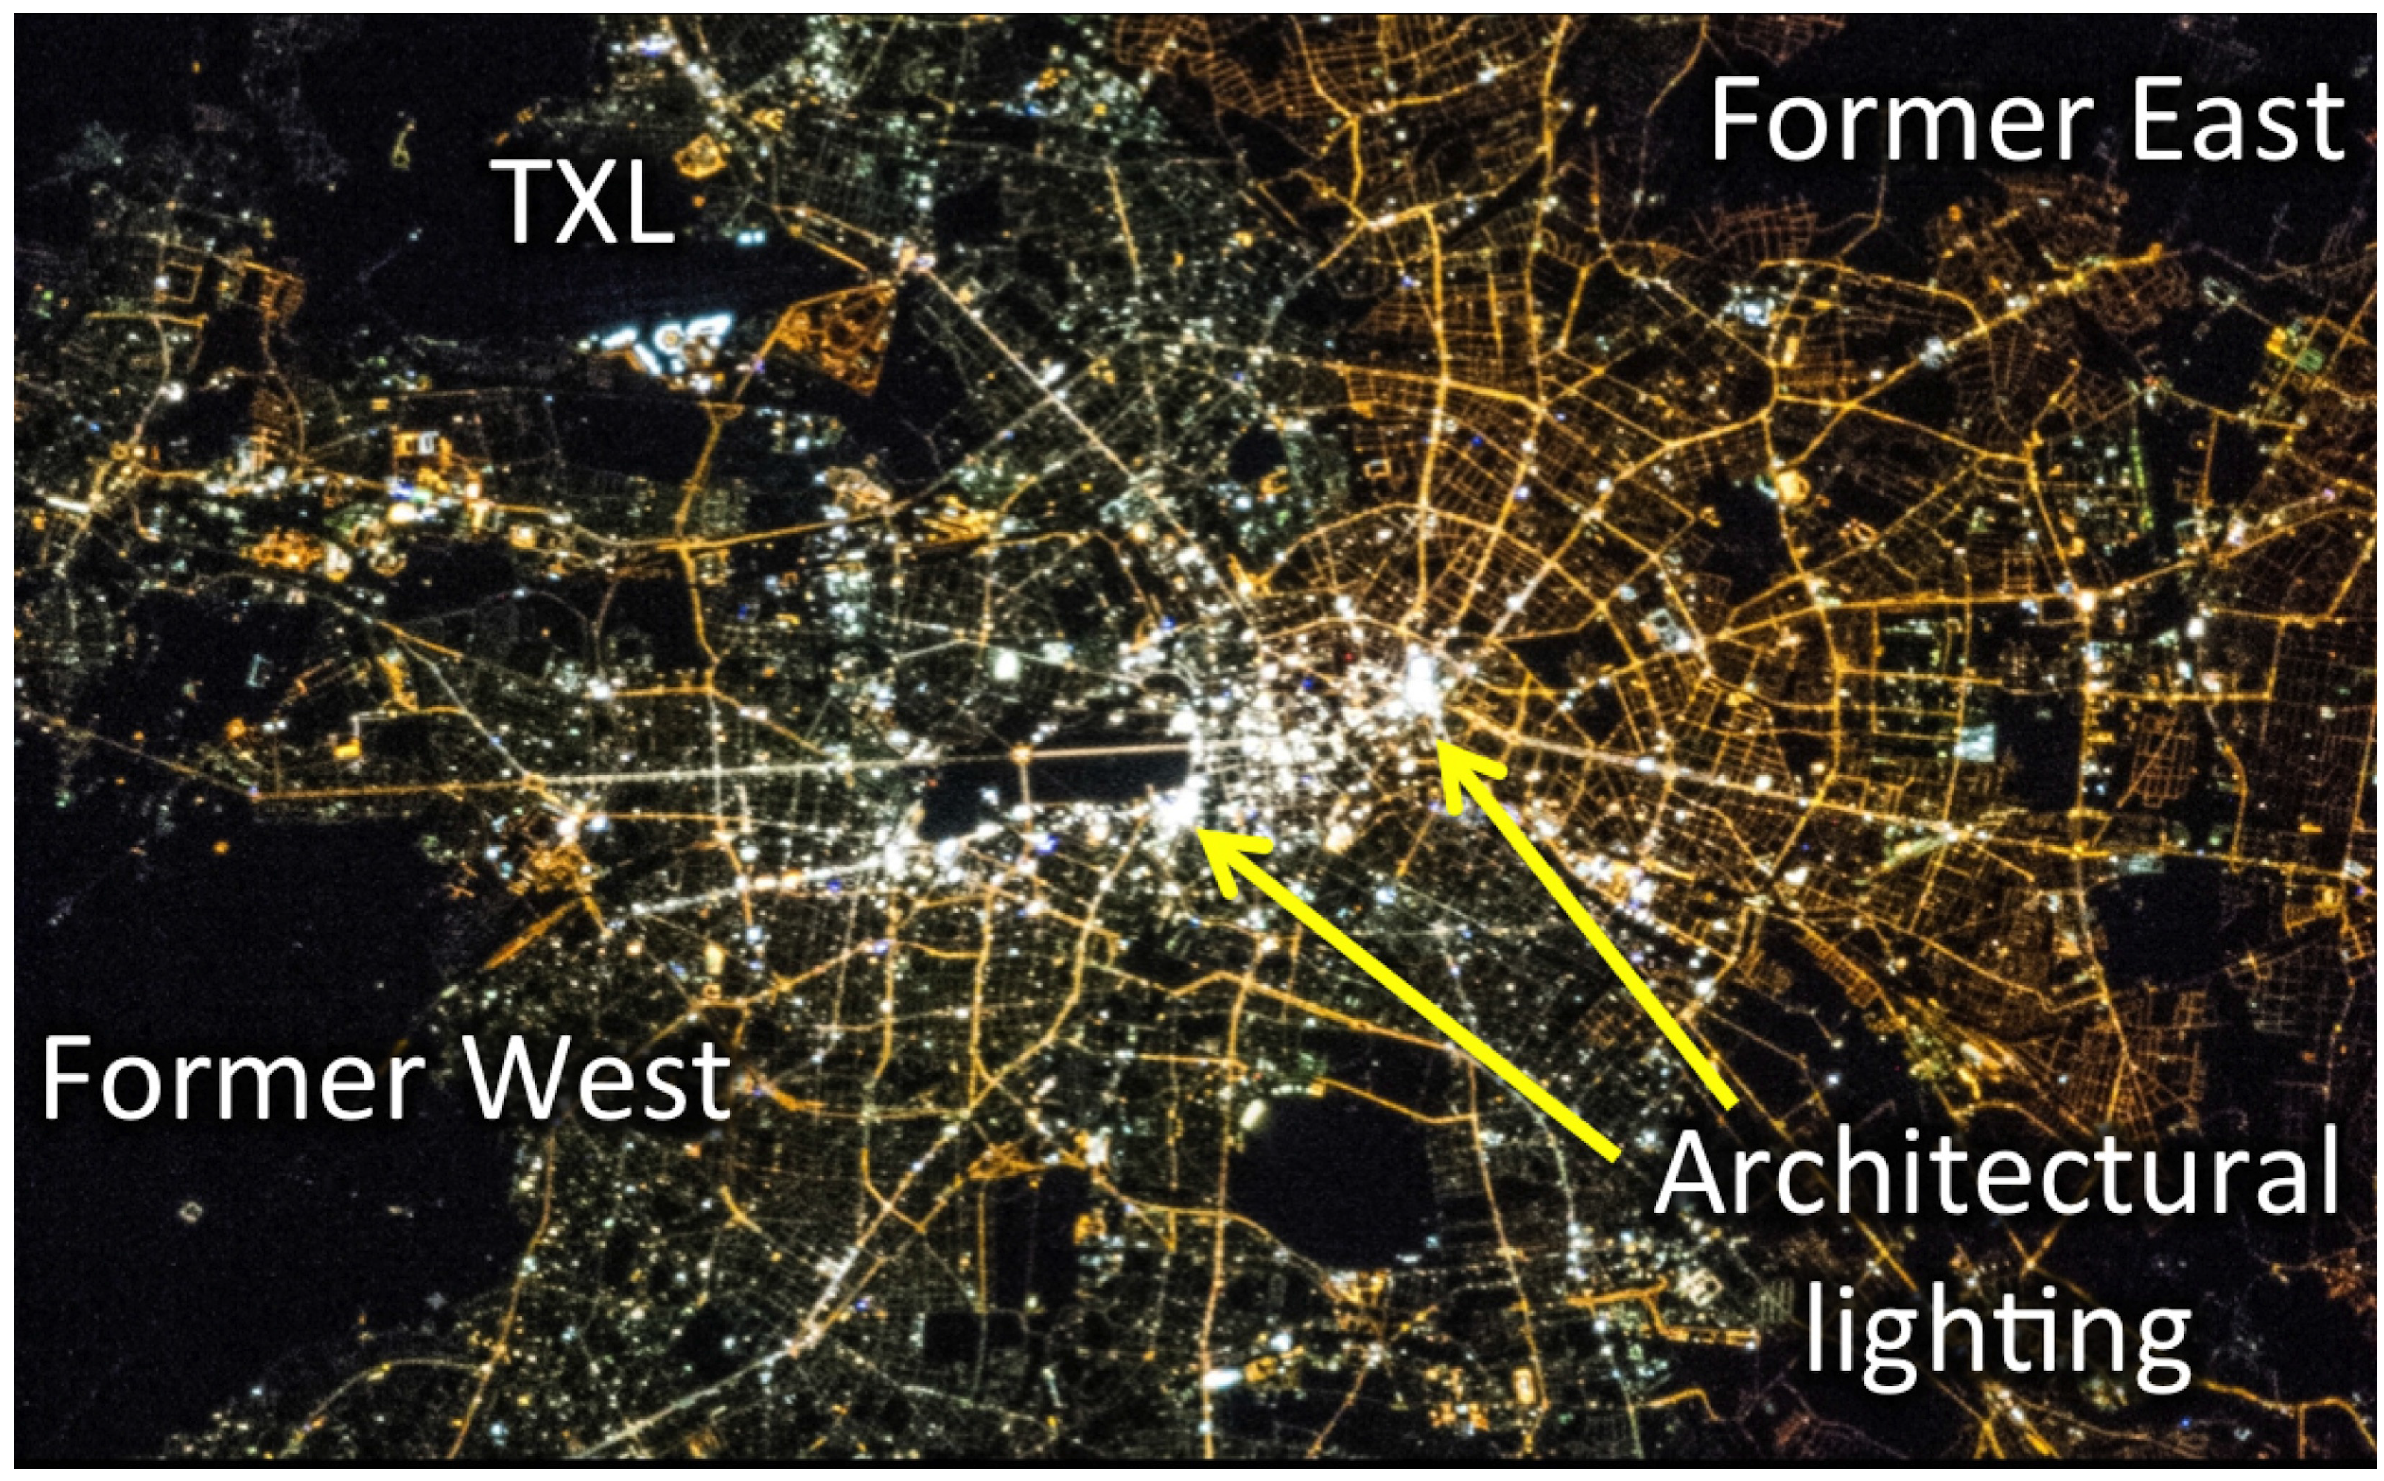
2.1. Case Study 1: Differences in City Lighting at Small Spatial Scales
2.1.1. Background
2.1.2. Dataset


| City | Population (Millions) | Image Name | Local Time |
|---|---|---|---|
| Berlin | 3.5 | iss030-e-085815 | 22:36 |
| Warsaw | 1.7 | iss030-e-085827 | 22:38 |
| London | 9.0 | iss030-e-085899 | 23:10 * |
| Amsterdam | 1.1 | iss030-e-085908 | 00:11 |
| Paris | 10.6 | iss030-e-085807 | 22:35 |
| Madrid | 6.6 | iss030-e-082053 ** | 03:23 |
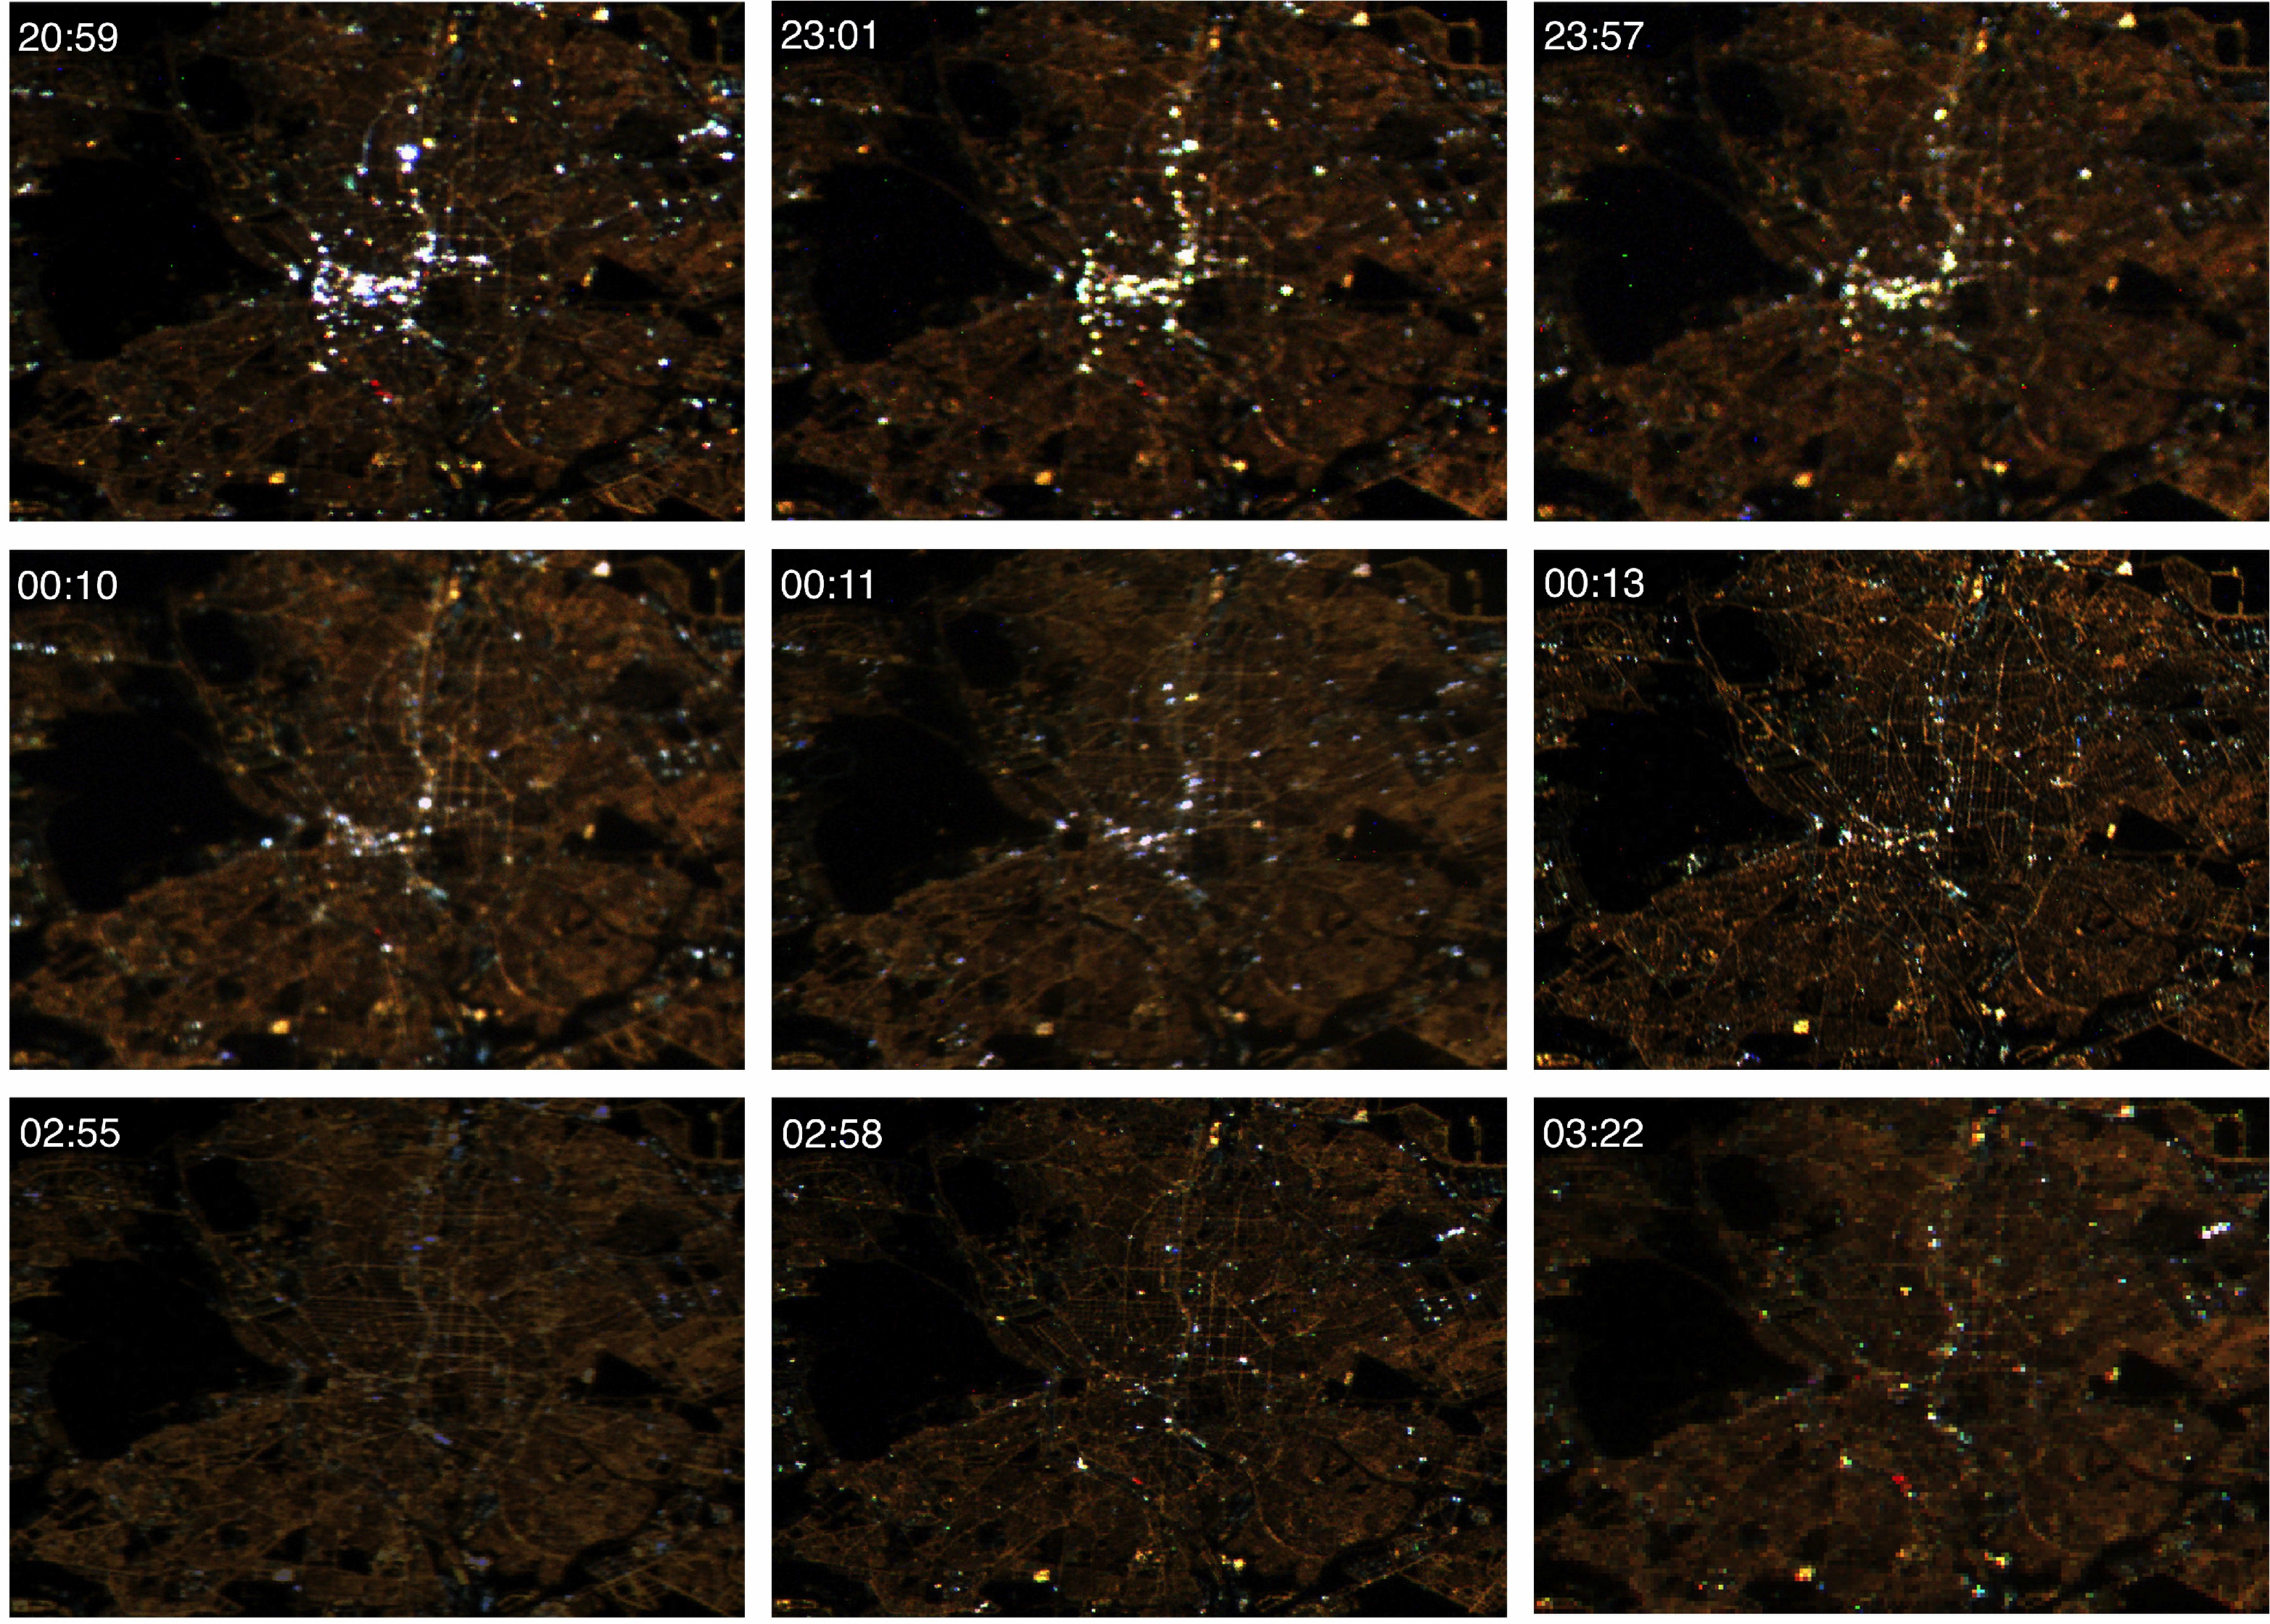
2.1.3. Observations
| Image Name | Night of Week | Date (UT) | Local Time |
|---|---|---|---|
| iss034e005868 | Saturday | 2012-12-08 19:59:33 | 20:59 |
| iss030e209454 | Sunday | 2012-04-08 21:01:12 | 23:01 |
| iss030e209271 | Saturday | 2012-04-07 21:57:03 | 23:57 |
| iss035e023371 | Thursday | 2013-04-18 22:10:09 | 00:10 |
| iss026e026495 | Friday | 2011-02-11 23:11:54 | 00:11 |
| iss032e015065 | Sunday | 2012-08-05 22:13:58 | 00:13 |
| iss034e058838 | Thursday | 2013-02-08 01:55:32 | 02:55 |
| iss030e188196 | Tuesday | 2012-03-28 01:58:48 | 02:58 |
| iss030e082053 | Saturday | 2012-02-12 02:22:47 | 03:22 |
2.1.4. Commentary
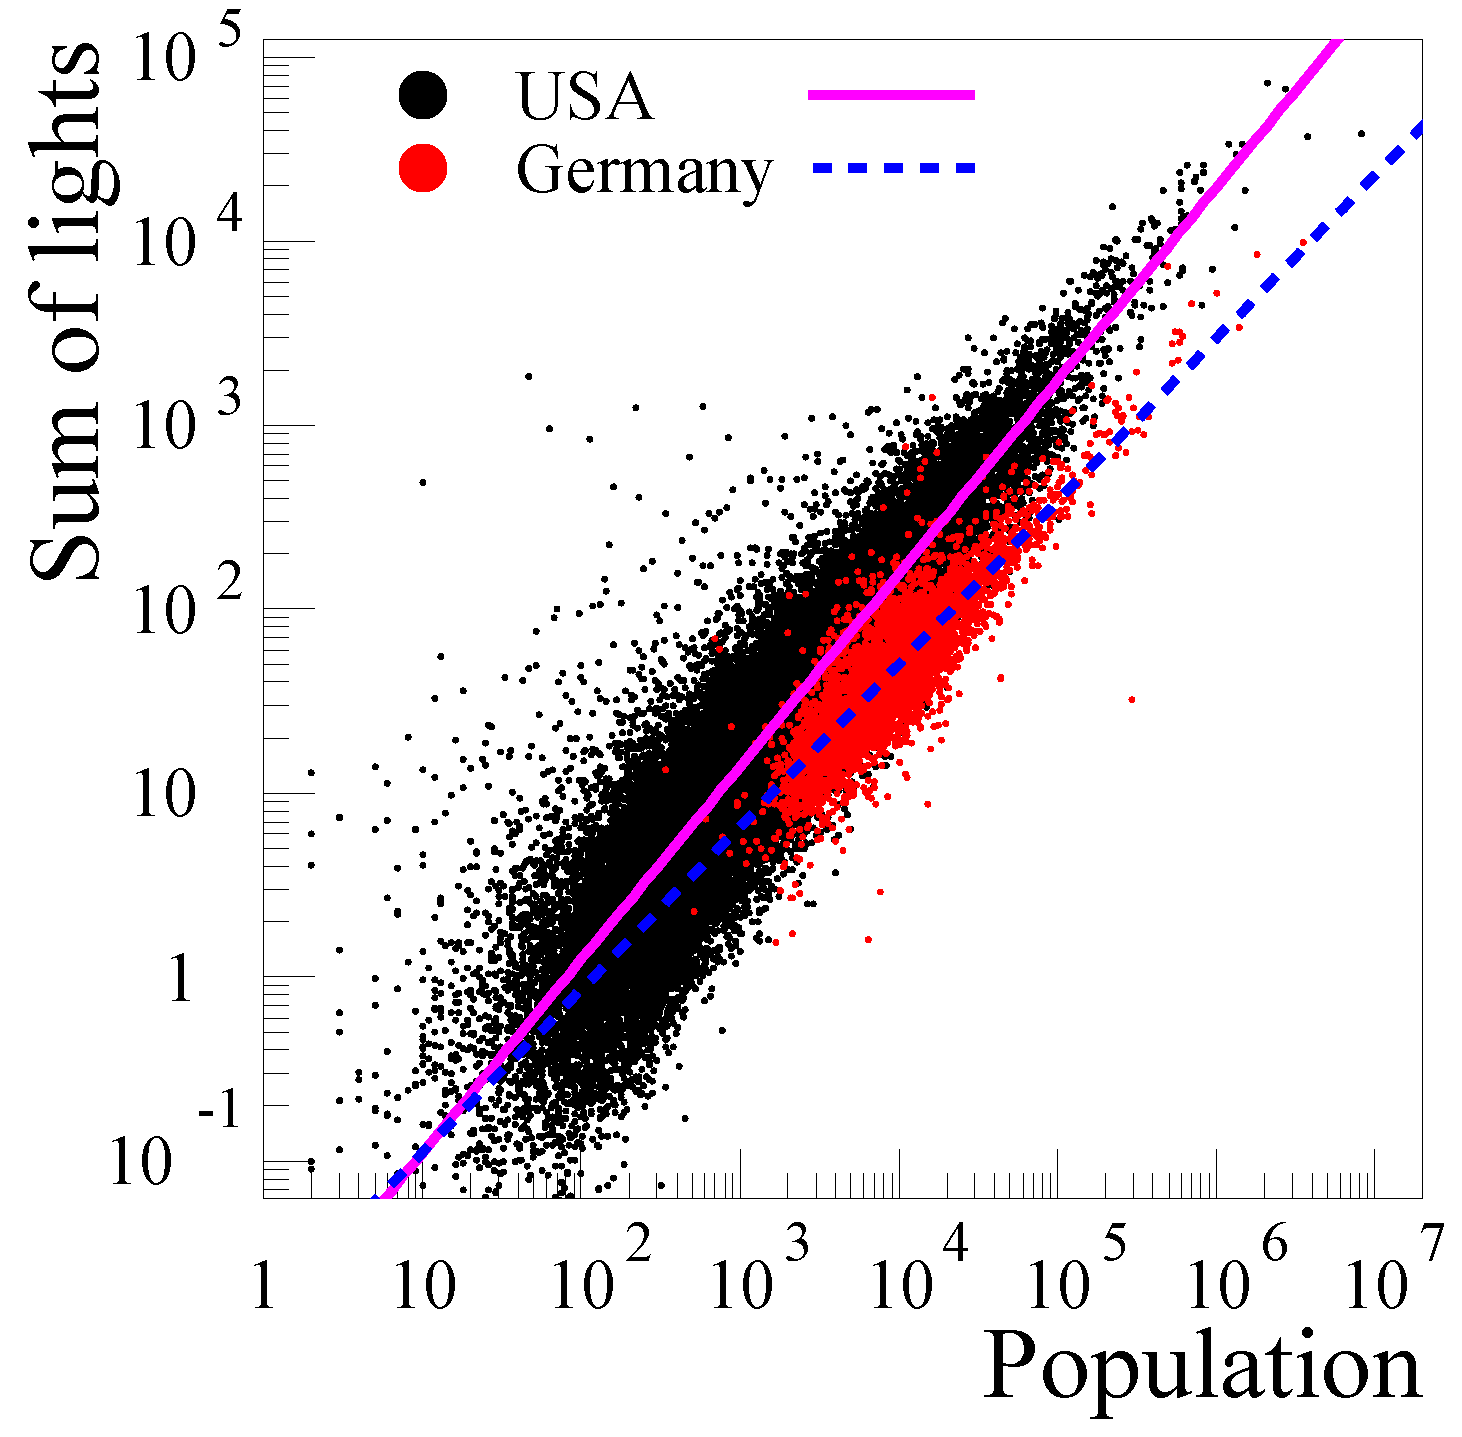
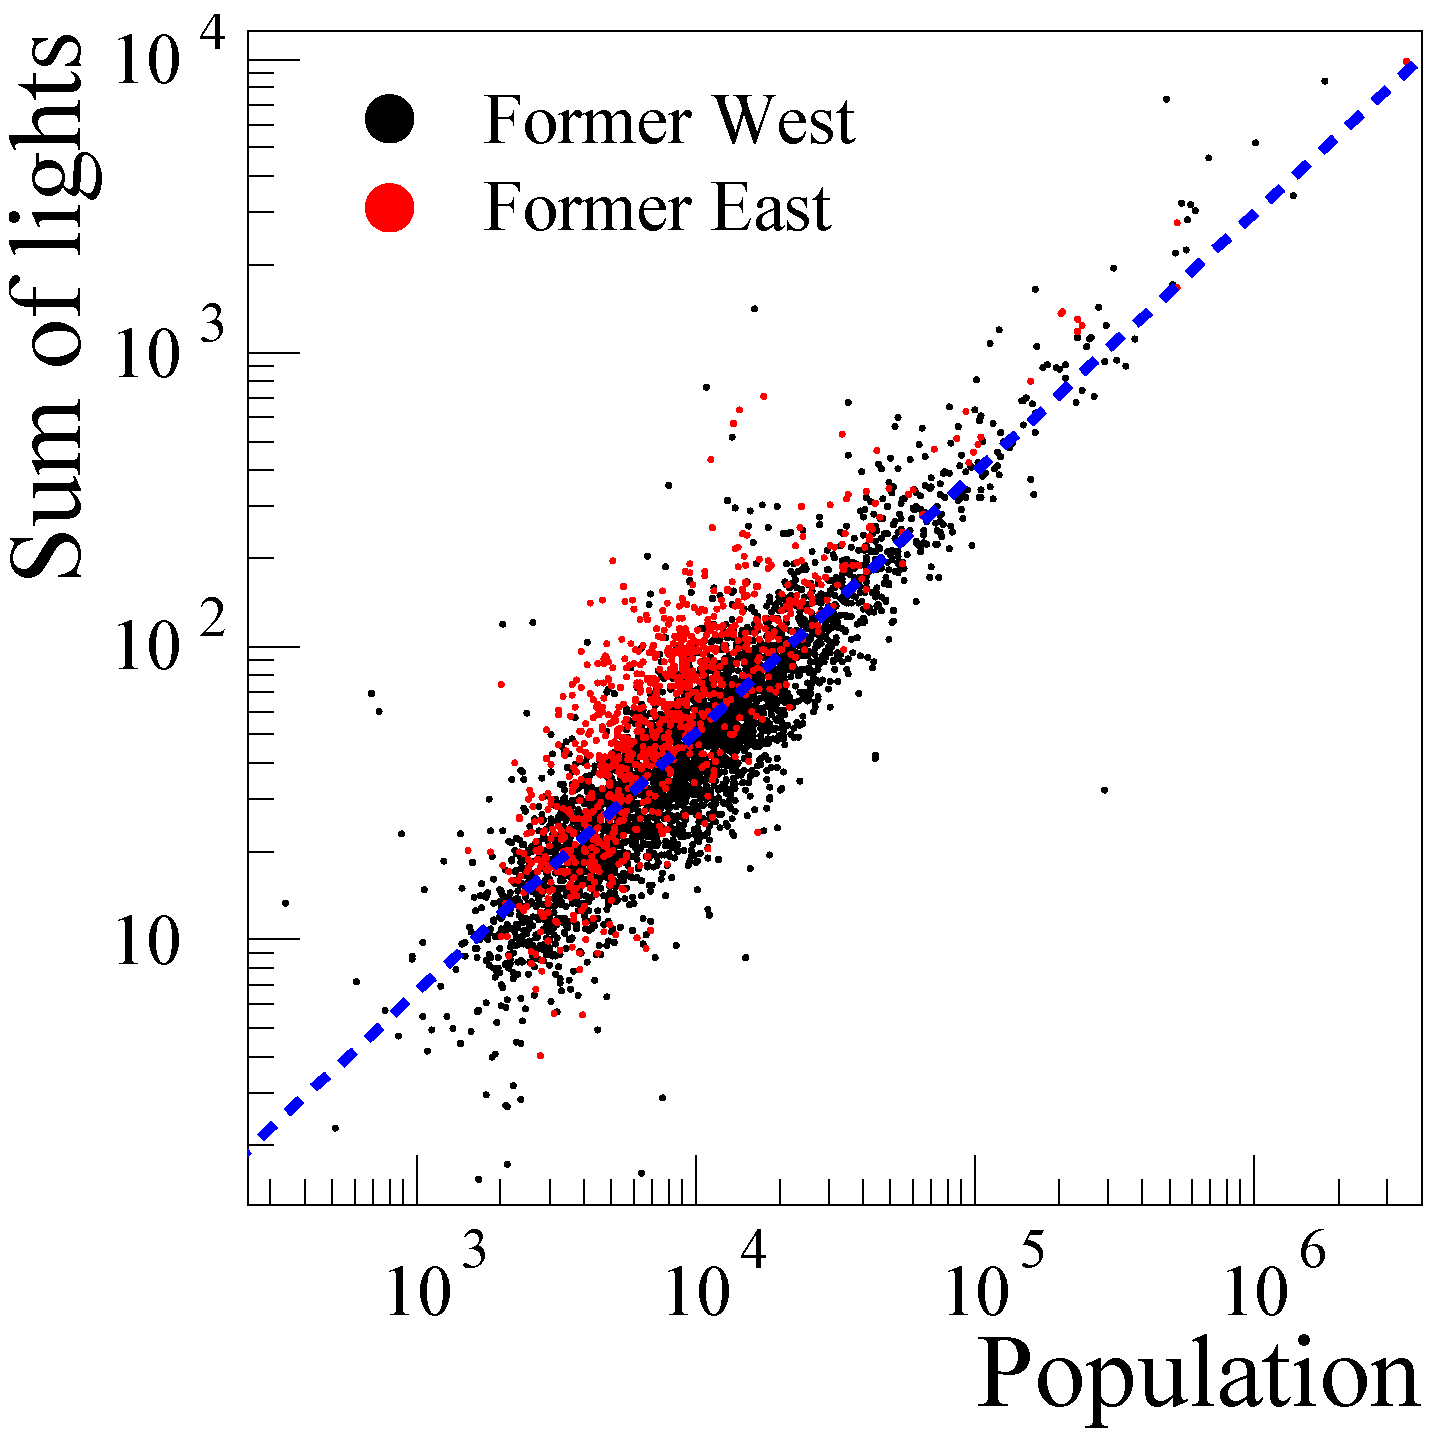
2.2. Case Study 2: Community Light Use in Germany and the USA
2.2.1. Background
2.2.2. Dataset
2.2.3. Observations


2.2.4. Commentary

2.3. Case Study 3: The Brightest Large-Scale Light Sources
2.3.1. Background
2.3.2. Dataset
2.3.3. Observations

| Airport | Passengers (M) | Radiance (nW/cm2sr) | Relative to Tokyo |
|---|---|---|---|
| Atlanta (ATL) | 95.5 | 197 | 3.6 |
| Beijing (PEK) | 81.9 | 237 | 4.3 |
| London (LHR) | 70.0 | 82 | 1.5 |
| Tokyo (HND) | 66.8 | 55 | 1.0 |
| Chicago (ORD) | 66.6 | 246 | 4.5 |
| Los Angeles (LAX) | 63.7 | 165 | 3.0 |
| Paris (CDG) | 61.6 | 179 | 3.3 |
| Dallas/Fort Worth (DFW) | 58.6 | 217 | 3.9 |
| Jakarta (CGK) | 57.8 | 62 | 1.1 |
| Dubai (DXB) | 57.7 | 193 | 3.5 |
2.3.4. Commentary
3. Results and Discussion
| Field | Opportunities | Challenges |
|---|---|---|
| atmospheric science | visible band remote sensing e.g., aerosol properties | understanding sources variable air mass |
| ecology | higher sensitivity in “dark” areas | relationship between upward emitted light and environmental exposure |
| energy | no saturation calibrated data variable overpass times | changes in lamp properties (spectra & angle) albedo/tree cover |
| epidemiology | street-level information | spectral information angular emission direction radiance calibration overpass time |
| light pollution | highly reliable data | all of the above |
| socio-economic parameters | higher spatial resolution higher sensitivity no saturation | changes in lamp properties angular distribution |
4. Conclusions
Supplementary Files
Supplementary File 1Acknowledgments
Author Contributions
Conflicts of Interest
References
- Doll, C.N.; Muller, J.P.; Morley, J.G. Mapping regional economic activity from night-time light satellite imagery. Ecol. Econ. 2006, 57, 75–92. [Google Scholar] [CrossRef]
- Elvidge, C.; Baugh, K.; Anderson, S.; Sutton, P.; Ghosh, T. The Lumen Gini Coefficient: A satellite imagery derived human development index. Soc. Geogr. Discuss 2012, 8, 27–59. [Google Scholar] [CrossRef]
- Elvidge, C.D.; Sutton, P.C.; Ghosh, T.; Tuttle, B.T.; Baugh, K.E.; Bhaduri, B.; Bright, E. A global poverty map derived from satellite data. Comput. Geosci. 2009, 35, 1652–1660. [Google Scholar] [CrossRef]
- Ghosh, T.; Powell, R.L.; Elvidge, C.D.; Baugh, K.E.; Sutton, P.C.; Anderson, S. Shedding light on the global distribution of economic activity. Open Geogr. J. 2010, 3, 148–161. [Google Scholar]
- Levin, N.; Duke, Y. High spatial resolution night-time light images for demographic and socio-economic studies. Remote Sens. Environ. 2012, 119, 1–10. [Google Scholar] [CrossRef]
- Elvidge, C.D.; Baugh, K.E.; Kihn, E.A.; Kroehl, H.W.; Davis, E.R.; Davis, C.W. Relation between satellite observed visible-near infrared emissions, population, economic activity and electric power consumption. Int. J. Remote Sens. 1997, 18, 1373–1379. [Google Scholar] [CrossRef]
- Lo, C. Modeling the population of China using DMSP operational linescan system nighttime data. Photogramm. Eng. Remote Sens. 2001, 67, 1037–1047. [Google Scholar]
- Sutton, P.C.; Elvidge, C.; Obremski, T. Building and evaluating models to estimate ambient population density. Photogramm. Eng. Remote Sens. 2003, 69, 545–553. [Google Scholar] [CrossRef]
- Kuechly, H.U.; Kyba, C.C.M.; Ruhtz, T.; Lindemann, C.; Wolter, C.; Fischer, J.; Hölker, F. Aerial survey of light pollution in Berlin, Germany, and spatial analysis of sources. Remote Sens. Environ. 2012, 126, 39–50. [Google Scholar] [CrossRef]
- Hale, J.D.; Davies, G.; Fairbrass, A.J.; Matthews, T.J.; Rogers, C.D.; Sadler, J.P. Mapping lightscapes: Spatial patterning of artificial lighting in an urban landscape. PLoS One 2013. [Google Scholar] [CrossRef]
- Zhao, N.; Ghosh, T.; Samson, E.L. Mapping spatio-temporal changes of Chinese electric power consumption using night-time imagery. Int. J. Remote Sens. 2012, 33, 6304–6320. [Google Scholar] [CrossRef]
- Doll, C.H.; Muller, J.P.; Elvidge, C.D. Night-time imagery as a tool for global mapping of socioeconomic parameters and greenhouse gas emissions. AMBIO 2000, 29, 157–162. [Google Scholar]
- Elvidge, C.D.; Ziskin, D.; Baugh, K.E.; Tuttle, B.T.; Ghosh, T.; Pack, D.W.; Erwin, E.H.; Zhizhin, M. A fifteen year record of global natural gas flaring derived from satellite data. Energies 2009, 2, 595–622. [Google Scholar] [CrossRef]
- Stark, H.; Brown, S.; Wong, K.; Stutz, J.; Elvidge, C.; Pollack, I.; Ryerson, T.; Dube, W.; Wagner, N.; Parrish, D. City lights and urban air. Nat. Geosci. 2011, 4, 730–731. [Google Scholar] [CrossRef]
- Cinzano, P.; Falchi, F.; Elvidge, C.D. The first World Atlas of the artificial night sky brightness. Mon. Not. R. Astron. Soc. 2001, 328, 689–707. [Google Scholar] [CrossRef]
- Aubé, M.; Kocifaj, M. Using two light-pollution models to investigate artificial sky radiances at Canary Islands observatories. Mon. Not. R. Astron. Soc. 2012, 422, 819–830. [Google Scholar] [CrossRef]
- Kyba, C.C.M.; Wagner, J.M.; Kuechly, H.U.; Walker, C.E.; Elvidge, C.D.; Falchi, F.; Ruhtz, T.; Fischer, J.; Hölker, F. Citizen science provides valuable data for monitoring global night sky luminance. Sci. Rep. 2013. [Google Scholar] [CrossRef]
- Kloog, I.; Haim, A.; Stevens, R.G.; Barchana, M.; Portnov, B.A. Light at night co-distributes with incident breast but not lung cancer in the female population of Israel. Chronobiol. Int. 2008, 25, 65–81. [Google Scholar] [CrossRef] [PubMed]
- Huang, Q.; Yang, X.; Gao, B.; Yang, Y.; Zhao, Y. Application of DMSP/OLS nighttime light images: A meta-analysis and a systematic literature review. Remote Sens. 2014, 6, 6844–6866. [Google Scholar] [CrossRef]
- Miller, S.D.; Straka, W.; Mills, S.P.; Elvidge, C.D.; Lee, T.F.; Solbrig, J.; Walther, A.; Heidinger, A.K.; Weiss, S.C. Illuminating the capabilities of the suomi national polar-orbiting partnership (NPP) visible infrared imaging radiometer suite (VIIRS) day/night band. Remote Sens. 2013, 5, 6717–6766. [Google Scholar] [CrossRef]
- National Geophysical Data Center. National Oceanic and Atmospheric Administration. Two Months Composite. 2012. Available online: http://ngdc.noaa.gov/eog/viirs/download_monthly.html (accessed on 8 August 2013).
- De Miguel, S.A.; Castaño, J.G.; Zamorano, J.; Kyba, C.C.M.; Pascual, S.; Ángeles, M.; Cayuela, L.; Martin Martinez, G.; Challupner, P. Atlas of astronaut photos of Earth at night. Astron. Geophys. 2014. [Google Scholar] [CrossRef]
- De Miguel, S.A.; Zamorano Calvo, J.; Gómez Castaño, J. Image Classification of Night Time Images Detected from the International Space Station; Technical Report; Universidad Complutense de Madrid: Madrid, Spain, 2014. [Google Scholar]
- Sabbatini, M. NightPod-Nodding Mechanism for the ISS; Technical Report Experiment Record #9337; European Space Agency: Noordwijk, The Netherlands, 2014. [Google Scholar]
- Zamorano, J.; de Miguel, A.S.; Pascual, S.; Castaño, J.G.; Ramírez, P.; Challupner, P. ISS Nocturnal Images as a Scientific Tool against Light Pollution; LICA Report; LICA: Makati, Philippines, 2011. [Google Scholar]
- De Miguel, S.A.; Zamorano, J.; Pascual, S.; López Cayuela, M.; Ocaña, F.; Challupner, P.; Gómez Castaño, J.; Fernández-Renau, A.; Gómez, J.; de Miguel, E. ISS nocturnal images as a scientic tool against light pollution: Flux calibration and colors. In Highlights of Spanish Astrophysics VII; Springer: Berlin, Germany, 2013; Volume 1, pp. 916–919. [Google Scholar]
- Central Intelligence Agency. The World Factbook. 2013. Available online: http://www.cia.gov/library/publications/the-world-factbook/fields/2219.html (accessed on 30 June 2014).
- De Miguel, S.A. Variación del Brillo del Fondo de Cielo en el Cénit con la Fase y Altura de la Luna. Master’s Thesis, Universidad Complutense de Madrid, Madrid, Spain, 2012. [Google Scholar]
- Elvidge, C.D.; Keith, D.M.; Tuttle, B.T.; Baugh, K.E. Spectral identification of lighting type and character. Sensors 2010, 10, 3961–3988. [Google Scholar] [CrossRef] [PubMed]
- Graf, N.; Grube, D.; Henckel, D.; Kniesburges, A.; Kostulski, B.; Ossa, M.M.; Naeth, A.; Oberpichler, A.; Ottrembka, F.; Reiling, J. LichtGestalten: Analyse-, Gestaltungs-, und Konfliktpotenziale; Technische Universität Berlin: Berlin, Germany, 2013. [Google Scholar]
- Berlin Senatsverwaltung für Stadtentwicklung und Umwelt. Gaslaternen in Berlin. 2014. Available online: http://www.stadtentwicklung.berlin.de/bauen/beleuchtung/de/gaslicht (accessed on 26 August 2014).
- Berlin Senate Department for Urban Development and the Environment. Stadtbild Berlin Lichtkonzept Handbuch. 2011. Available online: http://www.stadtentwicklung.berlin.de/bauen/beleuchtung/download/Broschuere_Lichtkonzept.pdf (accessed on 18 December 2014).
- Levin, N.; Johansen, K.; Hacker, J.M.; Phinn, S. A new source for high spatial resolution night time images—The EROS-B commercial satellite. Remote Sens. Environ. 2014, 149, 1–12. [Google Scholar] [CrossRef]
- Bertiau, F.C.; de Graeve, E.; Treanor, P.J. The artificial night-sky illumination in Italy. Vatican Obs. Publ. 1973, 1, 157–179. [Google Scholar]
- Sutton, P.; Roberts, D.; Elvidge, C.; Meij, H. A comparison of nighttime satellite imagery and population density for the continental United States. Photogramm. Eng. Remote Sens. 1997, 63, 1303–1313. [Google Scholar]
- Luginbuhl, C.B. Using DMSP night-time imagery to evaluate lighting practice in the American southwest. Preserv. Astron. Sky 2001, 196, 103–106. [Google Scholar]
- Sutton, P.; Roberts, D.; Elvidge, C.; Baugh, K. Census from Heaven: An estimate of the global human population using night-time satellite imagery. Int. J. Remote Sens. 2001, 22, 3061–3076. [Google Scholar] [CrossRef]
- Bundesamt für Kartographie und Geodäsie. Administrative Areas 1:250,000. 2012. Available online: http://tinyurl.com/kplccqm (accessed on 30 June 2013).
- Miller, S.; Mills, S.; Elvidge, C.; Lindsey, D.; Lee, T.; Hawkins, J. Suomi satellite brings to light a unique frontier of nighttime environmental sensing capabilities. Proc. Natl. Acad. Sci. USA 2012, 109, 15706–15711. [Google Scholar] [CrossRef] [PubMed]
- Pepler, W.; Schiller, C.; Khan, T.Q. Kommunen in Neuem Licht; Siebel Druck und Grafik: Lindlar, Germany, 2013. [Google Scholar]
- Glorius, B. Go west: Internal migration in Germany after reunification. Belg. Rev. Belg. Géogr. 2010, 3, 281–292. [Google Scholar]
- Garz, S. Erste Untersuchung der Nachtaufnahmen von Städten des neuen Satelliten Suomi NPP. Bachelor’s Thesis, Freie Universitaet Berlin, Berlin, Germany, 2014. [Google Scholar]
- Mesa, D. 2012 Airport Traffic Report; Technical Report; The Port Authority of NY & NJ: New York, NY, USA, 2013. [Google Scholar]
- Kyba, C.; Hänel, A.; Hölker, F. Redefining efficiency for outdoor lighting. Energ. Environ. Sci. 2014, 7, 1806–1809. [Google Scholar] [CrossRef]
- Zollweg, J.D.; Gartley, M.; Roskovensky, J.; Mercier, J. Using GIS databases for simulated nightlight imagery. Proc. SPIE 2012. [Google Scholar] [CrossRef]
- Olsen, R.N.; Gallaway, T.; Mitchell, D. Modelling US light pollution. J. Environ. Plann. Manag. 2014, 57, 883–903. [Google Scholar] [CrossRef]
- Kantermann, T.; Roenneberg, T. Is light at night a health risk factor or a health risk predictor? Chronobiol. Int. 2009, 26, 1069–1074. [Google Scholar] [CrossRef] [PubMed]
- Falchi, F.; Cinzano, P.; Elvidge, C.; Keith, D.; Haim, A. Limiting the impact of light pollution on human health, environment and stellar visibility. J. Environ. Manag. 2011, 92, 2714–2722. [Google Scholar] [CrossRef]
- Lucas, R.J.; Peirson, S.N.; Berson, D.M.; Brown, T.M.; Cooper, H.M.; Czeisler, C.A.; Figueiro, M.G.; Gamlin, P.D.; Lockley, S.W.; O’Hagan, J.B.; et al. Measuring and using light in the melanopsin age. Trends Neurosci. 2014, 37, 1–9. [Google Scholar] [CrossRef] [PubMed]
- Cinzano, P.; Falchi, F. The propagation of light pollution in the atmosphere. Mon. Not. R. Astron. Soc. 2012, 427, 3337–3357. [Google Scholar] [CrossRef]
- Kyba, C.C.M.; Ruhtz, T.; Fischer, J.; Hölker, F. Red is the new black: How the color of urban skyglow varies with cloud cover. Mon. Not. R. Astron. Soc. 2012, 425, 701–708. [Google Scholar] [CrossRef]
- Luginbuhl, C.B.; Duriscoe, D.M.; Moore, C.W.; Richman, A.; Lockwood, G.W.; Davis, D.R. From the ground up II: Sky glow and near-ground artificial light propagation in Flagstaff, Arizona. Publ. Astron. Soc. Pac. 2009, 121, 204–212. [Google Scholar] [CrossRef]
- Kyba, C.; Ruhtz, T.; Lindemann, C.; Fischer, J.; Hölker, F. Two camera system for measurement of urban uplight angular distribution. In Proceedings of the International Radiation Symposium (IRC/IAMAS) Radiation Processes in the Atmosphere and Ocean (IRS2012), Berlin, Germany, 6–10 August 2012; AIP Publishing: Melville, NY, USA, 2013; Volume 1531, pp. 568–571. [Google Scholar]
- Ecological Consequences of Artificial Night Lighting; Rich, C.; Longcore, T. (Eds.) Island Press: Washington, DC, USA, 2006.
- Hölker, F.; Wolter, C.; Perkin, E.K.; Tockner, K. Light pollution as a biodiversity threat. Trends Ecol. Evol. 2010, 25, 681–682. [Google Scholar] [CrossRef] [PubMed]
- Organisation for Economic Co-operation and Development (OECD)/International Energy Agency (IEA). Light’s Labour’s Lost: Policies for Energy-Efficient Lighting; OECD/IEA: Paris, France, 2006. [Google Scholar]
- Tsao, J.Y.; Saunders, H.D.; Creighton, J.R.; Coltrin, M.E.; Simmons, J.A. Solid-state lighting: An energy-economics perspective. J. Phys. D Appl. Phys. 2010. [Google Scholar] [CrossRef]
- Riegel, K. Light pollution. Science 1973, 179, 1285–1291. [Google Scholar] [CrossRef] [PubMed]
- Hölker, F.; Moss, T.; Griefahn, B.; Kloas, W.; Voigt, C.; Henckel, A.; Hänel, A.; Kappeler, P.; Völker, S.; Schwope, A.; et al. The dark side of light—A transdisciplinary research agenda for light pollution policy. Ecol. Soc. 2010, 15, 13. [Google Scholar]
- De Miguel, S.A.; Zamorano, J.; Gómez Castaño, J.; Pascual, S. Evolution of the energy consumed by street lighting in Spain estimated with DMSP-OLS data. J. Quant. Spectrosc. Radiat. Transf. 2014, 139, 109–117. [Google Scholar] [CrossRef]
- Bennie, J.; Davies, T.W.; Duffy, J.P.; Inger, R.; Gaston, K.J. Contrasting trends in light pollution across Europe based on satellite observed night time lights. Sci. Rep. 2014. [Google Scholar] [CrossRef]
- Han, P.; Huang, J.; Li, R.; Wang, L.; Hu, Y.; Wang, J.; Huang, W. Monitoring trends in light pollution in China based on nighttime satellite imagery. Remote Sens. 2014, 6, 5541–5558. [Google Scholar] [CrossRef]
© 2014 by the authors; licensee MDPI, Basel, Switzerland. This article is an open access article distributed under the terms and conditions of the Creative Commons Attribution license (http://creativecommons.org/licenses/by/4.0/).
Share and Cite
Kyba, C.C.M.; Garz, S.; Kuechly, H.; De Miguel, A.S.; Zamorano, J.; Fischer, J.; Hölker, F. High-Resolution Imagery of Earth at Night: New Sources, Opportunities and Challenges. Remote Sens. 2015, 7, 1-23. https://doi.org/10.3390/rs70100001
Kyba CCM, Garz S, Kuechly H, De Miguel AS, Zamorano J, Fischer J, Hölker F. High-Resolution Imagery of Earth at Night: New Sources, Opportunities and Challenges. Remote Sensing. 2015; 7(1):1-23. https://doi.org/10.3390/rs70100001
Chicago/Turabian StyleKyba, Christopher C. M., Stefanie Garz, Helga Kuechly, Alejandro Sánchez De Miguel, Jaime Zamorano, Jürgen Fischer, and Franz Hölker. 2015. "High-Resolution Imagery of Earth at Night: New Sources, Opportunities and Challenges" Remote Sensing 7, no. 1: 1-23. https://doi.org/10.3390/rs70100001
APA StyleKyba, C. C. M., Garz, S., Kuechly, H., De Miguel, A. S., Zamorano, J., Fischer, J., & Hölker, F. (2015). High-Resolution Imagery of Earth at Night: New Sources, Opportunities and Challenges. Remote Sensing, 7(1), 1-23. https://doi.org/10.3390/rs70100001