Abstract
This article focuses on the image fusion of high-resolution panchromatic and multispectral images. We propose a new image fusion method based on a Hue-Saturation-Value (HSV) color space model and bidimensional empirical mode decomposition (BEMD), by integrating high-frequency component of panchromatic image into multispectral image and optimizing the BEMD in decreasing sifting time, simplifying extrema point locating and more efficient interpolation. This new method has been tested with a panchromatic image (SPOT, 10-m resolution) and a multispectral image (TM, 28-m resolution). Visual and quantitative assessment methods are applied to evaluate the quality of the fused images. The experimental results show that the proposed method provided superior performance over conventional fusion algorithms in improving the quality of the fused images in terms of visual effectiveness, standard deviation, correlation coefficient, bias index and degree of distortion. Both five different land cover types WorldView-II images and three different sensor combinations (TM/SPOT, WorldView-II, 0.5 m/1 m resolution and IKONOS, 1 m/4 m resolution) validated the robustness of BEMD fusion performance. Both of these results prove the capability of the proposed BEMD method as a robust image fusion method to prevent color distortion and enhance image detail.1. Introduction
With the development of remote sensing in observation technology, high multispectral resolution and spatial resolution of remote sensing images such as TM, SPOT, IKONOS, WorldView and GeoEye images are obtained by various types of sensors and applied in geographic condition monitoring, mapping, extracting and interpreting information and so on. To enhance the quality of the fused images, researchers proposed image fusion methods in fusing panchromatic (PAN) and multispectral (MS) images. In general, these methods can be divided into three levels: the pixel level, the feature level and decision level [1]. Compared to the other two level fusion algorithms, pixel level fusion algorithms are computationally efficient, easy to implement, and widely used. This paper focuses on pixel level fusion techniques.
Within various pixel level fusion techniques, most algorithms can be classified in three categories: the component substitution fusion techniques, modulation-based fusion techniques and multi-resolution analysis-based (MRA) fusion techniques [2]. The most commonly used fusion method in remote sensing is the component substitution fusion technique, which has been integrated into many popular remote sensing image-processing software products, such as ENVI (America, Exelis Visual Information Solutions) and ERDAS Imagine (America, ERDAS). For example, the ENVI 4.5 version includes HSV, Brovey [3], PCS [4], and Gram-Schmidt [5] transform capabilities. The basic idea of the component substitution fusion technique can be described as follows. A low spatial resolution panchromatic image is simulated through the space transform and then replaced by the high spatial resolution panchromatic image to add the detail information. Finally, the inverse transform process is used to complete the fusion. Modulation level fusion merge the spatial details from PAN image into the MS images, by multiplying the MS image by the ratio of the PAN image to the synthetic image. Representative techniques include Brovey, Smoothing Filter-based Intensity Modulation (SFIM), high-pass spatial filter (HPF), and synthetic variable ratio (SVR) fusion. The MRA-based techniques utilize the ideas from the multi-scale decomposition such as multi-scale wavelets, Laplacian pyramids and so on [2]. Among the hundreds of variations of image fusion techniques, the most popular and effective are IHS, PCA, arithmetic combinations and wavelet based fusion [6]. However, the main deficiencies are serious spectral distortion after the fusion [7].
Spatial and spectral qualities are the two main parameters that are used to evaluate the quality of any pan-sharpened image [8]. Since 1998, researchers have focused on improving fusion quality and reducing color distortion [6]. From the pyramid decomposition to the wavelet transform, these fusion methods were designed to create the best image for reducing color distortion and enhance the detail. Krista Amolins et al. have done comparison experiment between standard schemes (based on IHS and PCA) and wavelet-based schemes, the result shows wavelet-based schemes perform better than standard schemes, particularly in terms of minimizing color distortion [9]. Frequency-based fusion methods trend to become a promising method for current satellite image fusion purpose. A new frequency-based method is proposed for analysis of nonlinear and nonstationary time series: empirical mode decomposition (EMD) and Hilbert spectral analysis (HSA, [10]). NASA called this transform the Hilbert-Huang transform (HHT).
The basic idea of EMD is to decompose a signal into the sum of several multi-scale signals, called the intrinsic mode function (IMF). Classical one-dimensional EMD has been successfully applied to finding the solar period [11], analysis of ocean wave data [12] and climate change [13] and similar such studies. As EMD has many advantages, researchers have extended the method to complex empirical mode decomposition (CEMD) [14], bidimensional empirical mode decomposition (BEMD) and multivariate empirical mode decomposition. For complex empirical mode decomposition, Bai X. et al. proposes a new inverse synthetic aperture radar imaging algorithm for micro motion target with rotating parts based on CEMD [15].
This paper focuses on a two-dimensional decomposition method, usually called BEMD. There are numerous former basic studies on two-dimensional EMD for image processing. Nunes et al. extended EMD to BEMD for analyzing image texture [16,17]. Linderhed designed an algorithm for image compression based on empirical mode decomposition [18]. Considering the high calculation costs, Damerval et al. developed a fast algorithm for BEMD [19]. Related works include discussions of boundary processing [20] and spatial analysis [21]. Because of the importance of image fusion in the remote sensing field, researchers introduce EMD method in remote sensing image fusion, especially in the fusion of multispectral and high-resolution panchromatic images. Wang et al. applied one-dimensional EMD to image signals by decomposing the image matrix into rows or columns [22]. Both Qiao et al. [23] and Shi et al. [24] integrated the detail of panchromatic images into multispectral images by space transform, but there were few discussions of the calculation optimizing and the algorithm adaptability of land cover types and sensors. By redefining the regional extremes and sift processing, Zheng and Qin described an effective modified algorithm for medical imaging [25]. Shaohui et al. combined EMD with SVM for multifocus image fusion [26]. In 2009, Zhang performed a comparison of EMD-based image fusion methods and concluded that the quality of the fused image using BEMD is the best [27]. In 2012, Ahmed et al. [28] and Wielgus et al. [29] experimented with the use of fast and adaptive BEMD in image fusion. These cited studies indicate the promising potential of the use of remote sensing image fusion based on BEMD.
Many papers have discussed the limitations of the various fusion methods. However, there is no perfect algorithm that is optimal under all conditions. The choice of the most appropriate algorithm depends on target problems [30]. For geographic condition monitoring, visual interpreting and classification, a significant problem is color distortion. The motivation of this paper is to reduce color distortion using BEMD. Utilizing its adaptive and empirical properties, e.g., using BEMD to decompose images and obtain low-frequency image which is highly correlated with the value band from the HSV transform, the aim of this study focuses on applying the BEMD method to reduce color distortions and enhance details on satellite images fusion. The innovation of this paper also concentrates on applying the theory of BEMD to image fusion, and optimizing of BEMD.
In addition, numerous indexes and methods were used for image fusion assessment, such as correlation coefficient, standard deviation, RMSE, spectral distortion, bias index, even some new methods like visual efficiency [31,32]. To make it comparable with other fusion algorithms, both visual analysis and quantitative analysis are employed for more objective assessment of each algorithm.
The rest of this article is organized as follows. In Section 2, the details of the BEMD method are presented. In Sections 3–5, an experiment is designed to analyze and evaluate the quality of this method. The experiment demonstrates that this new BEMD method yields superior performance in preserving accurate spectral information while fusing satellite images. Section 6 discusses the algorithm performance under different conditions like different land cover types and different sensor types. In Section 7, some conclusions are presented.
2. Bidimensional Empirical Mode Decomposition (BEMD) Methodology
2.1. Bidimensional Empirical Mode Decomposition (BEMD)
The iteration process and sifting process of BEMD is the same with EMD. The EMD method is a time-domain analysis method especially suited to nonlinear and non-stationary data. The core idea is to find the intrinsic multi-scale vibrations in the input signals. Based on the method of Huang [9], we obtained a set of intrinsic mode functions as expressed by Equation (1).
Image can be regarded as a two-dimensional matrix signal f(x, y). The details of this decomposition method (BEMD) are as follows:
- (1)
Find all local maxima and minima of f(x, y).
- (2)
Perform surface interpolation using the extrema from step 1 to obtain a maxima envelope surface Emax(x, y) and minima envelope surface Emin(x, y). In this step, image extension is necessary to avoid invalid interpolation caused by boundary conditions.
- (3)
Calculate the average envelope surface Avg(x, y) based on the maxima envelope surface and minima envelope surface.
- (4)
Hij is obtained by subtracting the average envelope surface from the original signal f(x, y); Hij represents the jth iteration in ith sifting process.
- (5)
Check whether the stop criterion is satisfied. If not, then take Hij as f(x, y) and repeat steps 1 through 4. This is one iteration process. If the stop criterion is satisfied, then we can obtain the IMFi using Equation (2).
This is the complete sifting process. Repeat steps 1 through 5 until the residue is less than the threshold or becomes monotonous or constant. At that time, the BEMD sifting process is complete.
2.2. Definition of Extrema Point
In a one-dimensional signal, we can easily define the peaks and valleys of the signal as the extrema. The identification of extrema in two-dimensional data is performed by searching for the extrema in eight directions separately along the columns, rows, and various diagonals in the tabulated data. If the point is a peak or valley in all eight directions, we then call it a two-dimensional extreme.
Because BEMD involves much sifting and iteration, it is a time-consuming process to properly identify the extrema. Firstly, we find the extrema along all columns and then find the extrema along the rows that contain column extrema values. We do the same along the upper-left-to-lower-right-corner diagonal and the lower-left-to-upper-right-corner diagonal. This sequence saves us algorithmic time consumption. An exceptional condition is a flat peak in a signal. In this instance, we only take into account the middle point.
2.3. Interpolation and Smoothness
After we obtain the extrema points, the goal of next step is to obtain the maximum and minimum envelope surfaces through interpolation and smoothness.
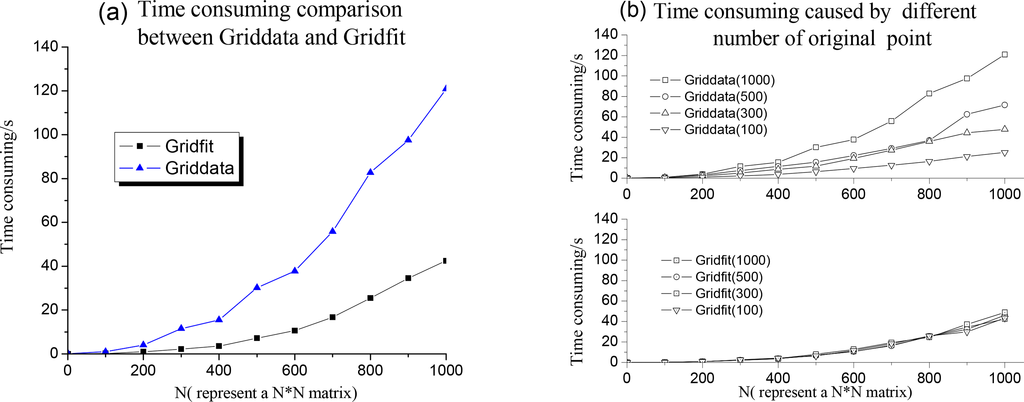
The boundary effect and time consuming are two key concerns in interpolation and smoothness. Triangulation is used in cubic spline interpolation in the traditional EMD method. If the point is outside the convex hull, the triangulation fails on that point and result is infinity, which may cause the so called boundary effect. For example, a “cubic” Griddata function in MATLAB is an implement using cubic spline interpolation. An improved “–v4” Griddata function can solve the boundary problem and generate a smooth surface. However, this function uses a distance-based interpolation method, where for N data points a full N × N matrix must be generated. Then, a system of equations is solved using that matrix. Therefore, this function tends to be quite slow even when applied to problems of moderate size.
In order to tackle the above two issues, the Gridfit tool can be used to extrapolate outside of the convex hull and generate a smooth envelope surfaces. In addition, this tool is more efficient than using the –v4 Griddata function in terms of computer processing speed and memory.
Figure 1 shows a time-consumption comparison between Griddata (−v4) and Gridfit. It can be seen that the time consuming of Griddata increases more rapidly than the Gridfit as the Ns increase (Figure 1a) and that the time consumption using Gridfit is independent of the original point number, while the use of Griddata becomes more time consuming with an increase in the number of original points (Figure 1b).
2.4. Stopping Criteria in the Iteration Process
Under most conditions, the obtained IMFs using BEMD cannot satisfy the condition of IMF definition. The universal solution is to judge the convergence. Additional iterative decomposition cannot provide more information when the convergence criterion is small. Alternatively, one can also use the method with an empirical stop criterion. Based on the methods of Huang (1998), the SD criterion is defined using Equation (3):
2.5. The Image Fusion Framework
We proposed the image fusion framework based on bidimensional empirical mode decomposition (BEMD), which is shown in Figure 2.
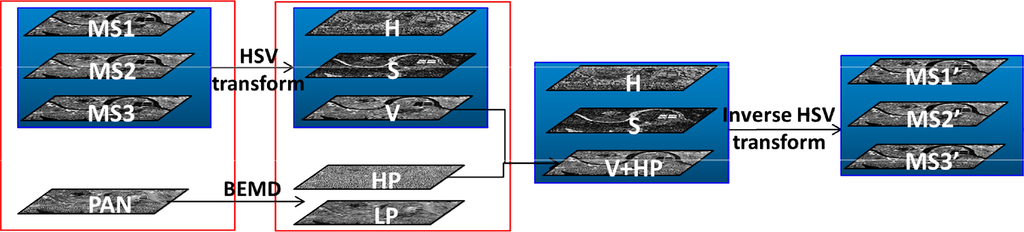
The MS1, MS2, and MS3 images are multispectral images from three bands. The PAN image is a panchromatic image, and the HP image consists of the high-frequency components after BEMD decomposition, the LP is the low-frequency image after BEMD decomposition, and the MS1’, MS2’ and MS3’ images are the respective new three-band fused images. The detailed process is demonstrated in the following: To avoid disturbing other factors, the experimental image used in this paper is ENVI example data with geometric registration and resampling. There was an article that discussed the effect influenced by the resampling methods and conclusion is that resampling methods do not have any significant effect on the final visual appearance of the fused images [33]. The determined factor of experiment performance is the algorithms themselves.
3. Experiment Based on Bidimensional Empirical Mode Decomposition (BEMD)
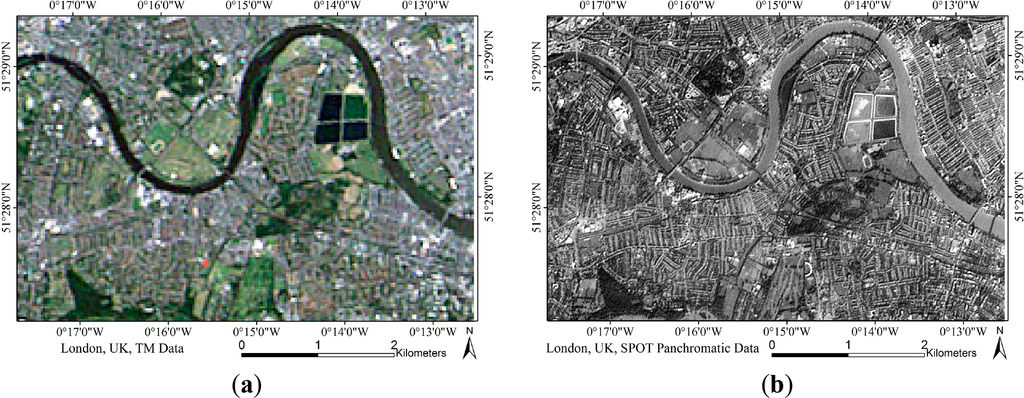
In this section, an experiment based on the BEMD framework in Figure 2 is shown below. The multispectral image in experiment is a TM image with 28-m resolution and a panchromatic SPOT image with 10-m resolution (see Figure 3). One can download the example TM and SPOT satellite data in the experiment from this website [34].
The details of experiment process are as follows:
Step 1: The MS1, MS2, and MS3 images are regarded as the R, G, and B bands and receive HSV transform treatment. We obtain the H, S, and V images in the three respective bands (see Figure 4).
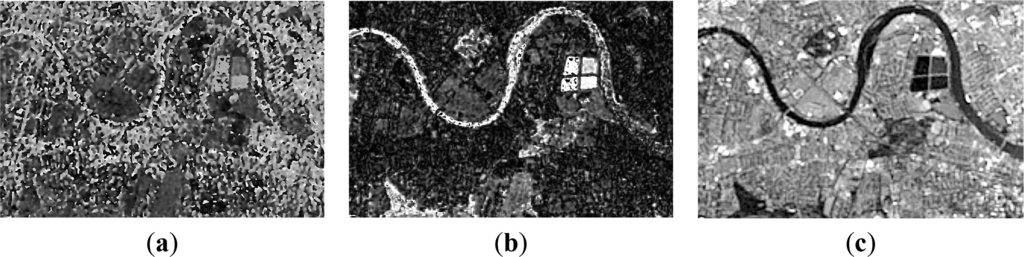 Figure 4. (a) Hue band. (b) Saturation band. (c) Value band.
Step 2: Decomposition of a PAN image using BEMD with the IMF and residual number limited to 2 only produces an IMF (high frequency component) and a residue (low frequency component). The details of the stop criterion are described in Section 2.4.
Here we choose 2 as the component (both IMF and residual) limit for purposes of optimizing the correlation coefficient between the V band and the residual. We obtain the correlation coefficient using various sifting and iteration times. Because each sifting process will extract an IMF from the residual, the more the sifting time, the smaller the correlation coefficient. As shown in Figure 5, the largest correlation coefficient appears on the second iteration of first sifting time. Thus, one sifting process results an IMF and a residual. One IMF is the extracted highest-frequency component, and the residual is the low-frequency component. This result explains why we choose 2 as the limit. The most related low frequency component still appears at first sifting time while the limitation is set to a value greater than 2. In addition, more sifting time severely reduce the efficiency of the algorithm.
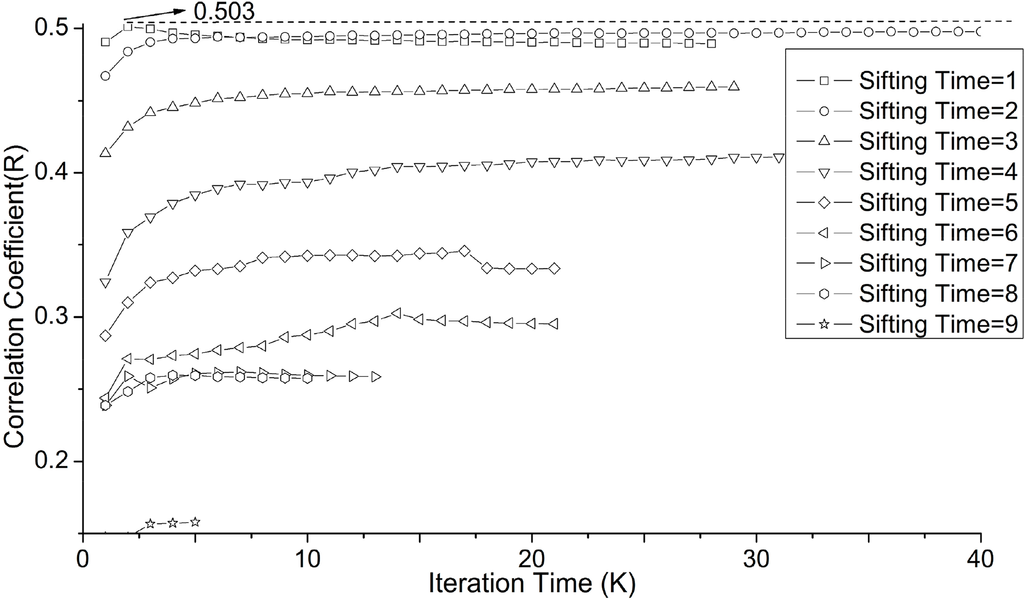 Figure 5. Correlation coefficients under different sifting and iteration processes. To obtain sufficient numbers of points to show trends, we set the SD to 0.002 in the iteration process.
Step 3: Record the LP values with the highest correlation coefficient to value band, HP is the corresponding component of LP, which is obtained from PAN−LP, which represents the details in the panchromatic image (see Figure 6).
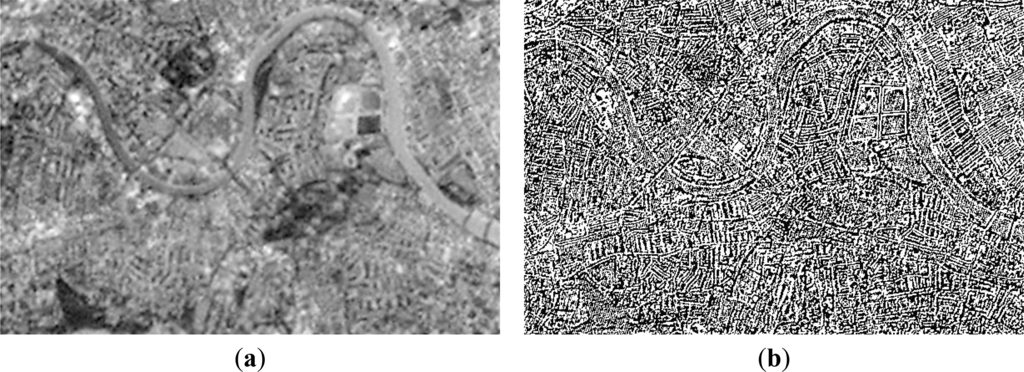 Figure 6. (a) The LP with highest correlation with V. (b) The corresponding HP with obtained LP.
Step 4: The V image from step 1 and the HP image from step 3 are combined to produce a new V-band image by simply adding HP on V image (VNew = HP + V), Then, the histogram of the new V-band image is matched with the original V-band image because the value of New V-band image sometimes will beyond 0∼255. After transforming the H-, S-, and new V-band images inversely, the final fused image is obtained (see Figure 7).
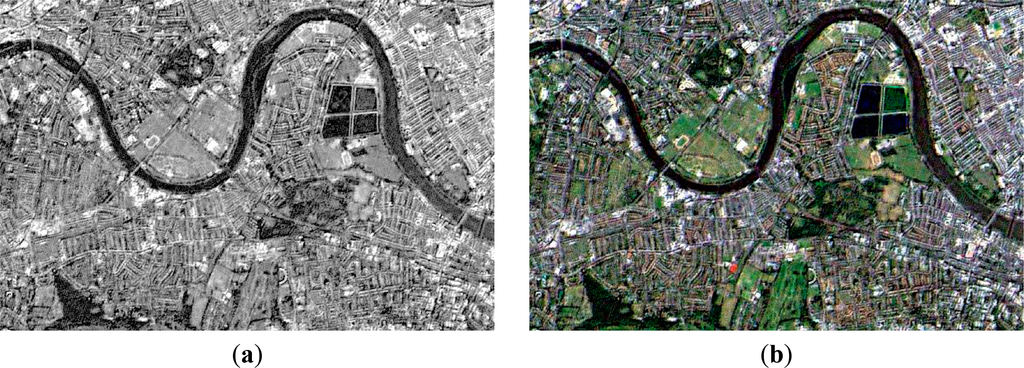 Figure 7. (a) The new V band image, enhanced by HP from step 3 plus V band from step 1. (b) Final fused image.
Through the HSV transform process, the spectral information of the image mostly maintains its hue and saturation components while the value band is maintained. When the LP data correlate well with the value image, the V band can be replaced by the LP, resulting in a new V-plus-HP image. Figure 7a shows that the new value band is enhanced by the HP data, which is one result of the BEMD.
4. Results
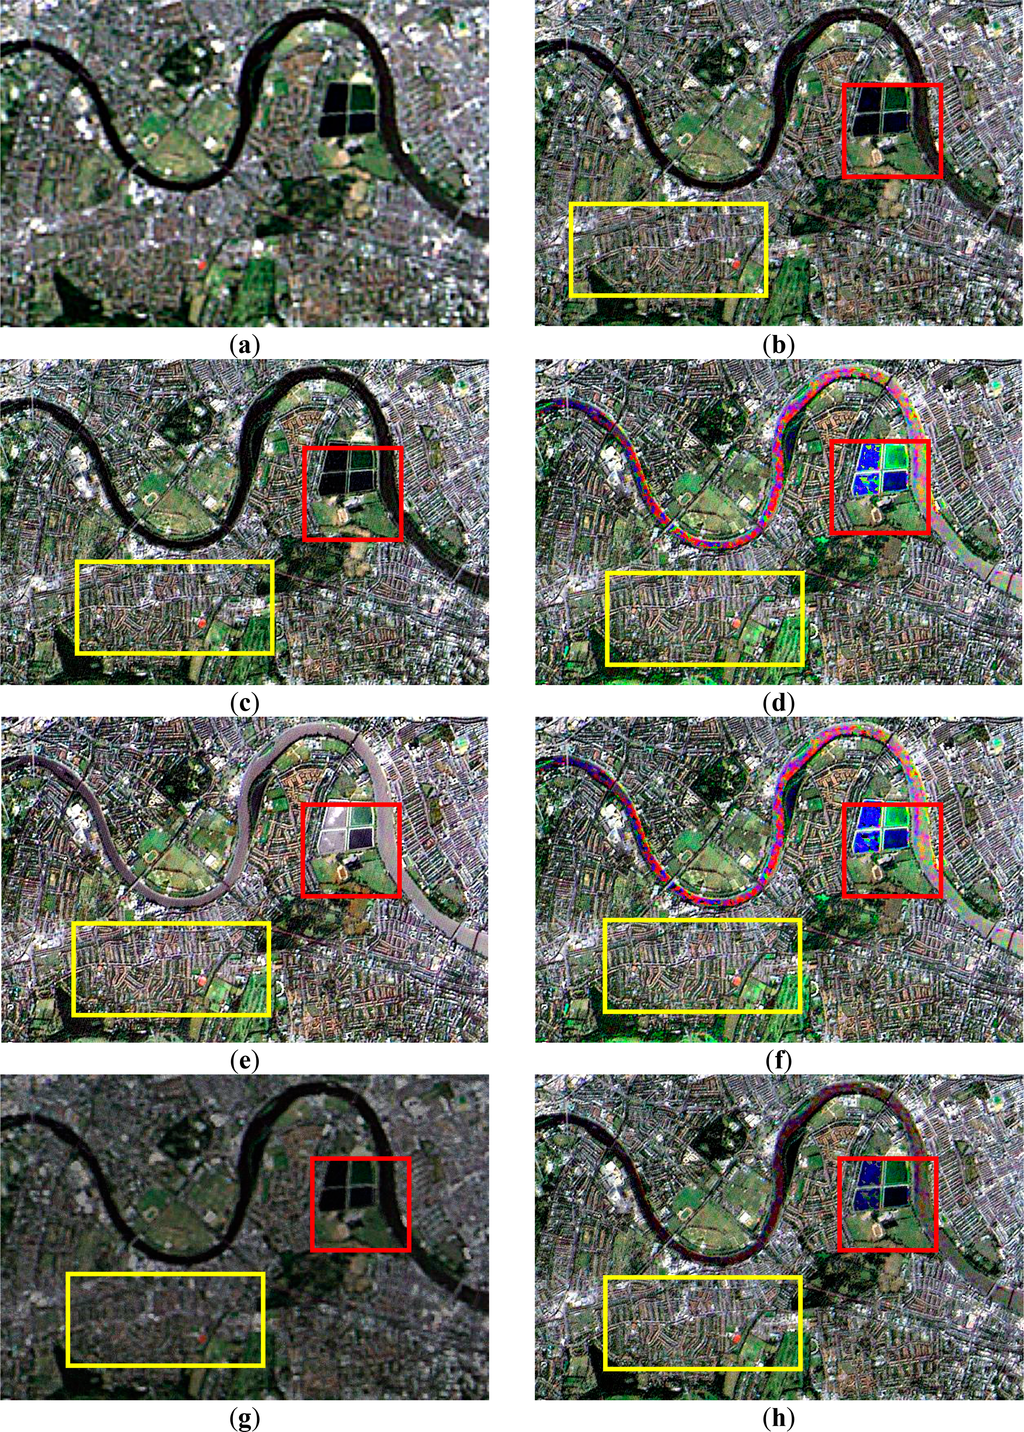
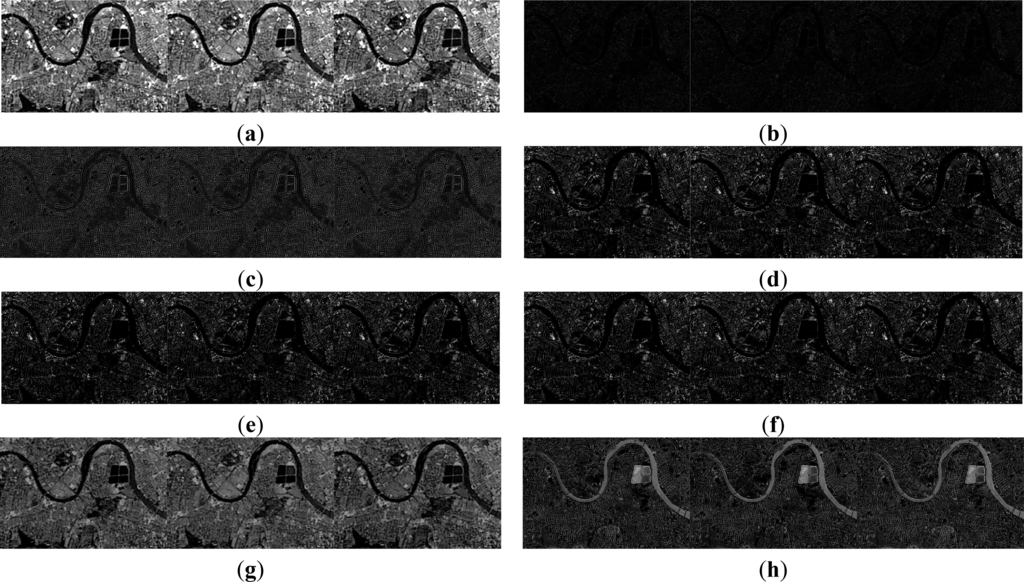
Figure 8a–h shows a comparison of the results obtained using the new BEMD and the IHS, wavelet, PCA, Brovey, Gaussian high-pass spatial filter (HPF) and Laplacian pyramidal decomposition (LPD) image fusion methods [35]. (All codes are implemented in MATLAB for comparison. These seven techniques are well-known and contain both three categories mentioned in the introduction).
5. Assessment of Results Quality
5.1. Visual Assessment
A comparison of the red boxes in Figure 8 shows that only the new BEMD and wavelet methods maintain hue and saturation completely. The IHS, PCA, Brovey, HPF and LPD methods result in spectral distortions. The colors of farm areas becomes blue and the river’s color becomes pink. In addition, the average brightness of the whole image also changes. Compared with the original image, the BEMD method maintains almost consistent spectral information.
In term of image clarity, it can be shown from yellow boxes in Figure 8 that all methods enhanced the detail information. Compared with the original spectral image, all the methods provide richer detail information in the roads and the outlines of buildings. We cannot easily develop conclusions regarding which method is better in terms of the clarity of the fused images based on the above experiment. A more accurate assessment is conducted in the quantitative analysis in Section 4.2. In the wavelet fused image, there are some blocks and ring effects.
From the results of the visual analysis, we can see that the new BEMD method and wavelet transform are better than the IHS, PCA, Brovey, HPF and LPD transform methods. The relative detail of the images cannot be distinguished by eyes. In other words, all these methods can enhance image detail, and visual analysis may serve primarily to select those methods that best avoiding spectral distortion.
5.2. Quantitative Assessment
We employed mean value, RMSE, average gradient, spectral distortion [36] and correlation coefficient to quantitatively analysis quality of fusion image, which can be shown in Table 1. Error image and histogram image after fusion are also discussed to make a comprehensive conclusion.

(a) Image mean
The image mean value represents the overall brightness of the image. It can be seen from Table 1 that the average of the three bands in the original multispectral image is 98.97. The averages of these mean values using the various image-fusion methods are 99.07 (BEMD), 99.07 (wavelet), 106.75 (IHS), 107.61 (PCA), 106.54 (Brovey), 62.21(HPF) and 95.80(LPD). Relative to the values of the original image, relative errors of the BEMD, wavelet and LPD methods are 0.10%, 0.10% and 3.20% respectively, while other methods are far in excess of 7.6%. The result indicates that BEMD, wavelet and LPD methods give better approximations than do the IHS, PCA, Brovey and HPF methods.
(b) Root mean square error
The greater the root mean square error, the greater the differences between the fused image and the original image. It can be seen from Table 1 that the average RMSE of the three bands in the BEMD multispectral image is 19.30, while those associated with use of the other methods are 40.09 (wavelet), 61.76 (HIS), 60.66 (PCA), 61.55 (Brovey), 44.80 (HPF) and 39.10 (LPD). This result explains the color distribution distortions observed in the experimental images and shows that the BEMD method is superior to the other methods.
(c) Correlation coefficient
The correlation coefficient is an important indicator reflecting the difference between the fused image and the original image. It can be seen from Table 1 that the correlation coefficient when using BEMD and HPF (the average brightness and RMSE of HPF are much worse than BEMD) is close to 1. The correlation coefficients associated with the other methods are below these two methods, which show that these methods may enhance the detail of the image but result in much loss of spectral information. These results point out one of the main advantages of BEMD: original spectral information is maintained, while image detail is enhanced.
(d) Spectral distortion
The spectral distortion value is defined as the average absolute deviation of the fused image from the original image. This value reflects the average degree of spectral change through the image fusion. It can be shown in Table 1 shows that these deviations are 7.40 (BEMD), 16.01 (wavelet), 19.18 (IHS), 19.01 (PCA), 19.15 (Brovey), 37.22 (HPF) and 16.46 (LPD). This trend among these integral spectral distortion values is the same and that among the RMSE values. The ranking of the image-fusion methods in terms of their performance in maintaining color fidelity with the original image is as follows: BEMD, wavelet, LPD, PCA, HPF, Brovey and IHS.
We can also use image error to evaluate the spectral distortion. Image error is calculated using Equation (4):
As shown in Figure 9, the EI image using BEMD is almost dark, as the average spectral distortion is 7.40. The image value is also approximately 7.40. That the image is homogeneous demonstrate that the error is homogeneous, and the fact that the water is darker than the ground and buildings means that the distortion of water is less than that of the ground and buildings. The average brightness of the EI image using the wavelet method is higher than that using BEMD, but there are no white areas as there are in the EI images using other methods. White areas are indications of large deviations in a single band that ultimately result in color distortion in the RGB color images.
(e) Average gradient
The average gradient reflects the image clarity. The resulting values (Table 1) using BEMD are between those of the panchromatic image and the multispectral image. This result indicates that BEMD enhanced the detail of the multispectral image. The value using IHS is the highest among the methods because of the replacement of the intensity band with the panchromatic image.
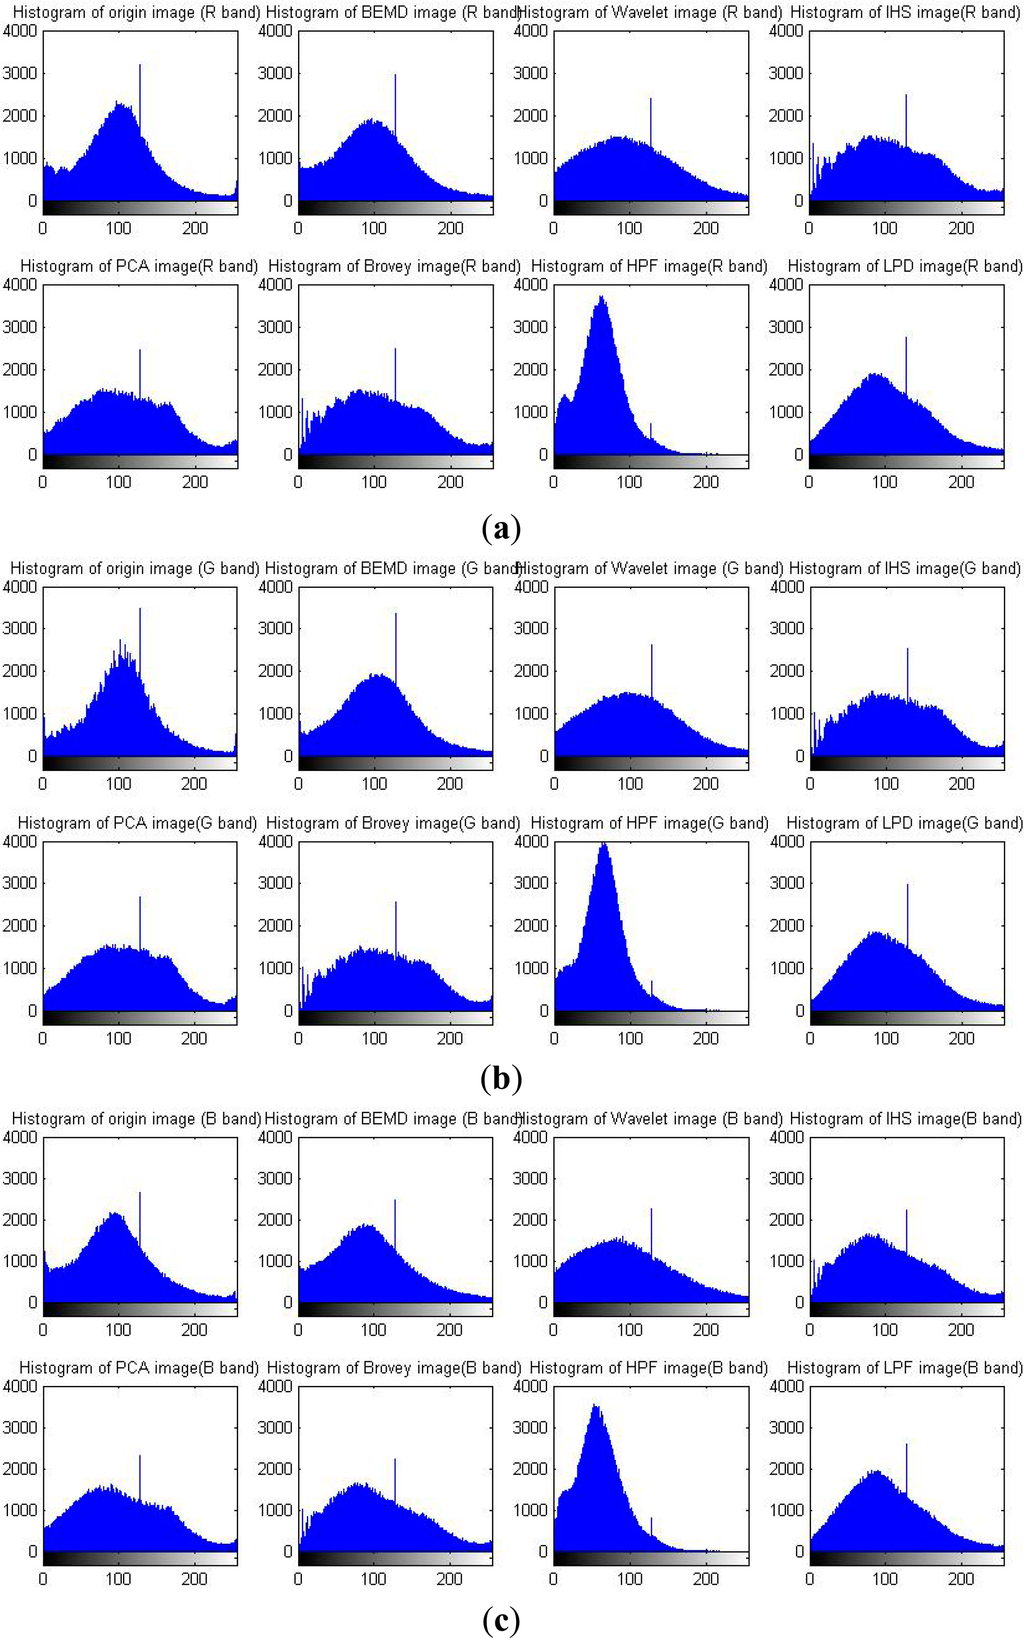
(f) Histogram
Figure 10 shows that the shape of the histogram using the BEMD method is most similar to that of the original image. Many fluctuations are in the original histogram. BEMD smoothes this peak and maintains the general shape of the histogram well.
Based on the results mentioned above, it may be concluded that: (1) The IHS and Brovey image fusion methods perform better in terms of simplicity. These two methods increase image information. Their image clarity is most derived from the use of the panchromatic image. However, these methods only allow three-band image fusion and result in serious spectral distortions. (2) The spectral distortions when using the PCA method are also serious, although they are less serious than those associated with the IHS and Brovey methods. The reason for this distinction may be the different levels of reliance on multispectral and panchromatic images. The similarity between the first component of PCA method and the panchromatic image appears to be the main factor. (3) The ability of HPF and LPD are better than above methods, HPF method performance is good on correlation coefficient but bad on RMSE and spectral distortion, and LPD method performance is good on spectral distortion but bad on RMSE and correlation coefficient. (4) The proposed BEMD and wavelet methods are better than other methods in keeping spectral information while enhancing the details, in terms of RMSE, correlation coefficient and spectral information, the proposed BEMD method are better than wavelet method.
6. Discussion
To explore the suitable condition for this fusion technique, especially for different land cover types and different sensor types, we design two additional experiments.
For the first experiment, to compare fusion techniques performance with different land cover types, an image fusion dataset was obtained from [37] (an open data share platform) with five land cover types such as urban, vegetation, seaside, resident and bridge. The dataset was collected by Beijing key laboratory of digital media, whose image source is WorldView-II (0.5-m panchromatic resolution and 2 m multispectral resolution). Figures 11 and 15 shows the fusion result of seven fusion techniques under five land cover types.
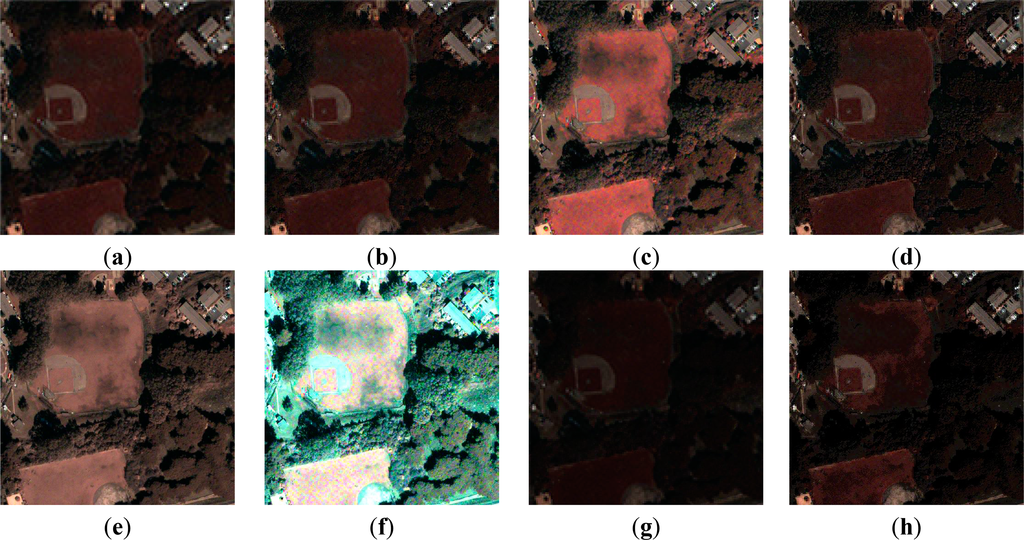
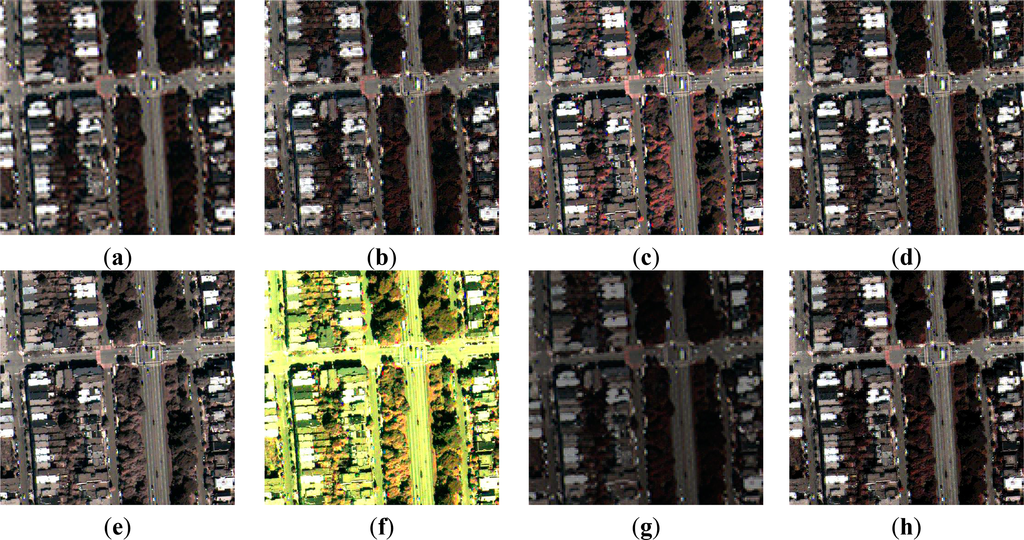
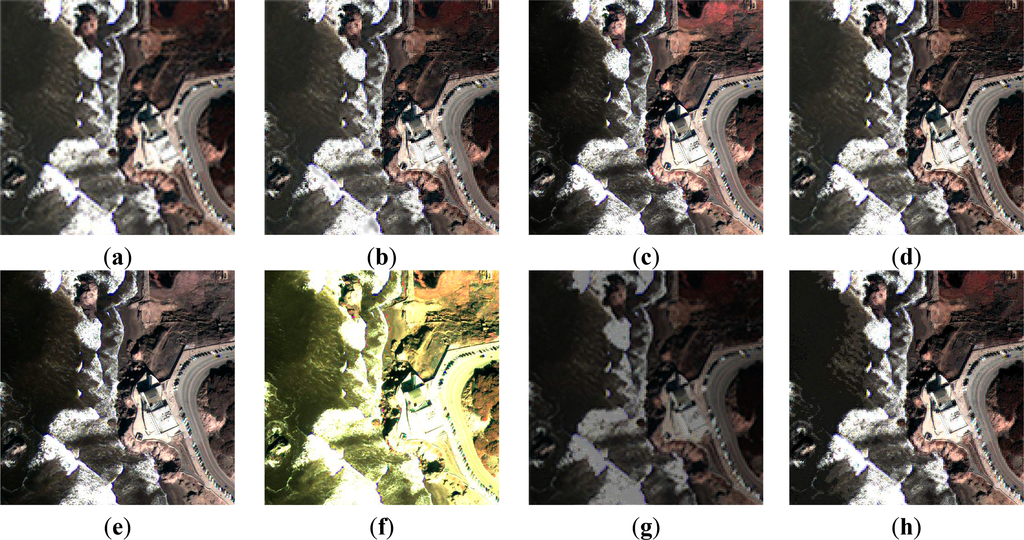
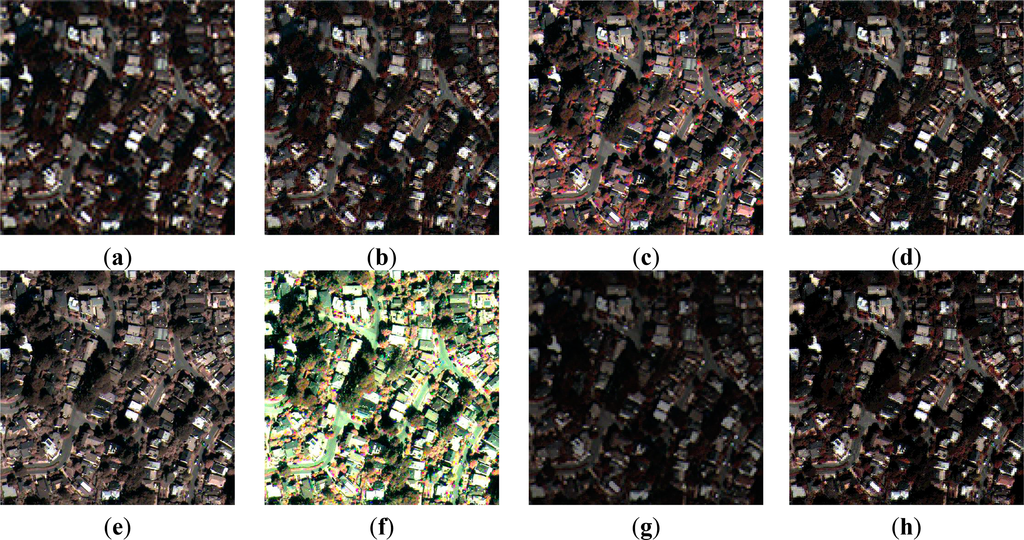
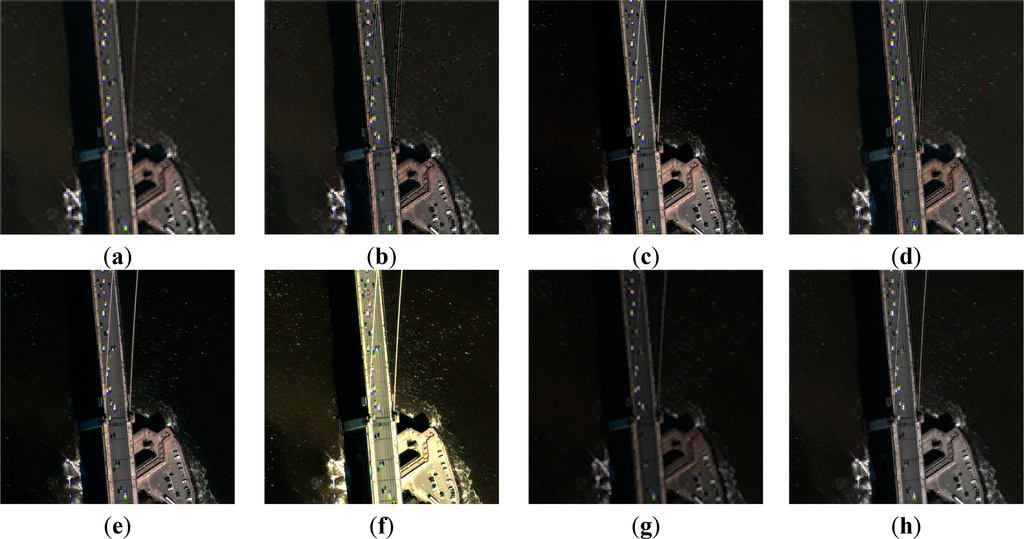
Compare every (a) figure with every (b) figure in Figures 11 and 15, BEMD fusion results performance well and stably in enhancing spatial details and preserving spectral information. In (a) and (b) image of urban and resident image (See Figures 11 and 14), the outline and detail of vegetation was clearer than not fused. In urban and bridge image (See Figures 12 and 15), cars and the edges of roads can be easier recognized. However, in seaside image (See Figure 13), there was no obvious details improvement cause of there was no big difference between original multispectral image and panchromatic image. In addition, all BEMD fused images obtained no obvious color distortion.
According to spectral preservation stability: these seven techniques in the contrast can be divided into two levels: stable (BEMD and Wavelet), unstable (PCA, IHS, Brovey, HPF and LPD). The stable level techniques keep general hue, saturation and intensity of the image in all five land cover types. The unstable level technique, PCA, HPF and LPD lose their intensity compared to origin multispectral image. Brovey and IHS, both lose their hue, saturation and intensity.
Secondly, not only good spectral preservation ability with different land cover types, but good performance on different type sensors is also validated (See Figure 16). Including the above TM/SPOT (28 m/4 m resolution) and WorldView-II multispectral and panchromatic (0.5 m/2 m resolution) image combination, another IKONOS multispectral and panchromatic (4 m/1 m) image attended to contrast.
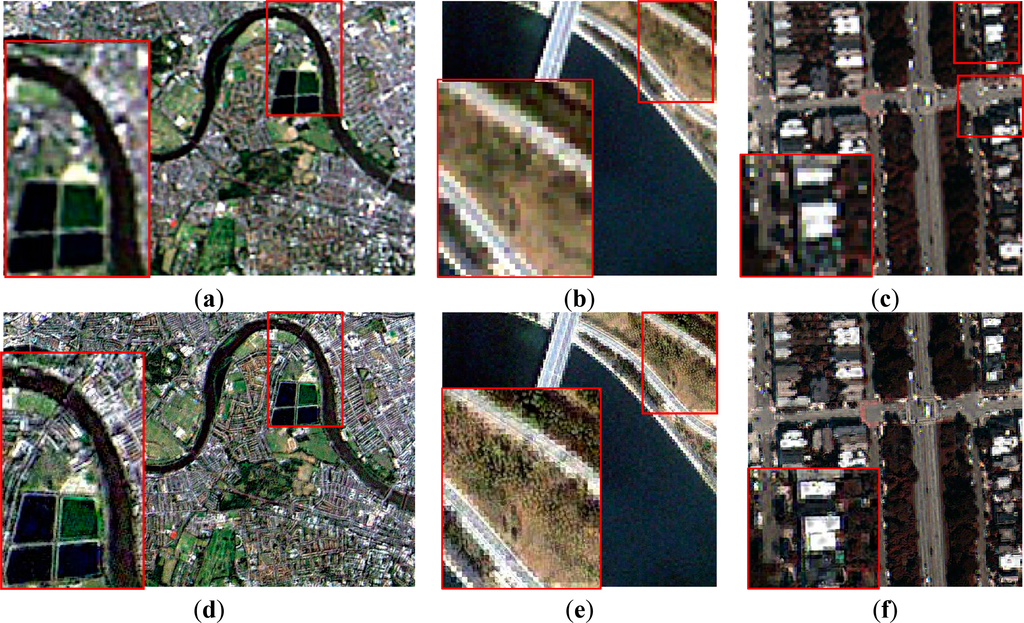
The red box area is magnified twice compared with the original. From the contrast pictures between (a) and (b), (c) and (d), (e) and (f) in Figure 16, the fusion images get better image details while less distortion under both three different sensor types.
The two experiment results (Figures 11 and 16) show that IHS, Brovey and PCA methods are bad in keeping spectral information. HPF and LPD methods are not stable in preserving spectral information. Wavelet based method and proposed BEMD methods are much stable than other methods in the experiment. As some papers discussed [38,39], wavelet based method may introduce block/ring effects and may not produce color information for small objects. In the Figures 11–15d, many objects, especially vegetation and waves have blocking effects. In this experiment, BEMD shows its robustness of preserving spectral information.
7. Conclusions
In this article, a new method for automated fusion of multispectral and panchromatic satellite images has been proposed based on BEMD (Bidimensional Empirical Mode Decomposition) and an HSV (Hue, Saturation, Value) transform. In addition, the computation consuming of BEMD is optimized in decreasing sifting process time, simplifying extrema point locating and more efficient interpolation. This new method has been tested with a panchromatic image (SPOT, 10-m resolution) and a multispectral image (TM, 28-m resolution). Visual and quantitative indicators (mean value, RMSE, average gradient, spectral distortion and correlation coefficient) are employed for evaluation. Evaluation results confirm that the results generated by this new method are superior to results obtained using other methods. BEMD displays the best performance in terms of maintaining spectral information and enhancing detail, especially in visual interpretation and spectral preservation. Five groups WorldView-II images of different land cover type fusion contrast demonstrated that BEMD appears to be a robust fusion method with different land cover type. At last, the effectiveness of BEMD method on three different sensors images was validated. The method can get better image details with less distortion.
In addition, the research of this image fusion method based on the use of BEMD is still in a trial stage. There are some aspects that can be improved, such as the sifting process, the setting of a stop criterion and the interpolation of the envelope surface. There are also many researchers at work to improve the method’s efficiency [19,28,29,40], i.e., to decrease its time consumption. This method can only once merge 3-band MS images with the PAN images on this stage, but the idea of decomposition with high-frequency and low-frequency determines that it can be used in both single-band fusion and multi-band fusion in the future. Thus, this method is a promising in remote sensing image fusion.
Acknowledgments
This research is supported by the Beijing Nova program (Grant No. 2011044), Special Foundation for Free Exploration of State Laboratory of Remote Sensing Science (Grant No. 14ZY-05), Key Laboratory of Geo-informatics of State Bureau of Surveying and Mapping (Grant No. 201326), and National Natural Science Foundations of China (NSFC, Grant No. 41471382). Comments from reviewers are appreciated, which helped in the improvement of the article’s quality.
Author Contributions
Weihua Dong played an important role in the conception of the study, drafting and revising the manuscript. Xian’en Li contributed to the conception of the study, performing the data analyses and played an important role in interpreting of the results and approved the final version. Xiangguo Lin and Zhilin Li contributed a lot to framework of the methodology and the revision of the manuscript.
Conflicts of Interest
The authors declare no conflict of interest.
References
- Pohl, C.; van Genderen, J.L. Review article multisensor image fusion in remote sensing: Concepts, methods and applications. Int. J. Remote Sens 1998, 19, 823–854. [Google Scholar]
- Zhang, J. Multi-source remote sensing data fusion: Status and trends. Int. J. Image Data Fusion 2010, 1, 5–24. [Google Scholar]
- Vrabel, J. Multispectral imagery band sharpening study. Photogramm. Eng. Remote Sens 1996, 62, 1075–1084. [Google Scholar]
- Welch, R.; Ehlers, M. Merging multiresolution SPOT HRV and Landsat TM data. Photogramm. Eng. Remote Sens 1987, 53, 301–303. [Google Scholar]
- Brower, B.V.; Laben, C.A. Process for Enhancing the Spatial Resolution of Multispectral Imagery Using Pan-Sharpening. U.S. Patent 6,011,875, 4 January 2000.
- Zhang, Y. Understanding image fusion. Photogramm. Eng. Remote Sens 2004, 70, 657–661. [Google Scholar]
- Tu, T.M.; Su, S.C.; Shyu, H.C.; Huang, P.S. A new look at IHS-like image fusion methods. Inf. Fusion 2001, 2, 177–186. [Google Scholar]
- Javan, F.D.; Samadzadegan, F.; Reinartz, P. Spatial quality assessment of pan-sharpened high resolution satellite imagery based on an automatically estimated edge based Metric. Remote Sens 2013, 5, 6539–6559. [Google Scholar]
- Amolins, K.; Zhang, Y.; Dare, P. Wavelet based image fusion techniques—An introduction, review and comparison. ISPRS J. Photogramm. Remote Sens 2007, 62, 249–263. [Google Scholar]
- Huang, N.E.; Shen, Z.; Long, S.R.; Wu, M.C.; Shih, H.H.; Zheng, Q.; Yen, N.C.; Tung, C.C.; Liu, H.H. The empirical mode decomposition and the Hilbert spectrum for nonlinear and non-stationary time series analysis. Proc. R. Soc. Lond. A 1998, 454, 903–995. [Google Scholar]
- Coughlin, K.T.; Tung, K.K. 11-year solar cycle in the stratosphere extracted by the empirical mode decomposition method. Adv. Space Res 2004, 34, 323–329. [Google Scholar]
- Hwang, P.A.; Huang, N.E.; Wang, D.W. A note on analyzing nonlinear and nonstationary ocean wave data. Appl. Ocean Res 2003, 25, 187–193. [Google Scholar]
- Molla, M.; Islam, K.; Rahman, M.S.; Sumi, A.; Banik, P. Empirical mode decomposition analysis of climate changes with special reference to rainfall data. Discret. Dyn. Nat. Soc 2006, 2006. [Google Scholar] [CrossRef]
- Tanaka, T.; Mandic, D.P. Complex empirical mode decomposition. IEEE Signal Process. Lett 2007, 14, 101–104. [Google Scholar]
- Bai, X.; Xing, M.; Zhou, F.; Lu, G.; Bao, Z. Imaging of micromotion targets with rotating parts based on empirical-mode decomposition. IEEE Trans. Geosci. Remote Sens 2008, 46, 3514–3523. [Google Scholar]
- Nunes, J.C.; Bouaoune, Y.; Delechelle, E.; Niang, O.; Bunel, P. Image analysis by bidimensional empirical mode decomposition. Image Vis. Comput 2003, 21, 1019–1026. [Google Scholar]
- Nunes, J.C.; Guyot, S.; Deléchelle, E. Texture analysis based on local analysis of the bidimensional empirical mode decomposition. Mach. Vis. Appl 2005, 16, 177–188. [Google Scholar]
- Linderhed, A. Image compression based on empirical mode decomposition. Proceedings of the SSAB Symposium Image Analysis, Uppsala, Sweden, 11–12 March 2004; pp. 110–113.
- Damerval, C.; Meignen, S.; Perrier, V. A fast algorithm for bidimensional EMD. IEEE Signal Process. Lett 2005, 12, 701–704. [Google Scholar]
- Liu, Z.; Peng, S. Boundary processing of bidimensional EMD using texture synthesis. IEEE Signal Process. Lett 2005, 12, 33–36. [Google Scholar]
- Sinclair, S.; Pegram, G. Empirical Mode Decomposition in 2-D space and time: A tool for space-time rainfall analysis and nowcasting. Hydrol. Earth Syst. Sci 2005, 9, 127–137. [Google Scholar]
- Wang, J.; Zhang, J.; Liu, Z. EMD based multi-scale model for high resolution image fusion. Geo-Spat. Inf. Sci 2008, 11, 31–37. [Google Scholar]
- Qiao, L.H.; Peng, L.Z.; Guo, W.; Yuan, W.T. A novel image fusion algorithm based on 2D EMD and IHS. Proceedings of the Seventh International Conference on Machine Learning and Cybernetics 2008, Kunming, China, 12–15 July 2008; pp. 4040–4044.
- Shi, W.; Tian, Y.; Huang, Y.; Mao, H.; Liu, K. A two-dimensional empirical mode decomposition method with application for fusing panchromatic and multispectral satellite images. Int. J. Remote Sens 2009, 30, 2637–2652. [Google Scholar]
- Zheng, Y.; Qin, Z. Medical image fusion algorithm based on bidimensional empirical mode decomposition. JSoft 2009, 20, 1096–1105. [Google Scholar]
- Chen, S.; Su, H.; Zhang, R.; Tian, J.; Yang, L. Improving empirical mode decomposition using support vector machines for multifocus image fusion. Sensors 2008, 8, 2500–2508. [Google Scholar]
- Zhang, X. Comparison of EMD based image fusion methods. In Proceedings of the International Conference on Computer and Automation Engineering, Bangkok, Thailand, 8–10 March 2009; pp. 302–305.
- Ahmed, M.U.; Mandic, D.P.; Amolins, K.; Zhang, Y.; Dare, P. Image fusion based on Fast and Adaptive Bidimensional Empirical Mode Decomposition. Proceedings of the IEEE 13th International Conference on Information Fusion, Edinburgh, UK, 26–29 July 2010; pp. 1–6.
- Wielgus, M.; Antoniewicz, A.; Bartys, M.; Putz, B. Fast and adaptive bidimensional empirical mode decomposition for the real-time video fusion. In Proceedings of the International Conference on Information Fusion, Singapore, 9–12 July 2012; pp. 649–654.
- Sidek, O.; Quadri, S.A. A review of data fusion models and systems. Int. J. Image Data Fusion 2012, 3, 3–21. [Google Scholar]
- Garcia, J.A.; Rodriguez-Sánchez, R.; Fdez-Valdivia, J.; Toet, A. Visual efficiency of image fusion methods. Int. J. Image Data Fusion 2012, 3, 39–69. [Google Scholar]
- Zhang, J.; Yang, J.; Zhao, Z.; Li, H.; Zhang, Y. Block-regression based fusion of optical and SAR imagery for feature enhancement. Int. J. Remote Sens 2010, 31, 2325–2345. [Google Scholar]
- Dahiya, S.; Garg, P.K.; Jat, M.K. A comparative study of various pixel-based image fusion techniques as applied to an urban environment. Int. J. Image Data Fusion 2013, 4, 197–213. [Google Scholar]
- TM and SPOT Data. Available online: http://www.uvm.edu/ldupigny/185/ENVIDATA/lontmsp/ (accessed on 14 October 2012).
- Gonzalez, R.C.; Woods, R.E.; Eddins, S.L. Digital Image Processing Using MATLAB, 2nd ed.; Gatesmark Publishing: Knoxville, TN, USA, 2009. [Google Scholar]
- Shi, W.; Zhu, C.Q.; Tian, Y.; Nichol, J. Wavelet-based image fusion and quality assessment. Int. J. Appl. Earth Obs. Geoinf 2005, 6, 241–251. [Google Scholar]
- Remote Sensing Image Fusion Datasets. Available online: http://www.datatang.com/data/43234 (accessed on 21 September 2013).
- Zhang, Y.; Hong, G. An IHS and wavelet integrated approach to improve pan-sharpening visual quality of natural color IKONOS and QuickBird images. Inf. Fusion 2005, 6, 225–234. [Google Scholar]
- Chen, Y.; Deng, L.; Li, J.; Li, X.; Shi, P. A new wavelet-based image fusion method for remotely sensed data. Int. J. Remote Sens 2006, 27, 1465–1476. [Google Scholar]
- Yang, J.; Zhang, J.; Huang, G. A parallel computing paradigm for pan-sharpening algorithms of remotely sensed images on a multi-core computer. Remote Sens 2014, 6, 6039–6063. [Google Scholar]
© 2014 by the authors; licensee MDPI, Basel, Switzerland This article is an open access article distributed under the terms and conditions of the Creative Commons Attribution license (http://creativecommons.org/licenses/by/3.0/).