Letter

Quantification of Impact of Orbital Drift on Inter-Annual Trends in AVHRR NDVI Data

by
Jyoteshwar R. Nagol
1,*,
Eric F. Vermote
2 and
Stephen D. Prince
1
1
Department of Geographical Sciences, University of Maryland, 2181 Samuel J. LeFrak Hall, College Park, MD 20742, USA
2
NASA Goddard Space Flight Center, Mail Code 619, Building 32, S036C, Greenbelt, MD 20771, USA
*
Author to whom correspondence should be addressed.
Remote Sens. 2014, 6(7), 6680-6687; https://doi.org/10.3390/rs6076680
Submission received: 14 November 2013 / Revised: 30 June 2014 / Accepted: 3 July 2014 / Published: 22 July 2014

Abstract

:
The Normalized Difference Vegetation Index (NDVI) time-series data derived from Advanced Very High Resolution Radiometer (AVHRR) have been extensively used for studying inter-annual dynamics of global and regional vegetation. However, there can be significant uncertainties in the data due to incomplete atmospheric correction and orbital drift of the satellites through their active life. Access to location specific quantification of uncertainty is crucial for appropriate evaluation of the trends and anomalies. This paper provides per pixel quantification of orbital drift related spurious trends in Long Term Data Record (LTDR) AVHRR NDVI data product. The magnitude and direction of the spurious trends was estimated by direct comparison with data from MODerate resolution Imaging Spectrometer (MODIS) Aqua instrument, which has stable inter-annual sun-sensor geometry. The maps show presence of both positive as well as negative spurious trends in the data. After application of the BRDF correction, an overall decrease in positive trends and an increase in number of pixels with negative spurious trends were observed. The mean global spurious inter-annual NDVI trend before and after BRDF correction was 0.0016 and −0.0017 respectively. The research presented in this paper gives valuable insight into the magnitude of orbital drift related trends in the AVHRR NDVI data as well as the degree to which it is being rectified by the MODIS BRDF correction algorithm used by the LTDR processing stream.

1. Introduction

For more than three decades, the Normalized Difference Vegetation Index (NDVI) time series data derived from the Advanced Very High Resolution Radiometer (AVHRR) series of sensors have been used extensively by the Earth system science research community. The most useful feature of the AVHRR dataset is the temporal length of the data record (∼30 years) and the extension of the record by next generation sensors, like MODerate resolution Imaging Spectrometer (MODIS), and Visible Infrared Imager/radiometer Suite (VIIRS) [1,2].
TIROS-N satellites which carry the AVHRR instruments are deployed on sun synchronous orbits. However, these sensor platforms suffer temporal recession of the equatorial crossing-time as each platform ages [3]. This aging problem is commonly known as orbital drift. Solar zenith angle (SZA) differences due to orbital drift are greatest near lower latitudes and steadily decrease with increase in latitude. For example, by year 1999, SZA at equator for the NOAA-14 AVHRR instrument deviated more than 35° from the angle at launch sun-sensor geometry. However, at 60° latitude the change in SZA was only ∼5° [3].
Surface BRDF and variation of atmospheric path length due to change in SZA, makes NDVI sensitive to the orbital drift [47]. At top of the canopy (TOC), NDVI increases with increase in solar zenith angle [8]. This is due to an increase in the fraction of solar radiation intercepted by the vegetation canopy. Past studies have shown that sensitivity of TOC NDVI to changes in SZA decreases with an increase in LAI [9].
Conversely, when considering the top of the atmosphere (TOA), an increase in SZA leads to a decrease in NDVI. This is due to the increase in atmospheric path length, which leads to an increase of path radiance in red and a decrease in NIR due to atmospheric scattering and absorption [3,7,10,11]. The sensitivity of TOA NDVI to orbital drift increases with increase in LAI. This is because increase in LAI leads to reduced red reflectance, while the atmospheric contribution to the at-sensor red channel measurement (path radiance) increases with increase of SZA. Because NDVI is highly sensitive to red reflectance, orbital drift can cause decrease in NDVI estimates. This atmospheric component of the impact of orbital drift on AVHRR-NDVI time series data is commonly observed at dense tropical forest sites [1]. The View Zenith Angle (VZA) can also exacerbate the impact of orbital drift, which is generally mitigated by restricting VZA to lower angles.
The systematic nature of the uncertainty due to orbital drift in NDVI hinders the investigation of inter-annual trends and anomalies in land surface NDVI. The sensitivity of a processed AVHRR NDVI datasets to the SZA change depends, not only on the atmospheric composition and surface BRDF, but also on the effectiveness of the calibration and atmospheric and BRDF correction algorithms. The objective of this paper is to examine and report the magnitude and spatial patterns of the orbital drift related trends in Long Term Data Record (LTDR) AVHRR NDVI time series data. This was accomplished by direct comparison with inter-annual trends in data from MODIS data which, unlike AVHRR data, does not suffer with orbital drift and also has better atmospheric correction [12,13].

2. Data and Methods

The impact of orbital drift on AVHRR NDVI data was quantified by direct comparison of inter-annual trends in AHVRR data with data from MODIS Aqua instrument at each pixel globally. To examine the impact of orbital drift, the comparison was carried out both before and after normalization of the data to uniform sun-sensor geometry (BRDF correction). Data from the 4 year period of 2003 to 2006 was used for this purpose. The magnitude of spurious inter-annual trends in AVHRR data were estimated as the inter-annual trend of AVHRR NDVI deviation from MODIS-Aqua NDVI trends (AVHRR NDVI—MODIS Aqua NDVI) (Figure 1). The term “spurious-trend” here refers to the inter-annual in AVHRR NDVI time-series data caused, not by actual vegetation dynamics, but by orbital drift. Pixels with insufficient data points (<30) were not included in the analysis. Deserts, wetlands, and urban areas were also excluded, because inter-annual vegetation trends are normally not studied there.

2.1. AVHRR Data

The AVHRR NDVI data from LTDR version-3 dataset were used in this study ( http://ltdr.nascom.nasa.gov/cgi-bin/ltdr/ltdrPage.cgi) [14]. LTDR is processed from AVHRR GAC data and includes daily NDVI as well as surface reflectance data at a spatial resolution of 0.05°, which matches the Climate Modeling Grid (CMG) used for MODIS Terra and Aqua. The LTDR processing includes vicarious calibration of the red and NIR channels using a cloud/ocean technique. The Earth location of each sensor measurement is mapped using inverse navigation technique. The atmospheric correction includes removal of the effects of Raleigh scattering, ozone, and water vapor. Ancillary data for water vapor and ozone correction are acquired from the NOAA Center for Environmental Prediction (NCEP) and Total Ozone Mapping Spectrometer (TOMS) respectively. The data is not corrected for atmospheric aerosols. The data are normalized to a uniform sun-sensor geometry using the BRDF correction technique developed for MODIS CMG data [15]. The dataset also uses an improved cloud masking technique, which utilizes albedo thresholds derived from MODIS data to mask clouds.

2.2. Reference Data (MODIS Aqua Data)

The MODIS Aqua CMG surface reflectance product (MYD09CMG) was used as reference data to quantify residual orbital drift related artifacts in LTDR AVHRR NDVI data. The MODIS CMG data product is provided daily on a 0.05° grid using MODIS Level-1B bands 1–7 (459–2155 nm). The atmospheric correction scheme accounts for the effects of atmospheric gases, aerosols, and thin cirrus clouds. The data are further corrected for BRDF effect using the technique proposed by [15]. MODIS Aqua instrument unlike AVHRR does not suffer from orbital drift.

3. Results and Discussion

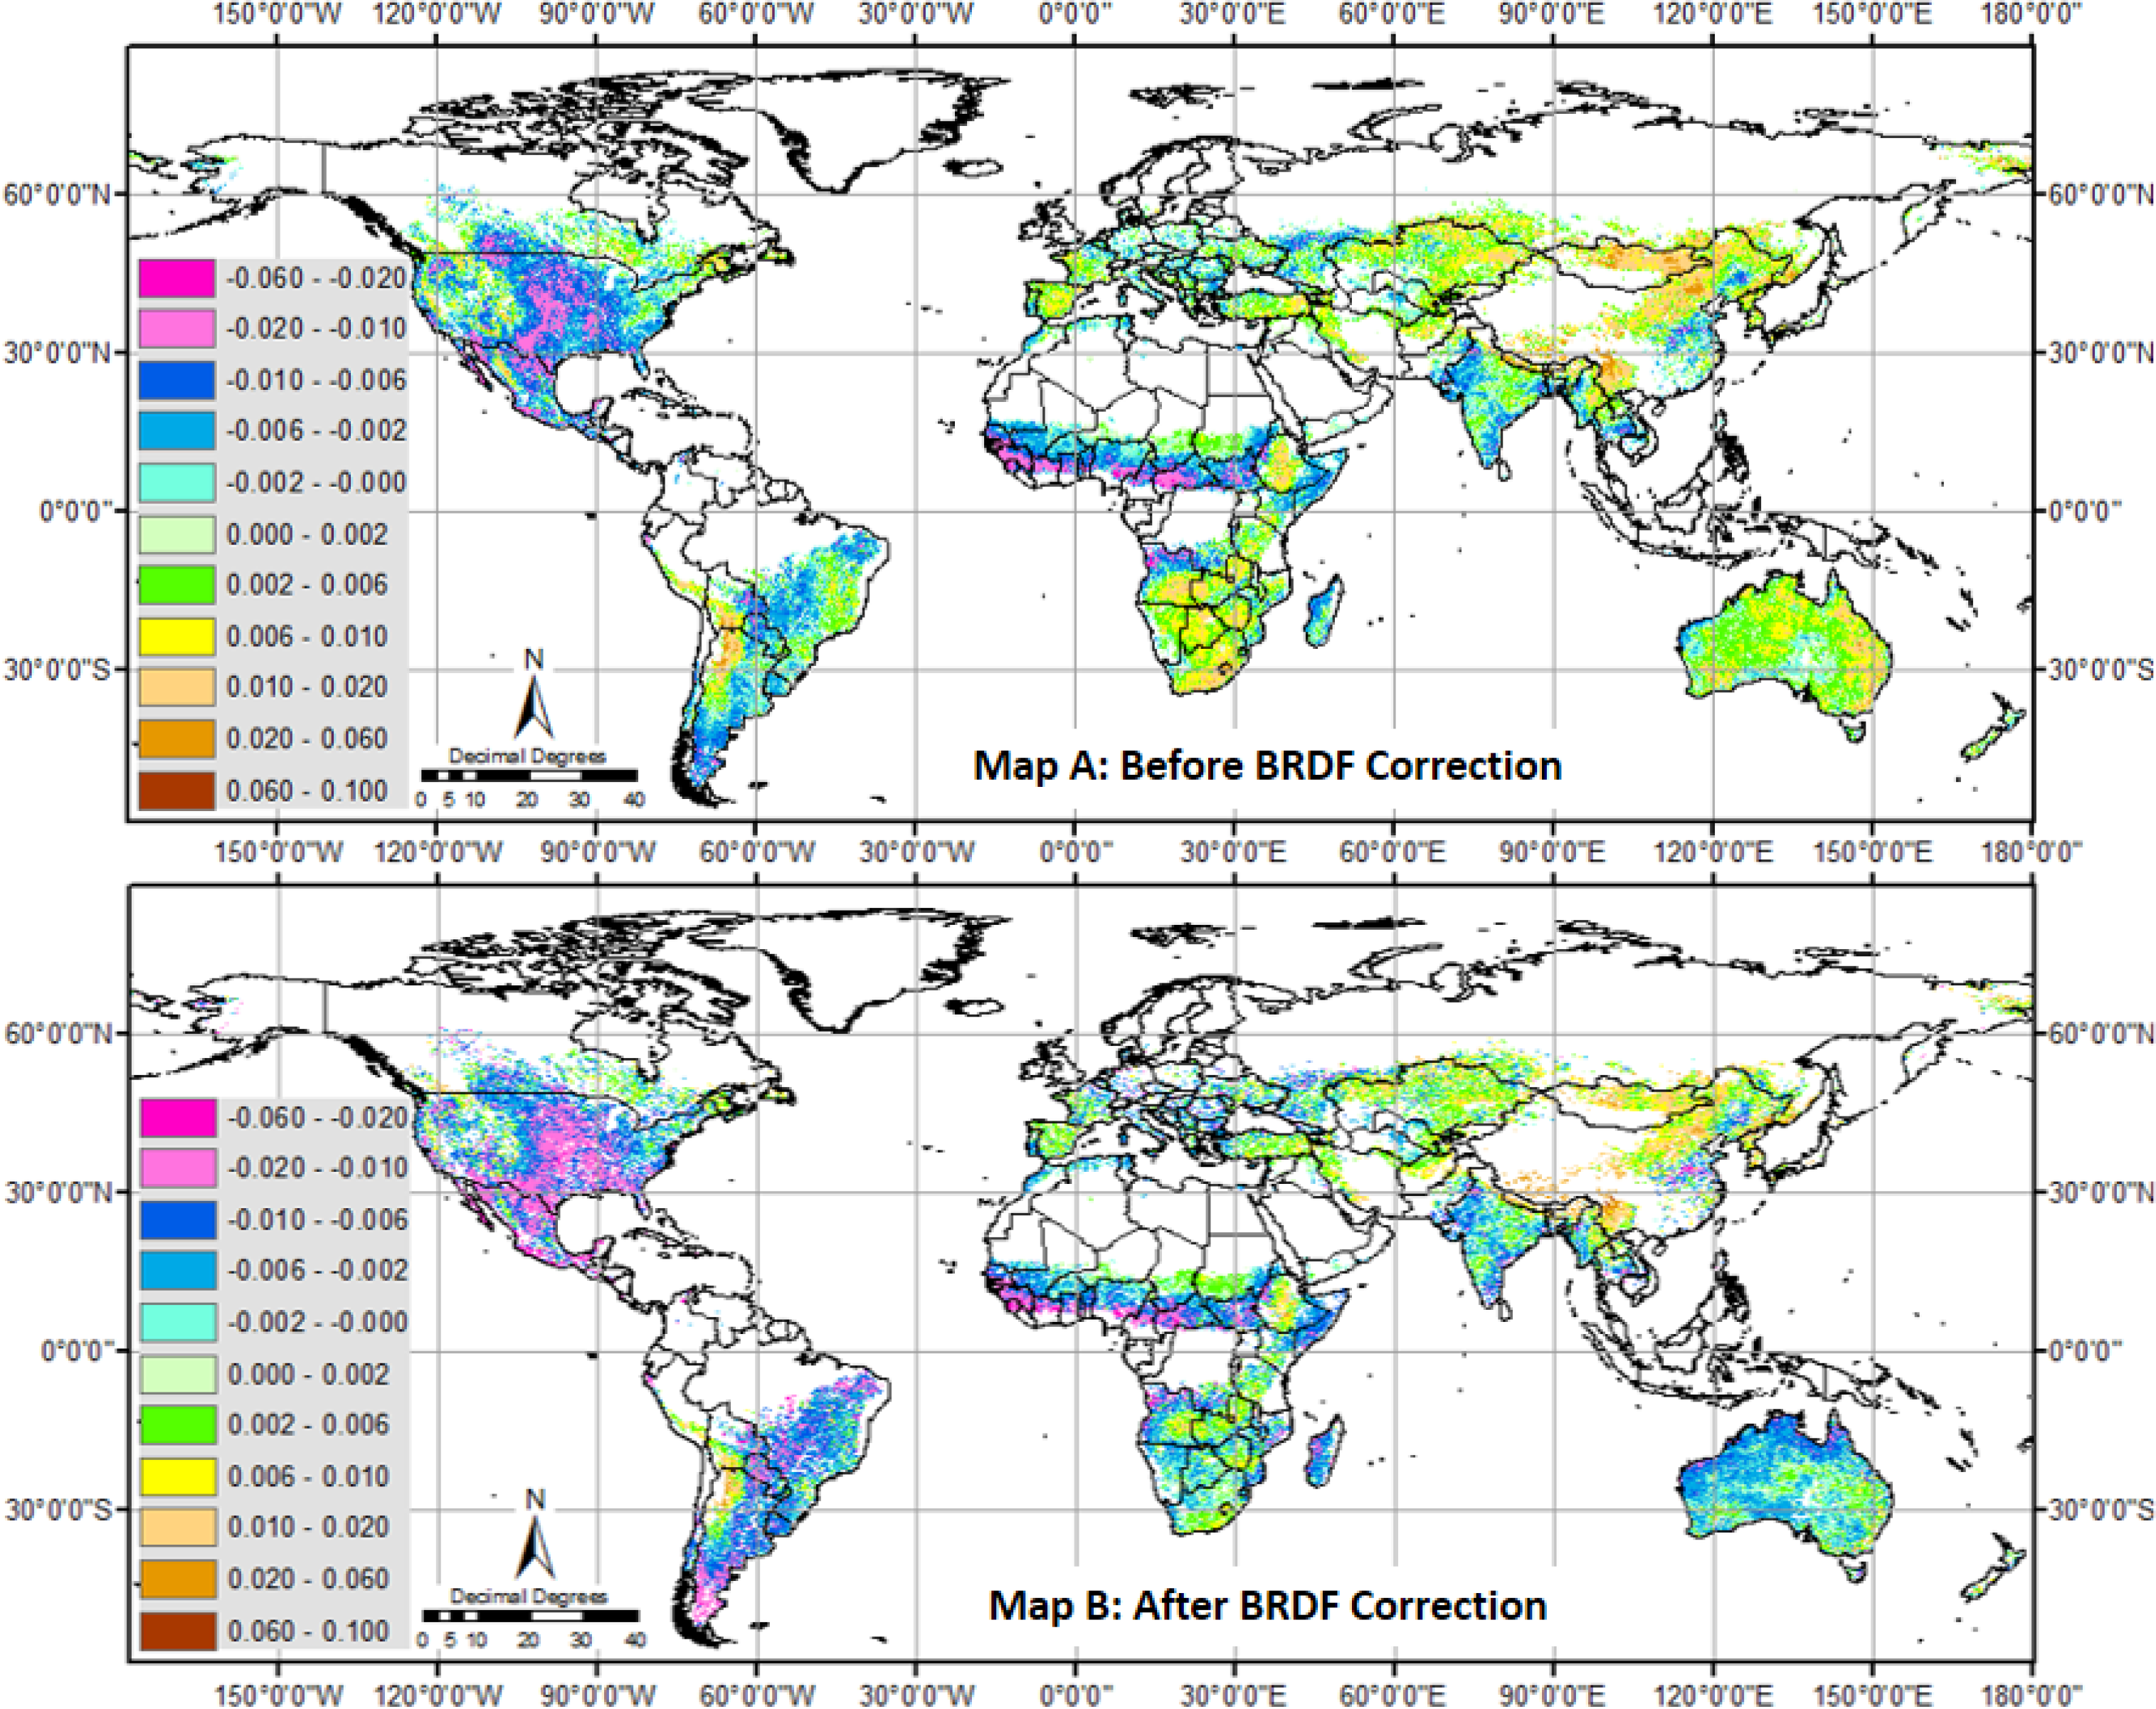
Figure 2 gives a global overview of the impact orbital drift and the extent to which it is being rectified by the removal of the surface BRDF effects using the MODIS BRDF correction method. The map of the orbital drift related spurious inter-annual NDVI changes presented in Figure 2 (Map A) shows presence of both positive as well as negative trends. The positive spurious inter-annual trends were found to be dominant in northern and northeastern Himalayas, in grasslands north and east of Gobi desert, southern Africa, eastern Australia, and in northern Argentina. The negative spurious trends were dominant in densely vegetated regions with high AOT for example tropical forests in Africa and grasslands and croplands in and around the Great-Plains of North America.
After application of the BRDF correction [15], an overall decrease in positive trends and an increase in number of pixels with negative spurious trends were observed. For example, in southern Africa, and Australia positive trends as high as ∼0.06 NDVI units per year decreased to ∼0.02 NDVI units per year or less. Even in the grasslands north and east of the Gobi desert a decrease in the number of pixels showing spurious positive trends was observed. The global mean of inter-annual NDVI trends for all the pixels included in the analysis decreased from 0.0016 to −0.0017 NDVI units per year. However, some regions still showed positive spurious NDVI trends for example, the northeastern Himalayas, northern Argentina.
The magnitude and direction of the orbital drift related spurious trends in AVHRR NDVI can be attributed to a combination of the impact of surface and atmospheric BRDF effects. The presence of surface BRDF effect leads to spurious positive inter-annual trends in AVHRR NDVI data [8], whereas the presence of atmospheric BRDF effect leads to spurious negative inter-annual trends [3,7,10,11]. Depending on the SZA, atmospheric composition, and vegetation cover, either one of these opposite relationships can dominate the other, sometimes even canceling each other out. The effects of orbital drift on AVHRR NDVI data can be minimized by application of effective surface BRDF and atmospheric correction algorithms. However, the atmospheric correction algorithm applied to LTDR NDVI data does not account for atmospheric aerosols. This can lead to presence of predominantly negative trends wherever high AOT occurs.
After application of the BRDF correction [2] most of the regions experienced an overall intensification of negative spurious inter-annual trends in AVHRR NDVI data (Figure 2). This was expected, because the BRDF correction applied here only addresses the contributions of surface BRDF. The only way to deal with atmospheric component of the orbital drift artifact is to improve the atmospheric correction algorithm. However, NOAA AVHRR data are inherently difficult to correct for atmospheric interference [4,12].
One of the primary limitations of the maps representing the orbital drift related spurious inter-annual trends, presented in Figure 2, is that it does not cover many crucial regions like tropical evergreen forests and boreal forests. This was primarily due to inadequate availability of cloud and snow free data. Another caveat is that the maps were produced using 4 years (2003–2006) of data from AVHRR instrument on NOAA 16 satellite platform. The pattern and amplitude of orbital drift of different satellite platforms is not similar. Because of this the absolute magnitude the trends may not directly apply to data from pre-2000 era AVHRR instruments. However, the direction and relative magnitude of the trends is still relevant and gives a valuable insight into the impact of orbital drift on AVHRR NDVI time series data.

4. Conclusions

Although many un-resolved issues and errors are present in AVHRR NDVI time-series, they have been used extensively for Earth science studies. This paper provides maps of pixel scale estimates of orbital drift related spurious trends in LTDR (Version 3) AVHRR NDVI data, for both before and after BRDF correction. Both the maps (Figure 2) show presence of positive as well as negative spurious trends in the data. Although after BRDF correction, an overall decrease in positive trends and an increase in number of pixels with negative spurious trends were observed. The mean global spurious inter-annual trend before and after BRDF correction was 0.0016 and −0.0017 respectively. The research presented in this paper gives valuable insight into both magnitude of the orbital drift related non-stationarity in the NDVI time series data as well as the degree to which it is being rectified by the MODIS BRDF correction technique. The practice of examination and documentation of errors in remote sensing data products is important, because all data, however well processed, will have errors/uncertainties. Most of the past publications about the impact of orbital drift have only come up with overall description of the issue. This is the first research effort which actually accounts for pixel scale heterogeneity.

Acknowledgments

This work was supported by NASA Headquarters under the NASA Earth and Space Science Fellowship Program- Grant “NNX07AN86H”.

Author Contributions

The first author designed the study, conducted the analysis, and wrote the manuscript; the second author contributed to methodology development; and the third author contributed to the user perspective and manuscript development.

Conflicts of Interest

The authors declare no conflict of interest.

References

  1. Tucker, C.J.; Pinzon, J.E.; Brown, M.E.; Slayback, D.A.; Pak, E.W.; Mahoney, R.; Vermote, E.F.; El Saleous, N. An extended AVHRR 8-km NDVI dataset compatible with MODIS and SPOT vegetation NDVI data. Int. J. Remote Sens 2005, 26, 4485–4498. [Google Scholar]
  2. Van Leeuwen, W.J.D.; Huete, A.R.; Laing, T.W. MODIS vegetation index compositing approach: A prototype with AVHRR data. Remote Sens. Environ 1999, 69, 264–280. [Google Scholar]
  3. Privette, J.L.; Fowler, C.; Wick, G.A.; Baldwin, D.; Emery, W.J. Effects of orbital drift on advanced very high-resolution radiometer products—Normalized difference vegetation index and sea-surface temperature. Remote Sens. Environ 1995, 53, 164–171. [Google Scholar]
  4. El Saleous, N.Z.; Vermote, E.F.; Justice, C.O.; Townshend, J.R.G.; Tucker, C.J.; Goward, S.N. Improvements in the global biospheric record from the Advanced Very High Resolution Radiometer (AVHRR). Int. J. Remote Sens 2000, 21, 1251–1277. [Google Scholar]
  5. Los, S.O.; North, P.R.J.; Grey, W.M.F.; Barnsley, M.J. A method to convert AVHRR normalized Difference Vegetation Index time series to a standard viewing and illumination geometry. Remote Sens. Environ 2005, 99, 400–411. [Google Scholar]
  6. Sellers, P.J.; Los, S.O.; Tucker, C.J.; Justice, C.O.; Dazlich, D.A.; Collatz, G.J.; Randall, D.A. A revised land surface parameterization (SiB2) for atmospheric GCMs. Part 2: The generation of global fields of terrestrial biophysical parameters from satellite data. J. Clim 1996, 9, 706–737. [Google Scholar]
  7. Tanre, D.; Holben, B.N.; Kaufman, Y.J. Atmospheric correction algorithm for NOAA-AVHRR products—Theory and application. IEEE Trans. Geosci. Remote Sens 1992, 30, 231–248. [Google Scholar]
  8. Deering, D.W.; Eck, T.F.; Banerjee, B. Characterization of the reflectance anisotropy of three boreal forest canopies in spring—Summer. Remote Sens. Environ 1999, 67, 205–229. [Google Scholar]
  9. Kaufmann, R.K.; Zhou, L.M.; Knyazikhin, Y.; Shabanov, N.V.; Myneni, R.B.; Tucker, C.J. Effect of orbital drift and sensor changes on the time series of AVHRR vegetation index data. IEEE Trans. Geosci. Remote Sens 2000, 38, 2584–2597. [Google Scholar]
  10. Holben, B.N. Characteristics of maximum-value composite images from temporal AVHRR data. Int. J. Remote Sens 1986, 7, 1417–1434. [Google Scholar]
  11. Myneni, R B.; Asrar, G. Atmospheric effects and spectral vegetation indices. Remote Sens. Environ 1994, 47, 390–402. [Google Scholar]
  12. Nagol, J.R.; Vermote, E.F.; Prince, S.D. Effects of atmospheric variation on AVHRR NDVI data. Remote Sens. Environ 2009, 113, 392–397. [Google Scholar]
  13. Vermote, E.; Kotchenova, S. Atmospheric correction for the monitoring of land surfaces. J. Geophys. Res 2009, 113, 1–12. [Google Scholar]
  14. Pedelty, J.; Masuoka, E.B.; Brown, M.E.; Pinzon, J.; Tucker, C.J.; Vermote, E.F.; Prince, S.D.; Justice, C.O.; Nagol, J.; Roy, D.; et al. Generating a long-term land data record from the AVHRR and MODIS Instruments. IEEE Int. Geosci. Remote Sens. Symp 2007. [Google Scholar] [CrossRef]
  15. Vermote, E.; Justice, C.O.; Breon, F.M. Towards a generalized approach for correction of the BRDF effect in MODIS directional reflectances. IEEE Trans. Geosci. Remote Sens 2009, 47, 898–908. [Google Scholar]
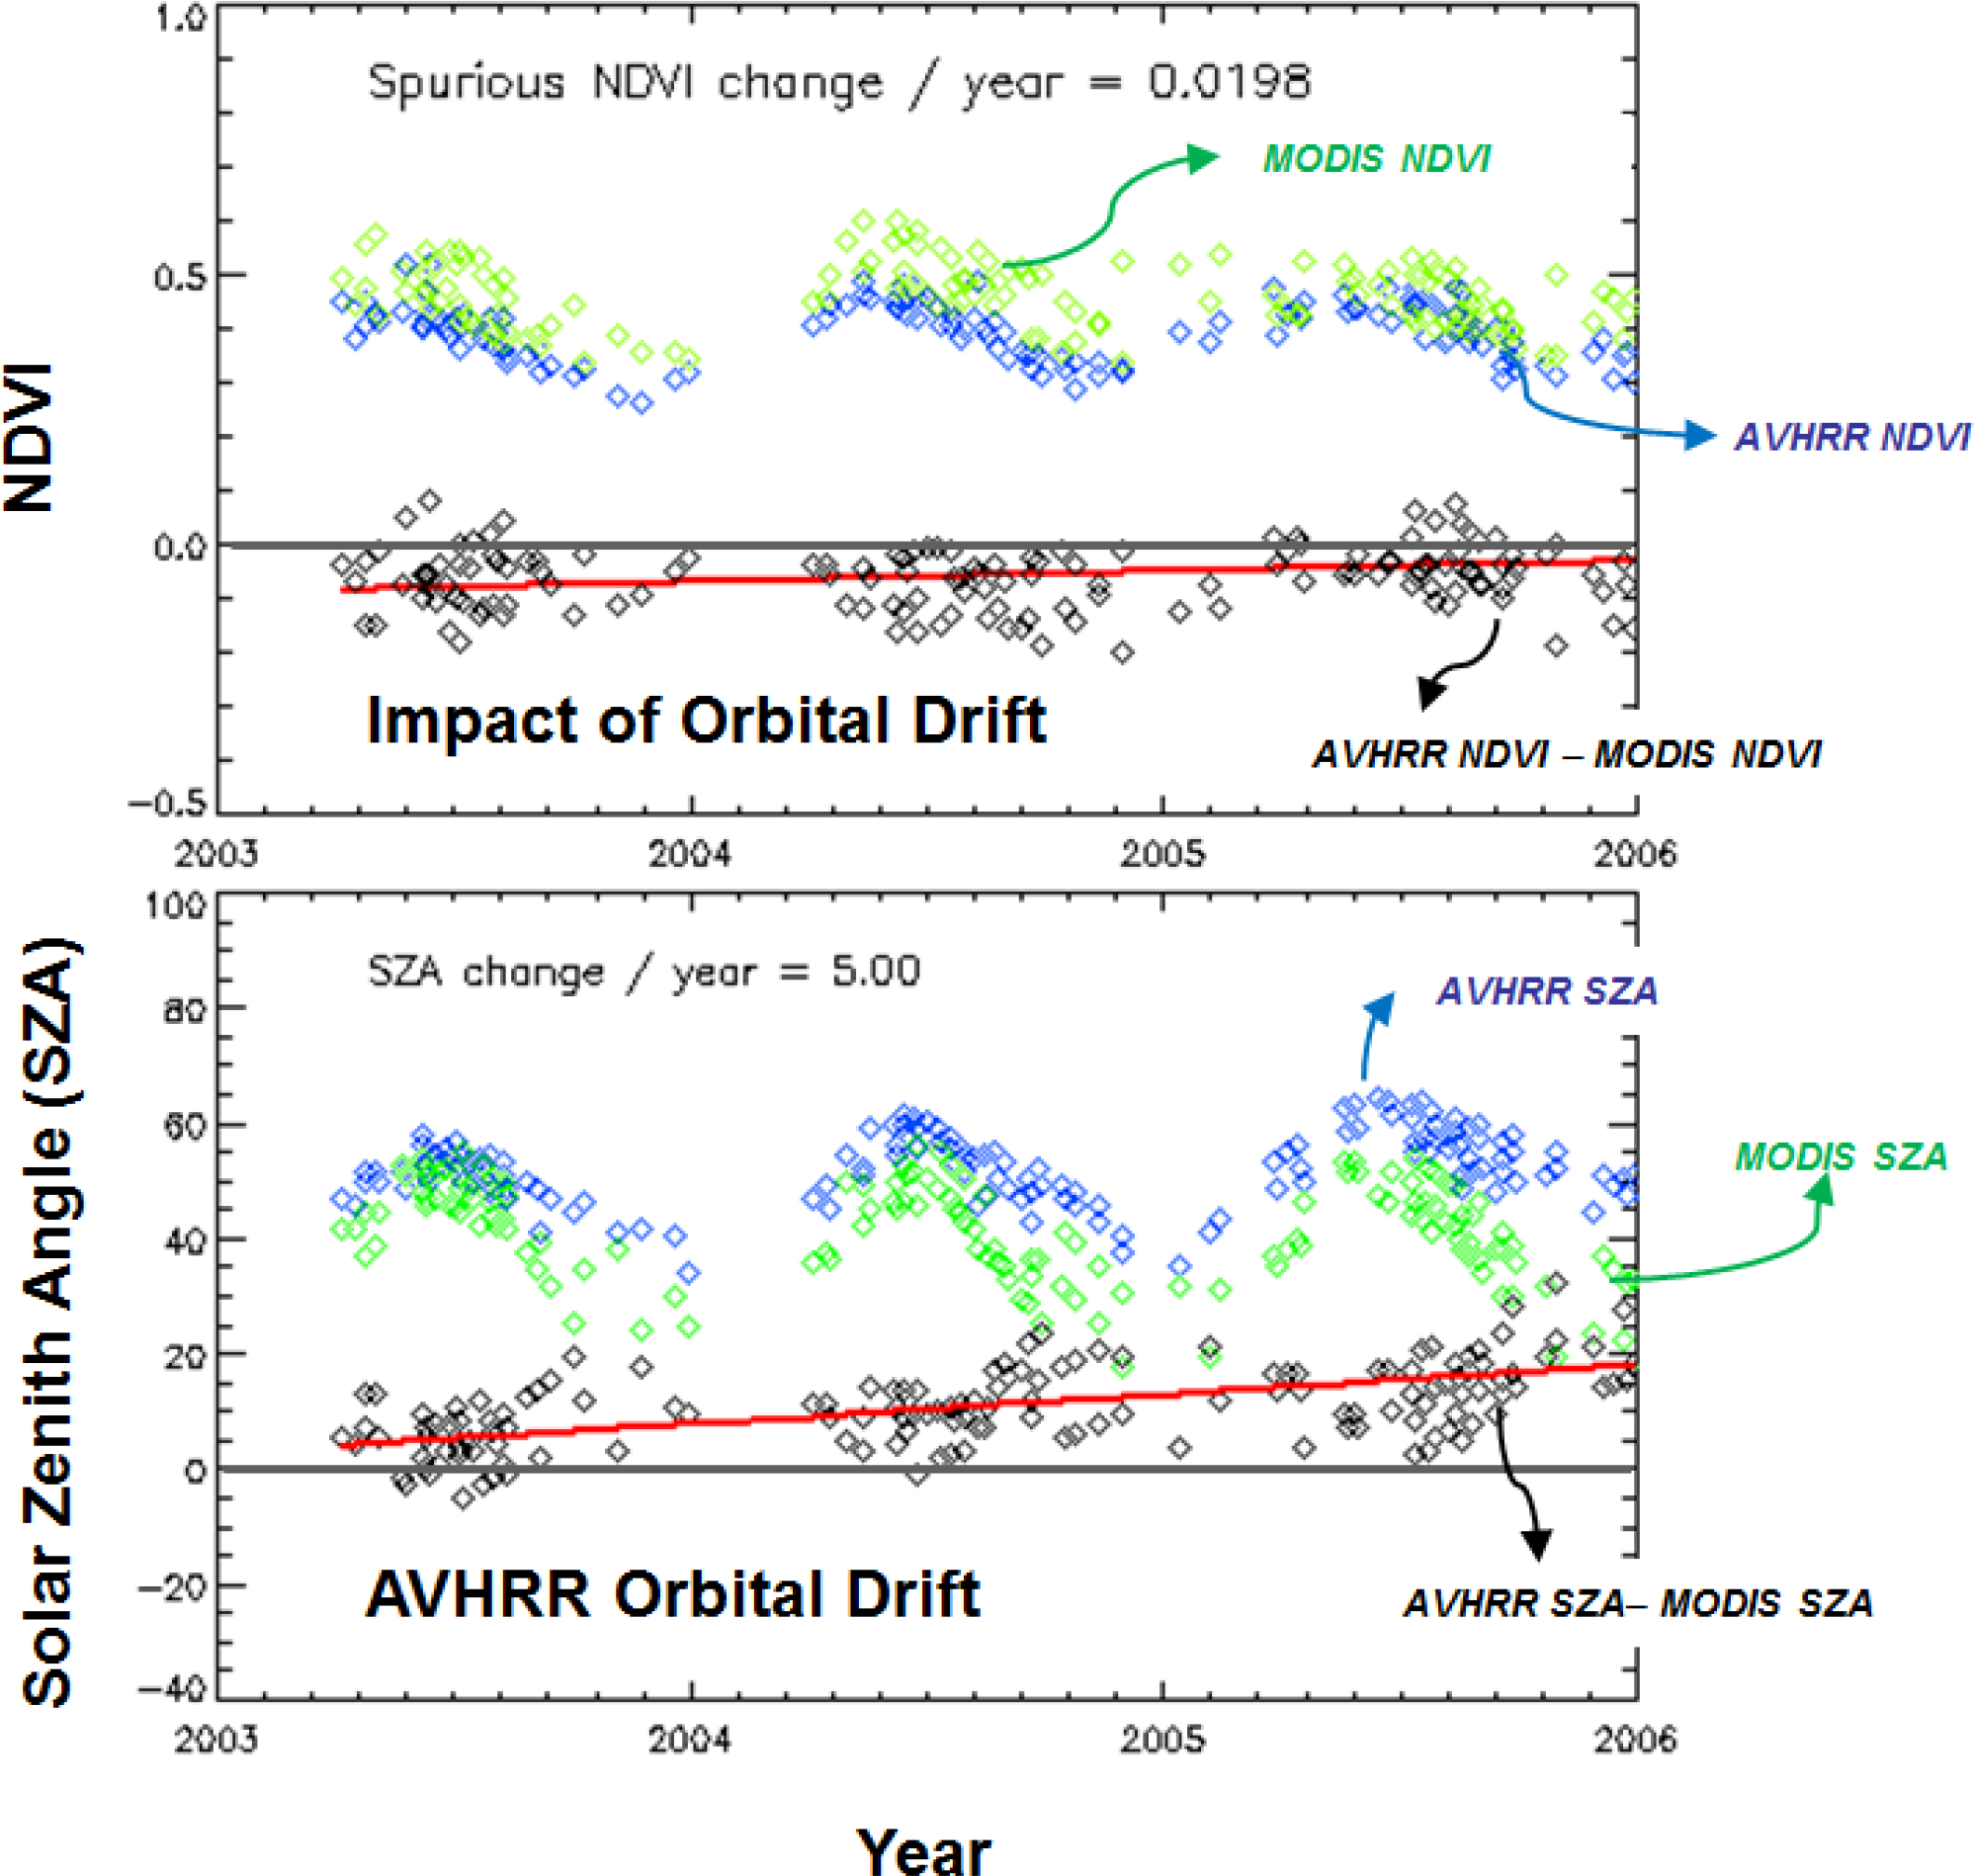
Figure 1. Demonstration of estimation of orbital drift related spurious inter-annual trends in Advanced Very High Resolution Radiometer (AVHRR) Normalized Difference Vegetation Index (NDVI) data. The green, blue, and black colored data represent MODerate resolution Imaging Spectrometer (MODIS) Aqua NDVI data, AVHRR NDVI data, and the difference between these two data (AVHRR NDVI—MODIS NDVI) respectively. The thick red line represents the spurious inter-annual trend. The magnitude of the spurious NDVI trend was determined by estimating slope of the linear curve fitted to the Long Term Data Record (LTDR) AVHRR NDVI and MODIS-Aqua data differences. The inter-annual SZA change is also estimated by similar comparison with MODIS data.
Remotesensing 06 06680f1
Figure 2. Map A: Orbital drift related spurious inter-annual trends in AVHRR NDVI data before BRDF correction; Map B: Orbital drift related spurious inter-annual trends in AVHRR NDVI data after BRDF correction. The magnitude of spurious inter-annual trends were estimated as the inter-annual trend of AVHRR and MODIS NDVI differences (AVHRR NDVI—MODIS_Aqua NDVI) as described in Figure 1. The mean global spurious inter-annual NDVI trend before and after BRDF correction was 0.0016 and −0.0017 respectively. Deserts, urban areas, wetlands, and the pixels with less than 30 data points were excluded from the analysis.
Remotesensing 06 06680f2