Advanced Land Observing Satellite Phased Array Type L-Band SAR (ALOS PALSAR) to Inform the Conservation of Mangroves: Sundarbans as a Case Study

 ,
,
Abstract
:
1. Introduction
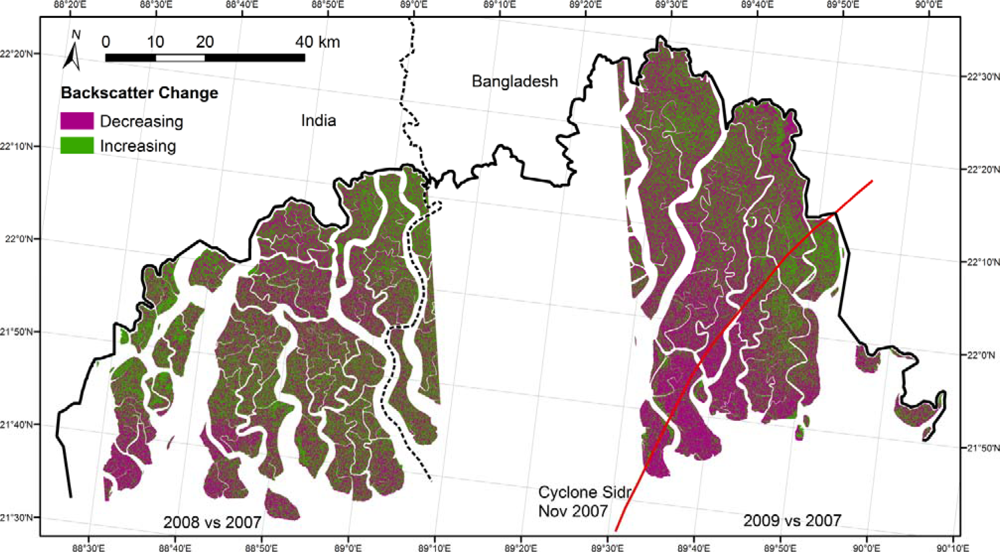
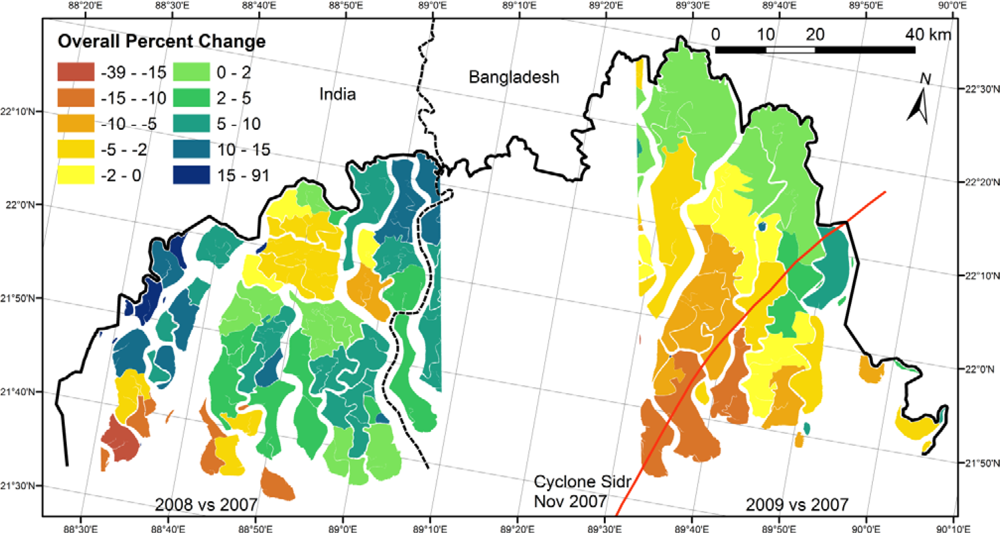
- (H1) Cyclone Sidr’s path indicated that the cyclone went through the Bangladeshi side of the Sundarbans [32]. It can therefore be expected that it resulted mainly in mangrove degradation in Bangladesh.
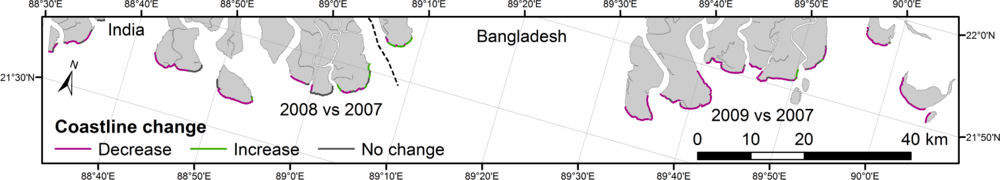
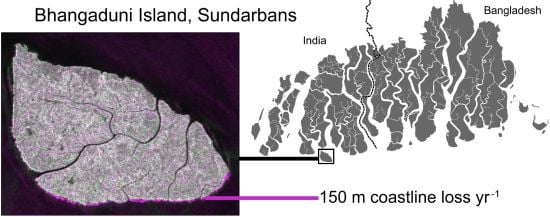
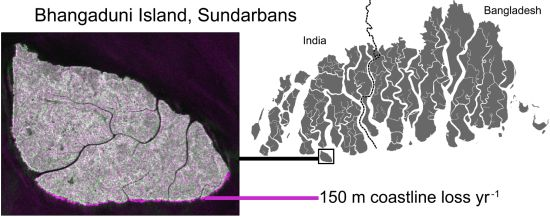
- (H2) Based on previous work [33], we expect coastline retreat to be continuing along the entire coastline of the Sundarbans.
2. Material and Methods
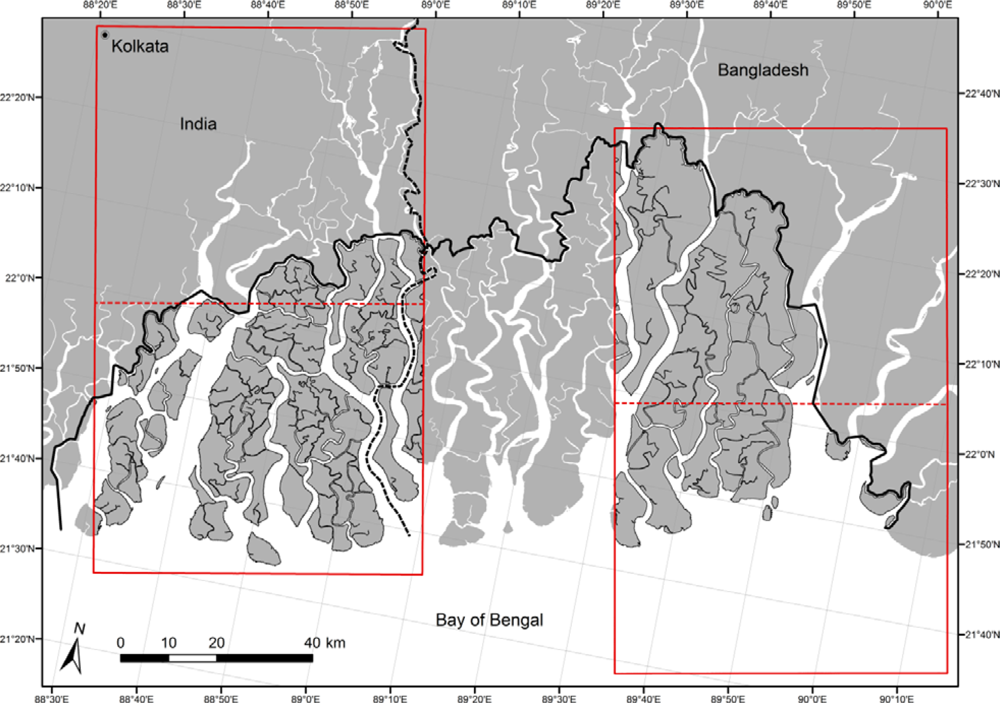
2.1. Study Area
2.2. Remote Sensing Data and Change Detection Analysis
3. Results and Discussion
4. Conclusions
Acknowledgments
References
- Millennium Ecosystem Assessment. In Ecosystems and Human Well-Being; World Resources Institute: Washington, DC, USA, 2005.
- Tomlinson, P.B. The Botany of Mangroves; Cambridge University Press: Cambridge, UK, 1986. [Google Scholar]
- Spalding, M.; Blasco, F.; Field, C. World Mangrove Atlas; The International Society for Mangrove Ecosystems: Okinawa, Japan, 1997; p. 178. [Google Scholar]
- Giri, C.; Ochieng, E.; Tieszen, L.L.; Zhu, Z.; Singh, A.; Loveland, T.; Masek, J.; Duke, N. Status and distribution of mangrove forests of the world using earth observation satellite data. Glob. Ecol. Biogeogr 2011, 20, 154–159. [Google Scholar]
- Kathiresan, K.; Bingham, B.L. Biology of mangroves and mangrove ecosystems. Adv. Mar. Biol 2001, 40, 81–251. [Google Scholar]
- Alongi, D.M. Present state and future of the world’s mangrove forests. Environ. Conserv 2002, 29, 331–349. [Google Scholar]
- Gopal, B.; Chauhan, M. Biodiversity and its conservation in the Sundarban mangrove ecosystem. Aquat. Sci 2006, 68, 338–354. [Google Scholar]
- Giri, C.; Pengra, B.; Zhu, Z.; Singh, A.; Tieszen, L.L. Monitoring mangrove forest dynamics of the Sundarbans in Bangladesh and India using multi-temporal satellite data from 1973 to 2000. Estuarine Coast. Shelf Sci 2007, 73, 91–100. [Google Scholar]
- Lucas, R.M.; Bunting, P.; Clewley, D.; Proisy, C.; Filho, P.W.M.S.; Woodhouse, I.; Ticehurst, C.; Carreiras, J.; Rosenqvist, A.; Accad, A.; et al. Characterisation and Monitoring of Mangroves Using ALOS PALSAR Data; The ALOS Kyoto & Carbon Initiative Science Team Reports Phase 1 (2006–2008); JAXA: Ibaraki, Japan, 2009; Volume 1, pp. 158–169. [Google Scholar]
- Barua, P.; Chowdhury, S.N.; Sarkar, S. Climate change and its risk reduction by mangrove ecosystem of Bangladesh. Bangladesh Res. Publications J 2010, 4, 208–225. [Google Scholar]
- Field, C.B.; Osborn, J.G.; Hoffman, L.L.; Polsenberg, J.F.; Ackerly, D.D.; Berry, J.A.; Björkman, O.; Held, A.; Matson, P.A.; Mooney, H.A. Mangrove biodiversity and ecosystem function. Glob. Ecol. Biogeogr. Lett 1998, 7, 3–14. [Google Scholar]
- Dwivedi, R.S.; Rao, B.R.M.; Bhattacharya, S. Mapping wetlands of the Sundarban Delta and its environs using ERS-1 SAR data. Int. J. Remote Sens 1999, 20, 2235–2247. [Google Scholar]
- Costanza, R.; d'Arge, R.; de Groot, R.; Farber, S.; Grasso, M.; Hannon, B.; Limburg, K.; Naeem, S.; O'Neill, R.V.; Paruelo, J.; et al. The value of the world’s ecosystem services and natural capital. Nature 1997, 387, 253–260. [Google Scholar]
- United Nations Environment Programme, World Conservation Monitoring Centre (UNEPWCMC). In the Front Line: Shoreline Protection and Other Ecosystem Services from Mangroves and Coral Reefs; UNEP-WCMC: Cambridge, UK, 2006; p. 33. [Google Scholar]
- Macintosh, D.; Ashton, E. A Review of Mangrove Biodiversity Conservation and Management; Report 2002; Centre for Tropical Ecosystems Research: Aarhus, Denmark, 2002; pp. 1–86. [Google Scholar]
- Nicholls, R.J.; Wong, P.P.; Burkett, V.; Codignottow, J.; Hay, J.; McLean, R.; Ragoonaden, S.; Woodroffe, C.D. Coastal Systems and Low-Lying Areas. In Climate Change 2007: Impacts, Adaptation and Vulnerability. Contribution of Working Group II to the Fourth Assessment Report of the Intergovernmental Panel on Climate Change; Parry, M., Canziani, O., Palutikof, J., van der Linden, P., Hanson, C., Eds.; Cambridge University Press: Cambridge, UK, 2007; pp. 315–356. [Google Scholar]
- Ellison, J.C.; Gilman, E.L.; Duke, N.C.; Field, C. Mangroves and Climate Change. In World Mangrove Atlas; Spalding, M., Kainuma, M., Collins, L., Eds.; UNEP-WCMC: London, UK, 2010; pp. 34–35. [Google Scholar]
- Valiela, I.; Bowen, J. Mangrove forests: one of the world’s threatened major tropical environments. Bioscience 2001, 51, 807–518. [Google Scholar]
- Polidoro, B.A.; Carpenter, K.E.; Collins, L.; Duke, N.C.; Ellison, A.M.; Ellison, J.C.; Farnsworth, E.J.; Fernando, E.S.; Kathiresan, K.; Koedam, N.E.; et al. The loss of species: Mangrove extinction risk and geographic areas of global concern. PLoS One 2010, 5, e10095. [Google Scholar] [CrossRef]
- Duke, N.C.; Meynecke, J.O.; Dittmann, S.; Ellison, A.M.; Anger, K.; Berger, U.; Cannicci, S.; Diele, K.; Ewel, K.C.; Field, C.D.; et al. A world without mangroves? Science 2007, 317, 41–42. [Google Scholar]
- International Panel for Climate Change. Climate Change 2007: synthesis report. Contribution of Working Groups I, II and III to the Fourth Assessment Report of the Intergovernmental Panel on Climate Change; Cambridge University Press: Cambridge, UK, 2007. [Google Scholar]
- Islam, M.J.; Alam, M.S.; Elahi, K.M. Remote sensing for change detection in the Sundarbans, Bangladesh. Geocarto Int 1997, 12, 91–100. [Google Scholar]
- Kuenzer, C.; Bluemel, A.; Gebhardt, S.; Quoc, T.V.; Dech, S. Remote sensing of mangrove ecosystems: A review. Remote Sens 2011, 3, 878–928. [Google Scholar]
- Rahman, L.M. The Sundarbans: A Unique Wilderness of the World Legal Status. In Wilderness Science in a Time of Change Conference: Proceed. RMRS-P-15; USDA Forest Service: Ogden, UT, USA, 2000; Volume 2, pp. 143–148. [Google Scholar]
- United Nations Environment Programme, World Conservation Monitoring Centre (UNEP-WCMC). Protected Area Database. 2005. Available online: http://www.wcmc.org.uk/data/database/un_combo.html (accessed 3/05/2011).
- Iftekhar, A.M.S.; Islam, M.R. Degeneration of Bangladesh’s Sundarbans mangroves: A management issue. Int. Forestry Rev 2004, 6, 123–135. [Google Scholar]
- Iftekhar, M.; Islam, M. Managing mangroves in Bangladesh: A strategy analysis. J. Coast. Conserv 2004, 10, 139–146. [Google Scholar]
- Mallick, B.; Vogt, J. Analysis of disaster vulnerability for sustainable coastal zone management: A case of cyclone Sidr 2007 in Bangladesh. IOP Conference Series: Earth and Environmental Science 2009, 6, 352029. [Google Scholar]
- Islam, A.; Bala, S.; Hussain, M.; Hossain, M.; Rahman, M.M. Performance of Coastal Structures during Cyclone Sidr. Nat. Haz. Rev 2011, 12, 111–116. [Google Scholar]
- Hossain, M.; Begum, M. Vegetation of Sundarban mangrove forest after the devastating Cyclone Sidr in Bangladesh. Soc. Change 2011, 5, 72–78. [Google Scholar]
- United Nations Environment Programme, World Conservation Monitoring Centre (UNEPWCMC). The Sundarbans, Bangladesh, 2011.
- Akhter, M.; Iqbal, Z.; Chowdhury, R.M. ASTER imagery of forest areas of Sundarban damaged by cyclone Sidr. ISME/GLOMIS Electron. J. 2008, 6(1). [Google Scholar]
- Rahman, A.F.; Dragoni, D.; El-Masri, B. Response of the Sundarbans coastline to sea level rise and decreased sediment flow: A remote sensing assessment. Remote Sens. Environ 2011, 115, 3121–3128. [Google Scholar]
- Karim, A. Report on Mangrove Siliviculture. In Integrated Resource Development of the Sundarbans Reserved Forest; FAO/UNDP Project BGD/84/056; United Nations Development Programme and Food and Agriculture Organization of the United Nations: Rome, Italy, 1995; Volume 1. [Google Scholar]
- International Union for the Conservation of Nature (IUCN)-Bangladesh. The Bangladesh Sundarbans: A Photo Real Sojourn; IUCN Bangladesh Country Office: Dhaka, Bangladesh, 2001. [Google Scholar]
- Nayak, S.; Bahuguna, A. Application of remote sensing data to monitor mangroves and other coastal vegetation of India. Indian J. Mar. Sci 2001, 30, 195–213. [Google Scholar]
- Emch, M.; Peterson, M. Mangrove forest cover change in the Bangladesh Sundarbans from 1989–2000: A remote sensing approach. Geocarto Int 2006, 21, 5–12. [Google Scholar]
- Lucas, R.M.; Mitchell, A.L.; Rosenqvist, A.; Proisy, C.; Melius, A; Ticehurst, C. The potential of L-band SAR for quantifying mangrove characteristics and change: case studies from the tropics. Aquat. Conserv. Mar. Freshwat. Ecosyst 2007, 17, 245–264. [Google Scholar]
- Mitchard, E.T.A.; Saatchi, S.S.; Lewis, S.L.; Feldpausch, T.R.; Woodhouse, I.H.; Sonké, B.; Rowland, C.; Meir, P. Measuring biomass changes due to woody encroachment and deforestation/degradation in a forest-savanna boundary region of central Africa using multi-temporal L-band radar backscatter. Remote Sens. Environ 2011, 115, 2861–2873. [Google Scholar]
- Proisy, C.; Mitchell, A.; Lucas, R.; Fromard, F.; Mougin, E. Estimation of Mangrove Biomass using Multifrequency Radar Data. Application to Mangroves of French Guiana and Northern Australia. Proceeding of the Mangrove 2003 Conference, Salvador, Bahia, Brazil, 20–24 May 2003.
- Intergovernmental Panel on Climate Change, IPCC. Good Practice Guidance for Land Use, Land-Use Change and Forestry; Institute for Global Environmental Strategies: Hayama, Japan, 2003. [Google Scholar]
- Center for Environmental and Geographic Information Services (CEGIS). Effect of Cyclone Sidr on the Sundarbans: A Preliminary Assessment, Dhaka, Bangladesh. 2007. Available online: http://www.lcgbangladesh.org/derweb/cyclone/cyclone_assessment/effect%20of%20cyclone%20sidr%20on%20sundarbans_cegis.pdf (accessed on 14 December 2012).
- Lopes, A; Nezry, E; Touzi, R; Laur, H. Structure detection and statistical adaptive speckle filtering in SAR images. Int. J. Remote Sens 1993, 14, 1735–1758. [Google Scholar]
- Carreiras, J.M.B.; Vasconcelos, M.J.; Lucas, R.M. Understanding the relationship between aboveground biomass and ALOS PALSAR data in the forests of Guinea-Bissau (West Africa). Remote Sens. Environ 2012, 121, 426–442. [Google Scholar]
- Rahman, M.; Islam, K. The causes of deterioration of Sundarban mangrove forest ecosystem of Bangladesh: conservation and sustainable management issues. AACL Bioflux. 2010, 3, 77–90. [Google Scholar]
- Space Research and Remote Sensing Organization (SPARRSO). Cyclone-Affected Areas of the Sundarban as Inferred from Terra-MODIS Satellite Data, Dhaka, Bangladesh. 2007.
- UNESCO. UNESCO - World Heritage Centre Report; Dhaka, Bangladesh, 2007. [Google Scholar]
- Innes, J.L. Forest decline. Prog. Phys. Geogr 1992, 16, 1–64. [Google Scholar]
- Bangladesh University of Engineering and Technology (BUET). Field Investigation on the Impact of Cyclone Sidr in the Coastal Region of Bangladesh; BUET: Dhaka, Bangladesh, 2008. [Google Scholar]
- Pettorelli, N; Vik, J.O.; Mysterud, A.; Gaillard, J.-M.; Tucker, C.J.; Stenseth, N.C. Using the satellite-derived NDVI to assess ecological responses to environmental change. Trends Ecol. Evol 2005, 20, 503–510. [Google Scholar]
- Zeng, Y.; Zhang, J.; van Genderen, J.L. Change detection approach to SAR and optical image interpretation. Int. Arch. Photogramm. Remote Sens. Spat. Inform. Sci 2008, XXXVII, 1077–1084. [Google Scholar]
- Othman, M.A. Value of mangroves in coastal protection. Hydrobiologica 1994, 285, 277–282. [Google Scholar]
- Gilman, E.L.; Ellison, J.; Duke, N.C.; Field, C. Threats to mangroves from climate change and adaptation options: A review. Aquat. Bot 2008, 89, 237–250. [Google Scholar]
- International Panel for Climate Change, IPCC. Summary for Policymakers. Field, C.B., Barros, V., Stocker, T.F., Qin, D., Dokken, D.J., Ebi, K.L., Mastrandrea, M.D., Mach, K.J., Plattner, G.-K., Allen, S.K., et al., Eds.; Cambridge University Press: Cambridge, UK, and New York, NY, USA, 2012; pp. 1–19. [Google Scholar]
- Ray, R.; Ganguly, D.; Chowdhury, C.; Dey, M.; Das, S.; Dutta, M.K.; Mandal, S.K.; Majumder, N.; De, T.K.; Mukhopadhyay, S.K.; Jana, T.K. Carbon sequestration and annual increase of carbon stock in a mangrove forest. Atmos. Environ 2011, 45, 5016–5024. [Google Scholar]
- Shimada, M.; Isoguchi, O.; Tadono, T.; Isono, K. PALSAR Radiometric and Geometric Calibration. IEEE Trans. Geosci. Remote Sens 2009, 47, 3915–3932. [Google Scholar]
- Syed, M.; Hussin, Y.; Weir, M. Detecting Fragmented Mangroves in the Sundarbans, Bangladesh Using Optical and Radar Satellite Images. Proceedings of the 22nd Asian Conference on Remote Sensing, Singapore, 5–9 November 2001.
- Giri, C.; Shrestha, S. Land cover mapping and monitoring from NOAA AVHRR data in Bangladesh. Int. J. Remote Sens. 1996, 17, 2749–2759. [Google Scholar]
- Imhoff, M.; Story, M.; Vermillion, C.; Khan, F.; Polcyn, F. Forest Canopy Characterization and Vegetation Penetration Assessment with Space-Borne Radar. IEEE Trans. Geosci. Remote Sens. 1986, GE-24, 535–542. [Google Scholar]
- Blasco, F.; Aizpuru, M.; Gers, C. Depletion of the mangroves of Continental Asia. Wetlands Ecol. Manage 2001, 9, 245–256. [Google Scholar]
- Giri, C.; Zhu, Z.; Tieszen, L.L.; Singh, A.; Gillette, S.; Kelmelis, J.A. Mangrove forest distributions and dynamics (1975–2005) of the tsunami-affected region of Asia. J. Biogeogr 2008, 35, 519–528. [Google Scholar]
- Kushwaha, S.P.S.; Dwivedi, R.S.; Rao, B.R.M. Evaluation of various digital image processing techniques for detection of coastal wetlands using ERS-1 SAR data. Int. J. Remote Sens 2000, 21, 565–579. [Google Scholar]


| Parameters Studied | Technique | Location | Period of study | Reference |
|---|---|---|---|---|
| Edge detection, habitat fragmentation | Optical and radar | Bangladesh: 89°03′ to 89°15′E and 21°55′ to 22°09′N | 1996–2000 | [57] |
| Change detection | Optical | Bangladesh | 1989, 2000 | [37] |
| Land cover, vegetation type | Optical and radar | India: 21°30′–22°45′N and 88°–89°E | 1992–1993 | [12] |
| Change detection | Optical | Sundarbans | 1973–1983; 1989–1993; 1997–2000s | [8] |
| Land cover, vegetation type | Optical | Bangladesh | 1985–1986; 1992–1993 | [58] |
| Forest canopy characterization | Radar | South-east Bangladesh | 1984 | [59] |
| Forest characterization | Optical | Sundarbans 8°00′–22°00′N, 88°00′–110°00′E | 1999 | [60] |
| Land cover | Optical | Sundarbans | 1975, 1990, 2000, 2005 | [61] |
| Change detection | Optical | Bangladesh 21°′40–22°30′N, 89°00′–89°55′E | 1933, 1960, 1985 | [22] |
| Change detection | Optical | Bangladesh | November 2007 | [49] |
| Wetland mapping | Radar | India 21°30′–22°45′N, 88°0′–89°0′E | October 1992 and September 1993 | [62] |
Share and Cite
Cornforth, W.A.; Fatoyinbo, T.E.; Freemantle, T.P.; Pettorelli, N. Advanced Land Observing Satellite Phased Array Type L-Band SAR (ALOS PALSAR) to Inform the Conservation of Mangroves: Sundarbans as a Case Study. Remote Sens. 2013, 5, 224-237. https://doi.org/10.3390/rs5010224
Cornforth WA, Fatoyinbo TE, Freemantle TP, Pettorelli N. Advanced Land Observing Satellite Phased Array Type L-Band SAR (ALOS PALSAR) to Inform the Conservation of Mangroves: Sundarbans as a Case Study. Remote Sensing. 2013; 5(1):224-237. https://doi.org/10.3390/rs5010224
Chicago/Turabian StyleCornforth, William A., Temilola E. Fatoyinbo, Terri P. Freemantle, and Nathalie Pettorelli. 2013. "Advanced Land Observing Satellite Phased Array Type L-Band SAR (ALOS PALSAR) to Inform the Conservation of Mangroves: Sundarbans as a Case Study" Remote Sensing 5, no. 1: 224-237. https://doi.org/10.3390/rs5010224
APA StyleCornforth, W. A., Fatoyinbo, T. E., Freemantle, T. P., & Pettorelli, N. (2013). Advanced Land Observing Satellite Phased Array Type L-Band SAR (ALOS PALSAR) to Inform the Conservation of Mangroves: Sundarbans as a Case Study. Remote Sensing, 5(1), 224-237. https://doi.org/10.3390/rs5010224