Communication

Plant Species Richness is Associated with Canopy Height and Topography in a Neotropical Forest

by
Jeffrey A. Wolf
1,*,
Geoffrey A. Fricker
2,
Victoria Meyer
3,
Stephen P. Hubbell
1,4,
Thomas W. Gillespie
2 and
Sassan S. Saatchi
3
1
Department of Ecology and Evolutionary Biology, University of California, Los Angeles, Los Angeles, CA 90095, USA
2
Department of Geography, University of California, Los Angeles, Los Angeles, CA 90095, USA
3
Jet Propulsion Laboratory, California Institute of Technology, 4800 Oak Grove Dr., Pasadena, CA 91109, USA
4
Center for Tropical Forest Science, Smithsonian Tropical Research Institute, Apartado 0843-03092, Balboa, Republic of Panama
*
Author to whom correspondence should be addressed.
Remote Sens. 2012, 4(12), 4010-4021; https://doi.org/10.3390/rs4124010
Submission received: 19 October 2012 / Revised: 17 December 2012 / Accepted: 17 December 2012 / Published: 18 December 2012
(This article belongs to the Special Issue Remote Sensing of Biological Diversity)

Abstract

:
Most plant species are non-randomly distributed across environmental gradients in light, water, and nutrients. In tropical forests, these gradients result from biophysical processes related to the structure of the canopy and terrain, but how does species richness in tropical forests vary over such gradients, and can remote sensing capture this variation? Using airborne lidar, we tested the extent to which variation in tree species richness is statistically explained by lidar-measured structural variation in canopy height and terrain in the extensively studied, stem-mapped 50-ha plot on Barro Colorado Island (BCI), Panama. We detected differences in species richness associated with variation in canopy height and topography across spatial scales ranging from 0.01-ha to 1.0-ha. However, species richness was most strongly associated with structural variation at the 1.0-ha scale. We developed a predictive generalized least squares model of species richness at the 1.0-ha scale (R2 = 0.479, RMSE = 8.3 species) using the mean and standard deviation of canopy height, mean elevation, and terrain curvature. The model demonstrates that lidar-derived measures of forest and terrain structure can capture a significant fraction of observed variation in tree species richness in tropical forests on local-scales.

Graphical Abstract

1. Introduction

At local-scales in tropical tree communities, species distributions are often correlated with differences in light, water, and nutrient availability caused by biophysical processes related to forest structure and topography [15]. Although species-level associations with environmental gradients are well documented at local-scales, there is limited information about how community-level patterns like species richness change in relation to structural variation in canopy height and terrain. Airborne lidar is the best currently available remote sensing technology which can measure three-dimensional forest structure and topography variables with both high spatial accuracy and precision in tropical forests [68]. We assessed whether and how species richness is associated with lidar-measured canopy height and topography in the 50-ha Forest Dynamics Plot (FDP) on Barro Colorado Island (BCI), Panama [9,10].
The effects of heterogeneity in forest structure on diversity in tropical forests remain poorly understood. Many researchers hypothesize that gaps increase diversity in tropical forests [11] because high-light environments are necessary for recruitment of pioneers and lianas [12,13]. The direct effect of gaps on fine scale (0.04-ha) species richness appears to be modest [9], but structural heterogeneity is likely to be a cause of variation in species richness due to some sorting of different species over gap-to-understory environmental gradients [1,11]. For example, of the 70 canopy tree species occurring in the BCI FDP, 30% were positively or negatively associated with part of the gap-to-understory ecotone as juveniles, where the gap-to-understory ecotone was defined by canopy height measurements [1]. We therefore evaluated whether and how species richness is related to canopy height and canopy structural heterogeneity.
There is also reason to believe that species richness is related to topography at local scales in tropical forests. Past studies in the FDP have found species-level associations with environmental gradients in water and nutrient availability related to topography. Of the 171 species in the FDP with over 65 individuals (171 species), 64% were positively or negatively associated with at least one topographically defined habitat [2]. Forty percent (104 of 258 species) of BCI trees and shrubs occur non-randomly over at least one of three nutrient gradients [3]. Earlier research in the BCI FDP found a positive association between terrain slope and species richness of seedlings (1.0–3.9 cm diameter at 1.3 m height, i.e., dbh) [9]. Slopes have higher dry season soil water availability than upland plateau sites in the BCI FDP [14,15], the main hypothesis being that greater dry season soil water availability permits seedlings of species commoner in wetter forests to survive the BCI dry season [9]. This hypothesis is supported by demographic and physiological studies of seedlings showing that species associated with slopes are more sensitive to drought [4,5]. One of these studies [4] also showed that species occurring in locally drier sites in the BCI plot are more likely to occur in drier forests across the rainfall gradient spanning the Isthmus of Panama, and vice versa. Because regional species richness is generally higher in wetter and less seasonal forests [16,17] and there is local variation in soil water availability related to topography [14,15], higher species richness may occur where local-scale variation in topography results in higher soil water availability. Because of prior research on species distributions and species richness, we evaluated whether and how species richness is associated with topography in the BCI 50-ha plot.

2. Materials and Methods
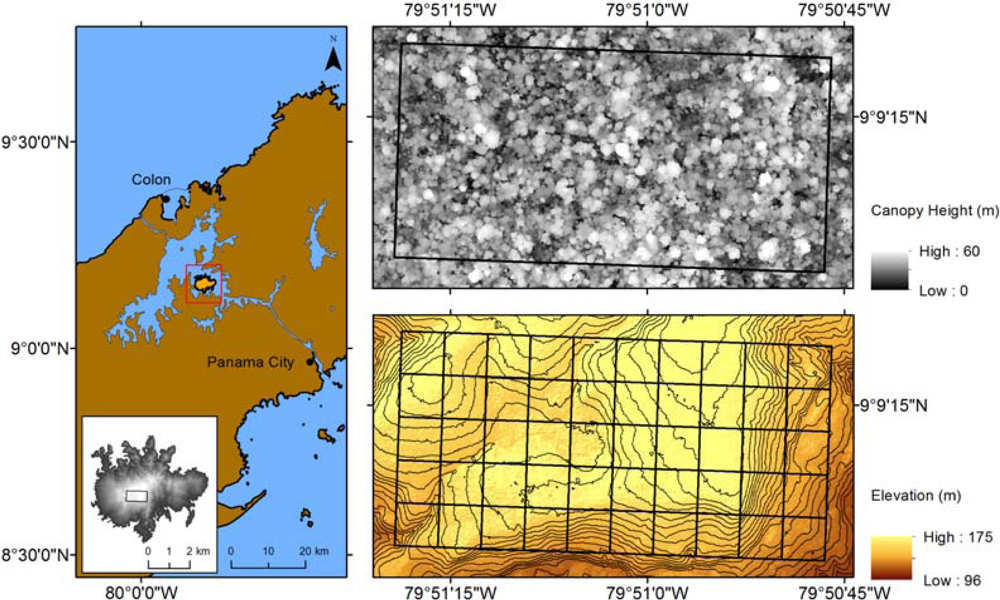
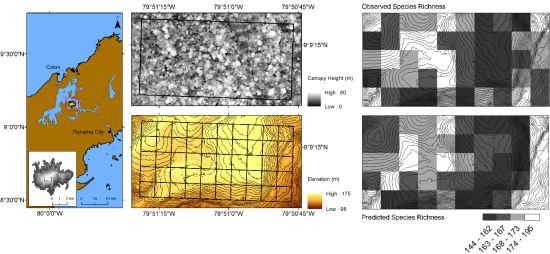
2.1. Study Area

We collected data across the 50-ha BCI FDP on the 15.6 km2 Barro Colorado Island, Republic of Panama. The FDP is located at 79°51′W, 9°9′N (Figure 1) on the central plateau of the island. The climate of Barro Colorado Island is seasonal, with an average four-month dry season from late December through late April [4]. Mean annual precipitation from 1990 to 2011 is 2,746 mm with high interannual variability associated with El Niño Southern Oscillation (σ = 541 mm, min. = 1,702 mm, and max. = 4,136 mm) [18]. The vegetation is mainly old-growth tropical semi-deciduous forest [19], with about 2 ha of 100-year old secondary forest. Most of the area within the plot is relatively flat with a slope <10°, but steeper slopes occur along the plot margins, particularly in the south east corner. Water accumulates on the Andesite bedrock of the central plateau in the FDP and then drains towards the sloping margins [20], causing higher soil water availability on slopes during the dry season [14]. The center of the plot includes a 2-ha seasonal swamp where water pools during the wet season, causing seasonally anoxic soils. Soil nutrients correlate with topography [3], with higher phosphorous on the central plateau and higher base cations on slopes. Within the FDP, all freestanding woody stems ≥1 cm dbh have been measured in diameter, labeled, mapped to sub-meter precision, and identified to species. The first inventory of the plot was completed in 1983, the plot was re-censused in 1985, and has been re-censused at five-year intervals ever since. The seventh census was completed in 2010.

2.2. Computing Species Richness

We used data on all freestanding woody plants (lianas and herbaceous plants excluded) in the 50-ha BCI FDP 2010 census to measure species richness. We included only alive main stems as individuals in our analysis. The 2010 census included 211,720 individuals (4234 ± 48.1 individuals ha−1, mean ± S.E.) belonging to 302 species (167 ± 1.4 species ha−1, mean ± S.E.) of freestanding woody plants. To measure species richness, we defined a grid system (0.01-ha, 0.04-ha, 0.25-ha, or 1.0-ha cells) across the entire FDP. For each cell, we iterated over all individuals in the census and recorded the individuals occurring in the cell. We then counted the number of unique species per cell (Figure S1).

2.3. Lidar Data

2.3.1. Data Collection

We used discrete-return lidar data collected by Blom Corporation and Northrup Grumman over Barro Colorado Island Nature Monument. These data were collected during the wet season between 15 August 2009 and 10 September 2009 during eleven flights by a fixed-wing aircraft equipped with an Optech 3100 (Optech, Vaughan, ON, USA) system capable of four returns per pulse. The mean flying height was 457.2 m and mean flight speed was 66.9 m/second. The system operated at a scan angle of 17°, using a scanning frequency of 48 Hz and laser frequency of 70 KHz. All flights produced a total of >233 million laser shots and >528 million individual data points, resulting in a point density of 5.6 points per square meter (ppm2) and 8.1 returns per square meter (rpm2). We used a 1-m digital elevation model (DEM) and 1-m digital canopy surface model (DCSM). The DEM and DCSM were created by Blom Corp. who calibrated and filtered unprocessed lidar data using Bentley’s Microstation (Bently, Exton, PA) and then manually edited the product to make a bare-earth DEM. Blom Corp. verified vertical accuracy of the DEM using 36 Differential GPS survey points in flat open areas around the island. The average error in height between the ground survey points and the DEM was 6.9 cm with RMSE value of 7.6 cm. Blom Corp. produced the DCSM from the point of highest return above each cell on a 1-m grid. We compared the DCSM to ground-based canopy height measurements from 2009 that were collected every 5 m across the entire 50-ha plot [9], which were in general agreement with the 1-m DCSM.

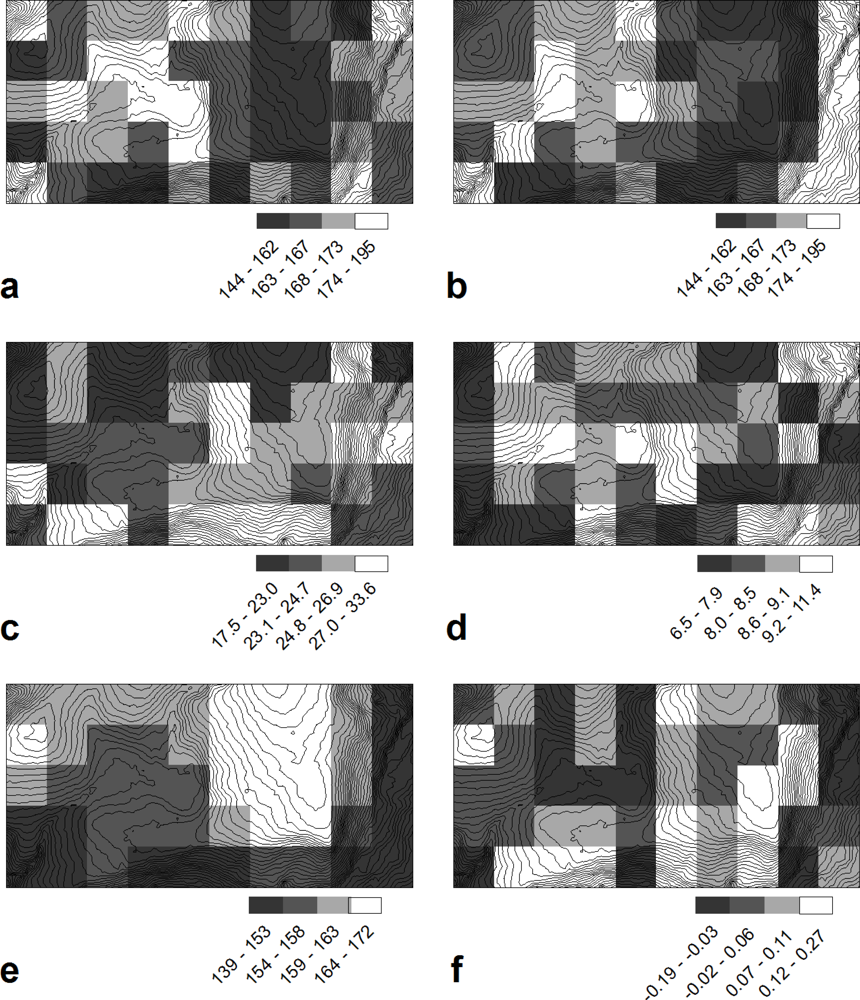
2.3.2. Lidar Measured Variables

We quantified properties of canopy and terrain structure in non-overlapping areas at four spatial scales (0.01-ha, 0.04-ha, 0.25-ha, and 1.0-ha) from the 1-m DEM and 1-m DCSM using remote sensing and GIS software (ENVI/IDL, Boulder, CO; ArcGIS, Redlands, CA, USA). We calculated all variables in ENVI, except mean curvature of terrain, which we calculated in ArcGIS. We used ArcGIS to calculate mean curvature from the second derivative of a fourth-order polynomial surface fit to a 3 × 3 kernel centered on each 1 m2 cell [21]. Negative values of the curvature index represent concave surfaces while positive values represent convex surfaces. Terrain curvature has also been referred to as convexity in the ecological literature. We used ENVI to quantify terrain slope from the first derivative of fourth-order polynomial fit to a 5 × 5 kernel centered on each 1 m2 cell. We used ENVI to quantify the remaining variables at each focal scale for each non-overlapping quadrat using standard methods: quartiles of the DCSM, difference in quartiles of the DCSM, mean of canopy height from the DCSM, standard deviation of canopy height from the DCSM, and mean elevation from the DEM.
We selected a subset of the variables that were correlated with species richness in bivariate analyses for at least one spatial scale. We selected mean of canopy height (MCH), standard deviation of canopy height (SDCH), mean elevation, mean slope, and mean curvature as predictor variables. We used data from the 1.0-ha scale for the main analysis. We tested these variables for approximate normality with the Shapiro-Wilk test for normality [22]. We found that slope was approximately lognormal, so we logarithmically transformed slope, which resulted in approximate normality. No other variables required transformation. At the 1.0-ha scale, the strongest correlation among this set of five predictor variables was between mean elevation and mean slope (r = −0.543, p < 0.01), the correlation between MCH and mean slope was statistically significant (r = 0.390, p < 0.01), as was the correlation between mean curvature and mean elevation (r = 0.298, p = 0.03), while all other cross-correlations between the predictor variables were insignificant (p > 0.05).

2.4. Data Analysis

We used generalized least squares (GLS) multiple regression [2325] to model species richness in relation to lidar-derived canopy height and topography variables. We fit the models using maximum likelihood estimation with the nlme package [26] in the R Statistical Computing Environment [27]. We conducted a series of preliminary analyses (Supplementary Material) before developing a predictive model of species richness that used only 1.0-ha scale data (Figure 3). We selected a model at 1.0-ha scale that minimized Akaike’s Information Criterion (AIC) [28] from an exhaustive model set with all combinations of the five predictor variables. We found no evidence for spatially autocorrelated residuals in the best model at 1.0-ha scale, indicating that a non-spatial model was sufficient for the main analysis. We implemented the model using GLS, but the non-spatial GLS model is equivalent to Ordinary Least Squares (OLS) [29,30]. We used leave-one-out cross validation [31] (Supplementary Materials S2) to assess how well the model predicted new data. From leave-one-out cross validation, we evaluated the predictive accuracy of the model in units of species with the mean error and the RMSE.

3. Results

The best model at 1.0-ha scale optimized by lowest AIC included the covariates mean and standard deviation of canopy height, mean elevation, and mean curvature (Table 1, Figure 2). Species richness was positively related to SDCH (β = 2.87 species m−1, SE = 1.10 species m−1, p=0.013), negatively related to MCH (β = −0.969 species m−1, SE = 0.377 species m−1, p=0.013), negatively related to mean elevation (β = −0.386 species m−1, SE = 0.159 species m−1, p=0.02), and negatively related to mean curvature (β = −31.7 species m, SE = 10.7 species m, p < 0.01).
The minimum AIC model (AIC = 353.2) described 47.9% of the total variation in species richness at 1.0-ha scale (R2 = 0.479). Using Moran’s I, we did not detect spatial autocorrelation in the residuals (Observed I = −0.005; Expected I = −0.020; SD = 0.0191; p = 0.42). The predictive accuracy of the model evaluated using leave-one-out cross-validation (Figure 3) yielded a mean error of 6.5 species and a RMSE of 8.3 species. The increase in cross-validated predictive accuracy was 19.0% relative to an intercept only model when measured in units of species.

4. Discussion

We found significant associations of species richness with lidar-derived variables describing canopy height and terrain structure. Based on our analyses, we found evidence for differences in species richness associated with canopy height and topography variables at all spatial scales (Supplementary Materials), but most prominently at the coarsest resolution in the analysis, 1.0-ha (Table 1). The minimum AIC model at the 1.0-ha scale included mean and standard deviation of canopy height, mean elevation, and mean curvature as covariates. This model described 47.9% of the total variation in species richness within the BCI 50-ha plot. Cross-validated predictive accuracy of the model was relatively low, with a 19.0% improvement in predicting the number of species compared to an intercept only model. To our knowledge, this is the first study to use lidar data to study both topography and canopy height in relation to variation in species richness in a tropical forest. These results highlight the potential of lidar-derived measures of forest structure and topography to capture environmental variation important to explaining local-level variation in plant species richness in tropical forests.
The present analysis does not explain why species richness correlates with lidar-derived variables; associations of species richness with canopy height and topography variables may result if the number of species in a sample increases with the number of individuals in a sample [32] and the number of individuals in a sample depends on biophysical processes related to the lidar-derived variables. At fine spatial scales we found that species richness is strongly dependent on the number of individuals in the sample, but this relationship rapidly weakens at coarser spatial scales. We evaluated how number of individuals changes with the lidar-derived variables from the minimum AIC model at the 1.0-ha scale. More individuals were present with decreasing MCH (β = −34.4 stems m−1, SE = 16.3 stems m−1, p = 0.04), but number of individuals was unrelated to SDCH (β = 22.3 stems m−1, SE = 47.6 stems m−1, p = 0.64), mean elevation (β = −0.104 stems m−1, SE = 6.9 stems m−1, p = 0.98), and mean curvature (β = −293.2 stems m, SE = 461.1 stems m, p = 0.52). Species richness was negatively related to MCH (β = −0.969 species m−1, SE = 0.377 species m−1, p = 0.013) and, as reported above, number of individuals was negatively related to MCH. Higher species richness occurs where MCH is lower and more individuals are present. Differences in species richness related to MCH may result from a species-individual relationship.
Associations of species richness with SDCH, mean elevation, and mean curvature do not appear to result from a species-individual relationship because of the absence of an association between number of individuals with SDCH, mean elevation, and mean curvature. Instead, these results may arise from sorting of species along environmental gradients related to biophysical processes that co-vary with canopy height and topography [15]. Specifically, sorting of species in relation to light, water, or nutrient gradients could potentially explain the observed patterns. Associations of species richness with SDCH may result from light gradients while associations of species richness with mean elevation and mean curvature potentially result from sorting of species in relation to water or nutrient gradients. The observation of higher species richness with higher SDCH (β = 2.87 species m−1, SE = 1.10 species m−1, p = 0.013) is consistent with higher species richness in a more heterogeneous light environment. It is also possible that SDCH quantifies structural variation that is caused by higher species richness. Heterospecific plants are well documented to differ in growth form, allowing for mapping of dominant species with structural data from lidar [33]. However, we think higher species richness causing higher SDCH is a less parsimonious explanation in this instance, because most of the plants in our analysis were subcanopy and we derived SDCH from a canopy surface model. With regard to terrain, the observation that species richness is negatively related to terrain curvature (β = −31.7 species m, SE = 10.7 species m, p < 0.01) is consistent with the hypothesis that species richness is higher in areas with wetter soil conditions. Negative curvature values represent concave surfaces that can pool water, such as the area in center of the plot with high species richness that has previously been mapped as a seasonal swamp [2]. The observation that species richness is negatively related to elevation (β = −0.386 species m−1, SE = 0.159 species m−1, p = 0.02) is consistent with higher species richness where water availability is greater because of higher dry season soil water availability at lower elevation [3,15] or other edaphic causes such as differences in species richness related to higher base cations in the lower elevation soils [3]. These results may therefore support the hypothesis that patterns of species richness on local-scale hydrological gradients parallel patterns of species richness on regional precipitation gradients. In general, these results are consistent with the hypothesis that not only differences in individual species distributions at local-scales in tropical forests but also differences in species richness in part resulting from variation in light, water, and nutrient availability.

5. Conclusions

Past studies have shown that most plant species at local scales in tropical forests are associated with local-scale structural variation in canopy height and topography. There has been relatively limited information about how community-level properties like species richness change with structural variation of canopy and terrain. We used airborne lidar and ground census data from a fully mapped 50-ha tree plot on Barro Colorado Island in Panama to evaluate the relationship of plant species richness to structural variation in canopy and terrain. We found that a significant fraction of observed variation in plant species richness is statistically explained by canopy and terrain structural variation. Based on this finding, we believe lidar may be used to increase the accuracy of predictive maps of species richness on tropical forest landscapes.
We found that slightly less than half (R2 = 0.479) of the variation in plant species richness at the 1.0-ha scale was statistically explained by a model that included mean and standard deviation of canopy height, mean elevation, and terrain curvature. Because of the underlying variation in biophysical processes related to canopy height and terrain, these findings may result from sorting of species along environmental gradients in light, water, and/or nutrient availability. Our findings are consistent with higher species richness where there is greater variation in light availability and where soil water availability is greater, with the possibility that nutrient availability also is involved.
To our knowledge, this is the first study to apply lidar to studying species richness in relation to both canopy height and terrain structural variation in a tropical forest. Further research is needed to evaluate the generality of these findings. If these results prove generally valid, then conservation organizations and governments could use this information to implement land management strategies to better preserve biodiversity. Future research should also focus on how plant species turnover occurs at local to landscape scales in relation to lidar-derived canopy height and terrain structure variables. A model using both species richness within local areas (α-diversity) and species turnover between local areas (β-diversity) conditioned on lidar-data may provide equivalent landscape scale diversity (γ-diversity) predictions to the currently used environment independent species-area relationships while providing more accurate spatial prediction for local hotspots and cold spots of diversity across the landscape and identification of what environmental variables may be important to maintenance of landscape scale diversity.

Supplementary Materials

remotesensing-04-04010-s001.pdf

Acknowledgments

We thank Brant Faircloth, Jim Dalling, Abigail Curtis, and three anonymous reviewers for constructive criticism on this paper. The lidar data collection was made possible with financial support from Smithsonian Tropical Research Institute and National Science Foundation (DEB-0939907) to Jim Dalling. The BCI forest dynamics research project was made possible by National Science Foundation grants to Stephen P. Hubbell: DEB-0640386, DEB-0425651, DEB-0346488, DEB-0129874, DEB-00753102, DEB-9909347, DEB-9615226, DEB-9615226, DEB-9405933, DEB-9221033, DEB-9100058, DEB-8906869, DEB-8605042, DEB-8206992, DEB-7922197, support from the Center for Tropical Forest Science, the Smithsonian Tropical Research Institute, the John D. and Catherine T. MacArthur Foundation, the Mellon Foundation, the Small World Institute Fund, and numerous private individuals, and through the hard work of over 100 people from 10 countries over the past two decades. The plot project is part the Center for Tropical Forest Science, a global network of large-scale demographic tree plots. Jeffrey Wolf was financially supported by fellowships from the Department of Ecology and Evolutionary Biology, UCLA while writing this paper and developed ideas for this paper while working on a project funded by a Scholarly Studies Grant from the Smithsonian Institution to Stephen P. Hubbell and Brant Faircloth. This research was also supported by a Graduate Distributed Seminar Series made possible by a National Science Foundation Dimensions of Biodiversity grant (1050680) to Sandy Andelman and Julia Parish.

References

  1. Hubbell, S.P.; Foster, R.B. The Spatial Context of Regeneration in a Neotropical Forest. In Colonization, Succession and Stability; Crawley, M., Gray, A., Edwards, P.J., Eds.; Blackwell: Oxford, UK, 1987; pp. 395–412. [Google Scholar]
  2. Harms, K.E.; Condit, R.; Hubbell, S.P.; Foster, R.B. Habitat associations of trees and shrubs in a 50-ha neotropical forest plot. J. Ecol 2001, 89, 947–959. [Google Scholar]
  3. John, R.; Dalling, J.W.; Harms, K.E.; Yavitt, J.B.; Stallard, R.F.; Mirabello, M.; Hubbell, S.P.; Valencia, R.; Navarrete, H.; Vallejo, M.; Foster, R.B. Soil nutrients influence spatial distributions of tropical tree species. Proc. Natl. Acad. Sci. USA 2007, 104, 864–869. [Google Scholar]
  4. Engelbrecht, B.M.J.; Comita, L.S.; Condit, R.; Kursar, T.A.; Tyree, M.T.; Turner, B.L.; Hubbell, S.P. Drought sensitivity shapes species distribution patterns in tropical forests. Nature 2007, 447, 80–82. [Google Scholar]
  5. Comita, L.S.; Engelbrecht, B.M.J. Seasonal and spatial variation in water availability drive habitat associations in a tropical forest. Ecology 2009, 90, 2755–2765. [Google Scholar]
  6. Asner, G.P.; Mascaro, J.; Muller-Landau, H.C.; Vieilledent, G.; Vaudry, R.; Rasamoelina, M.; Hall, J.S.; van Breugel, M. A universal airborne LiDAR approach for tropical forest carbon mapping. Oecologia 2012, 168, 1147–1160. [Google Scholar]
  7. Dubayah, R.O.; Drake, J.B. Lidar remote sensing for forestry. J. Forest 2000, 98, 44–46. [Google Scholar]
  8. Lefsky, M.A.; Cohen, W.B.; Harding, D.J.; Parker, G.G.; Acker, S.A.; Gower, S.T. Lidar remote sensing of above-ground biomass in three biomes. Global Ecol. Biogeogr 2002, 11, 393–399. [Google Scholar]
  9. Hubbell, S.P.; Foster, R.B.; O’Brien, S.T.; Harms, K.E.; Condit, R.; Wechsler, B.; Wright, S.J.; de Lao, S.L. Light-gap disturbances, recruitment limitation, and tree diversity in a neotropical forest. Science 1999, 283, 554–557. [Google Scholar]
  10. Condit, R. Tropical Forest Census Plots; Springer-Verlag and R. G. Landes Company: Berlin, Germany, 1998. [Google Scholar]
  11. Schnitzer, S.A.; Mascaro, J.; Carson, W.P. Treefall Gaps and the Maintenance of Species Diversity in Tropical Forests. In Tropical Forest Community Ecology; Carson, W.P., Schnitzer, S.A., Eds.; Blackwell Publishing: Oxford, UK, 2008; pp. 196–209. [Google Scholar]
  12. Dalling, J.W.; Schnitzer, S.A.; Baldeck, C.; Harms, K.E.; John, R.; Mangan, S.A.; Lobo, E.; Yavitt, J.B.; Hubbell, S.P. Resource-based habitat associations in a neotropical liana community. J. Ecol 2012, 100, 1174–1182. [Google Scholar]
  13. Schnitzer, S.A.; Carson, W.P. Treefall gaps and the maintenance of species diversity in a tropical forest. Ecology 2001, 82, 913–919. [Google Scholar]
  14. Becker, P.; Rabenold, P.E.; Idol, J.R.; Smith, A.P. Water potential gradients for gaps and slopes in a panamanian tropical moist forests dry season. J. Trop. Ecol 1988, 4, 173–184. [Google Scholar]
  15. Daws, M.I.; Mullins, C.E.; Burslem, D.F.R.P.; Paton, S.R.; Dalling, J.W. Topographic position affects the water regime in a semideciduous tropical forest in Panama. Plant Soil 2002, 238, 79–90. [Google Scholar]
  16. Gentry, A.H. Changes in plant community diversity and floristic composition on environmental and geographical gradients. Ann. Missouri Bot. Garden 1988, 75, 1–34. [Google Scholar]
  17. Pyke, C.R.; Condit, R.; Aguilar, S.; Lao, S. Floristic composition across a climatic gradient in a neotropical lowland forest. J. Veg. Sci 2001, 12, 553–566. [Google Scholar]
  18. Lindzen, R.S.; Choi, Y.S. On the observational determination of climate sensitivity and its implications. Asia Pacific J. Atmos. Sci 2011, 47, 377–390. [Google Scholar]
  19. Croat, T.B. Flora of Barro Colorado Island; Stanford University Press: Stanford, CA, USA, 1978. [Google Scholar]
  20. Baillae, I.; Elsenbeer, H.; Barthold, F.; Grimm, R.; Stallard, R. Semi-detailed soil survey of Barro Colorado Island, Panama. Available online: http://biogeodb.stri.si.edu/bioinformatics/bci_soil_map/ (accessed on 6 January 2012).
  21. Moore, I.D.; Grayson, R.B.; Landson, A.R. Digital terrain modelling: A review of hydrological, geomorphological, and biological applications. Hydrol. Process 1991, 5, 3–30. [Google Scholar]
  22. Royston, J.P. An extension of Shapiro and Wilk’s W test for normality to large samples. Appl. Statist 1982, 31, 115–124. [Google Scholar]
  23. Cressie, N. Statistics for Spatial Data; Wiley: New York, NY, USA, 1991. [Google Scholar]
  24. Beale, C.M.; Lennon, J.J.; Yearsley, J.M.; Brewer, M.J.; Elston, D.A. Regression analysis of spatial data. Ecol. Lett 2010, 13, 246–264. [Google Scholar]
  25. Pinheiro, J.; Bates, D. Mixed-Effects Models in S and S-PLUS; Springer: New York, NY, USA, 2009. [Google Scholar]
  26. Pinheiro, J.; Bates, D.; DebRoy, S.; Sarkar, D.; R Development Core Team. nlme: Linear and Non-linear Mixed Effects Models, R package version 3.1–103. 2012.
  27. R: A language and environment for statistical computing. Available online: http://www.R-project.org (accessed on 1 March 2012).
  28. Akaike, H. A new look at the statistical model identification. IEEE Trans. Automatic Control 1974, 19, 716–723. [Google Scholar]
  29. Baltagi, B.H. Econometrics, 5th ed.; Springer: New York, NY, USA, 2011. [Google Scholar]
  30. Draper, N.R.; Smith, H. Applied Regression Analysis, 3rd ed.; Wiley: New York, NY, USA, 1998. [Google Scholar]
  31. Arlot, S.; Celisse, A. A survey of cross-validation procedures for model selection. Statistics Surveys 2010, 4, 40–79. [Google Scholar]
  32. Condit, R.; Hubbell, S.P.; Lafrankie, J.V.; Sukumar, R.; Manokaran, N.; Foster, R.B.; Ashton, P.S. Species-area and species-individual relationships for tropical trees: A comparison of three 50-ha plots. J. Ecol 1996, 84, 549–562. [Google Scholar]
  33. Asner, G.P.; Hughes, R.F.; Vitousek, P.M.; Knapp, D.E.; Kennedy-Bowdoin, T.; Boardman, J.; Martin, R.E.; Eastwood, M.; Green, R.O. Invasive plants transform the three-dimensional structure of rain forests. Proc. Natl. Acad. Sci. USA 2008, 105, 4519–4523. [Google Scholar]
Figure 1. Geographic location of study area: (Left) Canal Zone with Barro Colorado Island (inset and red square). (Right) 50-ha Forest Dynamics Plot on Barro Colorado Island with (Upper) maximum canopy height (m) from lidar digital canopy surface model and (Lower) elevation (m) from lidar digital elevation model with 1.0-ha grid.
Remotesensing 04 04010f1
Figure 2. Maps of (a) observed species richness, (b) predicted species richness from 1.0-ha minimum Akaike’s Information Criterion (AIC) model, (c) mean canopy height (m); (d) standard deviation of maximum canopy height (m); (e) mean elevation (m); and (f) mean curvature (m−1). Figures are shaded by quartiles, except predicted species richness, which is shaded by quartiles of the observed species richness distribution.
Remotesensing 04 04010f2
Figure 3. Leave-one-out cross-validated prediction errors of species richness model with mean of canopy height (MCH), standard deviation of canopy height (SDCH), mean elevation, and mean curvature covariates at 1.0-ha scale in the BCI 50-ha FDP. The diagonal line represents a 1:1 relationship.
Remotesensing 04 04010f3
Table 1. Non-spatial generalized least squares (GLS) model of species richness at 1.0-ha scale with lidar-derived canopy height and topography covariates. The table includes coefficient estimates, standard errors (SE), and boundaries of the 95% Confidence Intervals for each parameter. This model was parameterized with field and lidar data from the Barro Colorado Island (BCI) 50-ha forest dynamics plot (FDP).
ParameterEstimateSE95 % CI
UpperLower
Standard Deviation Canopy Height (SDCH)2.871.105.030.70
Mean Canopy Height (MCH)−0.970.38−0.23−1.71
Mean Elevation−0.390.16−0.07−0.70
Mean Curvature−31.710.7−10.7−52.6
Intercept229.330.4288.7169.8

