Next Article in Journal
Accuracy Enhancement of ASTER Global Digital Elevation Models Using ICESat Data
Next Article in Special Issue
Urban Sprawl Analysis and Modeling in Asmara, Eritrea
Previous Article in Journal
Portable and Airborne Small Footprint LiDAR: Forest Canopy Structure Estimation of Fire Managed Plots
Previous Article in Special Issue
Use of Remote Sensing to Support Forest and Wetlands Policies in the USA
 
 
Correction published on 15 August 2012, see Remote Sens. 2012, 4(8), 2455-2456.
Article

Towards Detecting Swath Events in TerraSAR-X Time Series to Establish NATURA 2000 Grassland Habitat Swath Management as Monitoring Parameter

1
Department of Geoinformation for Environmental Planning, Technische Universität Berlin, Straße des 17. Juni 145, 10623 Berlin, Germany
2
Institute of Photogrammetry and GeoInformation, Leibniz Universität Hannover, Nienburger Str. 1, 30167 Hannover, Germany
3
Luftbild Umwelt Planung GmbH Potsdam, Große Weinmeisterstraße 3a, 14469 Potsdam, Germany
*
Author to whom correspondence should be addressed.
Remote Sens. 2011, 3(7), 1308-1322; https://doi.org/10.3390/rs3071308
Submission received: 13 April 2011 / Revised: 21 June 2011 / Accepted: 22 June 2011 / Published: 29 June 2011
(This article belongs to the Special Issue Remote Sensing in Support of Environmental Policy)

Abstract

:
Spatial monitoring tools are necessary to respond to the threat of global biodiversity loss. At the European scale, remote sensing tools for NATURA 2000 habitat monitoring have been requested by the European Commission to fulfill the obligations of the EU Habitats Directive. This paper introduces a method by which swath events in semi-natural grasslands can be detected from multi-temporal TerraSAR-X data. The investigated study sites represent rare and endangered habitats (NATURA 2000 codes 6410, 6510), located in the Döberitzer Heide nature conservation area west of Berlin. We analyzed a time series of 11 stripmap images (HH-polarization) covering the vegetation period affected by swath (June to September 2010) at a constant 11-day acquisition rate. A swath detection rule was established to extract the swath events for the NATURA 2000 habitats as well as for six contrasting pasture sites not affected by swath. All swath events observed in the field were correctly allocated. The results indicate the potential to allocate semi-natural grassland swath events to 11-day-periods using TerraSAR-X time series. Since the conservation of semi-natural grassland habitats requires compliance with specific swath management rules, the detection of swath events may thus provide new parameters for the monitoring of NATURA 2000 grassland habitats.

Graphical Abstract

1. Introduction

Biodiversity loss is a major challenge for environmental policies in the 21st century [1]. Facing this threat, the European Commission introduced the EU Habitats Directive (EU Council Directive 92/43/EEC) and the NATURA 2000 network to establish an environmental policy focused on biodiversity monitoring [2]. To fulfill the obligations of the EU Habitats Directive, the European Commission explicitly requests remote sensing tools as part of the NATURA 2000 habitat monitoring and the related surveillance scheme to be established by 2013 and demands reporting on the ‘conservation status’ of the habitats on a six-year basis [3]. So far, several remote sensing studies have tackled NATURA 2000 monitoring concerns [4,5]; however, overall progress has been limited [3,6]. In October 2010, European scientists and policy stakeholders from the Commission’s Directorate-General for the Environment convened for the HABISTAT conference to discuss the respective advancements achieved. Operationally available methods have been successfully developed for the monitoring of European dry heaths only [5] and urgently need to be extended to further habitats [6,7].
For this purpose, the project CARE-X—Change Detection Analysis for the Monitoring of NATURA 2000 Habitats using Rapid Eye and TerraSAR-X Data—aims at developing methods for the classification of NATURA 2000 semi-natural grassland habitats. It focuses on the exploitation of the phenological differentiability of habitats via synergistic analysis of high temporal resolution optical and radar satellite systems. High data acquisition frequency is not only necessary to characterize vegetation according to its phenology, but also to derive seasonal human management impacts. As the conservation of semi-natural grassland habitats requires compliance with specific swath management rules, the characteristic swath regime as a distinctive indicator comes into play. The ability to observe swath events for grassland areas might lead to an additional, important, quantifiable factor for the classification of habitat probability maps as preferred target product by environmental agencies [8]. The requirements for such a system to work are: (a) a capability to record vegetation change induced by swath; and (b) high acquisition frequency to narrow down the time window of such events.
In this context, the TerraSAR-X system appears particularly suitable for habitat characterization. While the RapidEye system constellation already delivers comparatively high frequency coverage, the TerraSAR-X system provides much steadier acquisition frequency due to its independence from clouds with a repeat cycle of 11 days [9,10,11]. The high spatial ground resolution (~3 m in stripmap mode) and the smallest possible radar wave (X-Band ~ 3 cm) of this satellite sensor theoretically allows for the observation of relatively fine plant structures and related dynamics. The study of Le Toan et al. [12] already demonstrated the potential of X-band radar for vegetation identification based on an airborne SAR campaign in 1989. Indeed, since the TerraSAR-X system provides space-borne high frequency X-band images in continuous operation for the first time, several recent studies show its capability to observe small-scale vegetation changes for the classification of agricultural areas [10,11,13]. Baghdadi et al. [11] explored the sensitivity of the radar signal at different polarizations and angles to sugar cane heights and its potential to detect sugarcane harvest dates. Bargiel et al. [14] indicated that the radar backscatter reflects swath events on agricultural meadows using TerraSAR-X spotlight data. So far, however, no studies exist on the detection of swath events in semi-natural grassland areas, in particular in the specific context of endangered NATURA 2000 habitats. The novel challenge in this application lies: (a) in the very dense and fine, diverse and relatively low vegetation structure compared to agricultural areas; and (b) in the small area coverage and the very rare occurrence of such grasslands, while operational monitoring activities require the cost-efficient scene coverage of larger areas (i.e., by using TerraSAR-X strip map mode instead of the higher resolution spot light mode). Furthermore, eventual animal grazing as additional human-induced impact might complicate swath detection. Consequently, the key research question we seek to answer here is: Is it possible to detect swath events in NATURA 2000 grassland habitats by using TerraSAR-X strip map time series in order to derive the habitat-specific swath management?

2. Methodology

2.1. Research Area, NATURA 2000 Sites and Management Rules
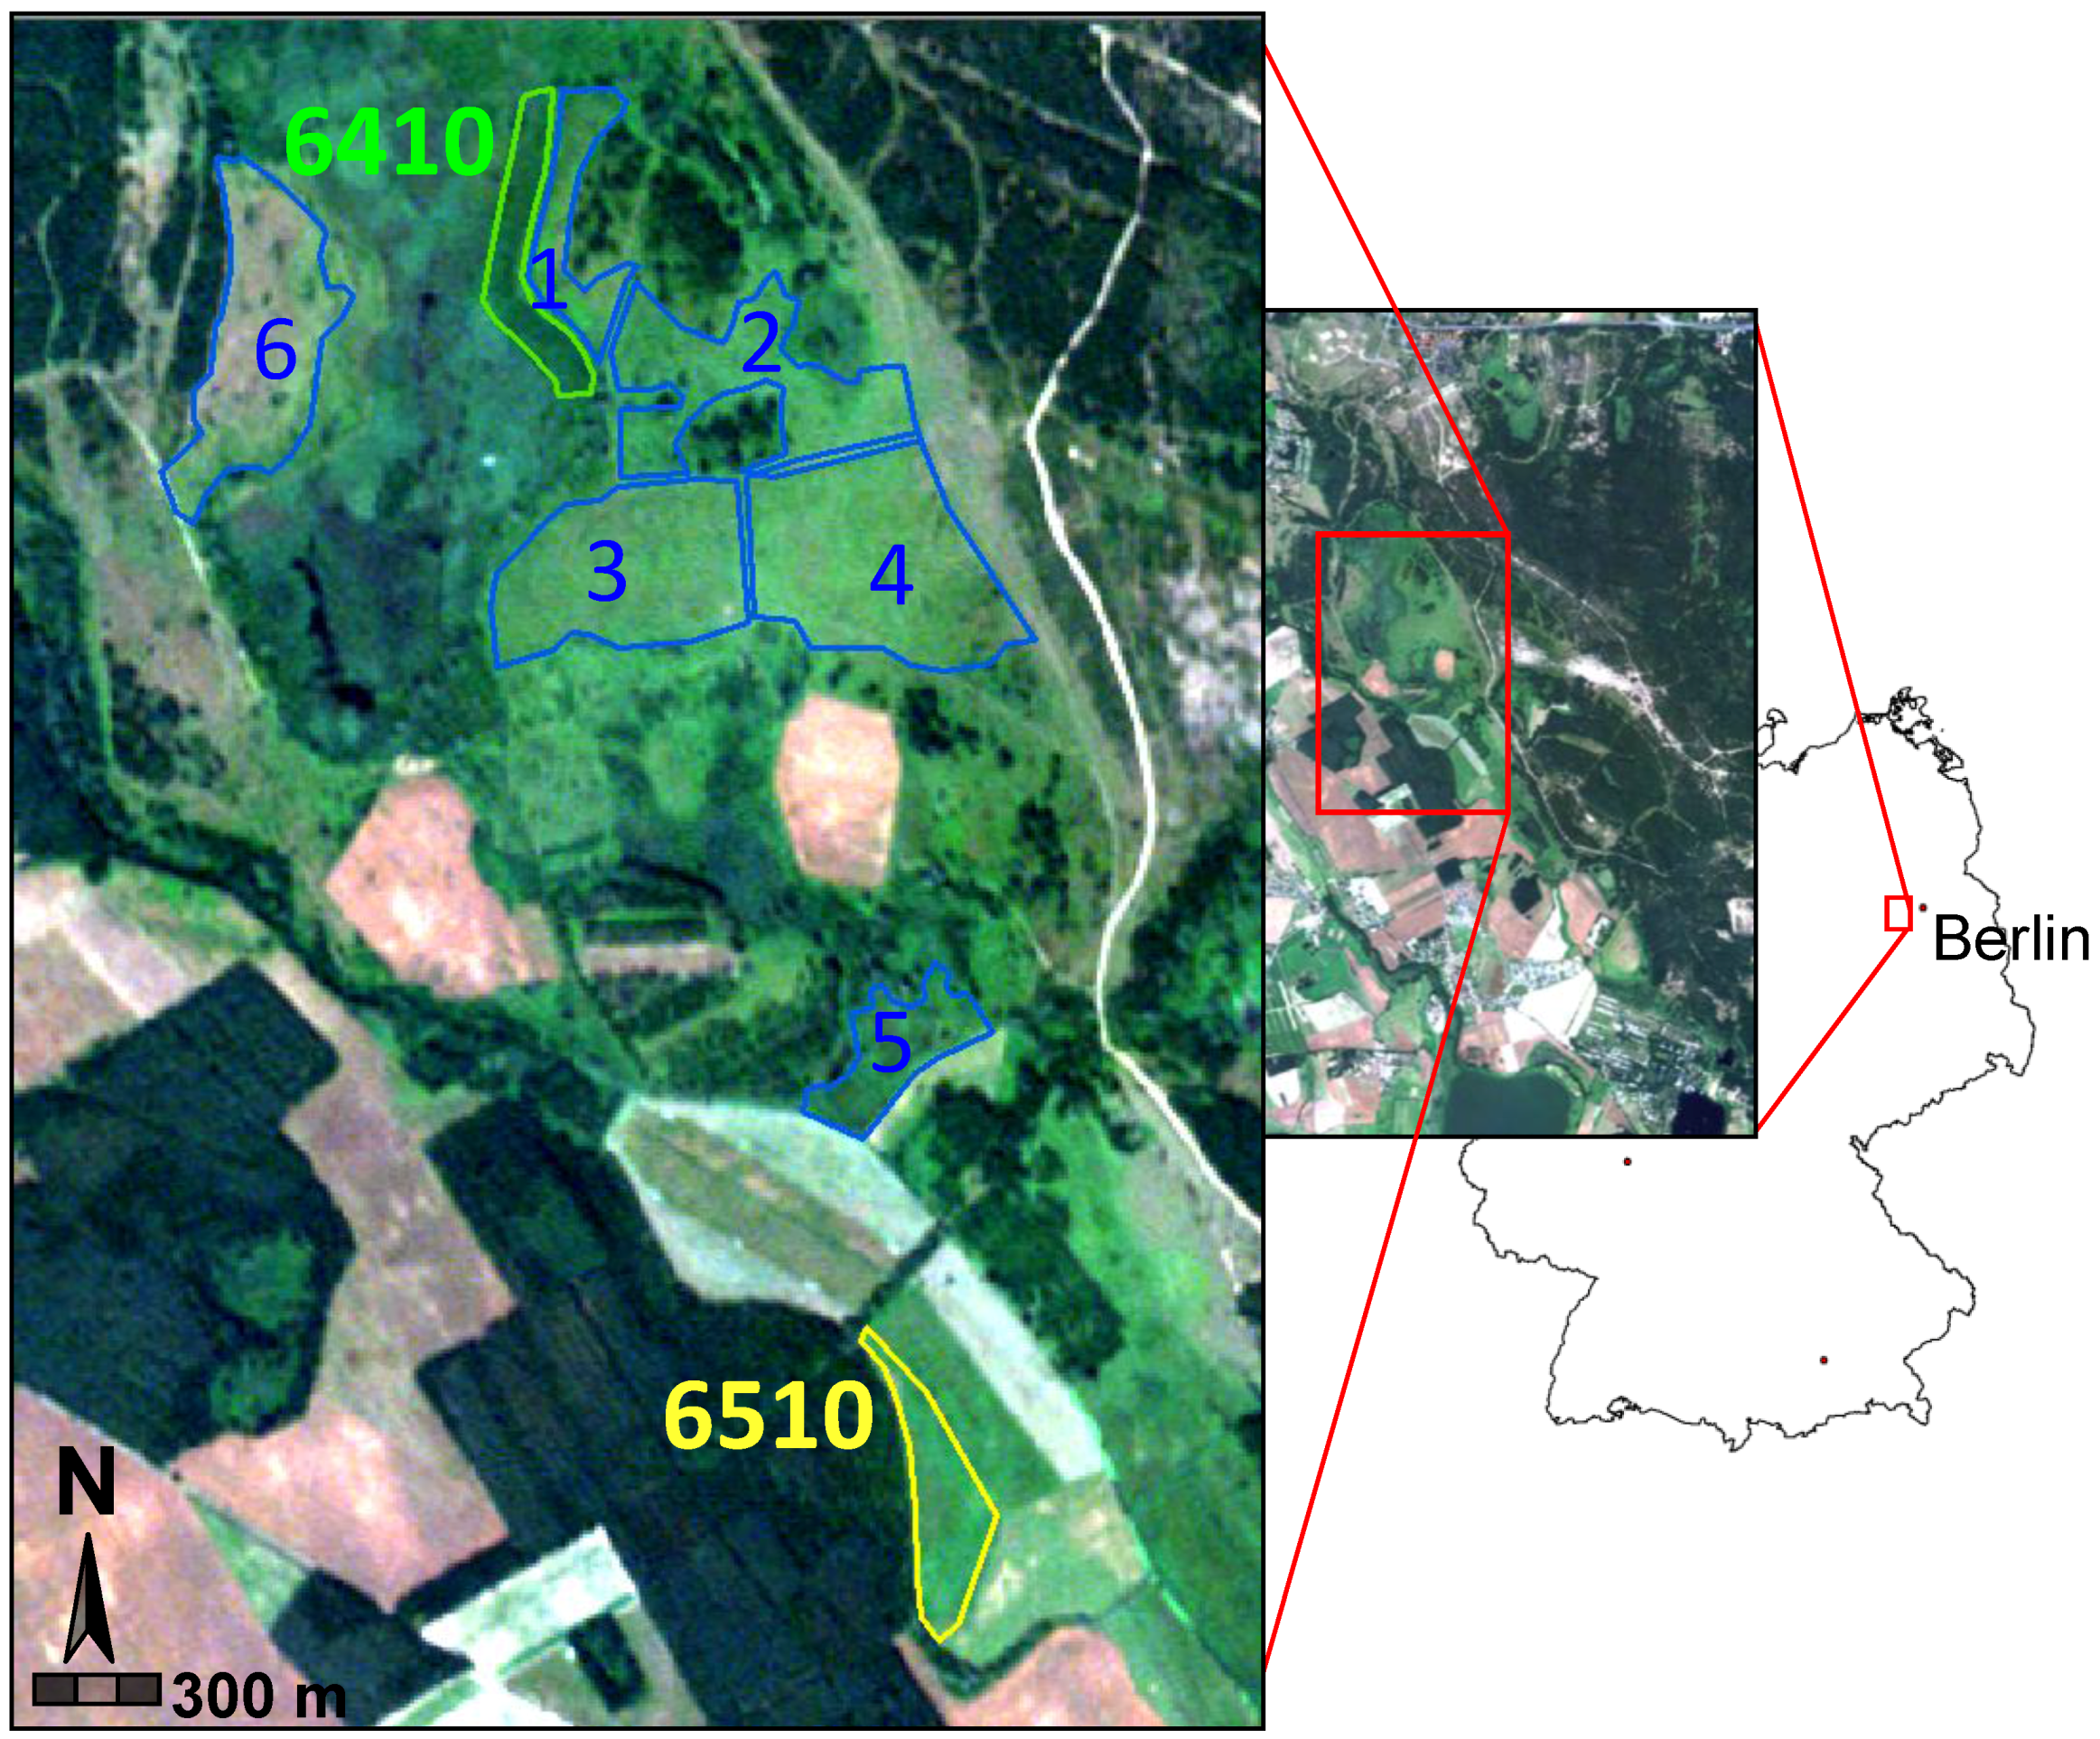
The research area Döberitzer Heide is a protected nature reserve west of Berlin. It is one of the former military areas of north-eastern Germany that have been converted to protected nature reserves with large open landscape sections. Today, the nature reserve Döberitzer Heide consists of a rich semi-natural landscape mosaic. Stretching over 60 km2 from 52.54°N/12.98°E (UL) to 52.46°N/13.10°E (LR), it includes wood, dry sandy heaths, semi-natural grasslands, humid meadows and wetlands in flat terrain, some of which are not accessible due to remnants of military munitions. In particular, the semi-natural grassland and humid meadows section comprises some species-rich and highly endangered NATURA 2000 habitats.
Two semi-natural grassland habitats of strong interest for nature conservation are present in the research area: Molinia meadows on calcareous, peaty or clayey-silt-laden soils (Eu-Molinion) (NATURA 2000 code: 6410) and species-rich extensively managed hay meadows (NATURA 2000 Code: 6510). According to the NATURA 2000 nomenclature, they are categorized as semi-natural grassland formations, more specifically as semi-natural tall-herb humid meadows. The occurrence of both habitats is very limited, they are categorized as “strongly endangered” (6510) or “endangered of complete extension” (6410) respectively [15].
Since these habitats underlie a distinct swath or mowing regime in consideration of the specific biological development cycles of the respective plant associations, they represent suitable sites for the investigation in this study. Molinia meadows have mostly evolved under extensive management and late mowing regimes and are very sensitive to changes in the latter. They are impaired by the omission of swath as well as by too early or repeated swath per year. For species-rich extensively managed hay meadows the first hay cut must not be taken prior to the main flowering period of the grasses in mid-June and the number of cuts should not be more than the traditional two per year [15]. Several pastures without swath impact, situated around the meadow sites, serve as contrasting sites for the investigation (Figure 1). Area sizes range from 5 to 10 ha.
Figure 1. The study sites in the semi-natural grassland section of the research area (RapidEye image from 27 July 2009): Molinea meadow (6410) in green, extensively managed hay meadow (6510) in yellow and pasture in blue.
Remotesensing 03 01308 g001

2.2. SAR Data and Pre-Processing

A TerraSAR-X time series from March to November 2010 represents the primary database for the analysis. Only those 11 scenes were employed that cover the main meadow swath season from June to September at a constant 11-day period, the highest achievable acquisition rate. Dates of acquisition [d.m.] were 02.06, 13.06, 24.06, 05.07, 16.07, 27.07, 07.08, 18.08, 29.08, 09.09 and 20.09 (in 2010). The scenes were recorded in strip map imaging mode and delivered as ground range products (EEC) with equidistant pixel spacing in azimuth and ground range direction in level 1B. The resolution is 3 m in ground range and 3.3 m in azimuth direction. The swath widths of the scenes are 32 km in ground range and 54 km in azimuth [9]. To receive the highest frequency possible, the data is ordered in HH-single-polarization mode. All scenes were acquired at 5:33 am in the same satellite track (orbit 78) with a constant incidence angle of 27.9°. After co-registration Enhanced-Lee-filtering was applied on the time series. To complement the need for very high geometric precision, the data was ordered in high orbit precision. RapidEye and Quickbird data were used to achieve accurate geo-reference products. Radiometric calibration was carried out to transform the amplitude of the backscatter signal into the backscattering coefficient Sigma Naught (σ0) using the following equation provided by INFOTERRA [16]:
σ 0 [ d B ] = 10 log 10 ( CalFact DN 2 ) + 10 log 10 ( sin θ loc )
where:
  • σ0[dB] = calibrated pixel value in decibel
  • CalFact = calibration and processor scaling factor
  • DN = pixel intensity value
  • θloc = local incident angle (radar beam and the normal to reflecting surface).
Temporal signature profiles were created from σ0 mean values within the reference areas. We performed this analysis on areas, rather than on single pixels because speckle noise effects lead to high standard deviations.

2.3. Ground Truth Data

For ground truthing, the official digital biotope map for the state of Brandenburg from 2004 with scale ratio 1:10,000 was employed in combination with the field data collected during the intensive spectrometry measurements and vegetation mapping campaign as part of the project. Thus, the reference data collection on the selected sites took place on a frequent and regular basis throughout the entire vegetation season from 2009 to 2010. Among others, the collected parameters comprise the composition of vegetation associations, the phenological status, swath and eventual grazing events. The observations in the field were supplemented by questionnaires to the different area stakeholders, nature reserve managers and organic farmers, to collect detailed information on the swath and hay management as well as on the movement of eventual grazing cattle. The cutting is generally done within several hours of a single day; hay removal follows about one week later. However, this schedule may be expanded due to rainfall or logistic disturbances. According to the stakeholders’ internal documentation, swath events could be narrowed down to time ranges of between two (6510) and seven days (6410).

2.4. Swath Detection Rule

The detection of habitat-specific swath events is based on the analysis of the temporal signature profiles. Therefore, distinctive backscatter peaks must be detected within the backscatter profiles based on an inductively derived rule. Bargiel et al. [14] observed strong increases of the backscatter value after swath events for agricultural meadows, followed by distinct decreases. However, due to a limited time series, the behavior during the following weeks could not be observed. As the vegetation in semi-natural grassland areas is very dense and heterogeneous in contrast to agricultural fields or meadows, the signal is expected to grow rather quickly during the weeks following such swath events. To avoid inclusion of minor changes due to effects from grazing and withering, the signal increase should be greater than roughly 10% and the decrease at least around 5% compared to the average percent deviation increase or decrease for the respective temporal backscatter profile.
Consequently, the proposed rule for the detection of swath events consists of two axioms (A1 and A2) that need to be satisfied. For the signal backscatter (σ°) at a specific acquisition order number (k) of the acquired scene in the time series (N), the positive or negative signal changes in percent deviation for the first (D1) and second (D2) acquisition after a potential swath event are considered as:
D 1 = ( σ 0 ( k ) σ 0 ( k 1 ) ) / ( σ 0 ( k ) × 100 ) D 2 = ( σ 0 ( k + 1 ) σ 0 ( k ) ) / ( σ 0 ( k ) × 100 )
The first axiom addresses the necessity of both a signal rise at the first (D1) and a signal decrease at the second (D2) acquisition after the swath event (the first and last date of the time series are excluded):
σ 0 ( k ) σ 0 ( k 1 ) 0 , 1 < k < N A N D σ 0 ( k + 1 ) σ 0 ( k ) 0 , 1 < k < N
The second axiom focuses on the absolute magnitude of signal change:
| D 1 | i = 1 N | σ 0 ( i 1 ) σ 0 ( i ) | N / ( σ 0 ( i ) × 100 ) , w h e r e i , D 1 10 % A N D | D 2 | i = 1 N | σ 0 ( i 1 ) σ 0 ( i ) | N / ( σ 0 ( i ) × 100 ) , w h e r e i , D 2 5 %
If (A1) and (A2) are satisfied then:
σ 0 ( k ) s w a t h
Because the short wavelength of the TerraSAR-X signal is not as independent of weather conditions as the C- or L-band data, the temporal profiles were checked for correlations with local meteorological data at three hour resolution. In particular, we examined the possible interference of precipitation, humidity and wind on swath detection.

2.5. Evaluation

The resulting swath events for the observed habitat areas are evaluated by comparison to the ground truth data. Thus, it is possible to test whether the three swath events observed in the field can be successfully allocated to the respective site and acquisition date from the 88 analyzed cases (11 dates and 8 test sites). In particular, the combination of photos and the description of the vegetation conditions and the questionnaires to the area stakeholders proved to be of high value for achieving a reliable reference. Finally, the results were compared to the respective habitat-specific swath rules as required for the habitat-specific management to conserve the endangered NATURA 2000 habitats [15].

3. Results and Discussion

3.1. Temporal Backscatter Profiles
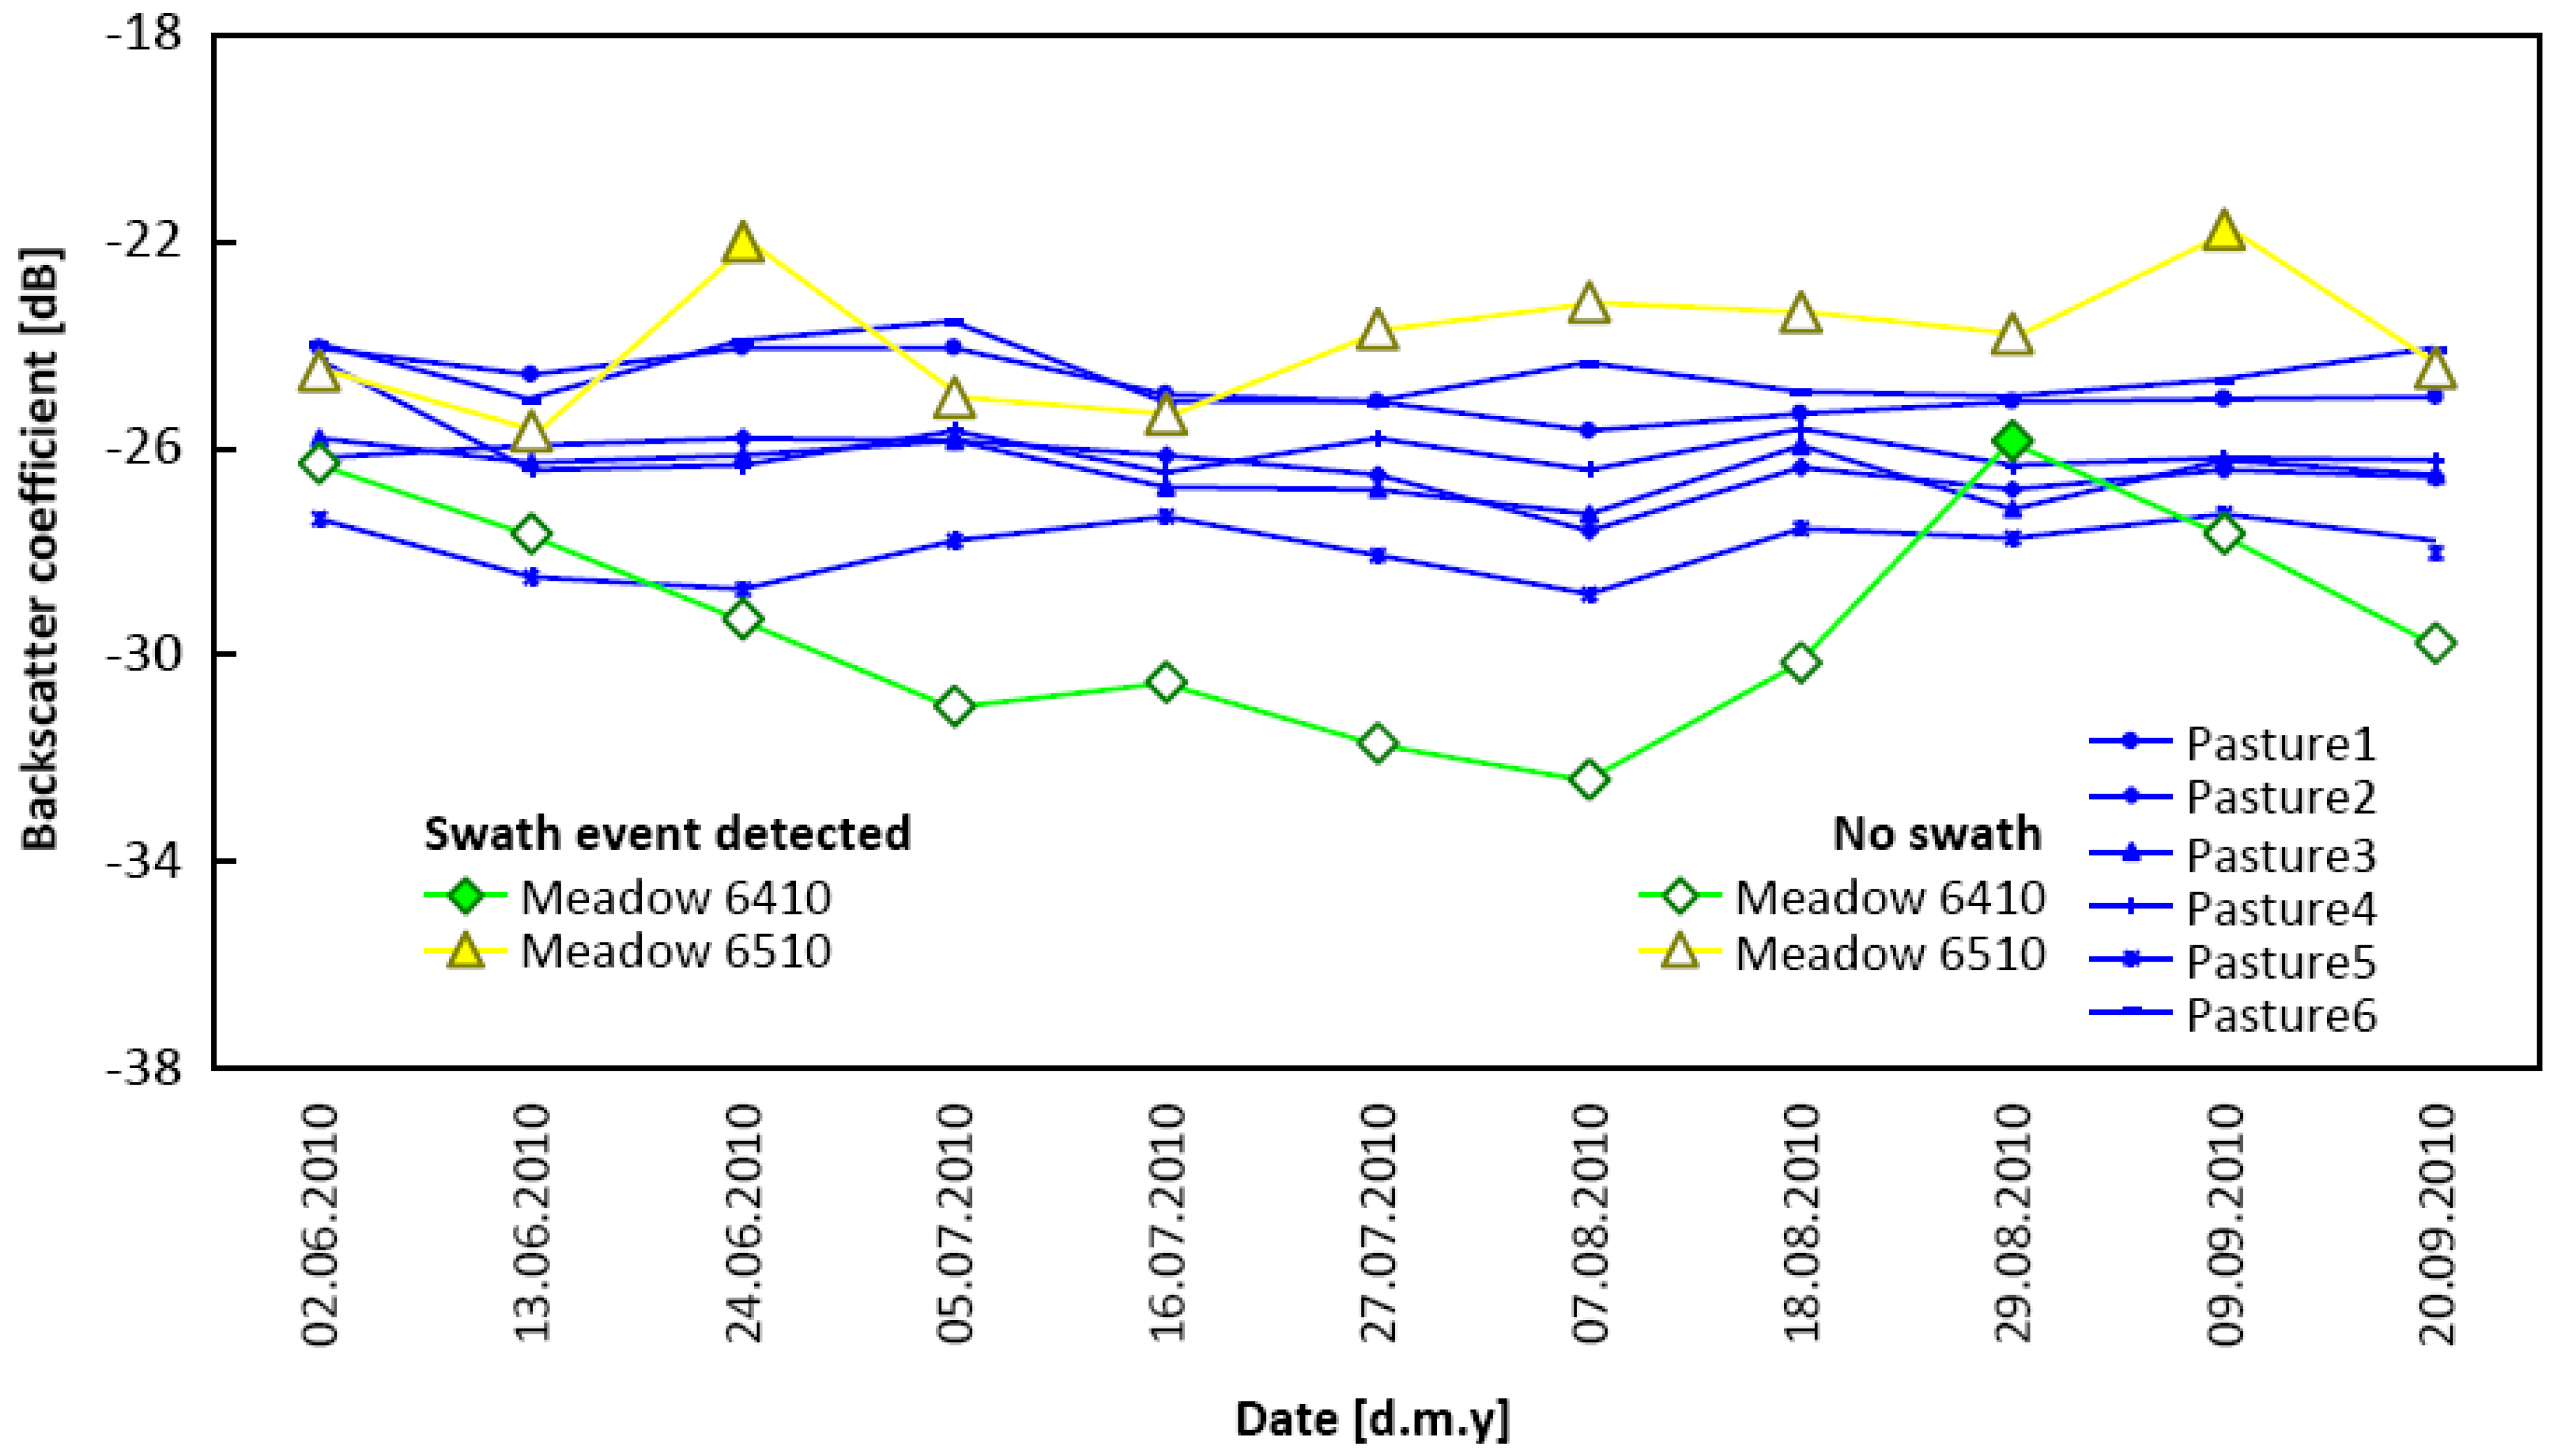
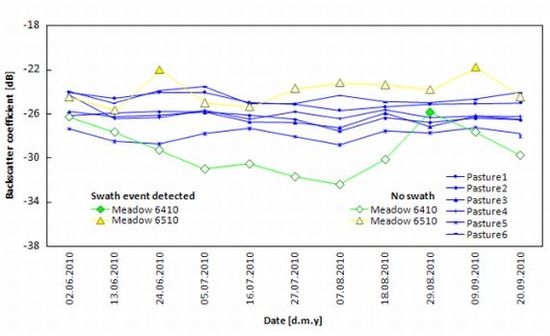
The temporal backscatter profiles for the mean backscatter coefficient (σ°) serve as a primary basis for the swath detection analysis (Figure 2). General observations are that: (a) the investigated sites return profiles that show different temporal patterns; (b) the change in temporal increase or decrease is stronger for the meadows 6410 and 6510 as compared to the different pasture sites; (c) distinct oscillations are observed as upward peaks (increase followed by decrease) only, no abruptdecrease-increase movement is returned (compare 6410, 6510); and (d) the Molinia meadow (6410) backscatter is generally lower than in other areas, in particular during the late phenological growth phase of the respective plant associations that appears to reduce the backscatter signal. With respect to meteorological covariates, no direct correlations were found that could interfere with the detection of swath events.
Figure 2. Temporal profiles of the mean backscatter coefficient (σ°) and detected swath events (highlighted) for the investigated NATURA 2000 grassland sites as well as different pasture sites. Respective standard deviations and sample sizes within the training fields are 7.9 dB and 2982 pixels (Meadow 6410), 13.7 dB and 3199 pixels (Meadow 6510), 4.8 dB and 2487 pixels (Pasture 1), 5.5 dB and 70,000 (P2), 5.6 dB and 118,000 (P3), 5.1 dB and 111,000 (P4), 6.3 dB and 12,000 (P5) and 8.1 dB and 76,500 pixels (P6).
Remotesensing 03 01308 g002

3.2. Swath Detection

As observed in the backscatter profiles, the differentiability of results (a) and the observed changes (b, c) already indicate that the profiles for 6410 and 6510 could be affected by the swath events known from the ground truth data, whereas the signal appears rather stable for the pasture site which is not affected by swath. The employed swath detection rule returns three swath events out of 88 potential cases (11 dates for eight sites) investigated; one swath event for 6410 and two for 6510, whereas for the pasture sites no swath event was detected as the detection rule could not be satisfied (Table 1). These results match the ground truth data for each site and date.
Table 1. Results for the detection of swath event induced peaks based on the proposed detection rule (satisfaction of A1 and A2) in comparison to swath events known from ground truth. One event is returned for Meadow 6410 (highlighted in green) and two for Meadow 6510 (highlighted in yellow). None is detected for the pasture sites.
Date of acquisition [d.m.y]σ° (M 6410) [dB]D1 [%]D2 [%]Satisfaction of swath rule (A1 and A2)Swath event (ground truth) Date of acquisition [d.m.y]σ° (M 6510) [dB]D1 [%]D2 [%]Satisfaction of swath rule (A1 and A2)Swath event (ground truth)
02.06.10−26.29 −4.8 02.06.10−24.49 −4.6
13.06.10−27.62−4.8−5.6 13.06.10−25.66−4.616.7
24.06.10−29.28−5.6−5.6 24.06.10−21.9916.712.0xx
05.07.10−31.00−5.61.6 05.07.10−25.00−12.0−1.4
16.07.10−30.521.6−3.7 16.07.10−25.35−1.46.9
27.07.10−31.70−3.7−2.1 27.07.10−23.726.92.3
07.08.10−32.38−2.17.4 07.08.10−23.182.3−0.9
18.08.10−30.147.416.6 18.08.10−23.38−0.9−1.8
29.08.10−25.8516.66.5xx 29.08.10−23.80−1.89.3
09.09.10−27.64−6.5−7.1 09.09.10−21.789.310.9xx
20.09.10−29.76−7.1 20.09.10−24.45−10.9
Mean of absolute D5.71 Mean of absolute D6.74
Date of acquis. [d.m.y]σ° (P 1) [dB]D1 [%]D2 [%]Satisfaction (A1 and A2)Swath (GT) σ° (P 2) [dB]D1 [%]D2 [%]Satisfaction (A1 and A2)Swath (GT) σ° (P 3) [dB]D1 [%]D2 [%]Satisfaction (A1 and A2)Swath (GT)
02.06.10−24.08 −2.0 −26.20 0.9 −25.82 −1.8
13.06.10−24.57−2.02.0 −25.960.90.6 −26.29−1.80.5
24.06.10−24.092.00.2 −25.820.6−0.1 −26.150.51.2
05.07.10−24.060.2−3.6 −25.84−0.1−1.2 −25.841.2−3.4
16.07.10−24.95−3.6−0.6 −26.15−1.2−1.4 −26.76−3.4−0.1
27.07.10−25.11−0.6−2.2 −26.52−1.4−3.9 −26.78−0.1−1.8
07.08.10−25.67−2.21.2 −27.59−3.94.6 −27.27−1.85.0
18.08.10−25.351.20.9 −26.374.6−1.6 −25.975.0−4.4
29.08.10−25.130.90.3 −26.81−1.61.6 −27.16−4.43.6
09.09.10−25.050.30.2 −26.401.6−0.5 −26.233.6−1.0
20.09.10−25.000.2 −26.54−0.5 −26.51−1.0
Mean of abs. D1.39 1.62 2.26
Date of acquis. [d.m.y]σ° (P 4) [dB]D1 [%]D2 [%]Satisfaction (A1 and A2)Swath (GT)σ° (P 5) [dB]D1 [%]D2 [%]Satisfaction (A1 and A2)Swath (GT)σ° (P 6) [dB]D1 [%]D2 [%]Satisfaction (A1 and A2)Swath (GT)
02.06.10−24.32 −8.0 −27.36 −3.9 −23.80 −4.3
13.06.10−26.44−8.00.3 −28.47−3.9−0.9 −24.86−4.34.7
24.06.10−26.350.32.7 −28.73−0.93.4 −23.744.71.5
05.07.10−25.662.7−3.1 −27.773.41.7 −23.391.5−6.1
16.07.10−26.47−3.12.5 −27.321.7−2.7 −24.90−6.10.0
27.07.10−25.822.5−2.3 −28.07−2.7−2.7 −24.900.03.0
07.08.10−26.41−2.33.1 −28.85−2.74.7 −24.193.0−2.2
18.08.10−25.623.1−2.7 −27.544.7−0.8 −24.73−2.2−0.4
29.08.10−26.33−2.70.6 −27.76−0.81.8 −24.84−0.41.4
09.09.10−26.180.6−0.1 −27.271.8−1.9 −24.491.42.5
20.09.10−26.21−0.1 −27.80−1.9 −23.892.5
Mean of abs. D 2.65 2.42 2.61
Furthermore, all three swath events observed in the field were correctly allocated to the respective 11-day period of the investigated 88 cases; none of the cases were falsely classified. The period begins with the date of the respective previous satellite acquisition and lasts until the day before the acquisition date of swath detection, as no swath activity is expected before the acquisition time at 5 o’clock in the morning. For example, the swath event for Molinia (6410) was detected in the satellite scene acquired on 29 August (Table 2). Thus, the respective swath event must have taken place between 18 and 28 August. As the event could not be traced back to a single day based on the ground truthing data, including the statements of the area stakeholders, the given time periods were compared to decide if the results match the time frame of the actual swath event in the field. For habitat 6410 it covers seven days, for 6510 it could be narrowed down to two days.
Table 2. Comparison of the potential swath event periods derived from TerraSAR-X or ground truth data respectively. Based on the period match, all three detected swath events are confirmed.
Test sitePotential swath event period (Period) Match
TerraSAR-X detectedGround truth
Meadow 641018.08–28.08.201026.08–01.09.201026.08–28.08.2010
Meadow 651013.06–23.06.201017.06–18.06.201017.06–18.06.2010
29.08–08.09.201002.09–03.09.201002.09–03.09.2010
Pasture 1no swathno swathyes
Pasture 2no swathno swathyes
Pasture 3no swathno swathyes
Pasture 4no swathno swathyes
Pasture 5no swathno swathyes
Pasture 6no swathno swathyes
Due to the low statistical probability of proper swath detection, the method of swath detection appears quite powerful, in particular when the very similar vegetation composition of the extensively managed hay meadow (6510) and the pastures are considered. The information content of the TerraSAR-X time series in combination with the proposed swath detection rule can be regarded as a sufficiently sensitive and accurate method for detecting swath events in the investigated semi-natural grassland sites.
Swath events are characterized as distinct upward peaks in the radar signal backscatter, in agreement with the observation made for the temporal profiles that distinct oscillations are observed as upward peaks only (c). This observation stands in contrast to the observations made for rice and sugar cane [10,11], where the date of harvest corresponds with a strong backscatter decline. It confirms the observations made by Damian et al. [14], who found that harvest dates lead to an abrupt decline for broad-leaved crops, while the cut of fine-leaved agricultural crops and meadows induces an abrupt signal rise in HH-polarized TerraSAR-X backscatter. The sites investigated in this study all comprise very fine-leaved vegetation, leading to a backscatter diffusion of the radar signal. Thus, a swath event results in an abrupt decrease of surface roughness. This assumption is further supported by the temporal profile received for Molinia meadow (6410) (d). The main phenological growth phase for Molinia [15] starts late in June and develops thin and robust stems that by far exceed the plant associations of the other sites, resulting in a consecutive backscatter decrease (Figure 2).
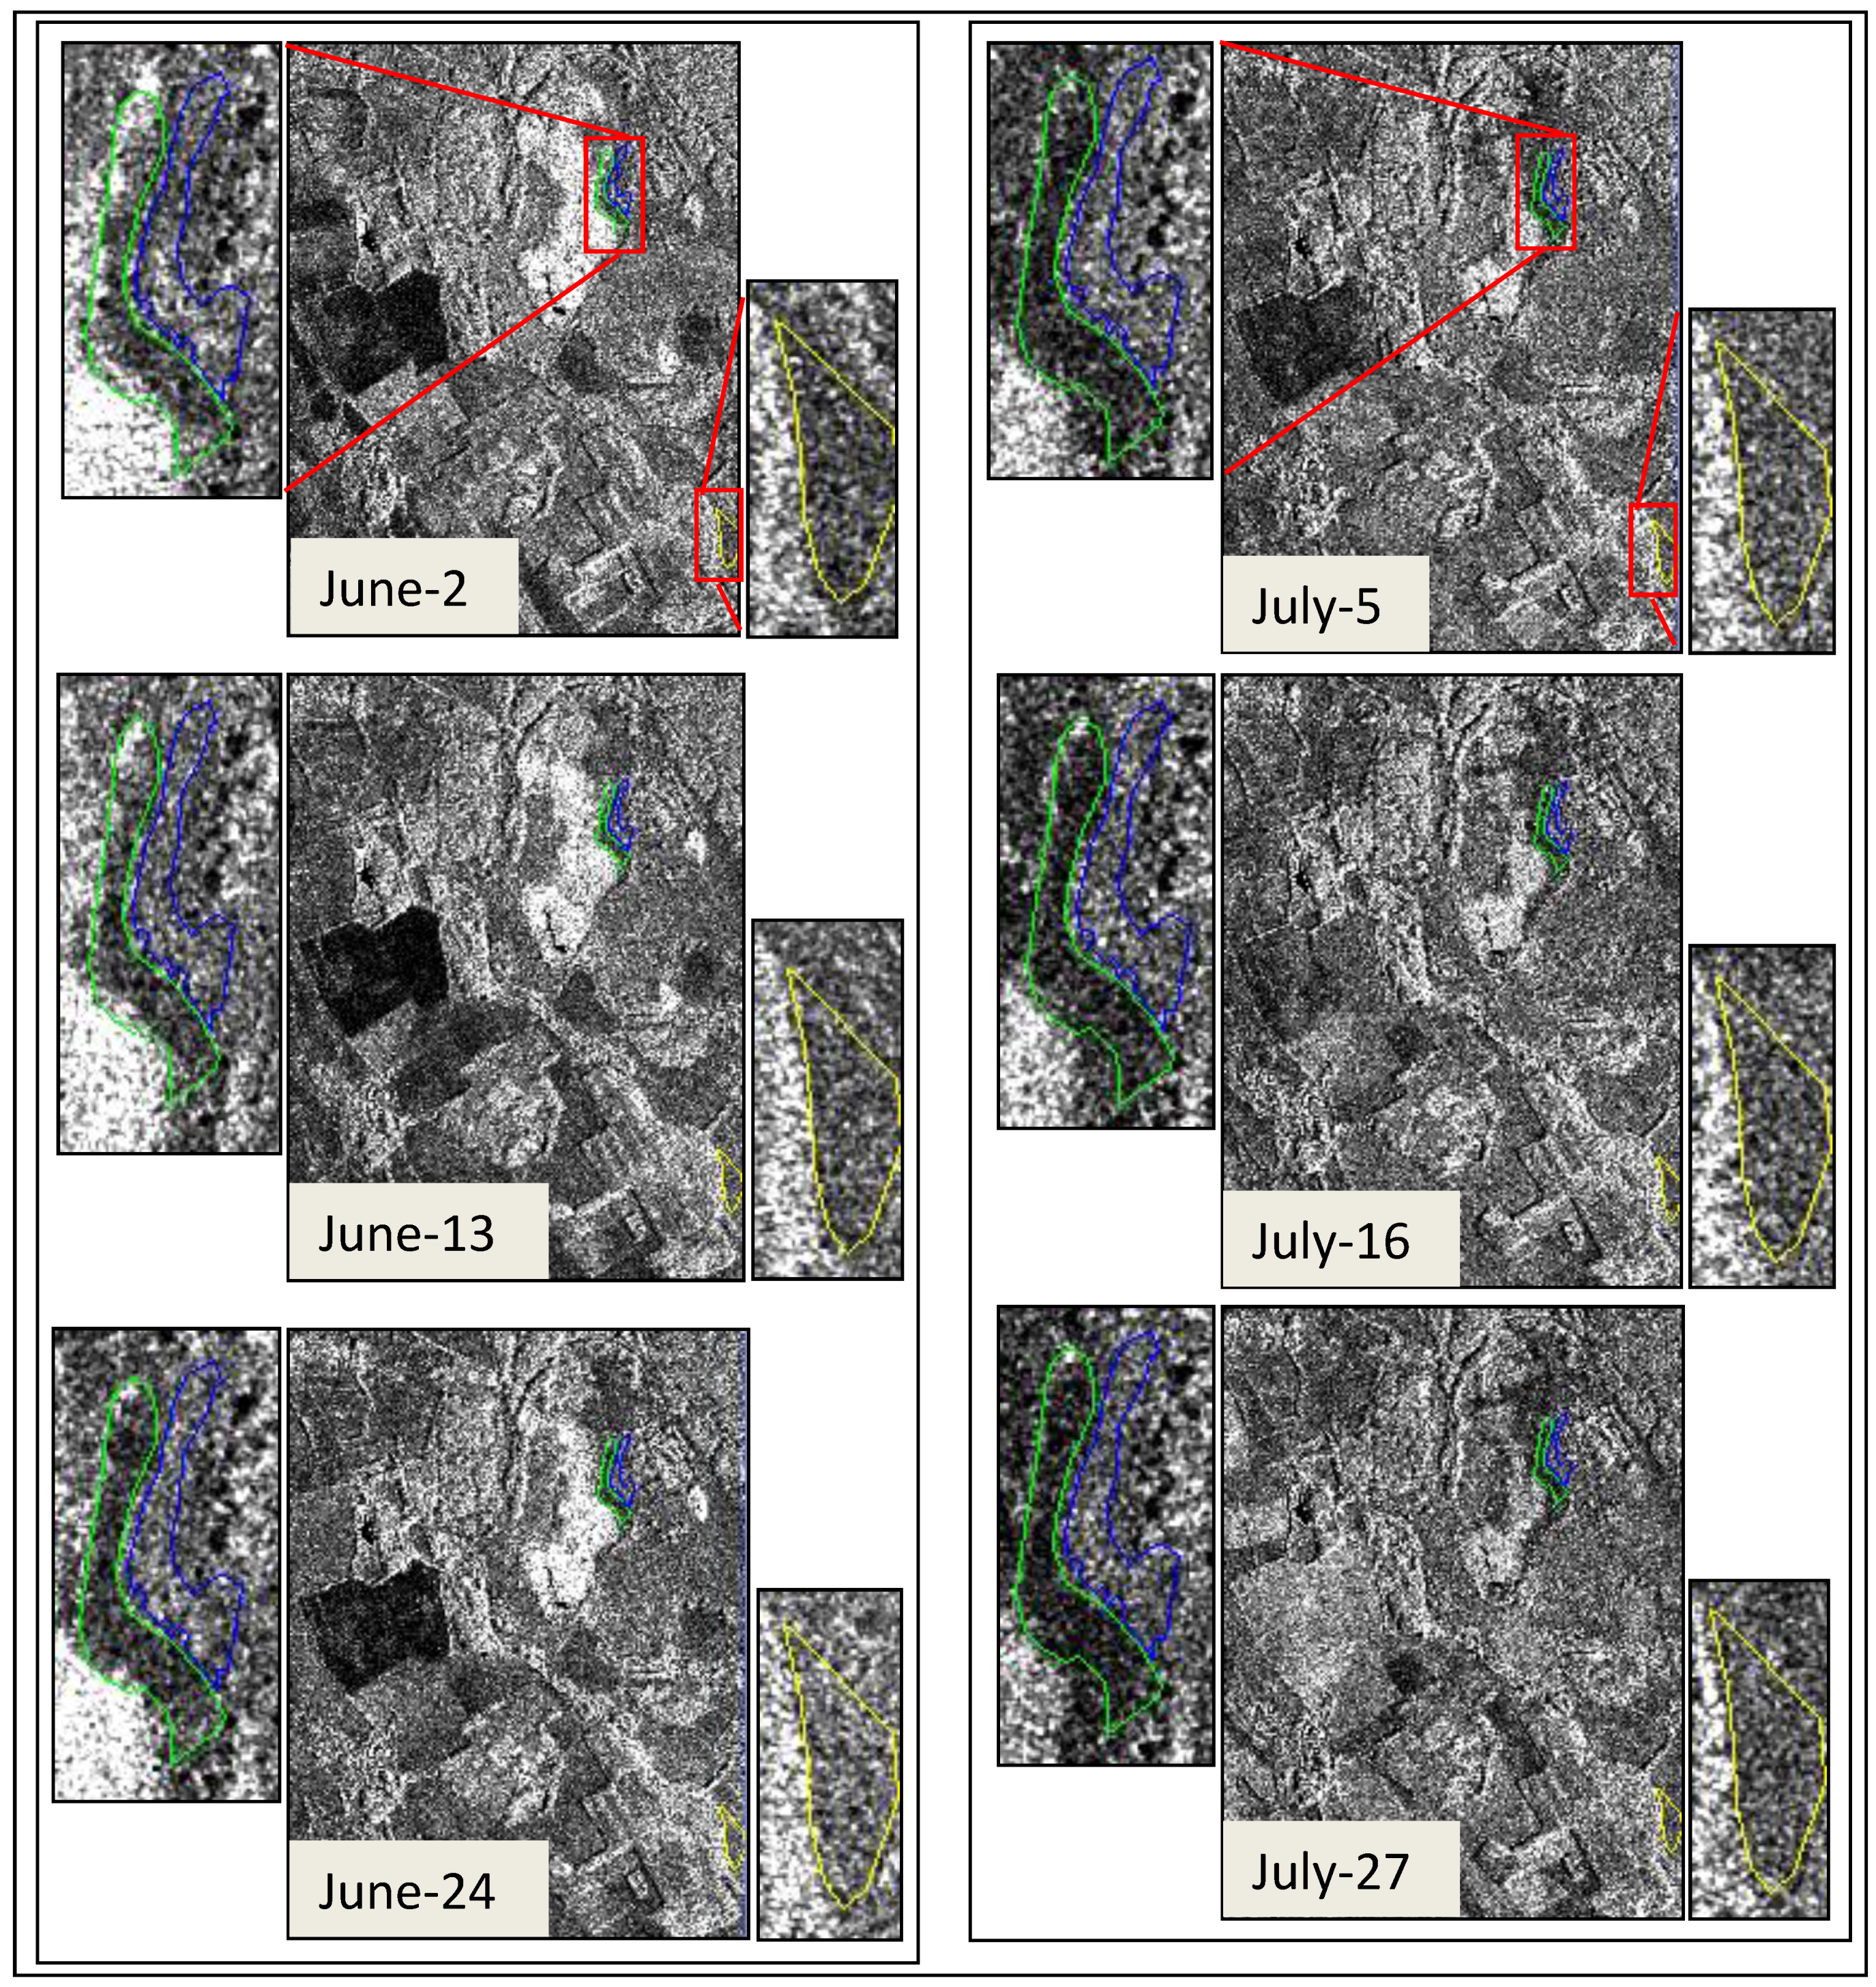
The characteristic swath peaks observed in the temporal backscatter signal profiles are visible from the actual time series images (Figure 3). The image acquired right after the swath always returns a high backscatter increase for the respective site, followed by a strong decrease (compare to Figure 2 and Table 1). In contrast, the pasture site does not return such obvious change for any of the observed dates. Strong changes in the subset scene are especially visible for agricultural fields with bigger and clearly bordered distinctive areas. Representing the traditional object in radar remote sensing of vegetation, their characterization is strongly facilitated not only due to their size, but also as a result of their homogenous texture (composition of plant association) as well as clearly determined and spatially-homogenous human swath impacts (e.g., no grazing). Grazing interferes with steady phenological growth in semi-natural grassland areas and is expected to cause minor shifts in the backscatter profiles. However, grazing activities are difficult to quantify. As the cattle movement in the research area is relatively independent, the ground truth data is not precise enough. In the end, however, cattle movements do not lead to abrupt effects in the backscatter profiles and may therefore be disregarded for the study of swath events.
For operational studies (i.e., when ground truth information on swath events is missing), study sites should be divided into sections to ensure proper detection in case a satellite acquisition takes place between consecutive cutting days (e.g., due to rain interruption).

3.3. Correspondence to NATURA 2000 Management Rules
The results from the proposed method of swath detection could be used as distinct criteria for the monitoring of NATURA 2000 habitats. By comparing the detected swath event periods for the investigated study sites to habitat-specific NATURA 2000 swath management rules [15], a decision can be made as to whether a certain site can be regarded as a specific NATURA 2000 site or not. This study illustrates the feasibility of such an approach. Molinia meadows (6410) require a swath regime that allows a single swath per year to be performed in late summer only. In contrast, for the conservation of species-rich extensively managed hay meadows two swaths per year are necessary, with the first one occurring no earlier than the main flowering period in mid June (Section 2.1). The detected swath event periods corresponded to these mowing rules (Table 3). Clearly, a monitoring approach cannot rely on such criteria alone. However, when a site is suspected to be of a certain habitat type, the swath rule requirement could be employed as an exclusive criterion. Thus, the derivation of habitat probability maps based on different data sources (like optical satellite data), can be substantially improved. On the other hand, monitoring areas could be scanned for pre-selecting sites in the beginning. A swath or even phenological data base could then be set up.
Figure 3. Comparison of the TerraSAR-X image segments in gray scale (the lighter the shading, the higher the backscatter signal) with special focus on the investigated areas: NATURA 2000 habitats 6410 (green), 6510 (yellow) as well as Pasture 1 (blue) and the scene subset for comparison. Sites indicate swath effects by a distinctly lighter gray color: 29 August for meadow 6410; 24 June and 9 September for meadow 6510. The pasture site is not affected by swath.
Remotesensing 03 01308 g003aRemotesensing 03 01308 g003b
Table 3. Comparison of the swath event periods derived from TerraSAR-X to the NATURA 2000 habitat-specific swath management rule.
NATURA 2000 siteSwath event periodMatch
Management ruleTSX-detected
6410Yearly single swath event in late summer18.08–28.08.2010yes
6510Two swaths per year, first one not before main flowering period in mid June13.06–23.06.2010yes
29.08–08.09.2010yes

4. Conclusions

Our study shows the feasibility of using TerraSAR-X time series for the detection of swath events in semi-natural grassland vegetation. These promising results suggest there is potential for remote sensing based monitoring of NATURA 2000 habitats. In contrast to agricultural areas, which have been the traditional research focus, the characterization of semi-natural grassland areas is much more challenging since these are very rare and relatively small areas with heterogeneous vegetation composition and diverse phenological characteristics, as well as more complex human impacts. It is a significant result that the sensor is capable of delivering information to categorize vegetation processes on such small scales. The major advantage of radar systems (independence from clouds) allows for a steady allocation of swath events to periods of 11 days. The proposed swath detection rule reliably returned the exact sites and dates where swath events had taken place. However, as only a few such habitat sites exist, classical sampling strategies are not applicable. Due to the very sparse occurrence of such endangered NATURA 2000 grassland habitats, the proposed analysis should be repeated on further nature reserves within the bio-geographical region for proper validation and subsequent refinement of the detection rule.
By way of comparing the detected swath events to habitat-specific swath management rules, the introduced method of swath detection could be used as distinct criteria for the monitoring of NATURA 2000 grassland habitats. Thus, it could present a methodological step forward towards the remote sensing based monitoring of NATURA 2000 habitats to support the implementation of the EU Habitats Directive.

Acknowledgments

This study was conducted within the CARE-X project coordinated by the Technical University of Berlin. The project is funded by the German National Space Agency DLR (Deutsches Zentrum für Luft- und Raumfahrt e.V.) on behalf of the German Federal Ministry of Economy and Technology based on the Bundestagresolution 50EE0923. The authors are grateful to the DLR for providing the dense TerraSAR-X time series and thank Damian Bargiel for fruitful discussions as well as the team of Luftbild Umwelt Planung GmbH Potsdam for their extensive field surveys within the project.

References

  1. Barnosky, A.D.; Matzke, N.; Tomiya, S.; Wogan, G.O.U.; Swartz, B.; Quental, T.B.; Marshall, C.; McGuire, J.L.; Lindsey, E.L.; Maguire, K.C.; et al. Has the Earth’s sixth mass extinction already arrived? Nature 2011, 471, 51–57. [Google Scholar] [CrossRef] [PubMed]
  2. Kaschl, A. Global Monitoring for Environment and Security (GMES)—State of Play & Opportunities for Biodiversity Monitoring. In Proceedings of Habistat Workshop, Brussels, Belgium, 13 October 2010.
  3. Commission of the European Communities. Composite Report on the Conservation Status of Habitat Types and Species as required under Article 17 of the Habitats Directive; European Commission: Brussels, Belgium, 2009. [Google Scholar]
  4. Foerster, M.; Frick, A.; Walentowski, H.; Kleinschmit, B. Approaches to utilising QuickBird data for the monitoring of NATURA 2000 habitats. Community Ecol. 2008, 9, 155–168. [Google Scholar] [CrossRef]
  5. Frick, A.; Weyer, G.; Kenneweg, H.; Kleinschmit, B. A Knowledge Based Approach to Vegetation Monitoring with Quickbird Imagery. In Proceedings of the ISPRS Workshop 2005: High-Resolution Earth Imaging for Geospatial Information, Hannover, Germany, 17–20 May 2005.
  6. Vanden Borre, J.; Paelinckx, D.; Mücher, C.A.; Kooistra, L.; Haest, B.; De Blust, G.; Schmidt, A.M. Integrating remote sensing in Natura 2000 habitat monitoring: Prospects on the way forward. J. Nature Conserv. 2011, 19, 116–125. [Google Scholar] [CrossRef]
  7. Vanden Borre, J.; Paelinckx, D.; Hoffmann, M.; Spanhove, T. Biodiversity Monitoring beyond 2010: What Role for Remote Sensing? Minutes of the Plenary Discussion of the Workshop “Monitoring Europe’s Biodiversity in a Post 2010 Era: The Role of Remote Sensing for Natura 2000 Reporting and Ecosystem Assessment”; INBO.C.2010.4.; Research Institute for Nature and Forest (INBO): Brussels, Belgium, 2010; p. 9. [Google Scholar]
  8. Schuster, C.; Ali, I.; Lohmann, P.; Frick, A.; Foerster, M.; Kleinschmit, B. Analysis of TerraSAR-X Time Series for Detecting Swath Events in NATURA 2000 Grassland Habitats. In Proceedings of TerraSAR-X Science Team Meeting, Oberpfaffenhofen, Germany, 14–16 February 2011.
  9. Fritz, T.; Eineder, M. TerraSar-X Ground Segment Basic Product Specification Document; Doc.: TX-GS-DD-3302; 2009, 1.6, 3-108; Available online: http://tandemx-science.dlr.de/pdfs/TX-GS-DD-3302_Basic-Products-Specification-Document_V1.6.pdf (accessed on 30 March 2011).
  10. Lopez-Sanchez, J.M.; Ballester-Berman, J.D.; Hajnsek, I. First results of rice monitoring practices in Spain by means of time series of TerraSAR-X dual-pol images. IEEE J. Sel. Topics Appl. Earth Obs. Remote Sens. 2010, 4, 412–422. [Google Scholar] [CrossRef]
  11. Baghdadi, N.; Cresson, R.; Todoroff, P.; Moinet, S. Multitemporal observations of sugarcane by TerraSAR-X images. Sensors 2010, 10, 8899–8919. [Google Scholar] [CrossRef] [PubMed] [Green Version]
  12. Le Toan, T.; Laur, H.; Mougin, E.; Lopes, A. Multi-temporal and dual-polarization observations of agricultural vegetation covers by X-band SAR images. IEEE Trans. Geosci. Remote Sens. 1989, 27, 709–718. [Google Scholar] [CrossRef]
  13. Shang, J. Contribution of TerraSAR-X Data to In-Season Crop Mapping in Canada. In Proceedings of TerraSAR-X Science Team Meeting, Oberpfaffenhofen, Germany, 14–16 February 2011.
  14. Bargiel, D.; Herrmann, S.; Lohmann, P.; Sörgel, U. Land Use Classification with High-Resolution Satellite Radar for Estimating the Impacts of Land Use Change on the Quality of Ecosystem Services. In Proceedings of ISPRS TC VII Symposium: 100 Years ISPRS, Vienna, Austria, 5–7 July 2010; Vol. XXXVIII, Part 7B. pp. 68–73.
  15. BfN (Federal Agency for Nature Conservation). Natura 2000 Habitats in Germany. Website. 2009. Available online: http://www.bfn.de/0316_typ_lebensraum+M5054de7a952.html (accessed on 30 March 2011).
  16. INFOTERRA. Radiometric Calibration of TerraSAR-X Data; Manuscript; Infoterra: Friedrichshafen, Germany, 2008. [Google Scholar]