Extraction of Vertical Walls from Mobile Laser Scanning Data for Solar Potential Assessment


Abstract
:
1. Introduction
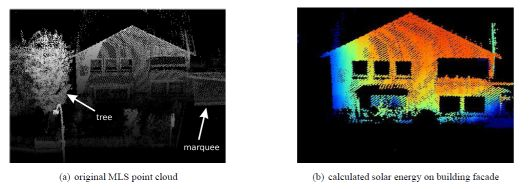
2. Study Area and Dataset

| Sensors characteristics | Optech Inc. LYNX mobile mapper |
|---|---|
| Maximum range | 100 m (to 20% reflectivity target) |
| Range precision | 7 mm (1 sigma) |
| Absolute accuracy | 5 cm (at 100 ) (assumes good GPS data) |
| Field of view | 360 |
| Scan rate | 100 Hz |
| Measurement rate | 100,000 pulses per second per sensor |
| Echoes per pulse | up to 4 echoes |
3. Method
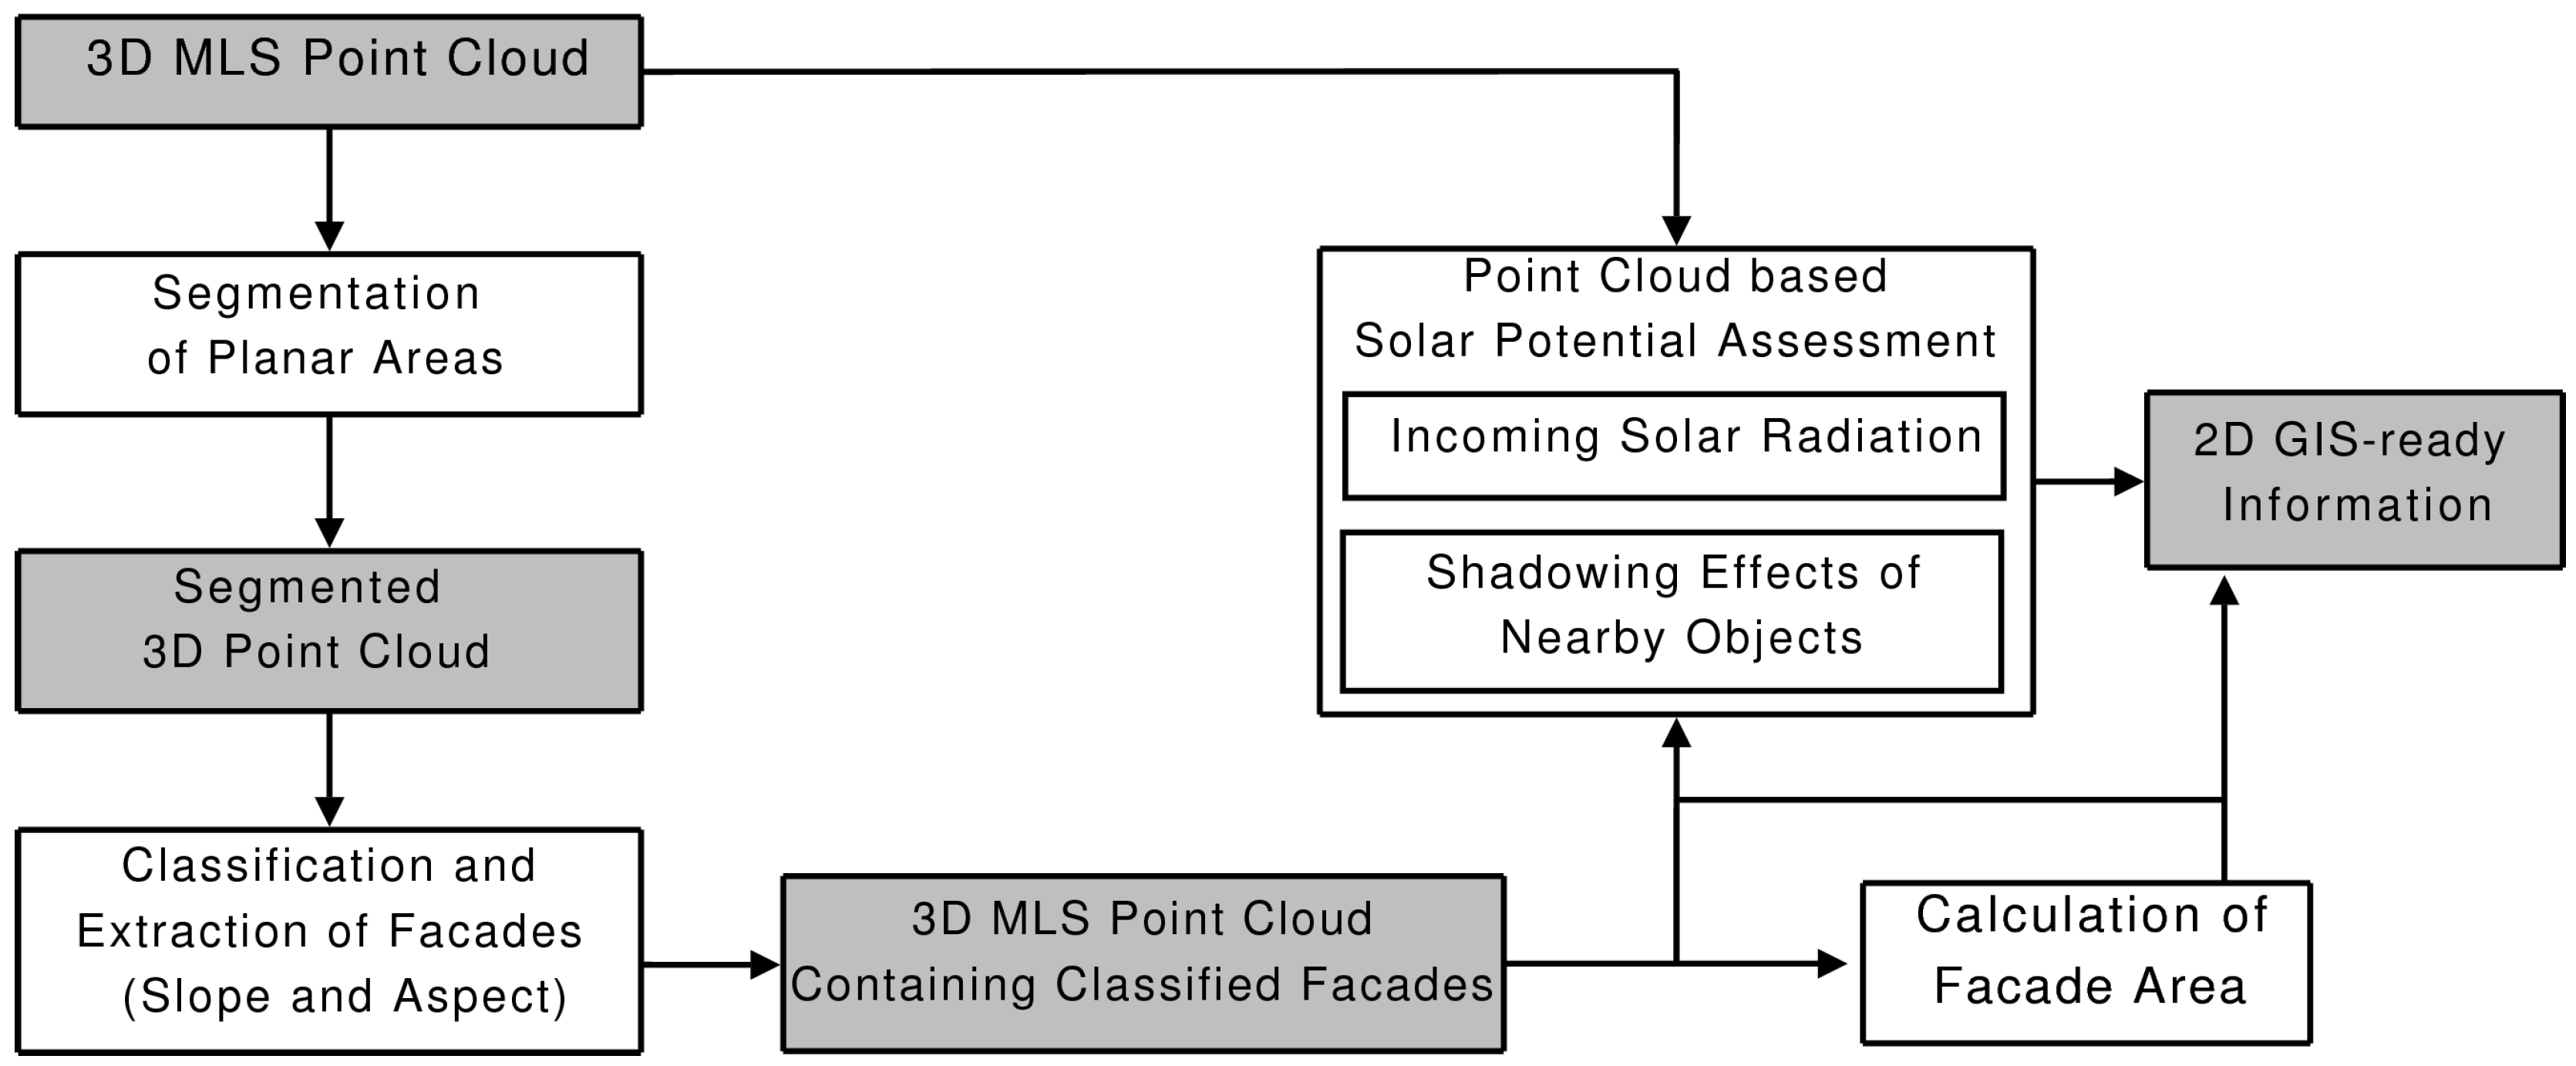
3.1. Workflow

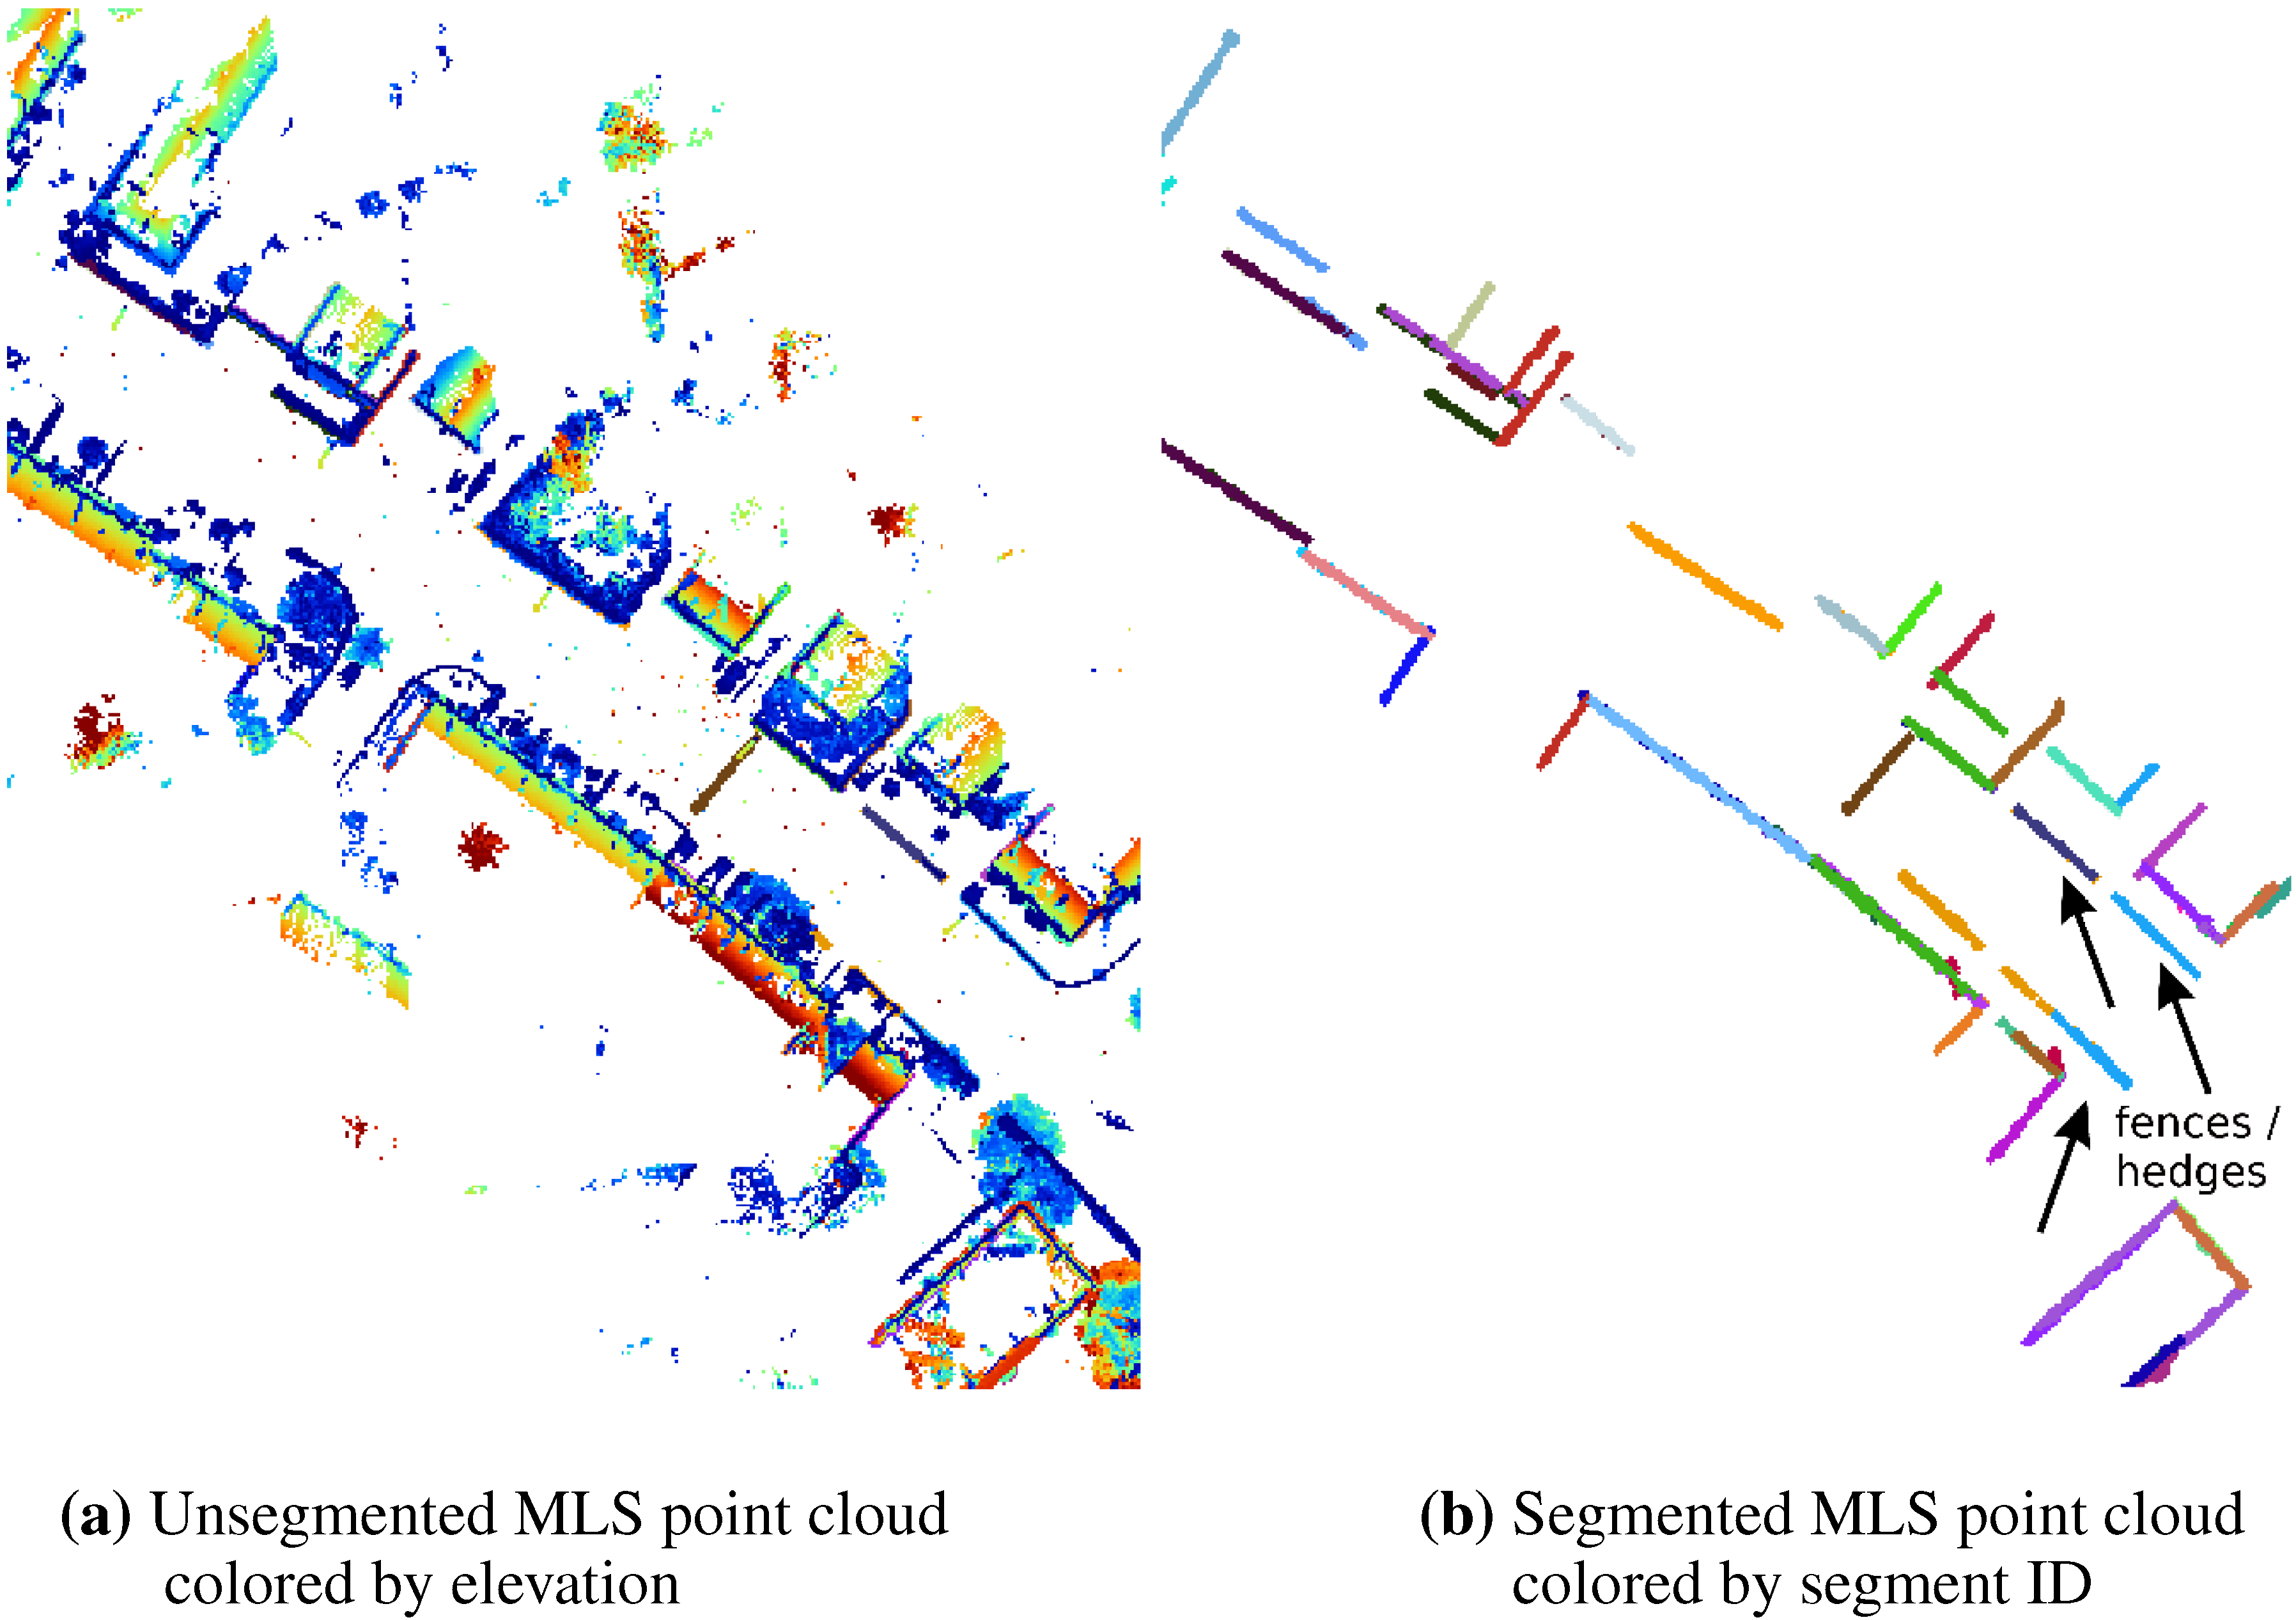
3.2. Segmentation of Planar Areas
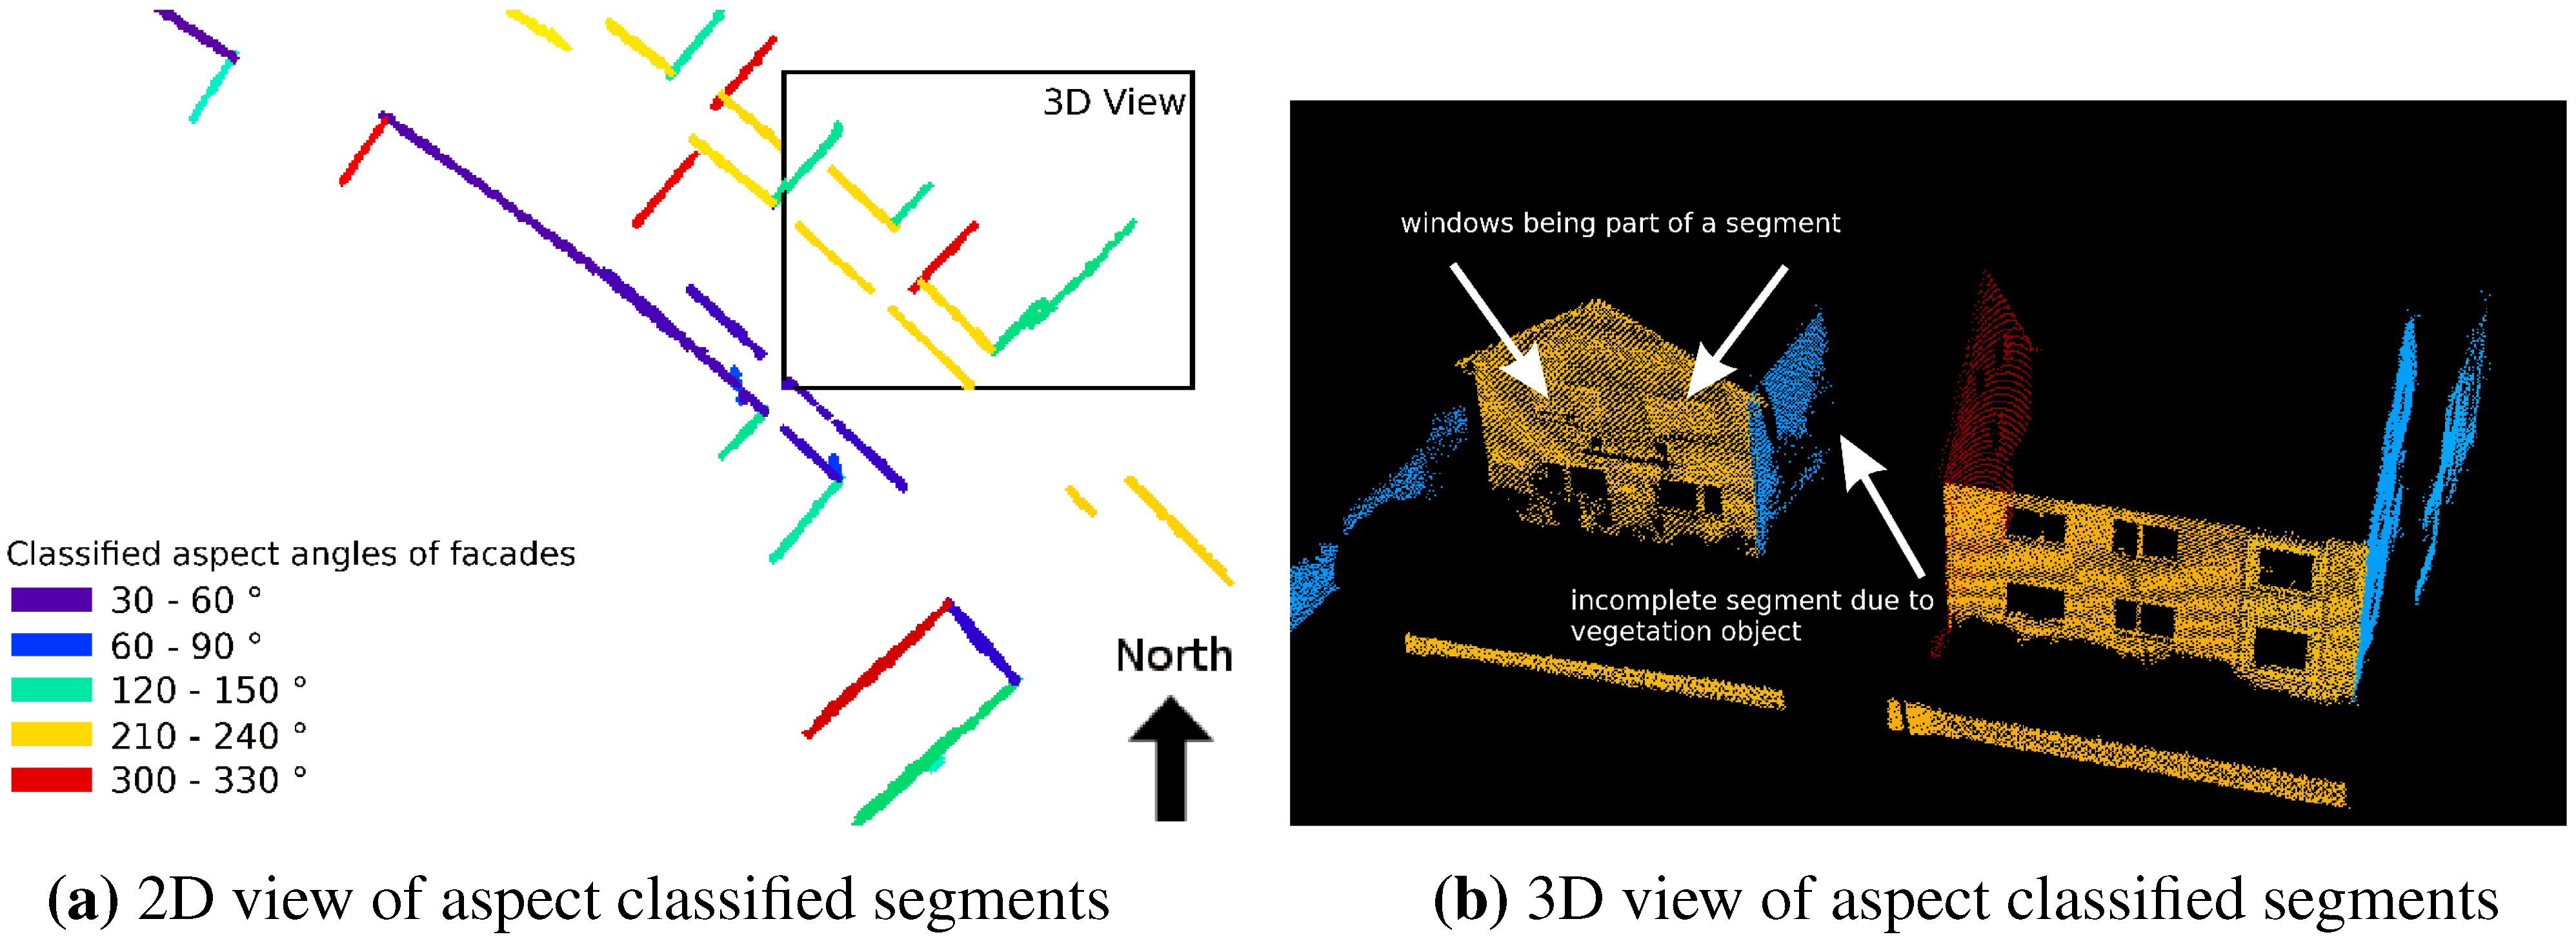
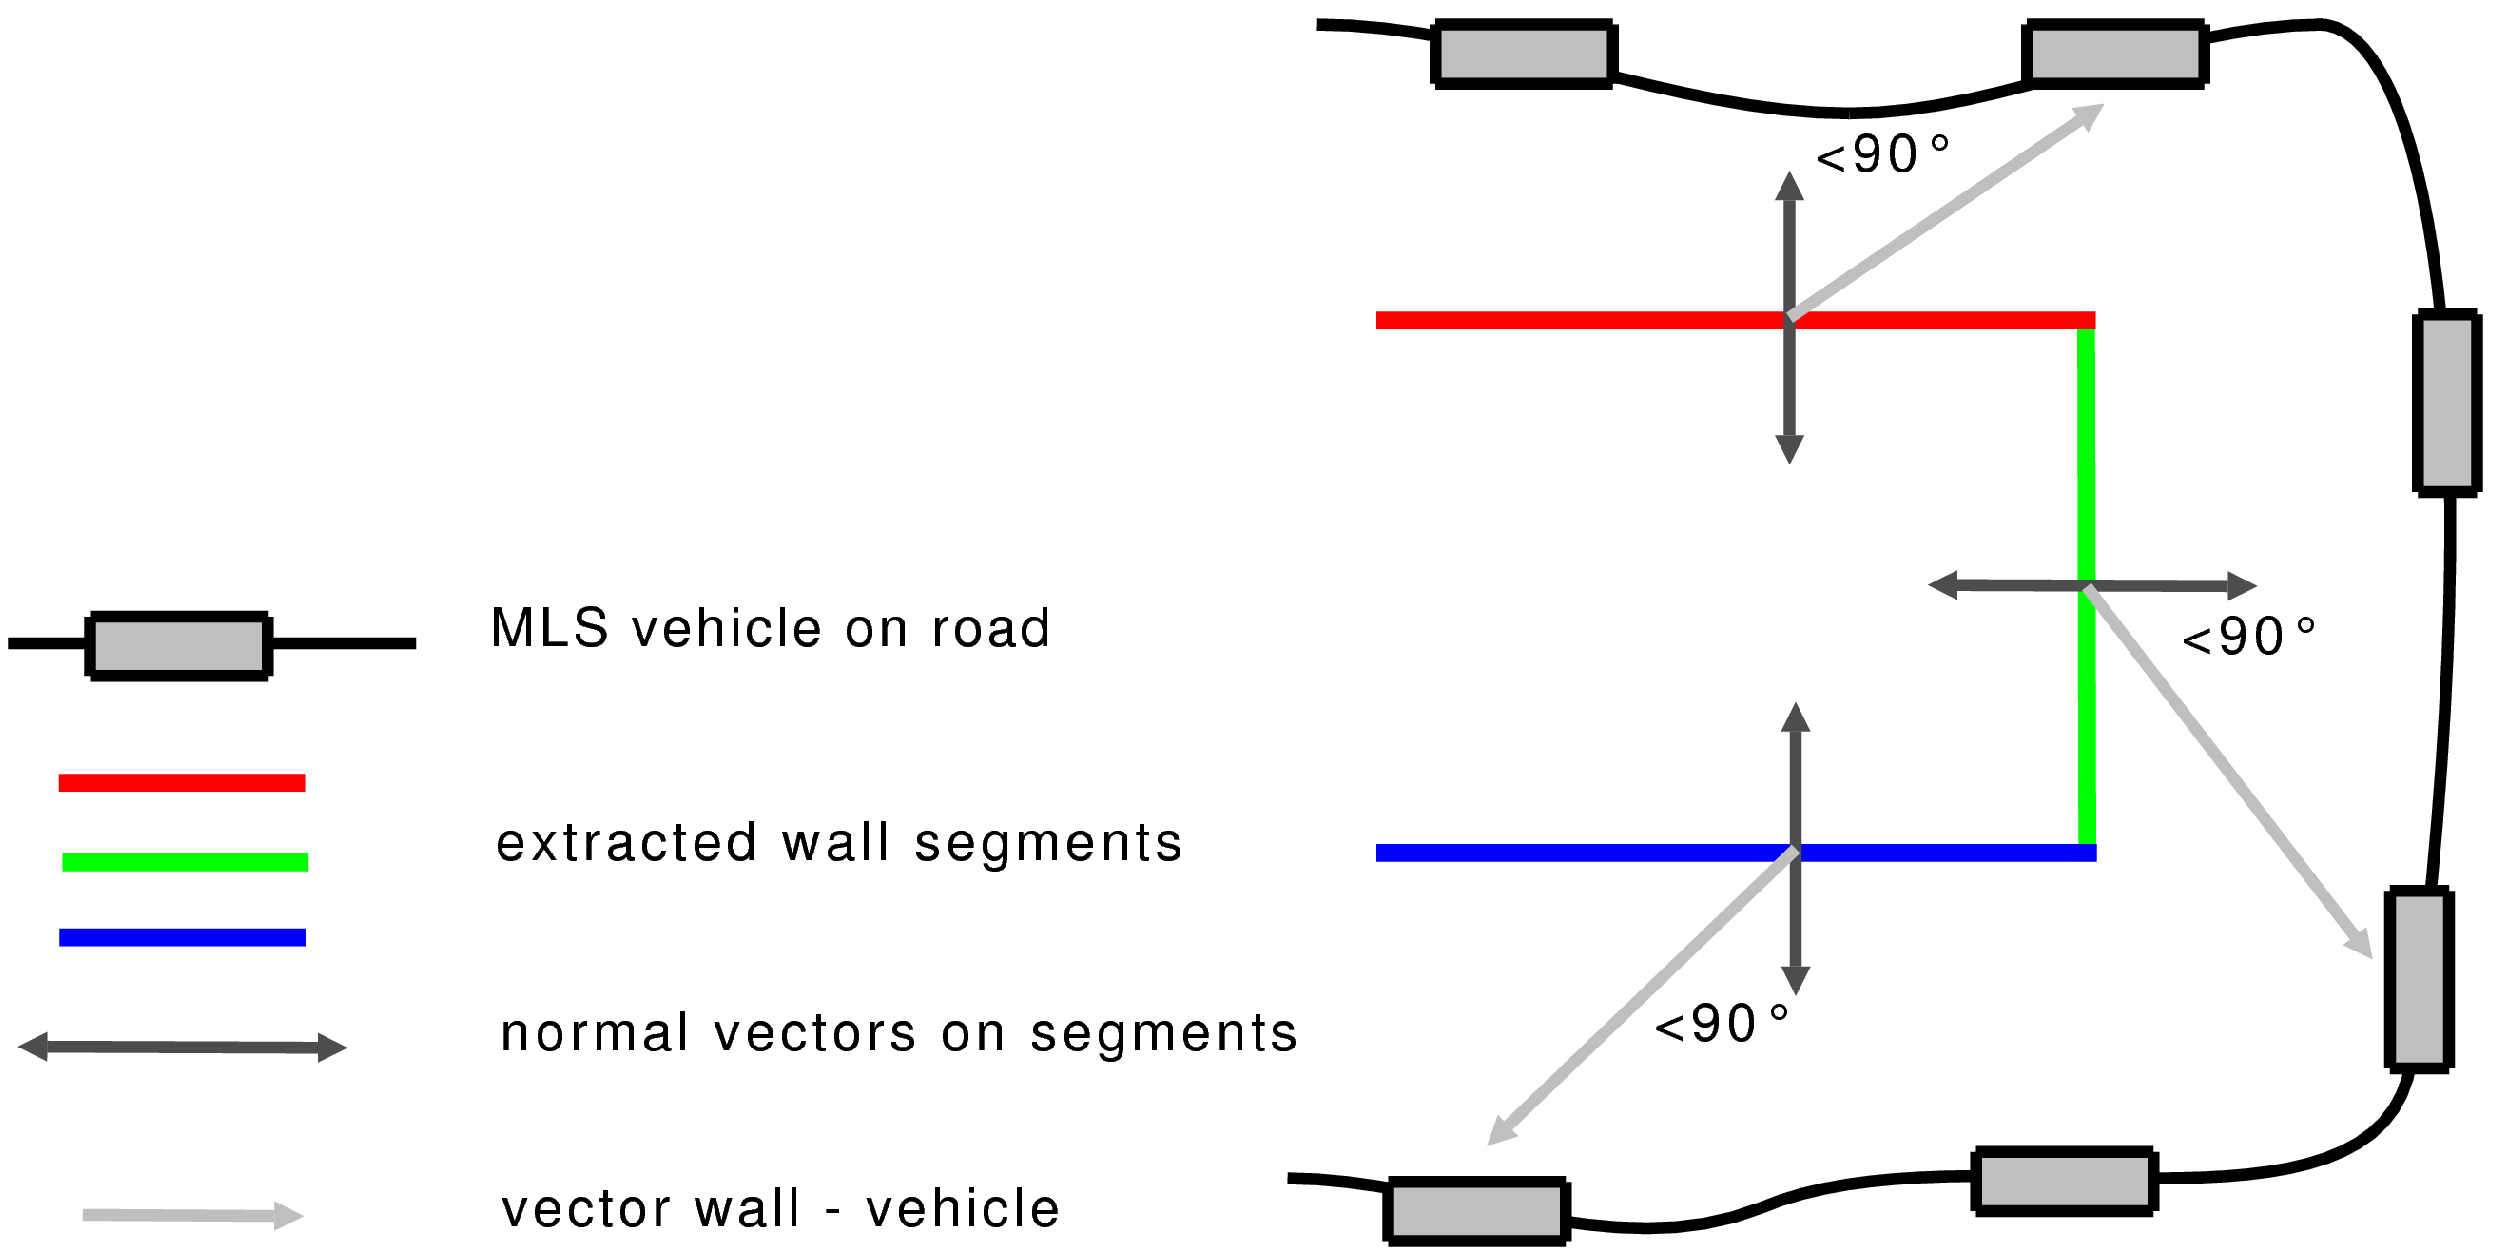
3.3. Classification and Extraction of Building Facades
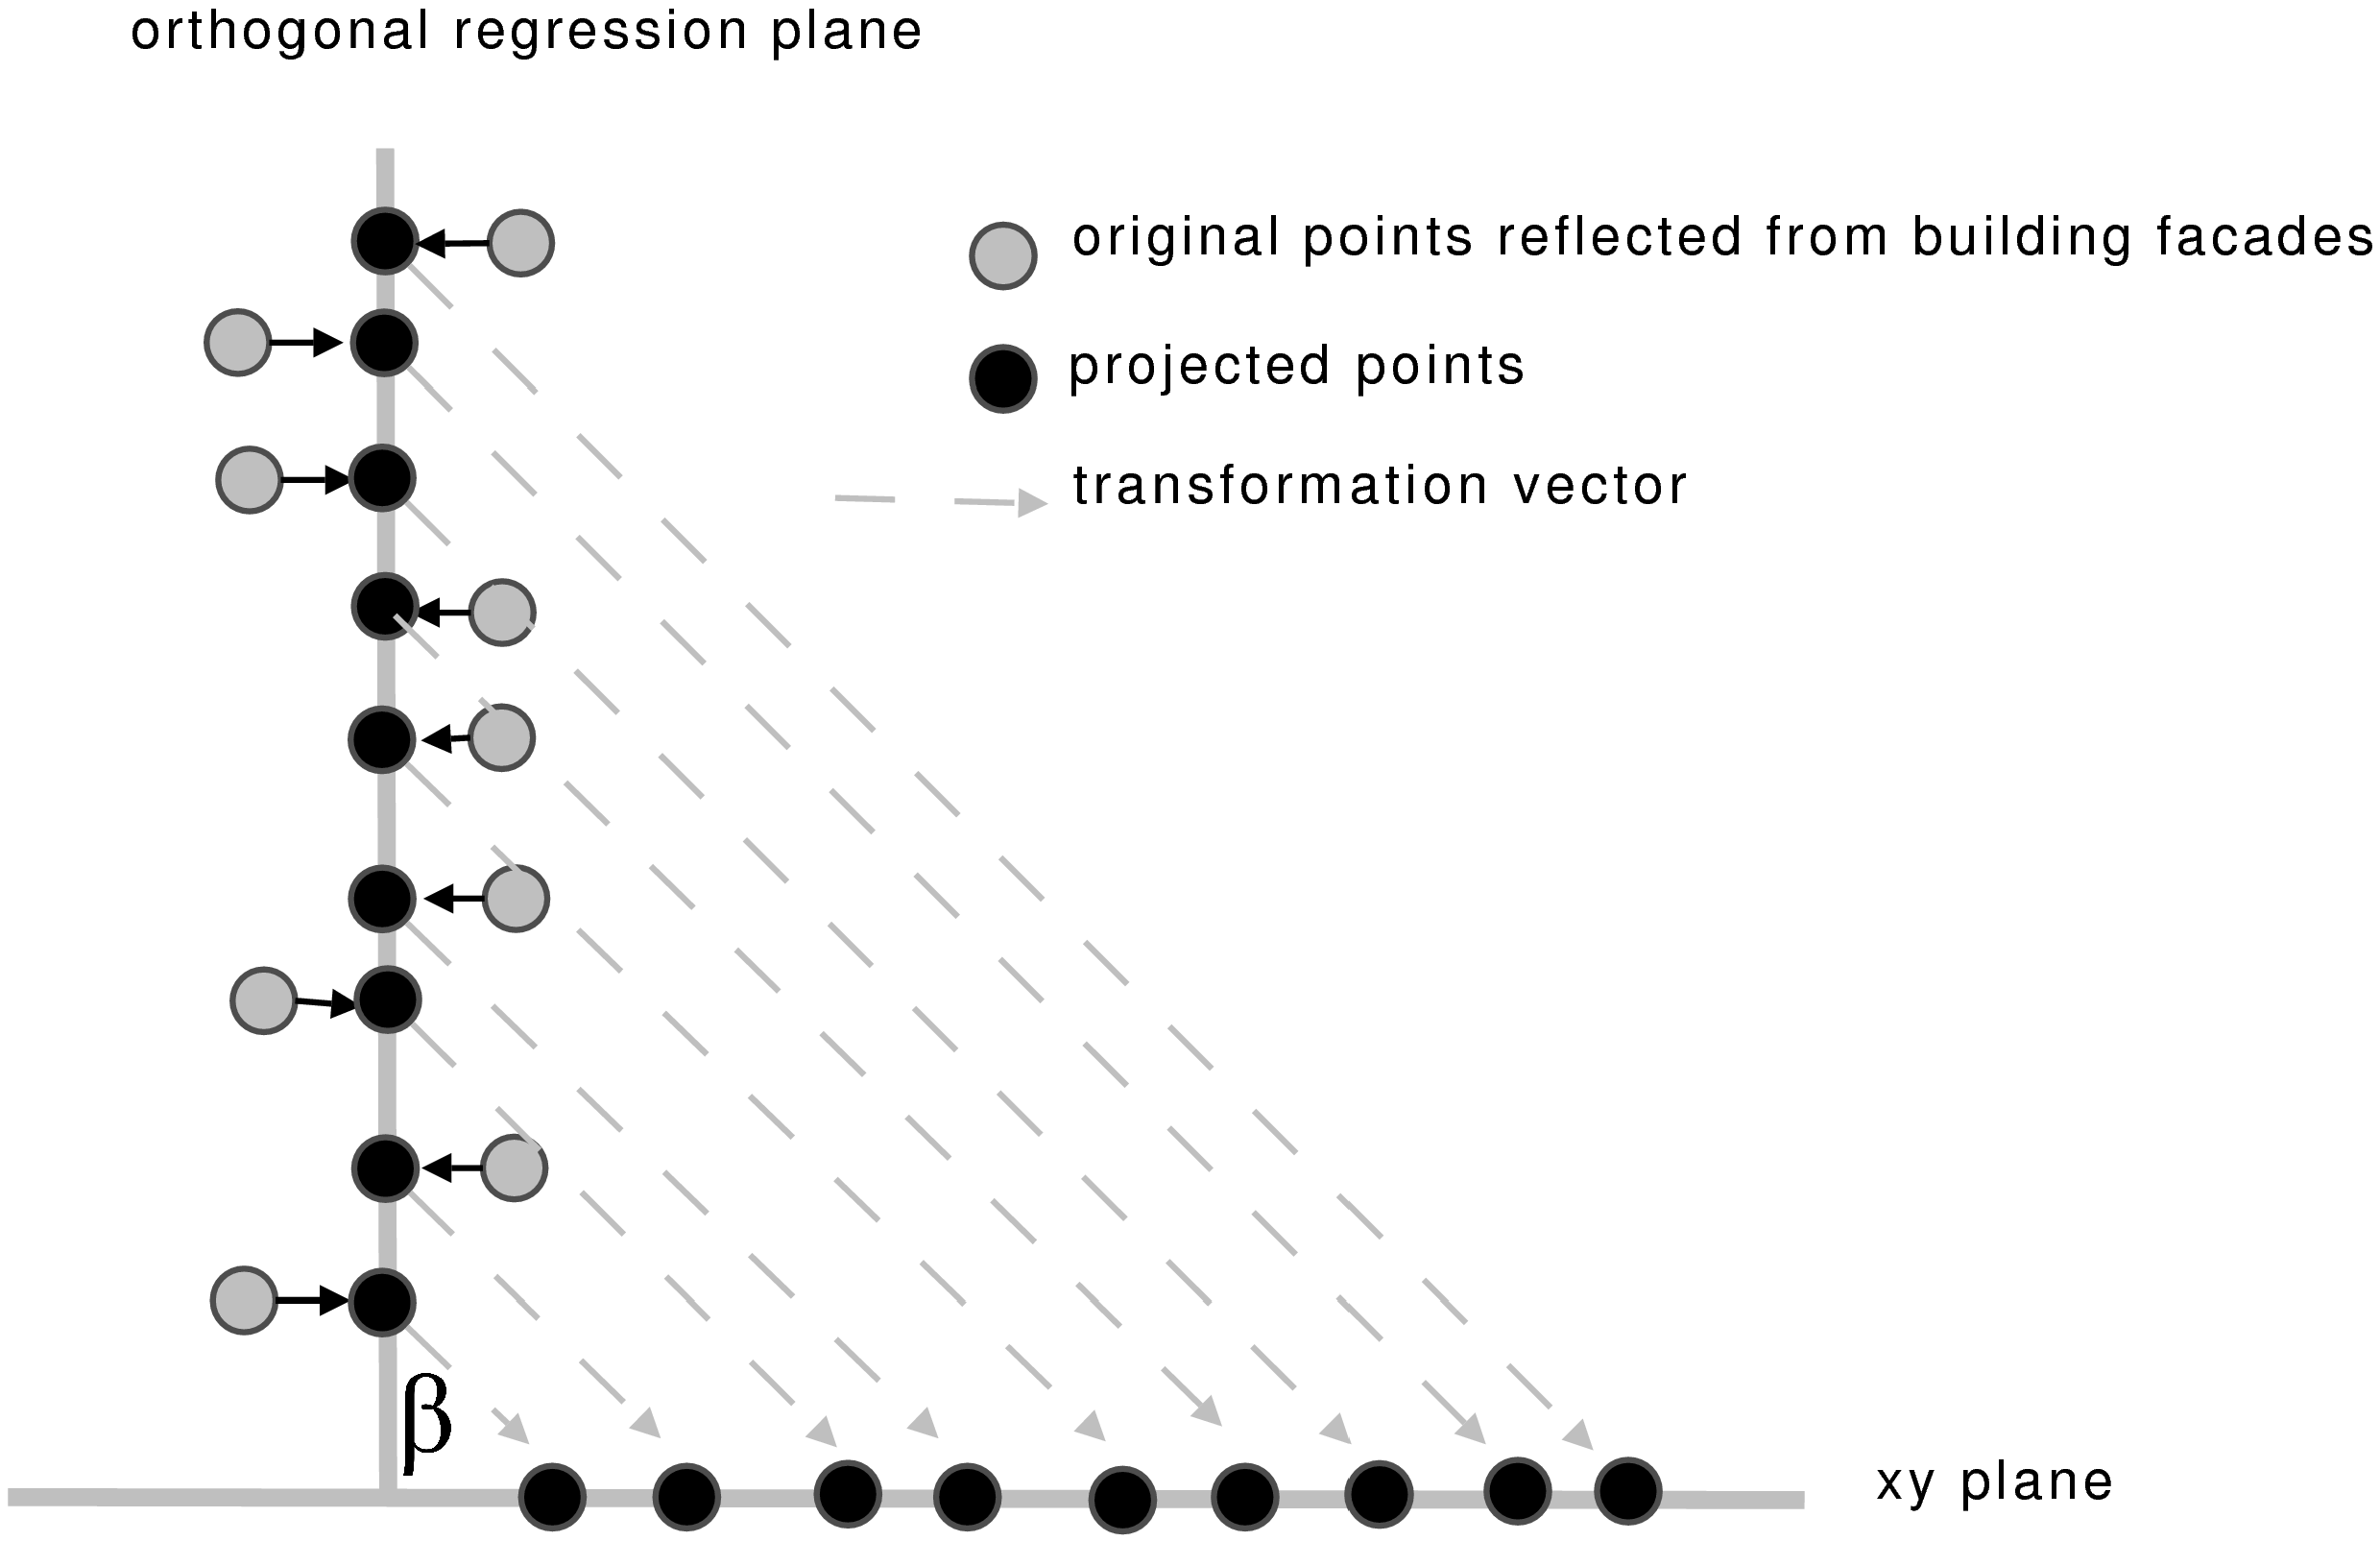
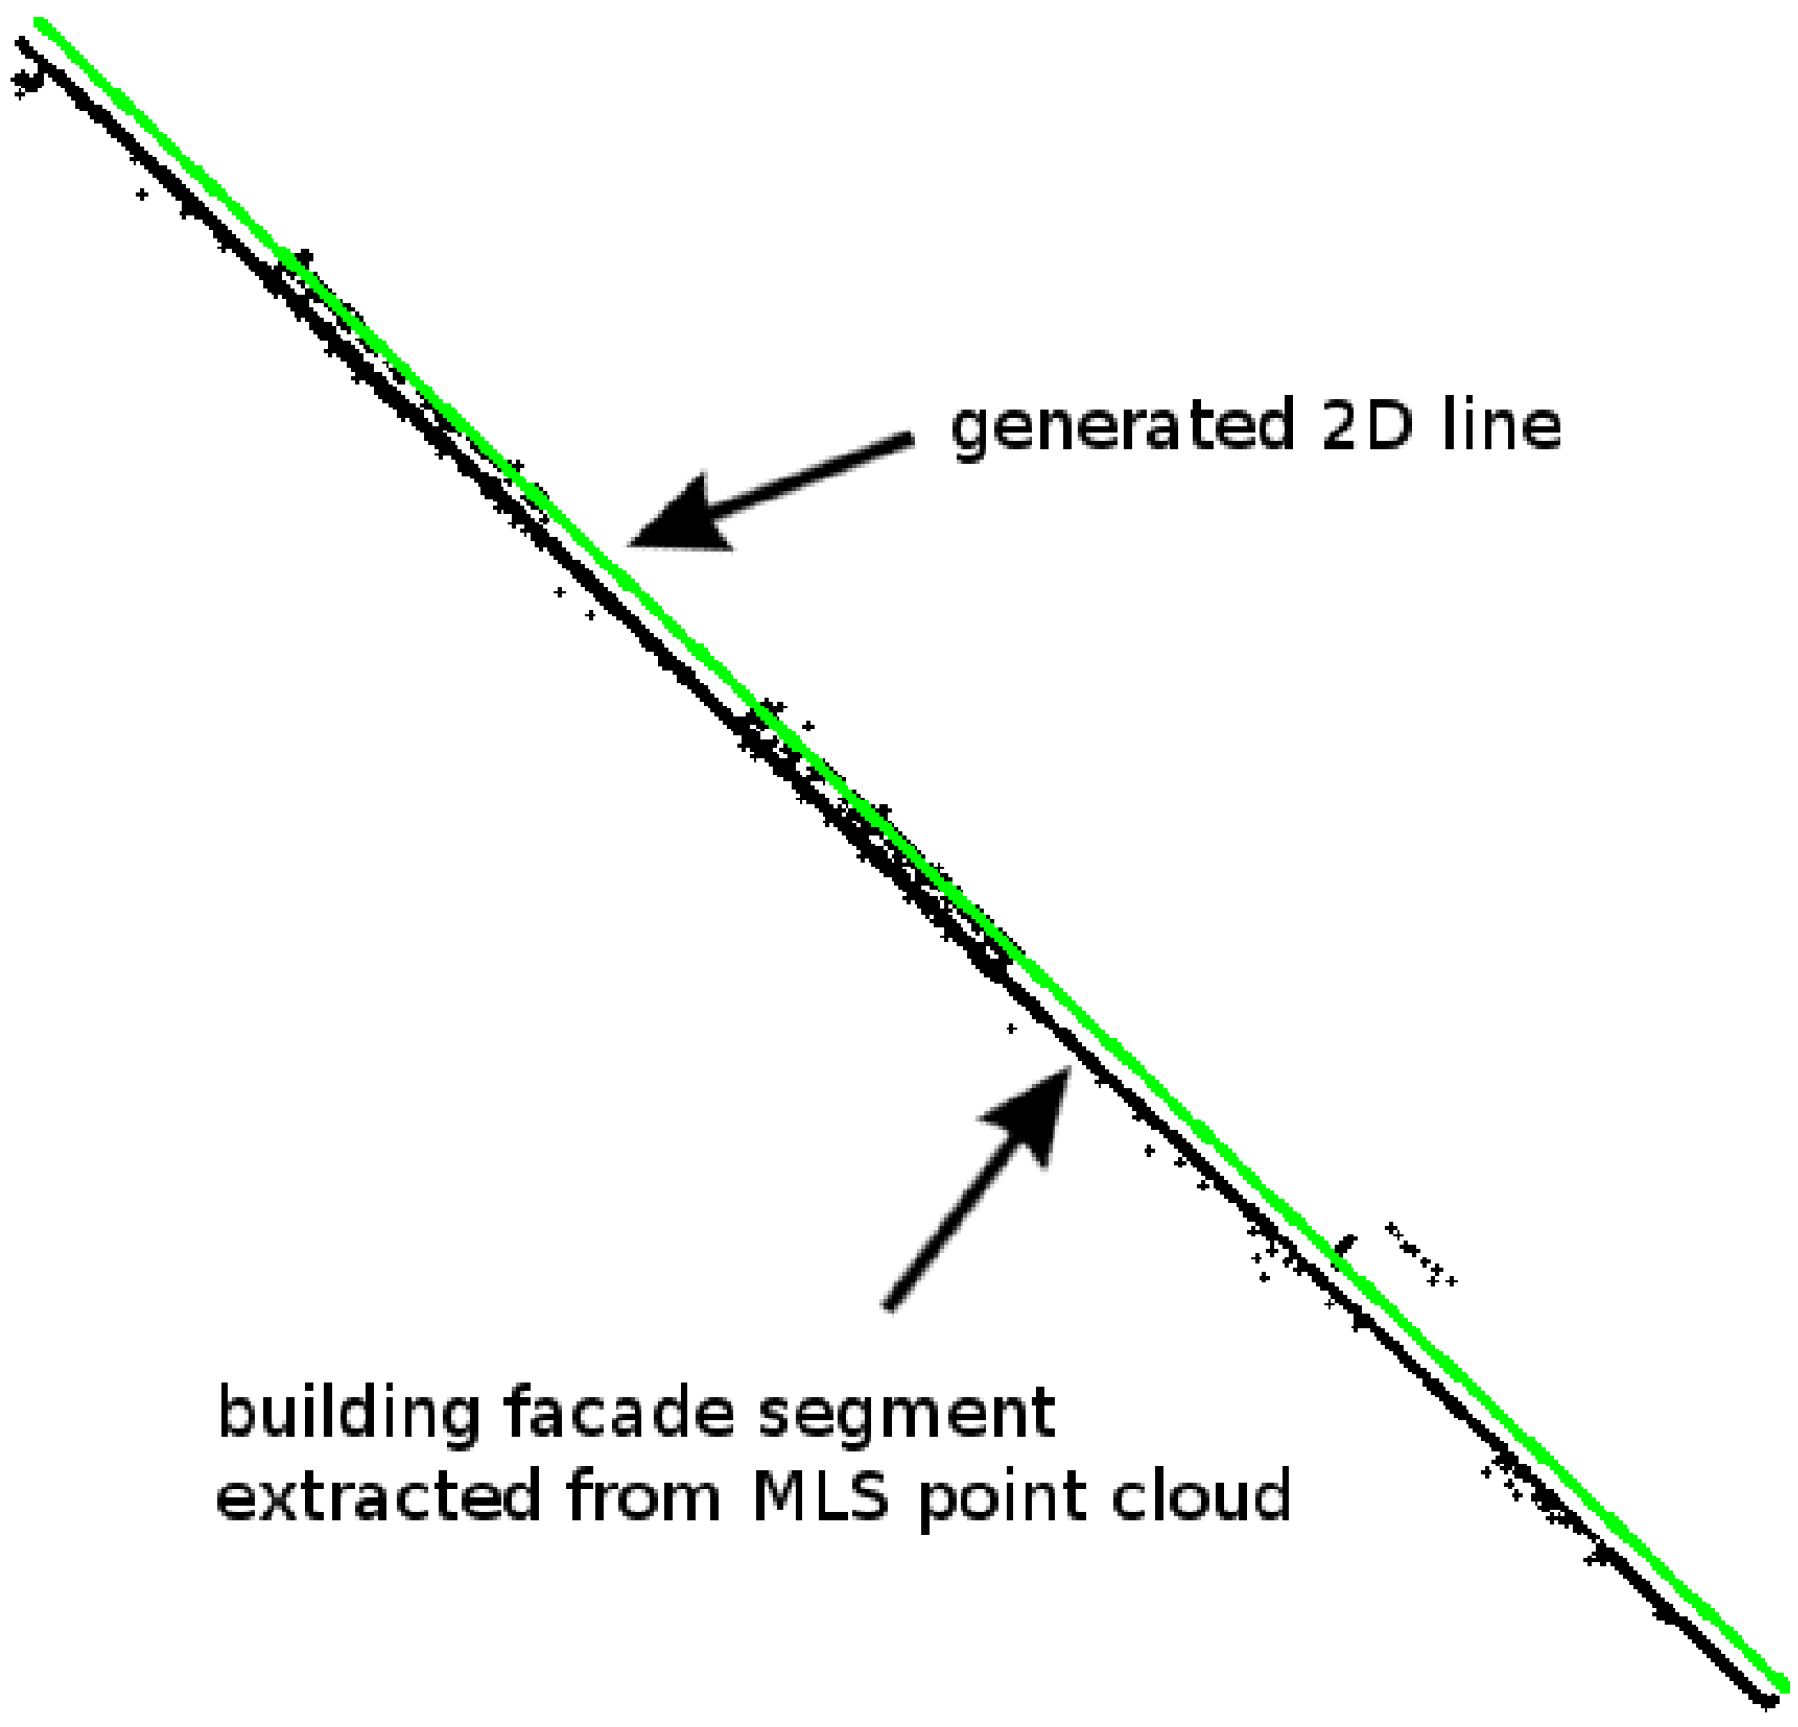
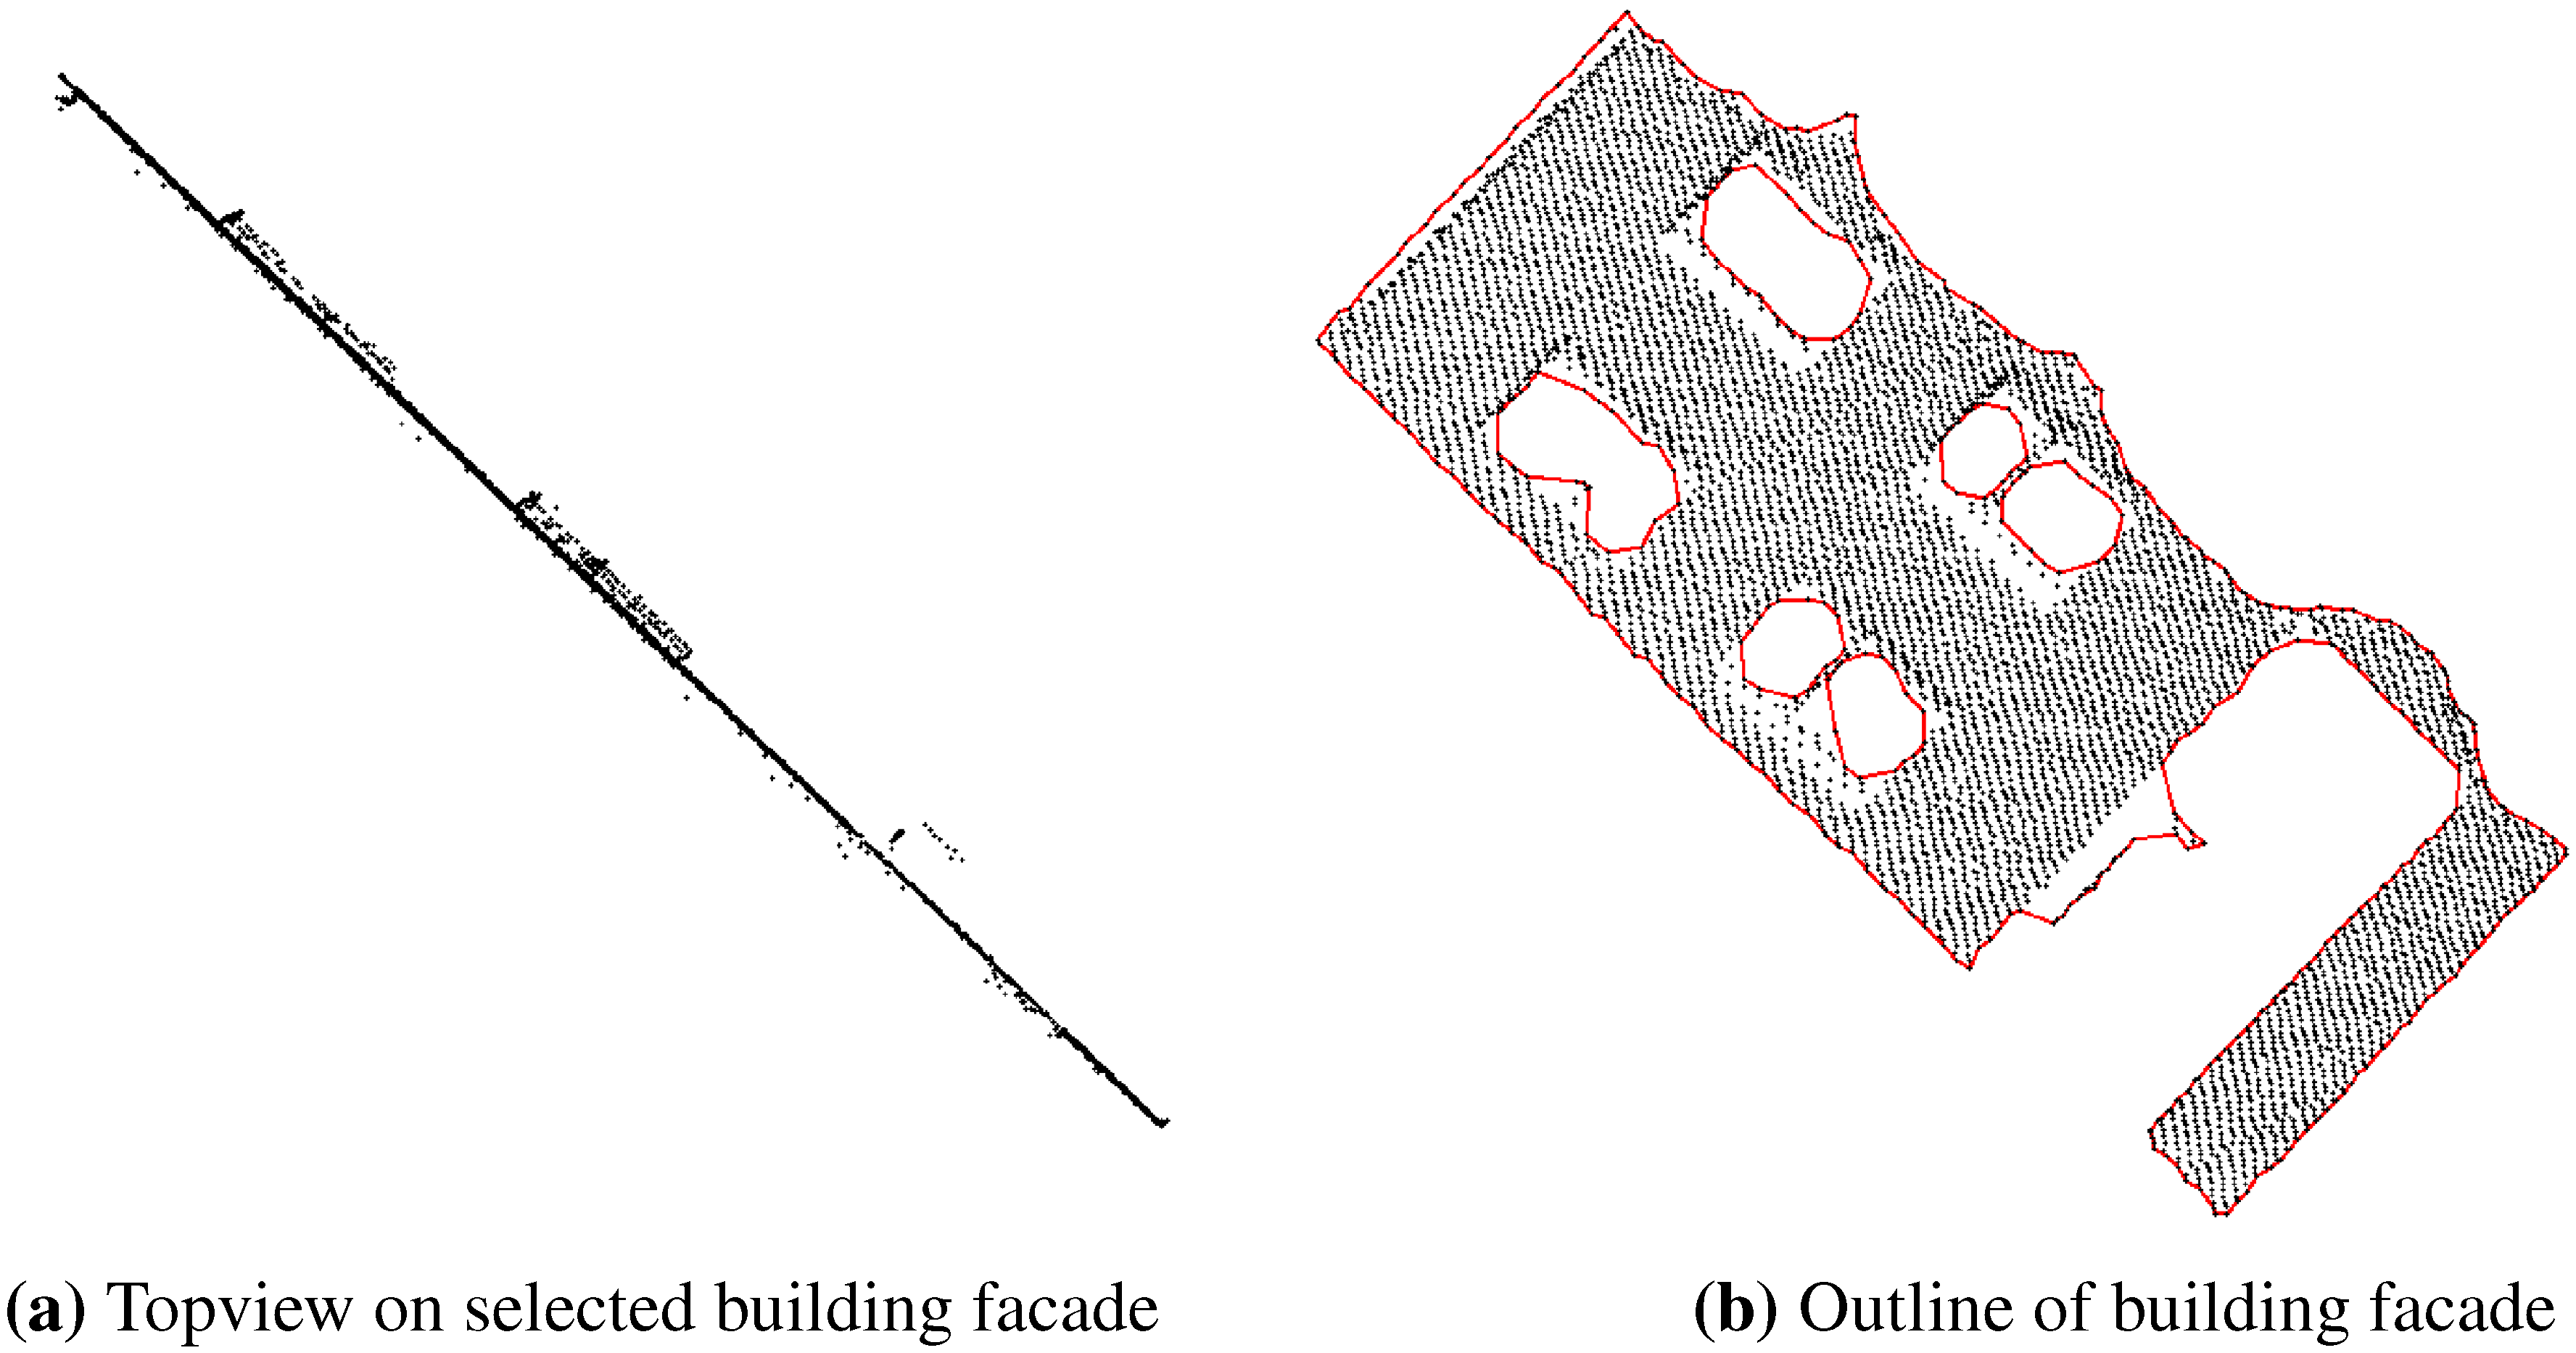
3.4. GIS-Ready Information of Building Facades

3.5. Solar Radiation Modeling
Background
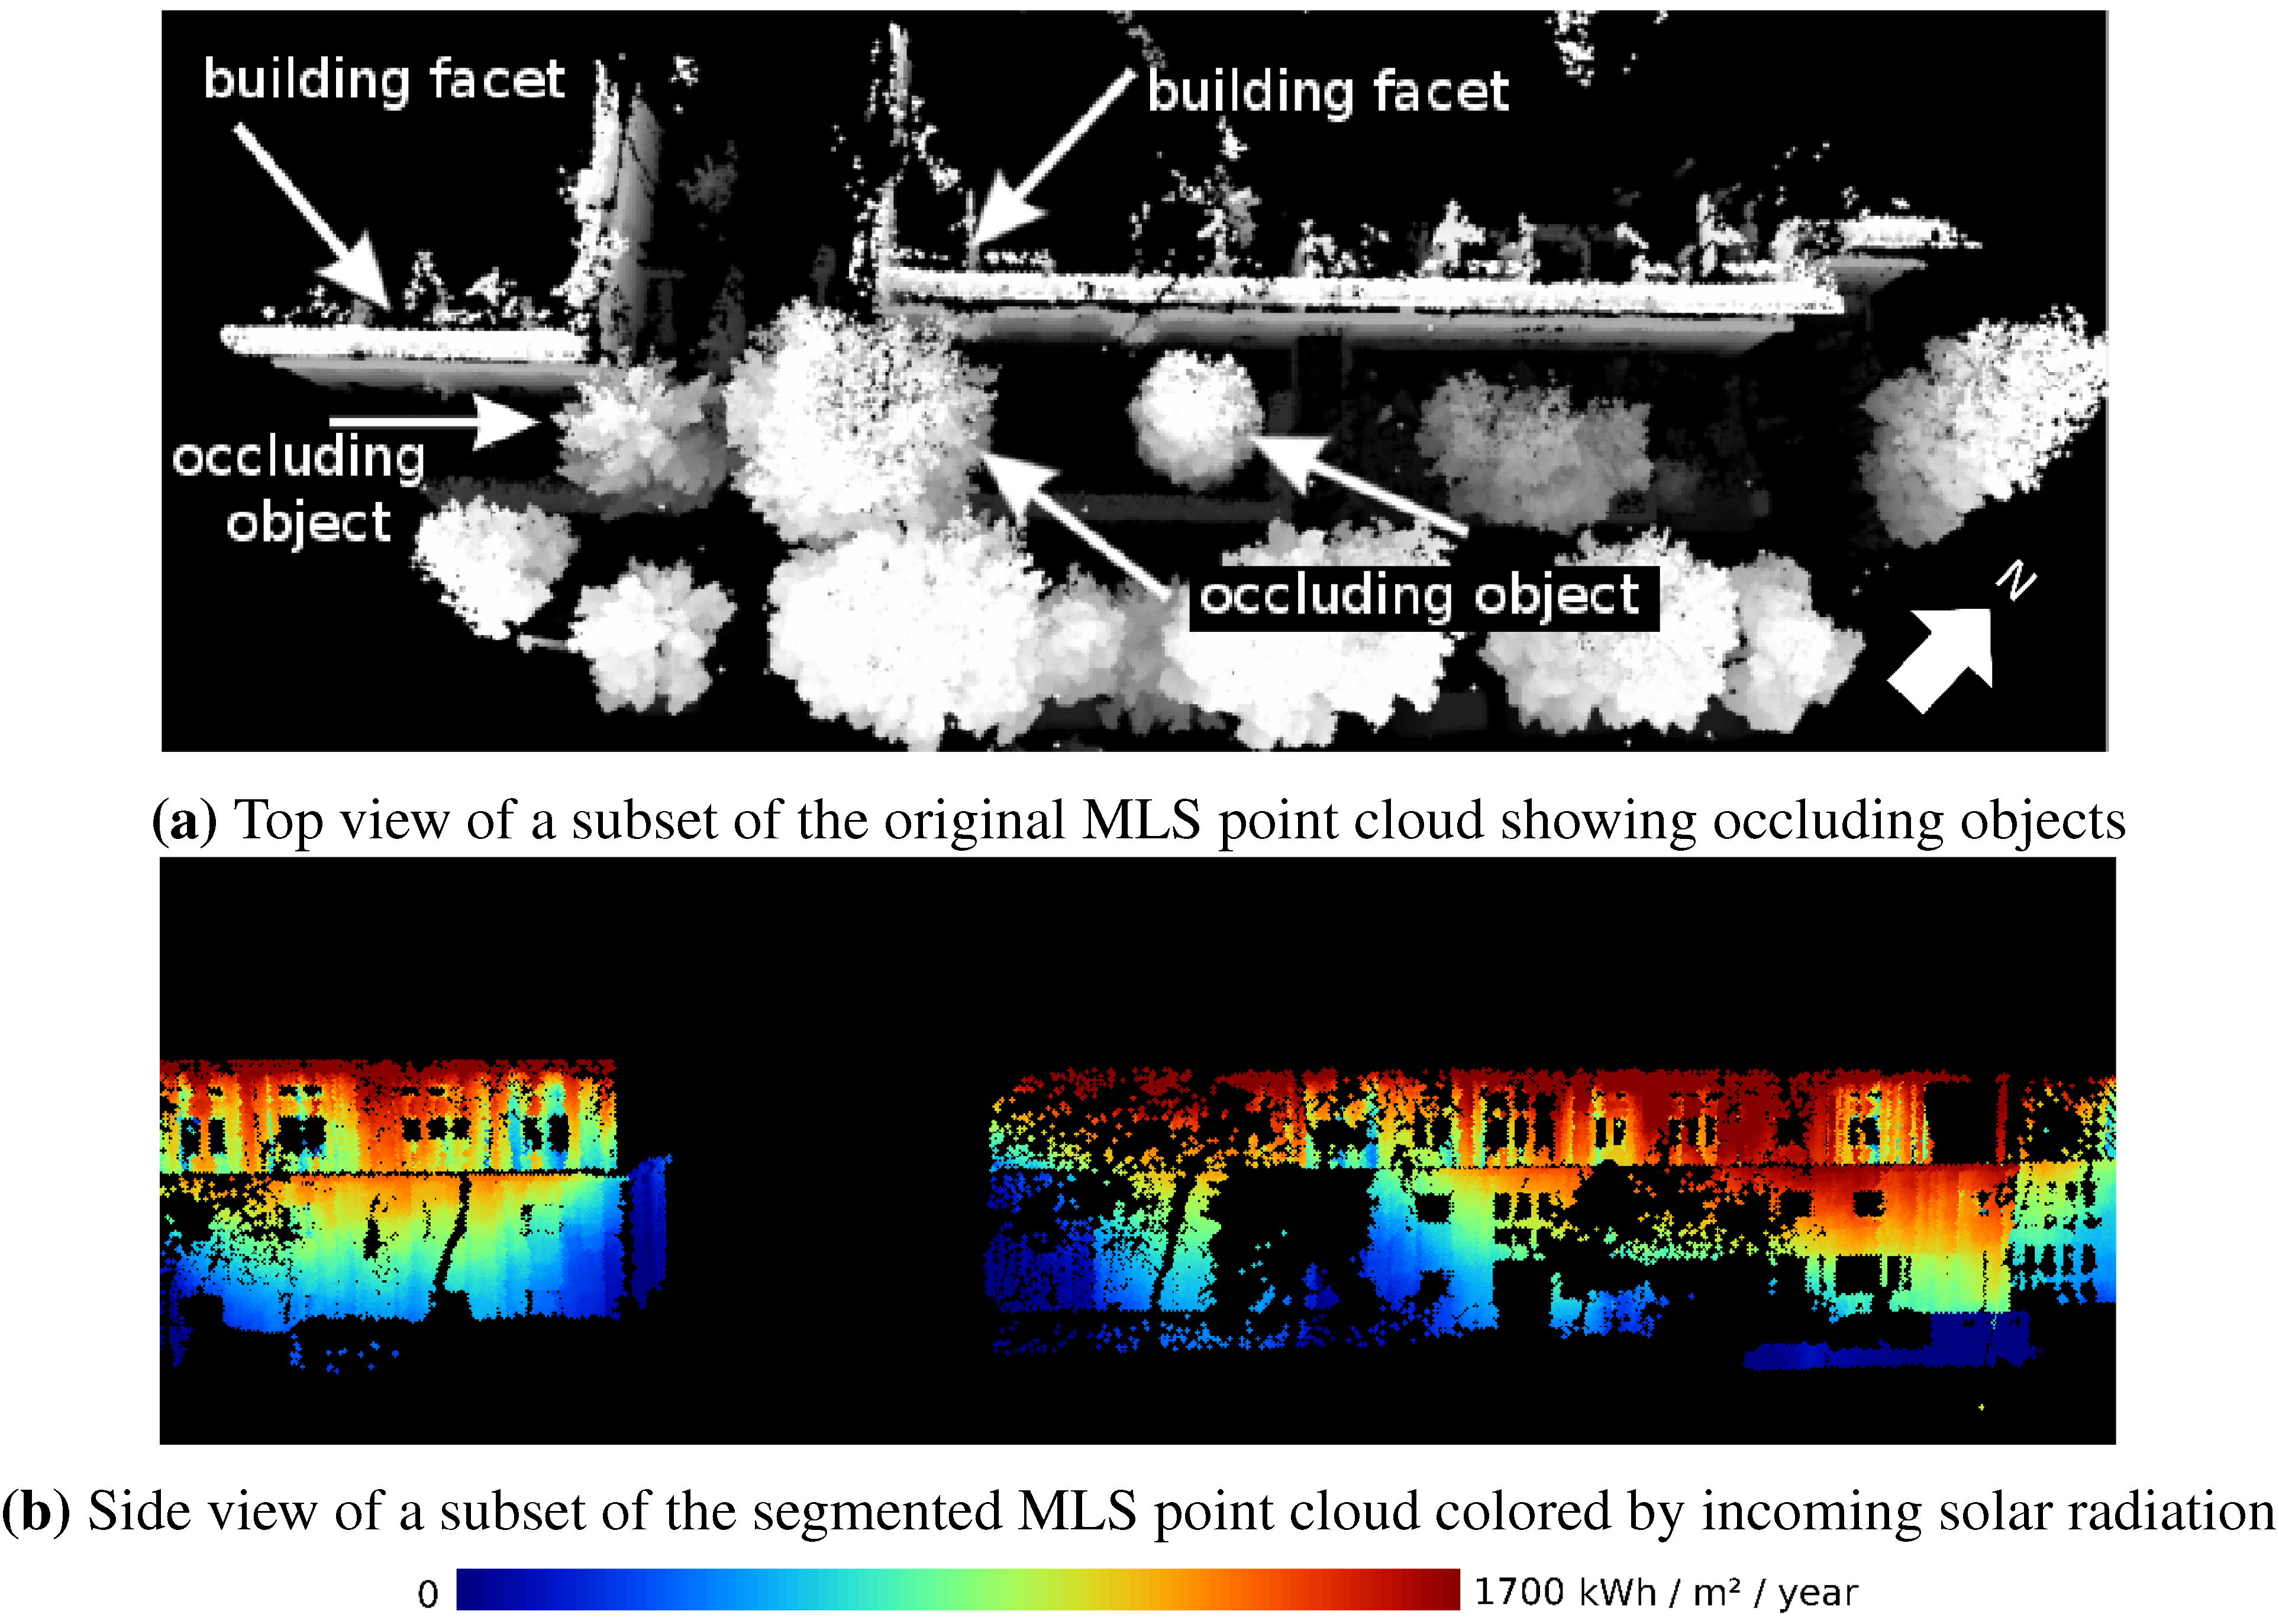
Shadowing Effects
Solar Potential Assessment
4. Results and Discussion
4.1. Segmentation, Classification and Area Calculation

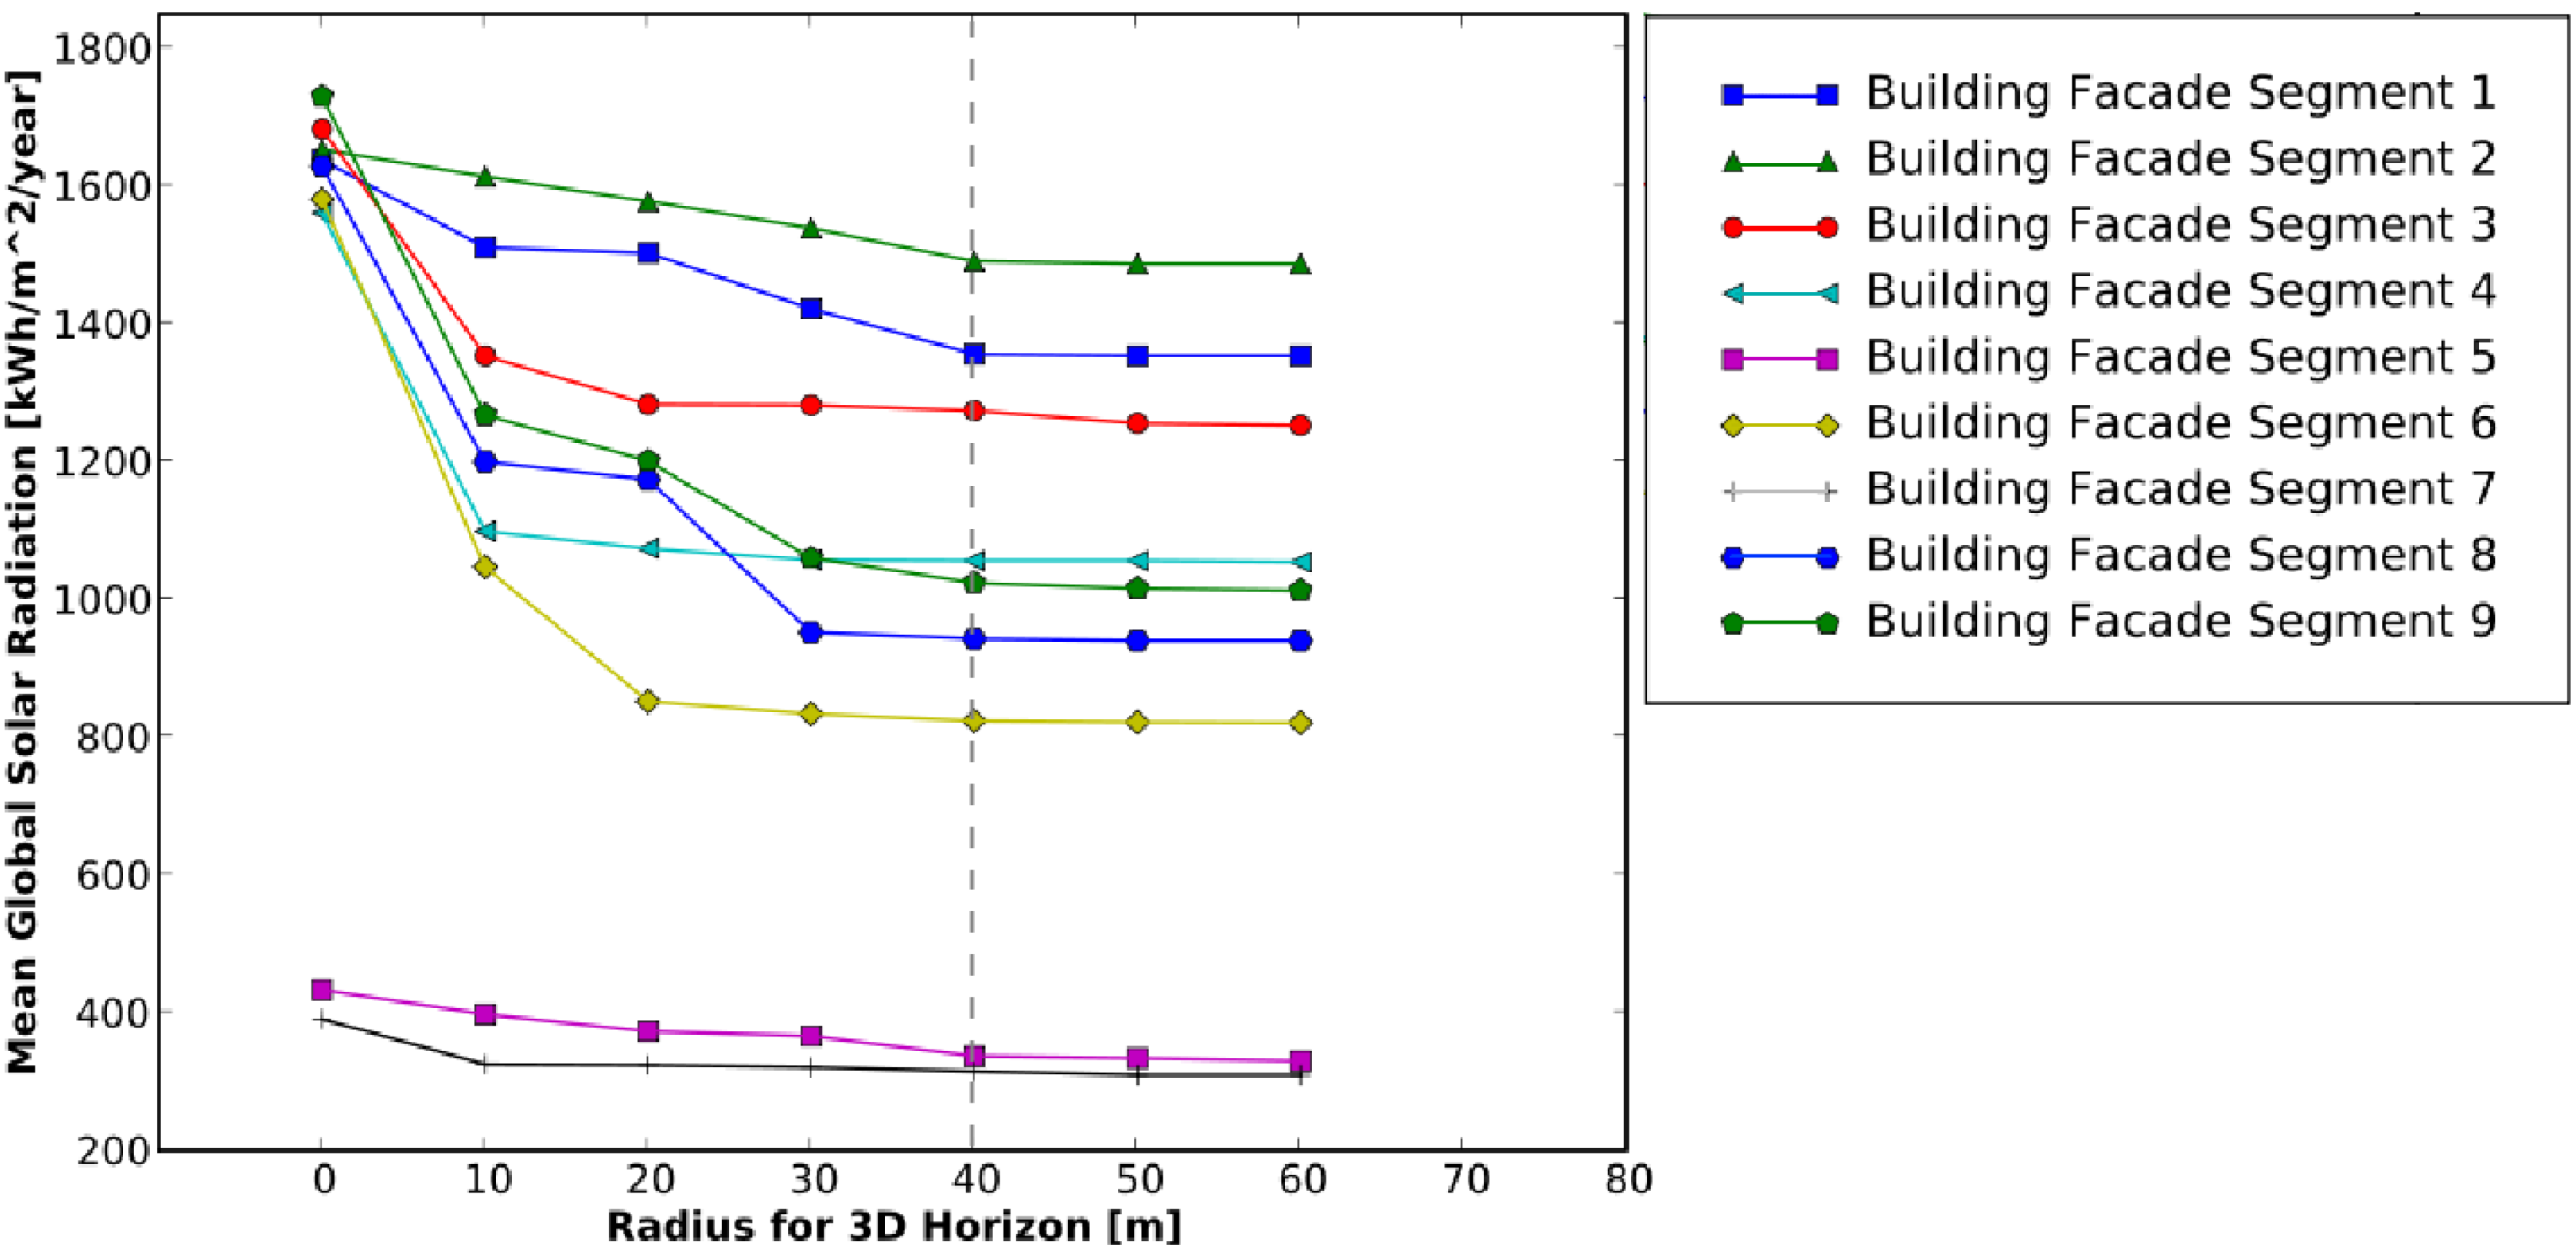
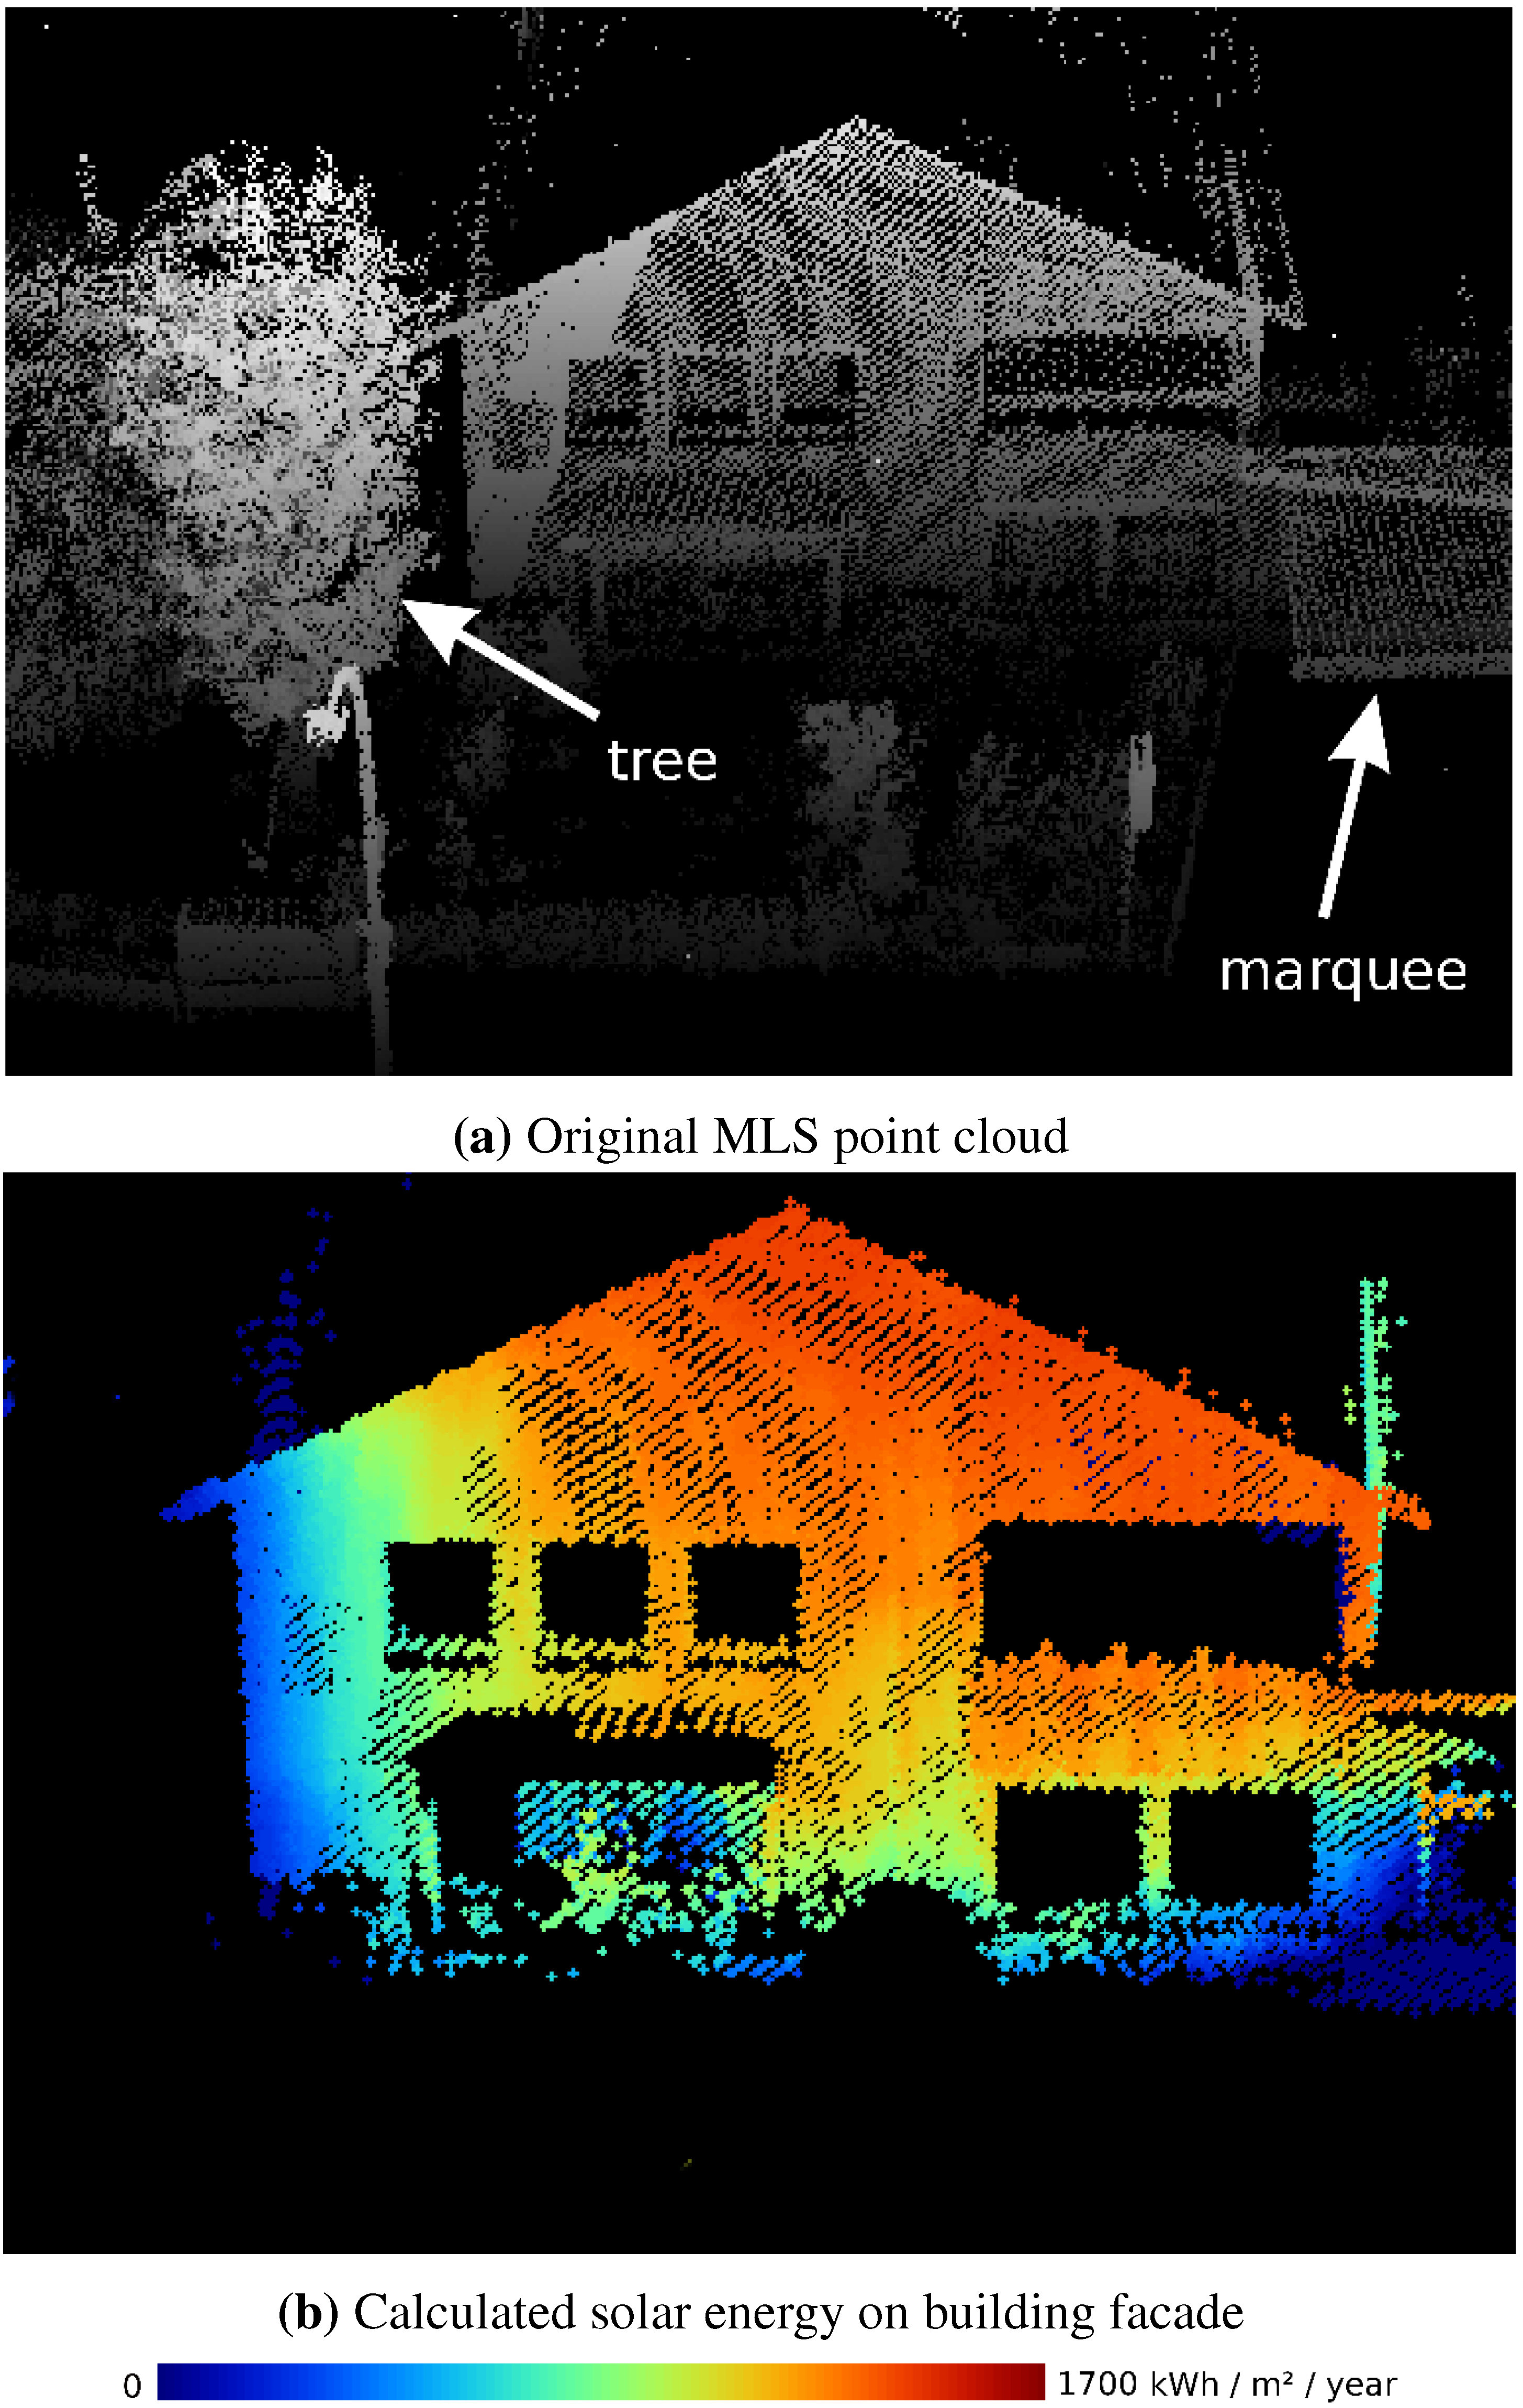
4.2. Solar Radiation Modeling


5. Summary and Conclusions
Acknowledgments
References
- Wehr, A.; Lohr, U. Airborne laser scanning an introduction and overview. ISPRS J. Photogramm. Remote Sens. 1999, 54, 68–82. [Google Scholar] [CrossRef]
- Vosselman, G.; Mass, H.G. Airborne and Terrestrial Laser Scanning; Whittles Publishing, CRC Press: Scotland, UK, 2010. [Google Scholar]
- Forlani, G.; Nardinocchi, C. Building detection and roof extraction in laser scanning data. In International Archives of the Photogrammetry, Remote Sensing and Spatial Information Sciences; ISPRS: Vienna, Austria, 2001; Volume 34. [Google Scholar]
- Matikainen, L.; Hyyppä, J.; Hyyppä, H. Automatic detection of buildings from laserscanner data for map updating. In International Archives of Photogrammetry, Remote Sensing and Spatial Information Sciences; ISPRS: Vienna, Austria, 2003; Volume 34, Part 3/W13, pp. 218–224. [Google Scholar]
- Alharthy, A.; Berthel, J. Detailed building reconstruction from airborne laser data using a moving surface method. In International Archives of Photogrammetry, Remote Sensing and Spatial Information Sciences; ISPRS: Vienna, Austria, 2004; Volume 35, Part B3, pp. 213–218. [Google Scholar]
- Rottensteiner, F.; Trinder, J.; Clode, S.; Kubik, K. Automated delineation of roof planes from lidar data. In International Archives of Photogrammetry, Remote Sensing and Spatial Information Sciences; ISPRS: Vienna, Austria, 2005; Volume 36, Part 3W/19, pp. 221–226. [Google Scholar]
- Rutzinger, M.; Rottensteiner, F.; Pfeifer, N. A comparison of evaluation techniques for building extraction from airborne laser scanning. IEEE J. Sel. Topics Appl. Earth Obs. Remote Sens. 2009, 2, 11–20. [Google Scholar] [CrossRef]
- Gorte, B. Planar feature extraction in terrestrial laser scans using gradient based range image segmentation. In International Archives of Photogrammetry, Remote Sensing and Spatial Information Sciences; ISPRS: Vienna, Austria, 2007; Volume 36, Part 3/W52, pp. 173–177. [Google Scholar]
- Dorninger, P.; Pfeifer, N. A comprehensiv automated 3D approach for building extraction, reconstruction, and regularization from airborne laser scanning point clouds. Sensors 2008, 8, 7323–7343. [Google Scholar] [CrossRef]
- Rutzinger, M.; Höfle, B.; Pfeifer, N. Object detection in airborne laser scanning data - an integrative approach on object-based image and point cloud analysis. In Object-Based Image Analysis: Spatial Concepts for Knowledge-Driven Remote Sensing Applications; Blaschke, T., Lang, S., Hay, G., Eds.; Springer-Verlag: Berlin/Heidelberg, Germany, 2008; pp. 645–662. [Google Scholar]
- Oude Elberink, S.; Vosselman, G. Building reconstruction by target based graph matching on incomplete laser data : Analysis and limitations. Sensors 2009, 9, 6101–6118. [Google Scholar] [CrossRef] [PubMed]
- Rutzinger, M.; Oude Elberink, S.; Pu, S.; Vosselman, G. Automatic extraction of vertical walls from mobile and airborne laser scanning data. In International Archives of Photogrammetry and Remote Sensing and Spatial Information Sciences; ISPRS: Vienna, Austria, 2009; Volume 38, Part 3/W8, pp. 7–12. [Google Scholar]
- Manandahar, D.; Shibasaki, R. Auto-extraction of urban features from vehicle-borne laser data. In Proceedings of Commission IV Symposium “Geospatial Theory, Processing and Applications”, Ottawa, ON, Canada, 9–12 July 2002; Volume 34, pp. 433–438.
- Schmitt, A.; Vögtle, T. An advanced approach for automatic extraction of planar surfaces and their topology from point clouds. Photogrammetrie, Fernerkundung und Geoinformation 2009, 1, 43–52. [Google Scholar] [CrossRef]
- Filin, S.; Pfeifer, N. Neighborhood systems for airborne laser data. Photogramm. Eng. Remote Sensing 2005, 71, 743–755. [Google Scholar] [CrossRef]
- Jochem, A.; Höfle, B.; Rutzinger, M.; Pfeifer, N. Automatic roof plane detection and analysis in airborne LiDAR point clouds for solar potential assessment. Sensors 2009, 9, 5241–5262. [Google Scholar] [CrossRef] [PubMed]
- Jochem, A.; Höfle, B.; Hollaus, M.; Rutzinger, M. Object detection in airborne LiDAR data for improved solar radiation modeling. In International Archives of the Photogrammetry, Remote Sensing and Spatial Information Sciences; ISPRS: Vienna, Austria, 2009; Volume 38, Part 3/W8, pp. 1–6. [Google Scholar]
- Rabbani, T.; Heuvel, F.; Vosselman, G. Segmentation of point clouds using smoothness constraints. In International Archives of Photogrammetry and Remote Sensing and Spatial Information Sciences; ISPRS: Vienna, Austria, 2006; Volume 36, pp. 248–253. [Google Scholar]
- Vosselman, G.; Klein, R. Visualisation and structuring of point clouds. In Airborne and Terrestrial Laser Scanning; Vosselman, G., Maas, H.-G., Eds.; Whittles Publishing: Scotland, UK, 2010; pp. 43–79. [Google Scholar]
- Vosselman, G.; Gorte, B.; Sithole, G.; Rabbani, T. Recognising structure in laser scanning point clouds. In International Archives of Photogrammetry, Remote Sensing and Spatial Information Sciences; ISPRS: Vienna, Austria, 2004; Volume 36, Part 8/W2, pp. 33–38. [Google Scholar]
- Vosselman, G. Advanced point cloud processing. In Photogrammetric Week 2009; Fritsch, D., Ed.; University of Stuttgart: Stuttgart, Germany, 2009. [Google Scholar]
- Vögtle, T.; Steinle, E.; Tóvári, D. Airborne laserscanning data for determination of suitable areas for photovoltaics. In International Archives of Photogrammetry, Remote Sensing and Spatial Information Sciences; ISPRS: Vienna, Austria, 2005; Volume 36, Part 3/W19, pp. 215–220. [Google Scholar]
- Kassner, R.; Koppe, W.; Schüttenberg, T.; Bareth, G. Analysis of the solar potential of roofs by using official lidar data. In International Archives of Photogrammetry, Remote Sensing and Spatial Information Sciences; ISPRS: Vienna, Austria, 2008; Volume 37, Part B4, pp. 399–403. [Google Scholar]
- Pagliaro, M.; Ciriminna, R.; Palmisano, G. BIPV: Merging the photovoltaic with the construction industry. Prog. Photovol.: Res. Appl. 2010, 18, 61–72. [Google Scholar] [CrossRef]
- Marsh, G. BIPV: Innovation puts spotlight on solar. Renewable Energy Focus 2008, 9, 62–67. [Google Scholar] [CrossRef]
- Benemann, J.; Chehab, O.; Schaar-Gabriel, E. Building-integrated PV modules. Sol. Energ. Mater. Sol. Cell. 2001, 67, 345–354. [Google Scholar] [CrossRef]
- Yang, H.; Lu, L. The optimum tilt angles and orientations of PV claddings for building-integrated photovoltaic (BIPV) applications. J. Sol. Energ. Eng. 2007, 129, 253–255. [Google Scholar] [CrossRef]
- Haala, N.; Peter, M.; Cefalu, A.; Kremer, J. Mobile Lidar Mapping For Urban Data Capture. In Proceedings of the 14th International Conference on Virtual Systems and Multimedia, Limassol, Cyprus, 20–25 October 2008; pp. 95–100.
- Barber, D.; Mills, J.; Smith-Voysey, S. Geometric validation of a ground-based mobile laser scanning system. ISPRS J. Photogramm. Remote Sens. 2008, 63, 128–141. [Google Scholar] [CrossRef]
- Rutzinger, M.; Höfle, B.; Oude Elbernik, S.; Vosselman, G. Feasibility of facade extraction from mobile laser scanning data. Photogrammetrie, Fernerkundung und Geoinformation 2011. In review. [Google Scholar]
- Optech Data Sheet. Optech Lynx Mobile Mapper Data Sheet; Technical Report; Optech Inc.: Vaughan, ON, Canada, 2008. [Google Scholar]
- Edelsbrunner, H.; Mücke, E. Three-dimensional alpha shapes. ACM Trans. Graph. 1994, 13, 43–72. [Google Scholar] [CrossRef]
- Höfle, B.; Geist, T.; Rutzinger, M.; Pfeifer, N. Glacier surface segmentation using airborne laser scanning point cloud and intensity data. In International Archives of Photogrammetry, Remote Sensing and Spatial Information Sciences; ISPRS: Vienna, Austria, 2007; Volume 36, pp. 195–200. [Google Scholar]
- Da, T. 2D Alpha Shapes. In CGAL-3.3 User and Reference Manual; Board, C.E., Ed.; CGAL Open Source Project; 2006. [Google Scholar]
- Hofierka, J.; Šúri, M. The Solar Radiation Model for Open Source GIS: Implementation and Applications. In Proceedings of Open Source GIS-GRASS Users Conference 2002, Trento, Italy, 11–13 September 2002.
- NREL. NREL 2000–SOLPOS Documentation; Technical Report; National Renewable Energy Laboratory, Center for Renewable Energy Resources Renewable Resource Data Center: Golden, CO, USA, 2002. [Google Scholar]
- Šúri, M.; Hofierka, J. A new GIS-based solar radiation model and its application to photovoltaic assessment. Trans. GIS 2004, 8, 175–190. [Google Scholar] [CrossRef]
- Pfeifer, N.; Briese, C. Geometrical aspects of airborne laser scanning and terrestrial laser scanning. In International Archives of Photogrammetry, Remote Sensing and Spatial Information Sciences; ISPRS: Vienna, Austria, 2007; Volume 36, pp. 311–319. [Google Scholar]
- Eisenbeiss, H. UAV Photogrammetry. Ph.D. Thesis, ETH Zürich, Institute of Geodesy and Photogrammetry, Zürich, Switzerland, 2009. [Google Scholar]
- Paterson, R.W.; Boyle, K.J. Out of sight, Out of mind? Using GIS to incorporate visibility in Hedonic Property Value Models. Land Economics 2002, 78, 417–425. [Google Scholar] [CrossRef]
- Bin, O.; Crawford, T.W.; Kruse, J.B.; Landry, C.E. Viewscapes and flood hazard: Coastal housing market response to amenities and risk. Land Economics 2008, 84, 434–448. [Google Scholar] [CrossRef]
© 2011 by the authors; licensee MDPI, Basel, Switzerland. This article is an open access article distributed under the terms and conditions of the Creative Commons Attribution license (http://creativecommons.org/licenses/by/3.0/.)
Share and Cite
Jochem, A.; Höfle, B.; Rutzinger, M. Extraction of Vertical Walls from Mobile Laser Scanning Data for Solar Potential Assessment. Remote Sens. 2011, 3, 650-667. https://doi.org/10.3390/rs3030650
Jochem A, Höfle B, Rutzinger M. Extraction of Vertical Walls from Mobile Laser Scanning Data for Solar Potential Assessment. Remote Sensing. 2011; 3(4):650-667. https://doi.org/10.3390/rs3030650
Chicago/Turabian StyleJochem, Andreas, Bernhard Höfle, and Martin Rutzinger. 2011. "Extraction of Vertical Walls from Mobile Laser Scanning Data for Solar Potential Assessment" Remote Sensing 3, no. 4: 650-667. https://doi.org/10.3390/rs3030650
APA StyleJochem, A., Höfle, B., & Rutzinger, M. (2011). Extraction of Vertical Walls from Mobile Laser Scanning Data for Solar Potential Assessment. Remote Sensing, 3(4), 650-667. https://doi.org/10.3390/rs3030650