1. Introduction
Laser ranging was applied for the first time in a fluvial environment in 1984, when Krabill
et al. [
1] studied the applicability of airborne non-scanning lidar (Light Detection and Ranging) for mapping the cross-section of a floodplain. After the integration of a scanning mechanism with lidar and an inertial measurements unit with GPS in the early 1990s, it has been possible to use first airborne laser scanning (ALS), then MLS data, in addition to static based terrestrial laser scanning (TLS), to improve the measurement and modeling of fluvial environments (e.g., [
2,
3,
4,
5,
6,
7,
8,
9,
10,
11,
12]). High-resolution ALS provides detailed information on topographical features of fluvial environments that influence the river hydraulics, giving, therefore, the potential to improve existing hydraulic models (e.g., [
13,
14,
15,
16,
17]). Furthermore, TLS can be applied to measure the grain-scale surface roughness needed in river flow modeling. Heritage and Milan [
7] showed that finer resolution of roughness leads to a better prediction of modeled flow velocity. The improved topographical data allows for better planning of the management of river hydraulics and erosion control (e.g., [
14,
18]) and better analysis of different flooding scenarios [
16]. Alho
et al. [
11,
19] showed that MLS offered a very effective method for surveying riverine topography compared to traditional TLS. In that study, 6 km of riverine topography was surveyed by the boat-mounted mobile laser scanner within 85 min, whereas TLS measurements of the point bars of the same area took over 8 hours.
The mobile laser scanner is a multi-sensor system that integrates various navigation and data-acquisition equipment, for instance on boats, for collecting point clouds along the river line. The navigation sensors typically include GPS receivers and an IMU (Inertial Measurement Unit), while the data acquisition sensors include terrestrial laser scanners and digital cameras; thus, the instruments are similar to ALS surveys. Recent studies on MLS systems and their accuracy as well as environmental modeling done with MLS can be found in [
20,
21,
22,
23,
24,
25,
26,
27,
28,
29,
30].
In addition to static modeling of the riverine topography, there is a great need to map the changes in riverine topography, since the geomorphology and topography of the river channel and surrounding floodplain are affected by the fluvial erosion and deposition processes, which vary from a constant grain-scale displacement to large-scale flood-related avulsions [
7,
14,
31].
In this paper, we study the feasibility of using MLS to map changes in riverine topography. We use a mobile laser scanner mounted on a boat (abbreviated as BoMMS, boat-based mobile mapping system) and on a cart (CartMMS) to detect the topography changes of a selected river reach. Subsequently, we then evaluate the accuracy of the methodology. The depicted methodology can be used in general in all topography change mapping with MLS.
2. Material and Methods
2.1. Test Site
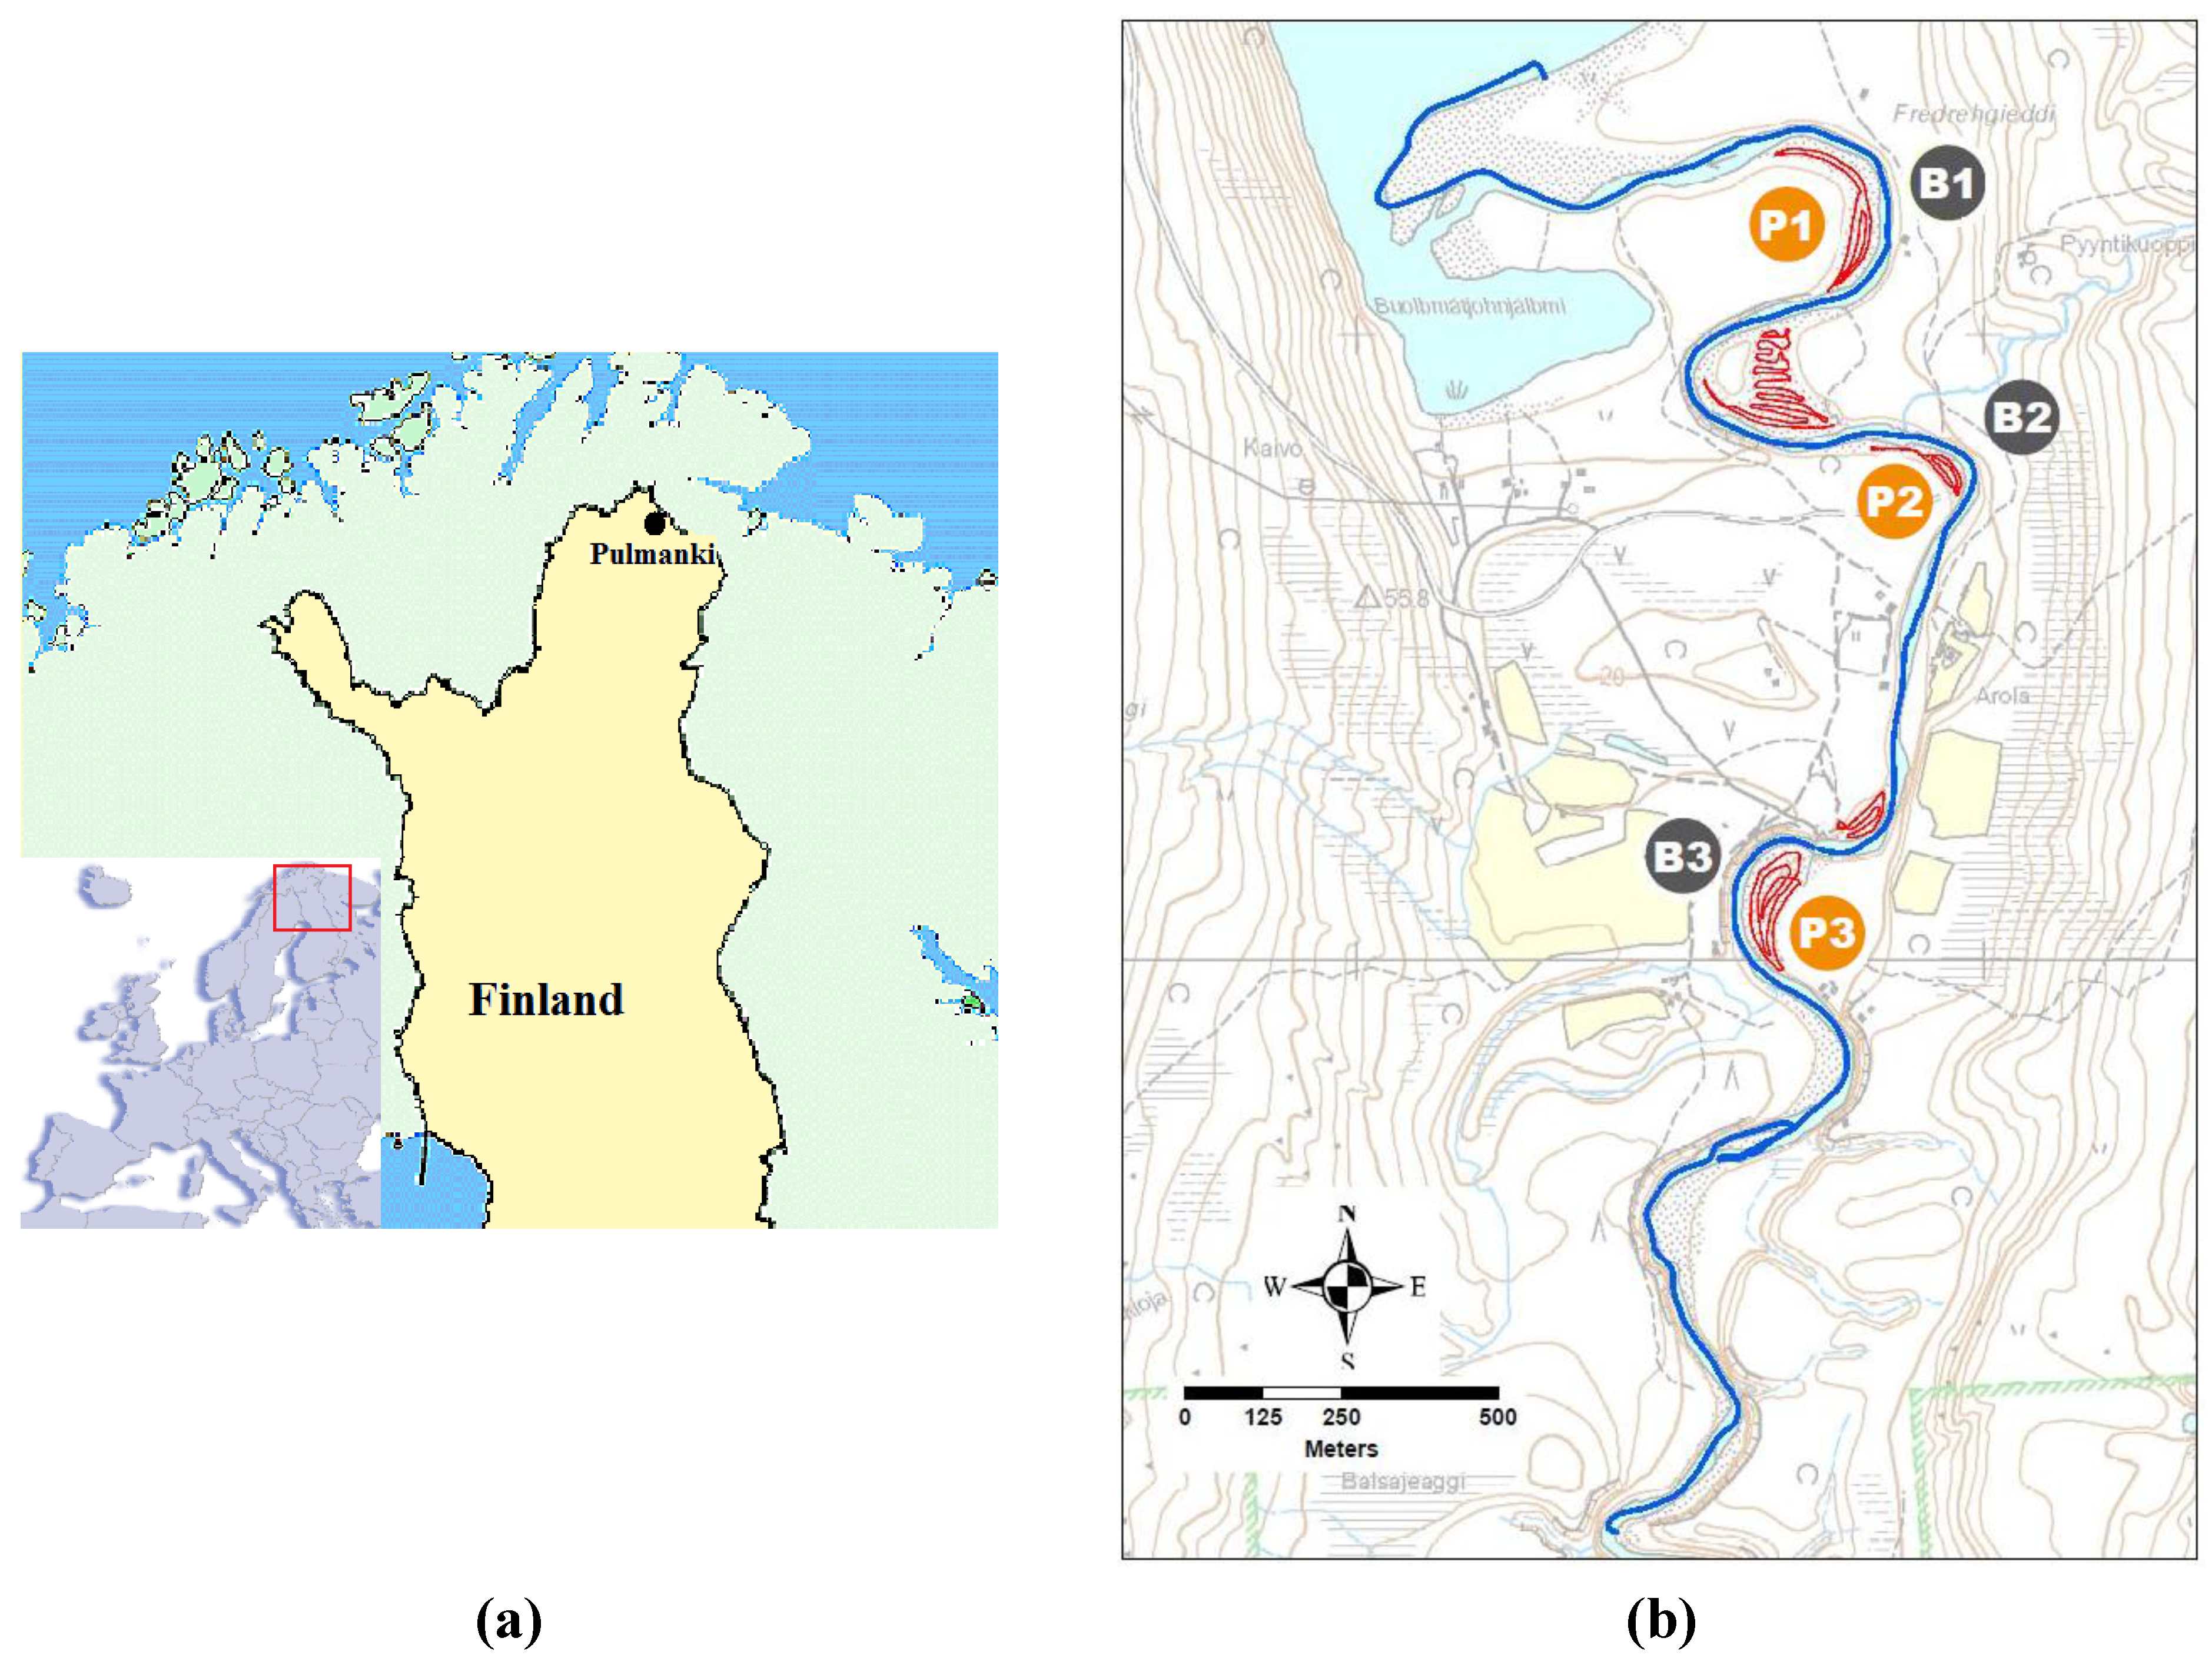
The test site is located on the Pulmanki River (
Figure 1(a)), a 58 km-long tributary of the River Tenojoki (Tana) in the sub-arctic, flowing across the border of Finland and Norway at latitude 69.95N and longitude 28.10E, where Lake Pulmanki divides the river into two parts. On the Finnish side, the river is about 10 km in length and builds up a small delta that flows into the lake. The river has eroded a 30 m deep and 20 to 50 m wide channel. The river is characterized by steep banks, is highly sensitive to erosion and relatively flat, and has large point bars and bush-type vegetation. During the spring flood period, the water level can be several meters higher than in autumn. A flood flow causes remarkable sediment transportation including heavy erosion and deposition along the river banks and point bars, which we studied using multitemporal laser scanning surveys. We conducted the measurements in the Pulmanki River in the late summer (late August–early September) of 2008 and 2009 when the water level was at its lowest, and point bars were as visible as possible. On the river banks, the low vegetation was dense, reducing the number of hits coming from bare ground.
Figure 1.
(a) The Pulmanki River is located in northern Finland. (b) The survey lines on the River in 2009. The blue curve gives the survey line for BoMMS. CartMMS data were collected from red areas. Reference areas are marked (Point Bar 1 abbreviated as P1; and Bank 1 abbreviated as B1).
Figure 1.
(a) The Pulmanki River is located in northern Finland. (b) The survey lines on the River in 2009. The blue curve gives the survey line for BoMMS. CartMMS data were collected from red areas. Reference areas are marked (Point Bar 1 abbreviated as P1; and Bank 1 abbreviated as B1).
2.2. Applied Systems and Data Collection
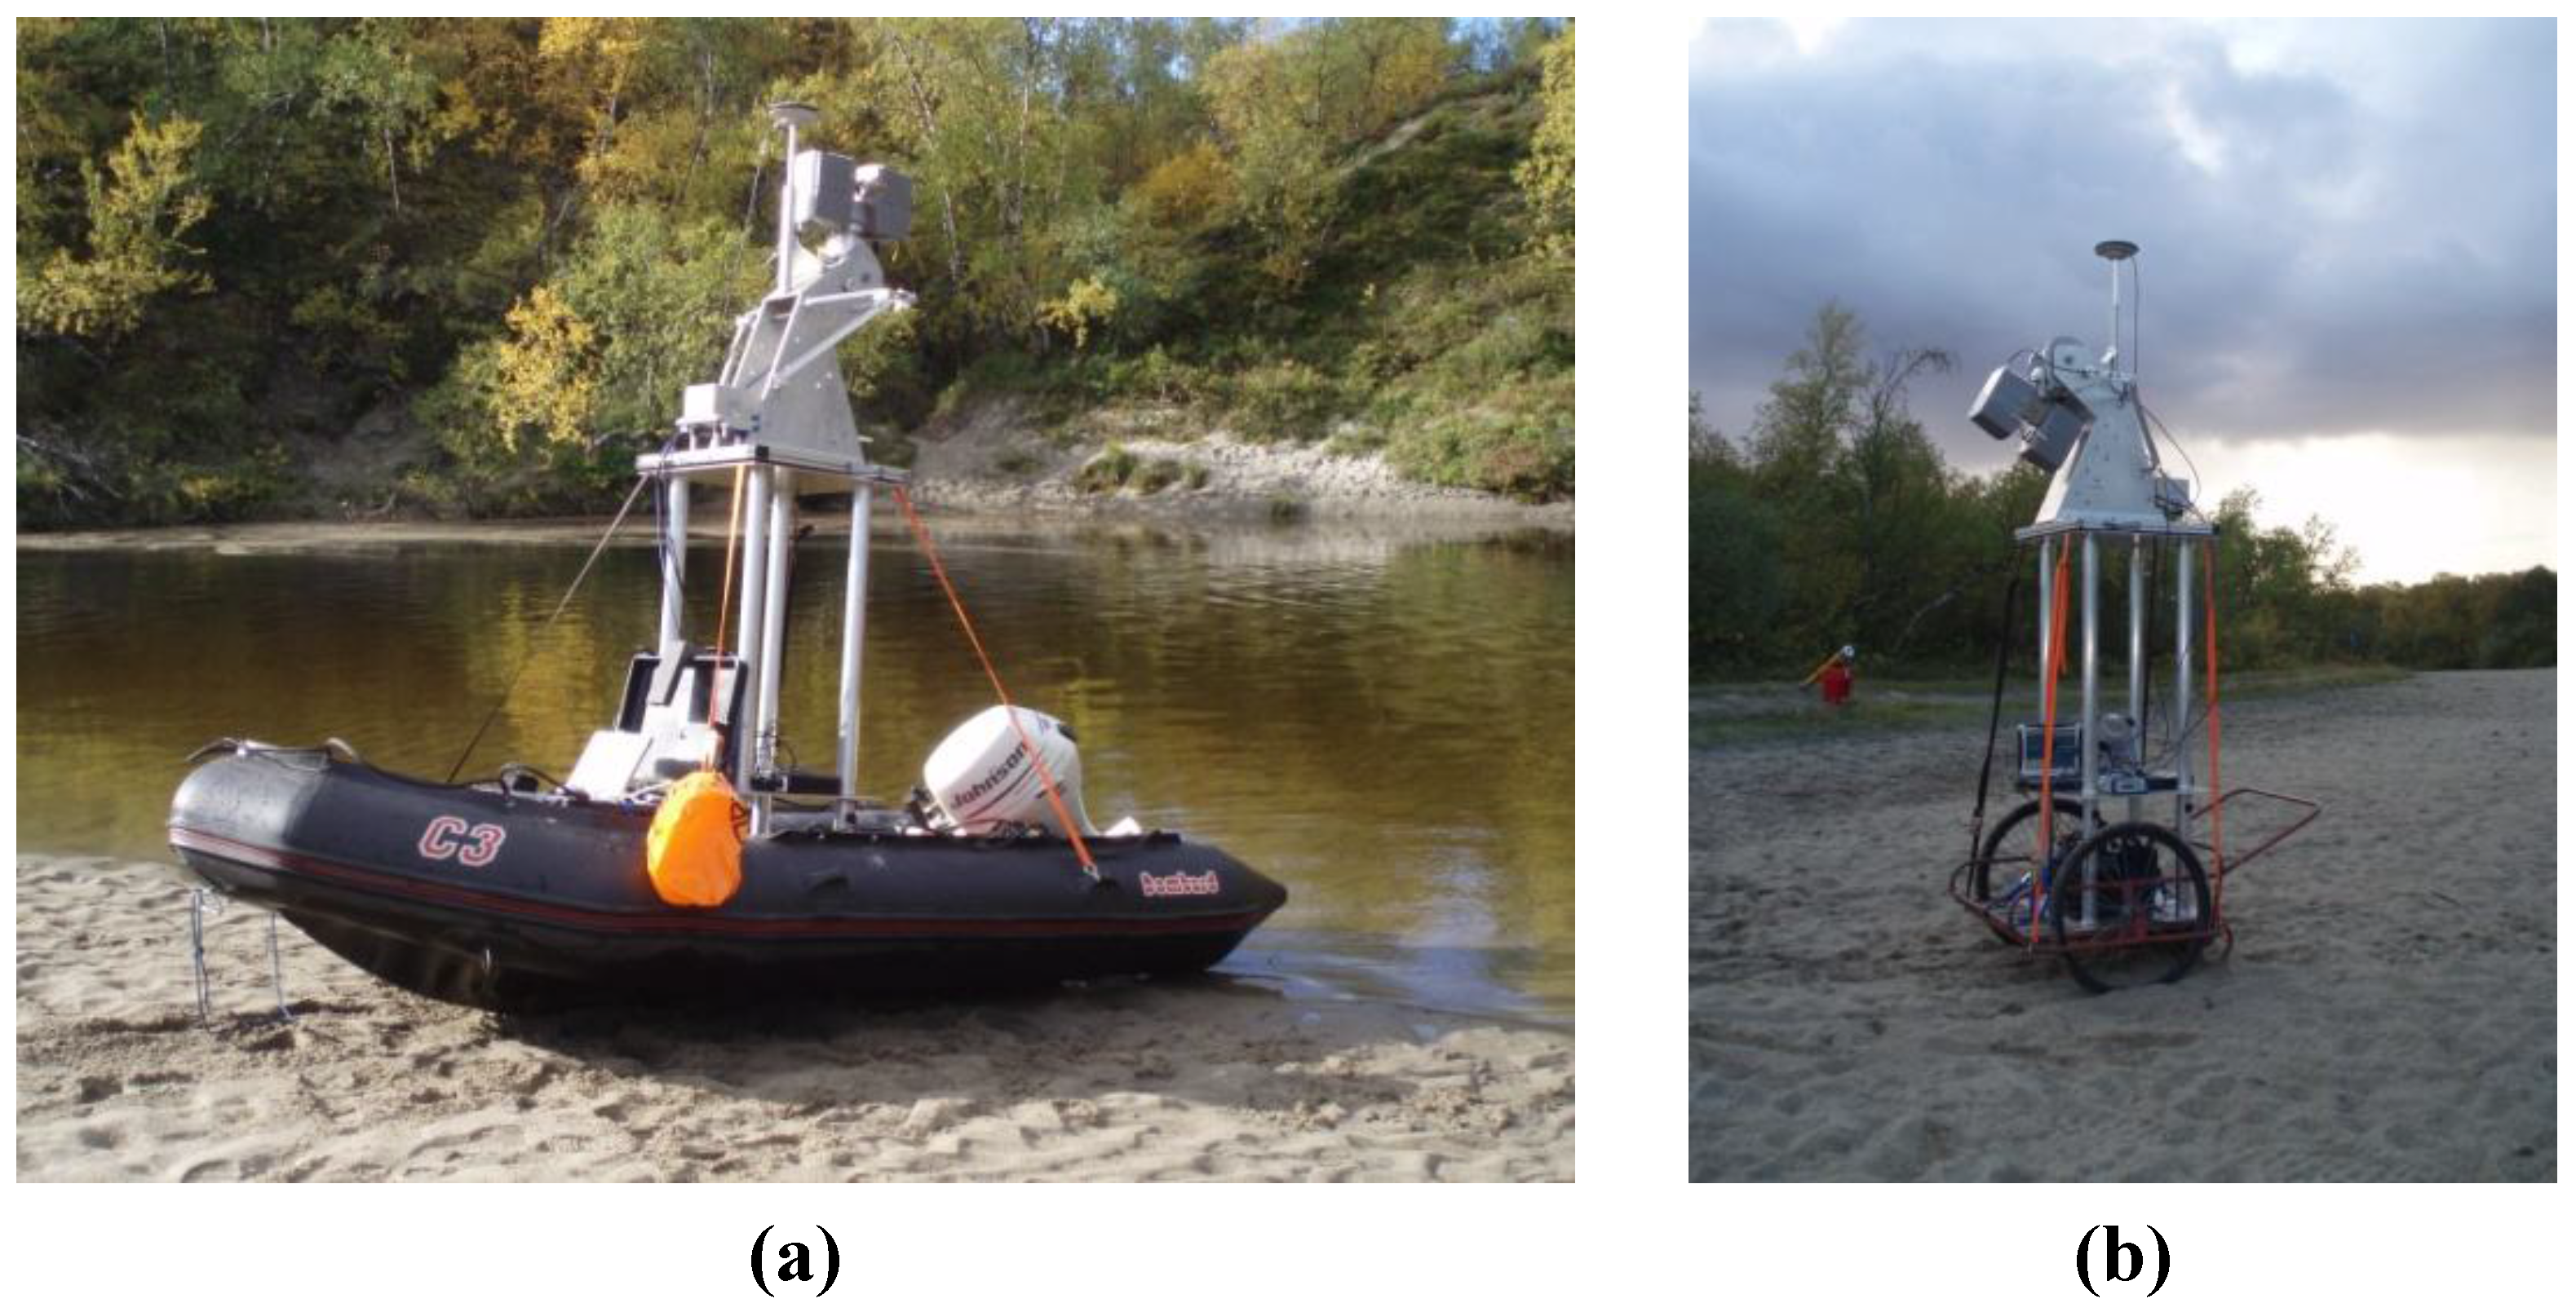
We conducted the measurements using a mobile laser scanner ROAMER [
32] mounted on a boat (
Figure 2(a)) and mounted on a manually-operated cart (
Figure 2(b)). The latter system was used especially for the point bars. We measured the riverine topography both in 2008 and in 2009 with the BoMMS with a length of 6 km. We used the CartMMS in 2009 for measuring five point bars. The applicable operating range of the ROAMER varied between 20 and 70 m depending on visibility. The scanner was mounted in a vertical orientation on the boat and tilted 60° from the horizon level in the cart. In the BoMMS, the support structure allowed for measurements in 2009 from a position that was 1 m higher (2.5 m from the water) than in 2008 (1.5 m from the water) in order to help measure the point bars from a better geometry. This modification increased the coverage of the measurements on a flat terrain, where the observation range of laser beams was approximately five to ten meters longer in 2009 than in 2008.
Figure 2.
The mobile laser scanners used in the study: (a) the BoMMS and (b) the CartMMS.
Figure 2.
The mobile laser scanners used in the study: (a) the BoMMS and (b) the CartMMS.
The BoMMS/ROAMER/CartMMS system utilizes a time-synchronized laser scanner (in 2008, the version FARO LS 880HE80 was applied; in 2009, the version FARO Photon80 was applied) in profiling mode, for measuring three-dimensional points from the surrounding objects. The system parameters used in the data collection from the Pulmanki River are summarized in
Table 1. The 15 Hz scanning frequency gives 8,000 data points during one revolution of the scanning mirror, in other words, 360°, resulting in an angular resolution of 0.045°, or a point spacing of 15.7 mm at a range of 20 m. The scanning frequency was modified to 30 Hz in 2009. The navigation sub-system recorded the GPS data at 1-second intervals, as well as the altitude and acceleration information from the IMU, at a frequency of 100 Hz. We set up a GPS reference station at a known point to provide the corrected information for the trajectory determination. During data collection, the length of the baseline from the reference station to the system varied from 0.5 km to 1.5 km. The synchronization of the scanning and imaging sub-systems was carried out using bi-trigger synchronization and the event log was recorded by the GPS receiver. We computed the trajectory in post-processing and parsed the event log to give temporally synchronized georeferences for each of the laser points. The raw laser points were subsequently transformed into a 3D point cloud in a mapping coordinate system according to trajectory information.
MLS typically measures objects from a wheeled vehicle that usually moves at a steady speed; this produces a three-dimensional point cloud, the point spacing of which is almost uniform at a given range. In a boat installation, the speed and orientation of the boat easily change in accordance with the river current, which caused the point density to vary. As an example, in shallow water the boat can move slowly, which increases the point density, and, when turning fast, the density can deteriorate substantially.
Table 1.
Laser scanning system parameters.
Table 1.
Laser scanning system parameters.
| Mobile laser scanner ROAMER |
|---|
| Scanner | 2008: FARO LS 880HE80, 2009: FARO Photon80 |
| Point measurement rate | 120 kHz |
| Scanning frequency | 15/30 Hz |
| Sensor position from horizon level | 90° BoMMS, −60° CartMMS |
| Navigation system | NovAtel SPAN (DL 4plus GPS and Honeywell HG1700 AG11 IMU) |
| TLS |
| Scanner | Leica HDS6000 |
| Point measurement rate | Max. 500 kHz, typical 100 kHz |
| Angular resolution | 0.036° (with “High” resolution setting) |
We used a Leica HDS6000 terrestrial laser scanner to provide reference data for the BoMMS and CartMMS data verification. The HDS6000 data was acquired with a “High” resolution setting, providing a point spacing of 6 mm on an orthogonal target at 10 m distance from the scanner. We positioned the scan stations using VRS-GPS (Virtual Reference Stations) and applied pre-defined calibration offsets between the two systems, that is to say, the scanner origin and GPS antenna phase centre. We erected a single sphere target in order to provide an orientation for each of the scans. We periodically moved the sphere target so that its distance to the scanner remained reasonable relative to the scanning resolution used, and we measured its location using the VRS-GPS. For each scan, the sphere target was detected from the laser data and a template sphere was matched to the selected points reflected from the target to find its centre point. Subsequently, we transformed the scans to global coordinates, according to the measured scanner and sphere target locations. The precision of the reference point clouds was, thus, better than 1 cm.
2.3. Data Processing
The data processing chain for accuracy assessment and change detection is depicted in
Figure 3. We converted profile laser data into three dimensions during the georeferencing phase, and assigned each of the mobile laser points (the BoMMS and CartMMS) the appropriate time stamp, which we coupled with the trajectory information on the scanner’s location and altitude. The points from the TLS measurements were georeferenced using external scanner coordinates from the VRS-GPS survey, as described in
Section 2.1. The point clouds were georeferenced in a three-dimensional geocentric WGS84 (World Geodetic System 1984) frame.
Figure 3.
The processing chain for point cloud data.
Figure 3.
The processing chain for point cloud data.
We filtered the point cloud data using Terrascan software [
33] and its point filtering tools. Due to the phase-based approach of our mobile laser system, the number of false points is higher than in pulse-based systems. We performed the point filtering by removing points which had an intensity value less than a defined threshold. This removed points from the air (typically dark) and below ground, as well as some real hits from the targets far from the scanner or with low reflectivity. We also removed the air points by computing the number of points within a certain radius in the air and removing the points if the density was less than the threshold. In our study, the system-specific thresholds applied were 500 (intensity threshold, scale 0–2,044) and 10 pts within a 50 cm-radius sphere.
The ground point classification was performed in the Terrascan [
33]. The DEMs were formed from the classified ground points using both triangulated irregular network (TIN) [
34] and regular grid approaches. On the non-vegetated point bars the ground point density was 100–1,000 points/m
2. The ground point density was much lower (1–30 points/m
2) on the river banks, where the low vegetation was dense and reduced the number of hits coming from bare ground.
We tested the accuracy of the BoMMS and CartMMS for elevation modeling by comparing the DEMs created with the 2008 and 2009 BoMMS and the 2009 CartMMS data with reference points collected with static TLS measurements depicted in detail in
Section 2.2. To validate our data, we selected the reference areas from three point bars and the neighboring river banks (
Figure 1(b)) for a more detailed estimation of the DEM’s accuracy. The surface areas of reference are included in
Table 2. The areas were close to the shoreline and the average distance from the boat was 20–30 m and from the cart 2–20 m. The point bars were used as a reference to check the quality of the DEMs which were used in change detection. The river banks were selected for studying on how well the ground surface could be mapped on the densely vegetated areas.
For the demonstration of the change detection possibilities, we created and verified the difference in the DEMs between BoMMS 2008 and 2009 using the corresponding difference model created with static TLS. The change detection demonstration site is shown in
Figure 4.
We calculated the quality parameter RMSE using elevations calculated for MLS (zLidar) and reference (zSurvey). Terrestrial laser data served as the reference data.
We also included a systematic error (bias, average of the differences between MLS, DEM and reference points) in
Table 2.
3. Results
3.1. DEM Accuracy
Table 2 summarizes the DEM accuracies obtained for directly georeferenced laser data. In 2008, we obtained the best accuracies for the point bars, in which RMSE ranged from 5.5 to 17.6 cm, including a bias from −4.3 to 17.4 cm. Thus, the main source of error was systematic in nature. We also found a systematic heading error. For the river bank, the corresponding errors were 20.3–28.4 cm and −22.5–−2.1 cm.
Table 2.
BoMMS 2008, BoMMS 2009 and CartMMS 2008 DEM accuracies (m).
Table 2.
BoMMS 2008, BoMMS 2009 and CartMMS 2008 DEM accuracies (m).
| Target | Areas (m2) | BoMMS 2008 | BoMMS 2009 | CartMMS 2009 |
|---|
| RMSE | Bias | RMSE | Bias | RMSE | Bias |
|---|
| Point Bar 1 | 1,031 | 0.088 | 0.075 | 0.108 | 0.104 | 0.051 | −0.018 |
| Point Bar 2 | 1,045 | 0.176 | 0.174 | 0.122 | 0.120 | 0.040 | 0.024 |
| Point Bar 3 | 1,772 | 0.055 | −0.043 | 0.104 | −0.072 | 0.053 | 0.006 |
| Bank 1 | 1,072 | 0.254 | −0.225 | 0.157 | −0.057 | – | – |
| Bank 2 | 1,041 | 0.203 | −0.021 | 0.212 | −0.065 | – | – |
| Bank 3 | 485 | 0.284 | −0.083 | 0.244 | 0.082 | – | – |
| Overall | 6,446 | 0.150 | −0.003 | 0.150 | 0.019 | 0.042 | 0.019 |
In 2009, we obtained the best accuracies with the CartMMS for point bars having an RMSE between 4.0 and 5.3 cm and a bias of −1.8 to 2.4 cm. With BoMMS, the corresponding errors for the point bars were 10.4–12.2 cm and −7.2–12.0 cm. For river banks using the BoMMS, we obtained an RMSE of 15.7–24.4 cm, with a bias of −6.5 to 8.2 cm.
We noticed that a clear systematic error existed in both BoMMS data sets. The error was derived from the calculation of the GPS-IMU data. After correcting for the systematic error, we obtained an RMSE of 3.0, 2.3 and 7.6 cm for the three point bars selected in 2009, while the corresponding figures for the 2008 data were 4.6, 2.9 and 3.6 cm.
Table 3 depicts the DEM accuracies obtained after correction.
Table 3.
BoMMS 2008 and BoMMS 2009 DEM accuracies for point bars after correction of the systematic error.
Table 3.
BoMMS 2008 and BoMMS 2009 DEM accuracies for point bars after correction of the systematic error.
| Target | BoMMS 2008 | BoMMS2009 |
|---|
| RMSE | RMSE |
|---|
| Point Bar 1 | 0.046 | 0.030 |
| Point Bar 2 | 0.029 | 0.023 |
| Point Bar 3 | 0.036 | 0.076 |
3.2. Change Detection Accuracy
We estimated change detection accuracy by comparing the difference in DEMs obtained in 2008 and 2009 with the BoMMS with the reference change model obtained with the corresponding DEMs acquired with the terrestrial laser scanner.
Figure 4 shows the test area and
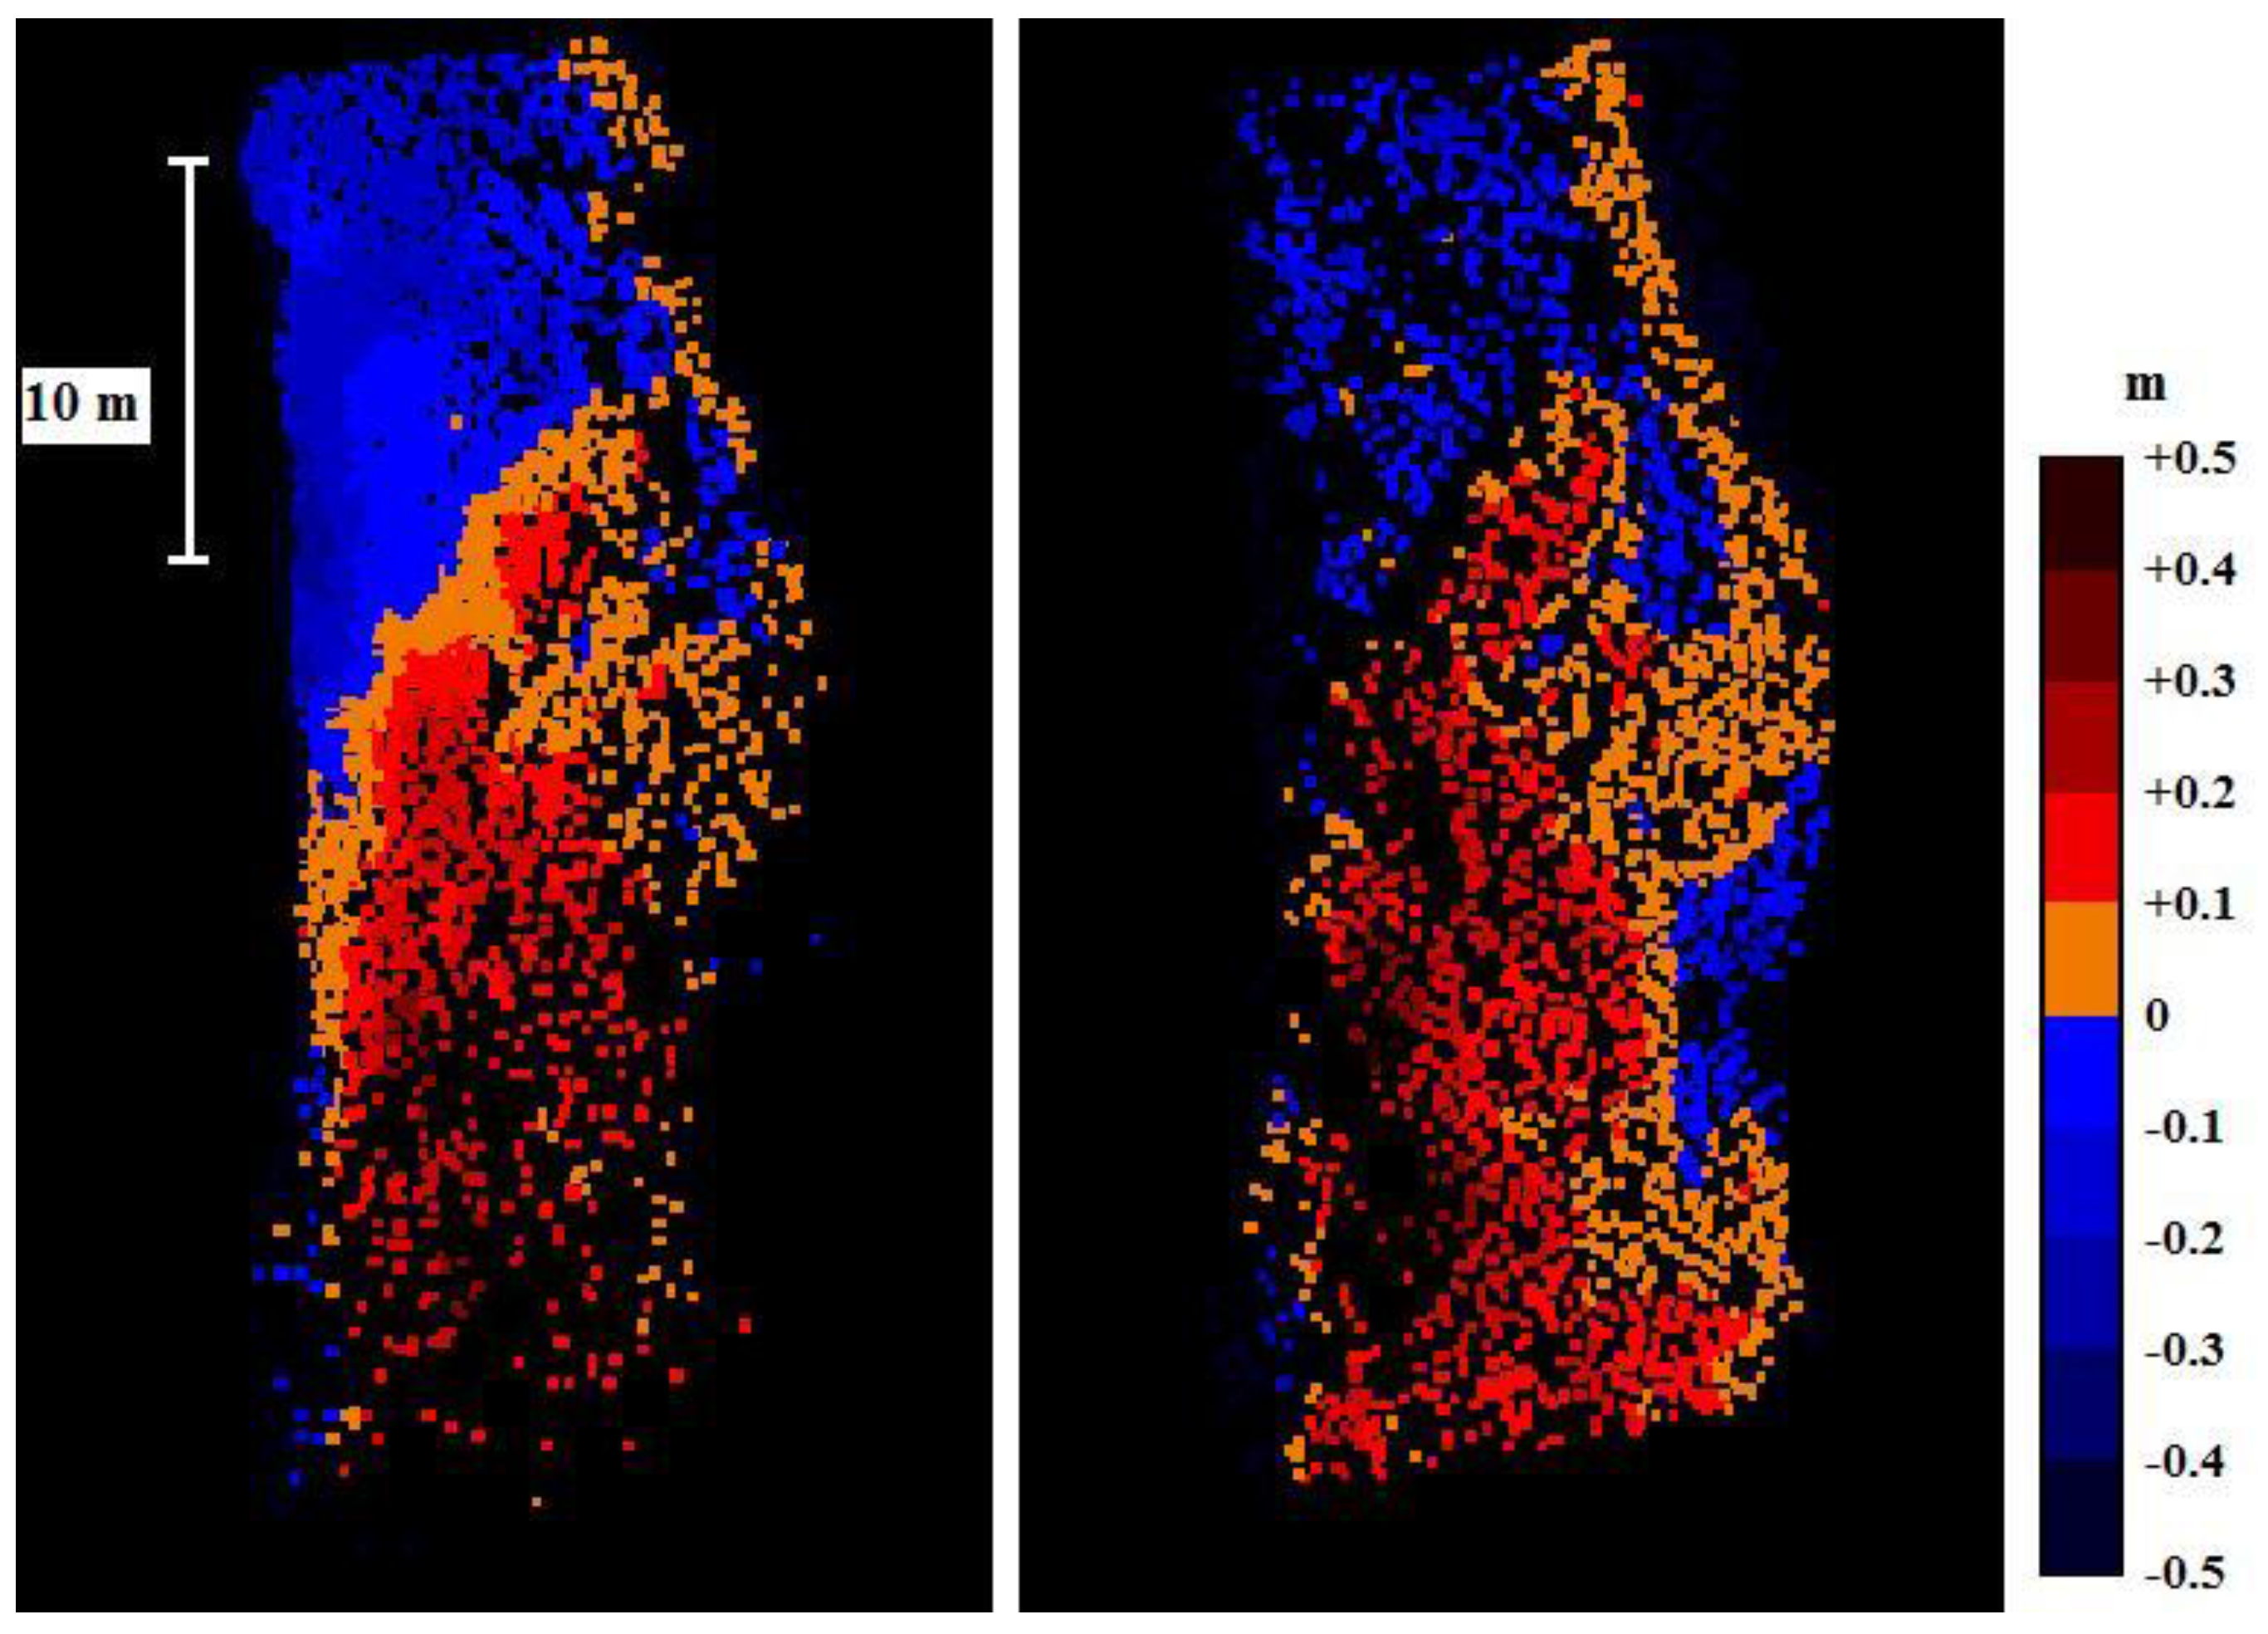
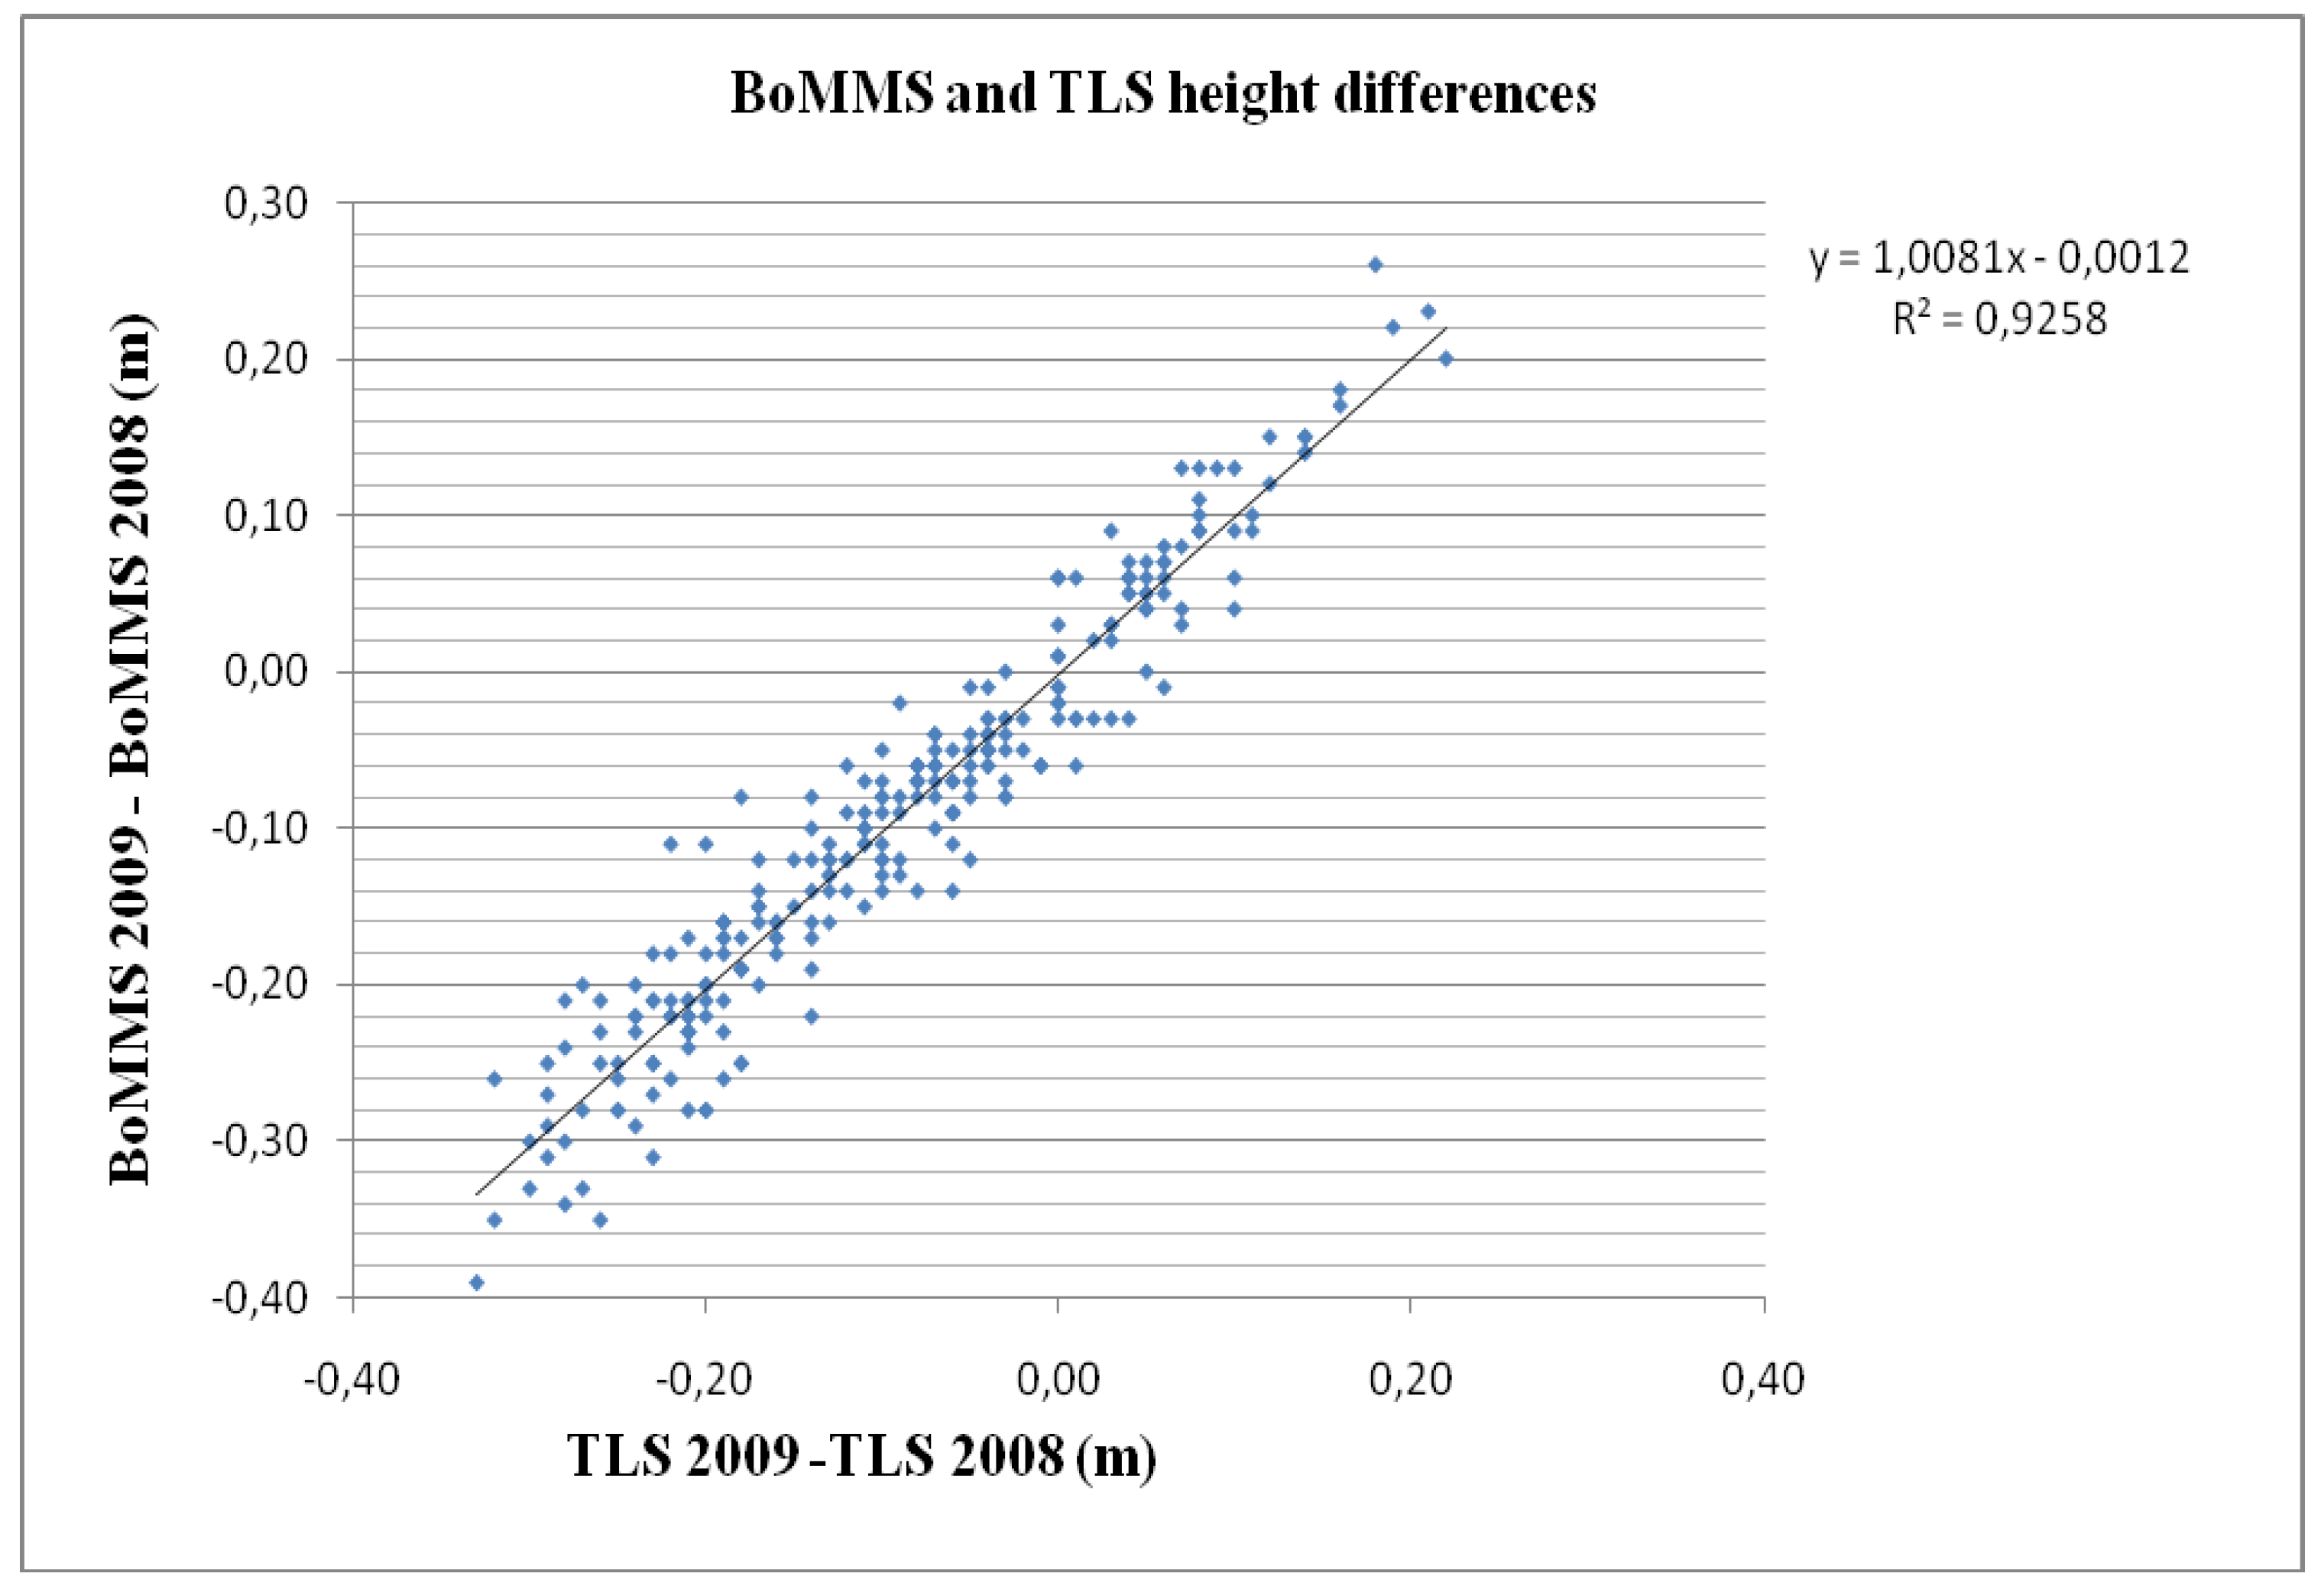
Figure 5 shows the obtained reference change map (left) compared to the change map created with a mobile laser (right). We found the square of the sample correlation coefficient (R
2) between the elevation changes to be 0.93 and the standard deviation of error 3.4 cm (
Figure 6). Volume analysis of the TLS data revealed that the erosion within the study area in 2009 was 12.5 m
3 while the deposition volume added up to 29.9 m
3. BoMMS data analyses showed equal behavior and the corresponding values were 11.5 and 32.5 m
3. The small bias in the results may be caused by a slightly different spatial distribution of points, especially in areas close to the water line, where the changes are more prominent. That could explain the larger difference in the computed deposition volume, as the lower part of the study area (
Figure 5) shows poor points distribution for the TLS data.
Figure 4.
Panoramic image of Point Bar 1. The marked area was selected for assessing change detection accuracy. Flow direction to the right.
Figure 4.
Panoramic image of Point Bar 1. The marked area was selected for assessing change detection accuracy. Flow direction to the right.
Figure 5.
TLS-derived (left) and BoMMS-derived (right) change maps.
Figure 5.
TLS-derived (left) and BoMMS-derived (right) change maps.
Figure 6.
Correlation between TLS- and BoMMS-derived elevation changes.
Figure 6.
Correlation between TLS- and BoMMS-derived elevation changes.
In the analysis of differences between two DEMs, a level of significant change detection (LoD) is also generally used (e.g., [
35,
36,
37]). This analysis uses the standard deviation of error (SDE) on each surface and specifies the threshold LoD at a given confidence interval, so that;
where
Ucrit is the critical threshold error, σ
1 and σ
2 are the standard deviation of error on each surface respectively and
t is the critical
t-value at the chosen confidence level. The
t-value may be set at t > 1 (1σ), in which case the confidence limit for the detection of change is 68 %, or at t > 1.96 (2σ), in which case the confidence limit is equal to 95 %. The standard deviation of errors in DEMs obtained with the BoMMS were 4.6 cm (2008) and 3.0 cm (2009) on the marked area (
Figure 4). The derived LoD for MLS-based a DEM of difference (DoD) was 10.8 cm when the confidence limit was 95 %. The limitation of this approach is that the error is uniform across the surface and it may result in under- and/or over-estimates of elevation changes in some parts of the DEM. One improvement would be to use a spatially distributed LoD that could be applied to a DoD (e.g., [
38]). The point density is also a very important factor that can be improved by using MLS methods.
3.3. Demonstration of Change Detection Possibilities
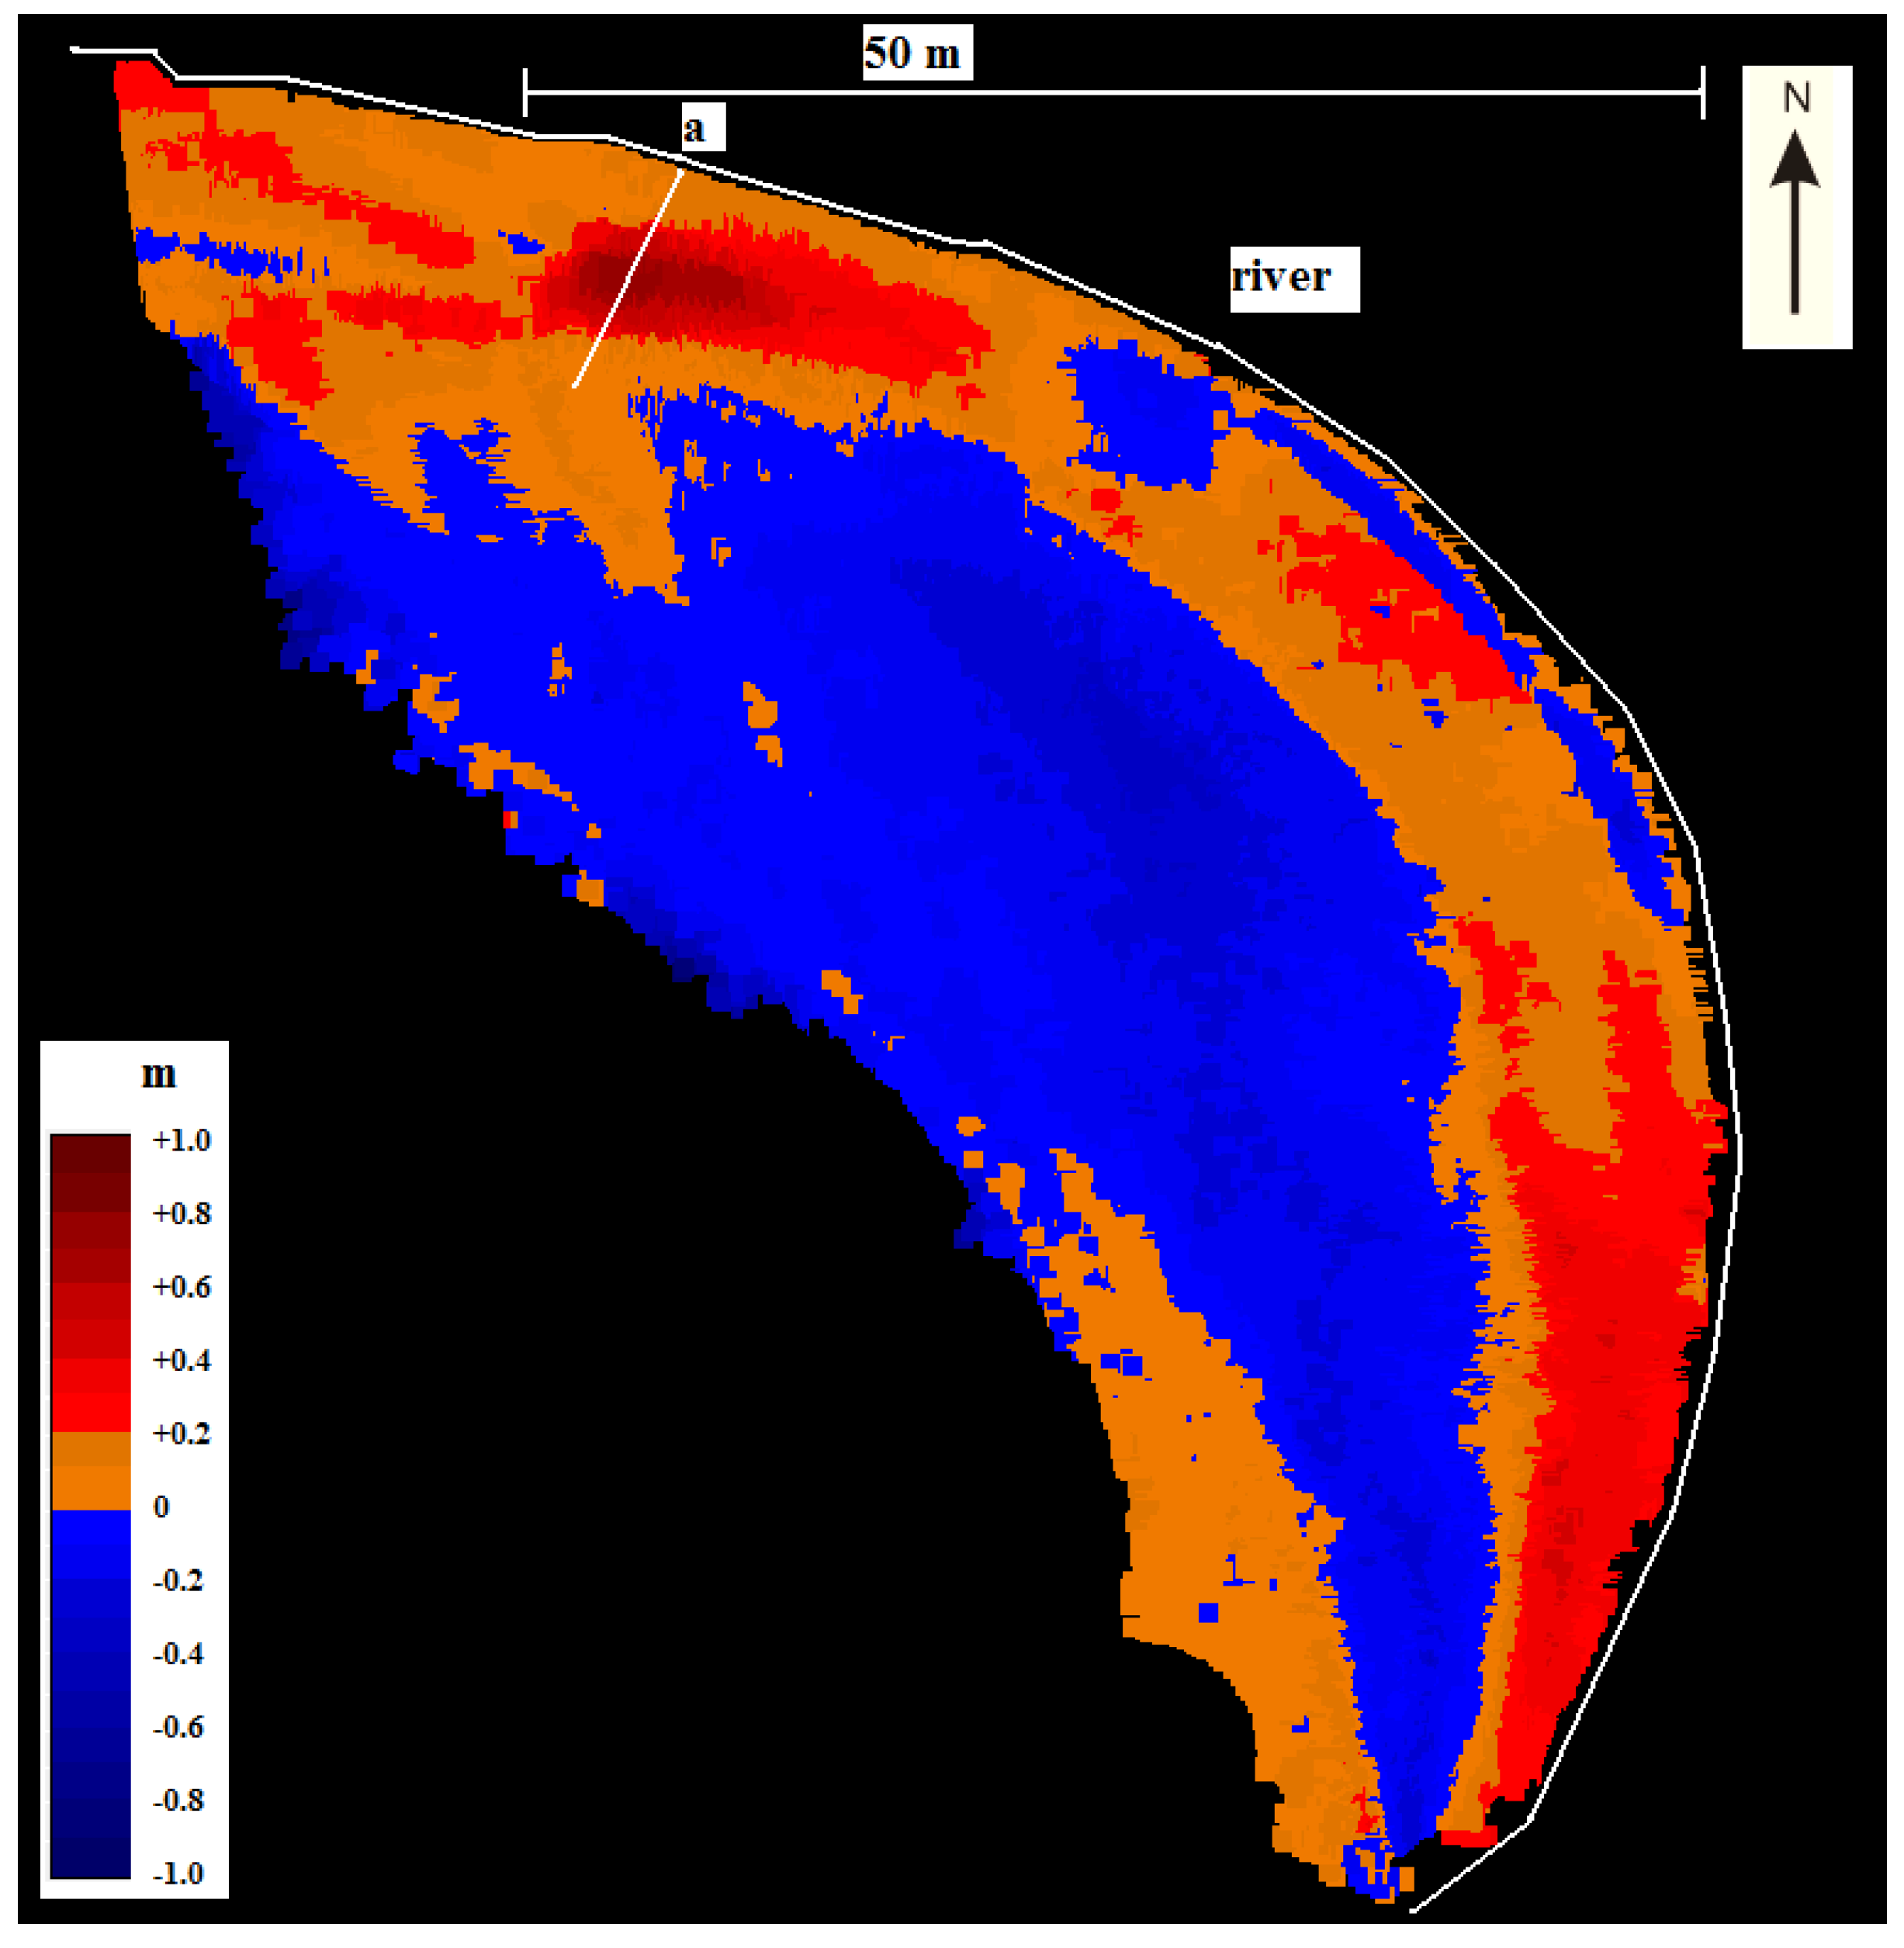
The MLS-based change detection possibilities are further demonstrated in
Figure 7 and
Figure 8. The deposition and erosion areas on Point Bar 2 in the Pulmanki River between the years 2008 and 2009 are demonstrated in
Figure 7. The deposition areas are marked in brown and red colors, whereas the blue tones indicate erosion. The size of the area was 3,100 m
2 and the LoD for MLS-based DoD was 8.5 cm. The largest changes occurred near the shoreline (
Figure 7). This is demonstrated with a cross-section over the change map.
Figure 7.
Deposition and erosion areas on Point Bar 2 between the years 2009 and 2008.
Figure 7.
Deposition and erosion areas on Point Bar 2 between the years 2009 and 2008.
Figure 8.
Cross-section of deposition effects on Point Bar 2. Blue represents data in 2008 and red data in 2009.
Figure 8.
Cross-section of deposition effects on Point Bar 2. Blue represents data in 2008 and red data in 2009.
4. Discussion
The mobile mapping system used in this study proved to be useful when a close viewpoint, dense pointclouds, and high ranging accuracy was needed. Aerial systems, such as aerial lidar or unmanned aerial vehicles (UAV), are more reasonable to use when the study area is larger or terrain is rugged, or when almost-nadir viewing angle is preferred. BoMMS and CartMMS enable a detailed DEM production of riverside topography and multi-temporal data allows precise change detection studies of the river. Regional coverage of BoMMS is limited due to the low measuring perspective, thus, methods such as CartMMS or TLS are also needed for collecting high-resolution topographic data. Overall, three dimensional data of laser scanning over the river channel provides a data source for various environmental studies, including river dynamic studies, hydraulic modeling and visual interpretation of fluvial geomorphology.
We consider that the positioning accuracy of the GPS-IMU system is the most critical part in the error budget and thus ground reference data is needed. We assessed the accuracy of MLS-based DEMs by TLS scans as reference data. The estimated precision of the reference method is, therefore better than 1 cm. The obvious reason for achieving better results for point bars is the following: the original lower variability in elevations in the point bars and the vegetation along the banks reduced the number of uniquely detectable ground hits and the higher point density of the point bars (100–1,000 pts/m2) compared to the river banks (1–30 pts/m2). The reason that we obtained better results with the CartMMS compared to the BoMMS can be explained by a better scanning geometry and the higher point density produced by the CartMMS (due to a shorter distance).
The presented accuracy assessment in
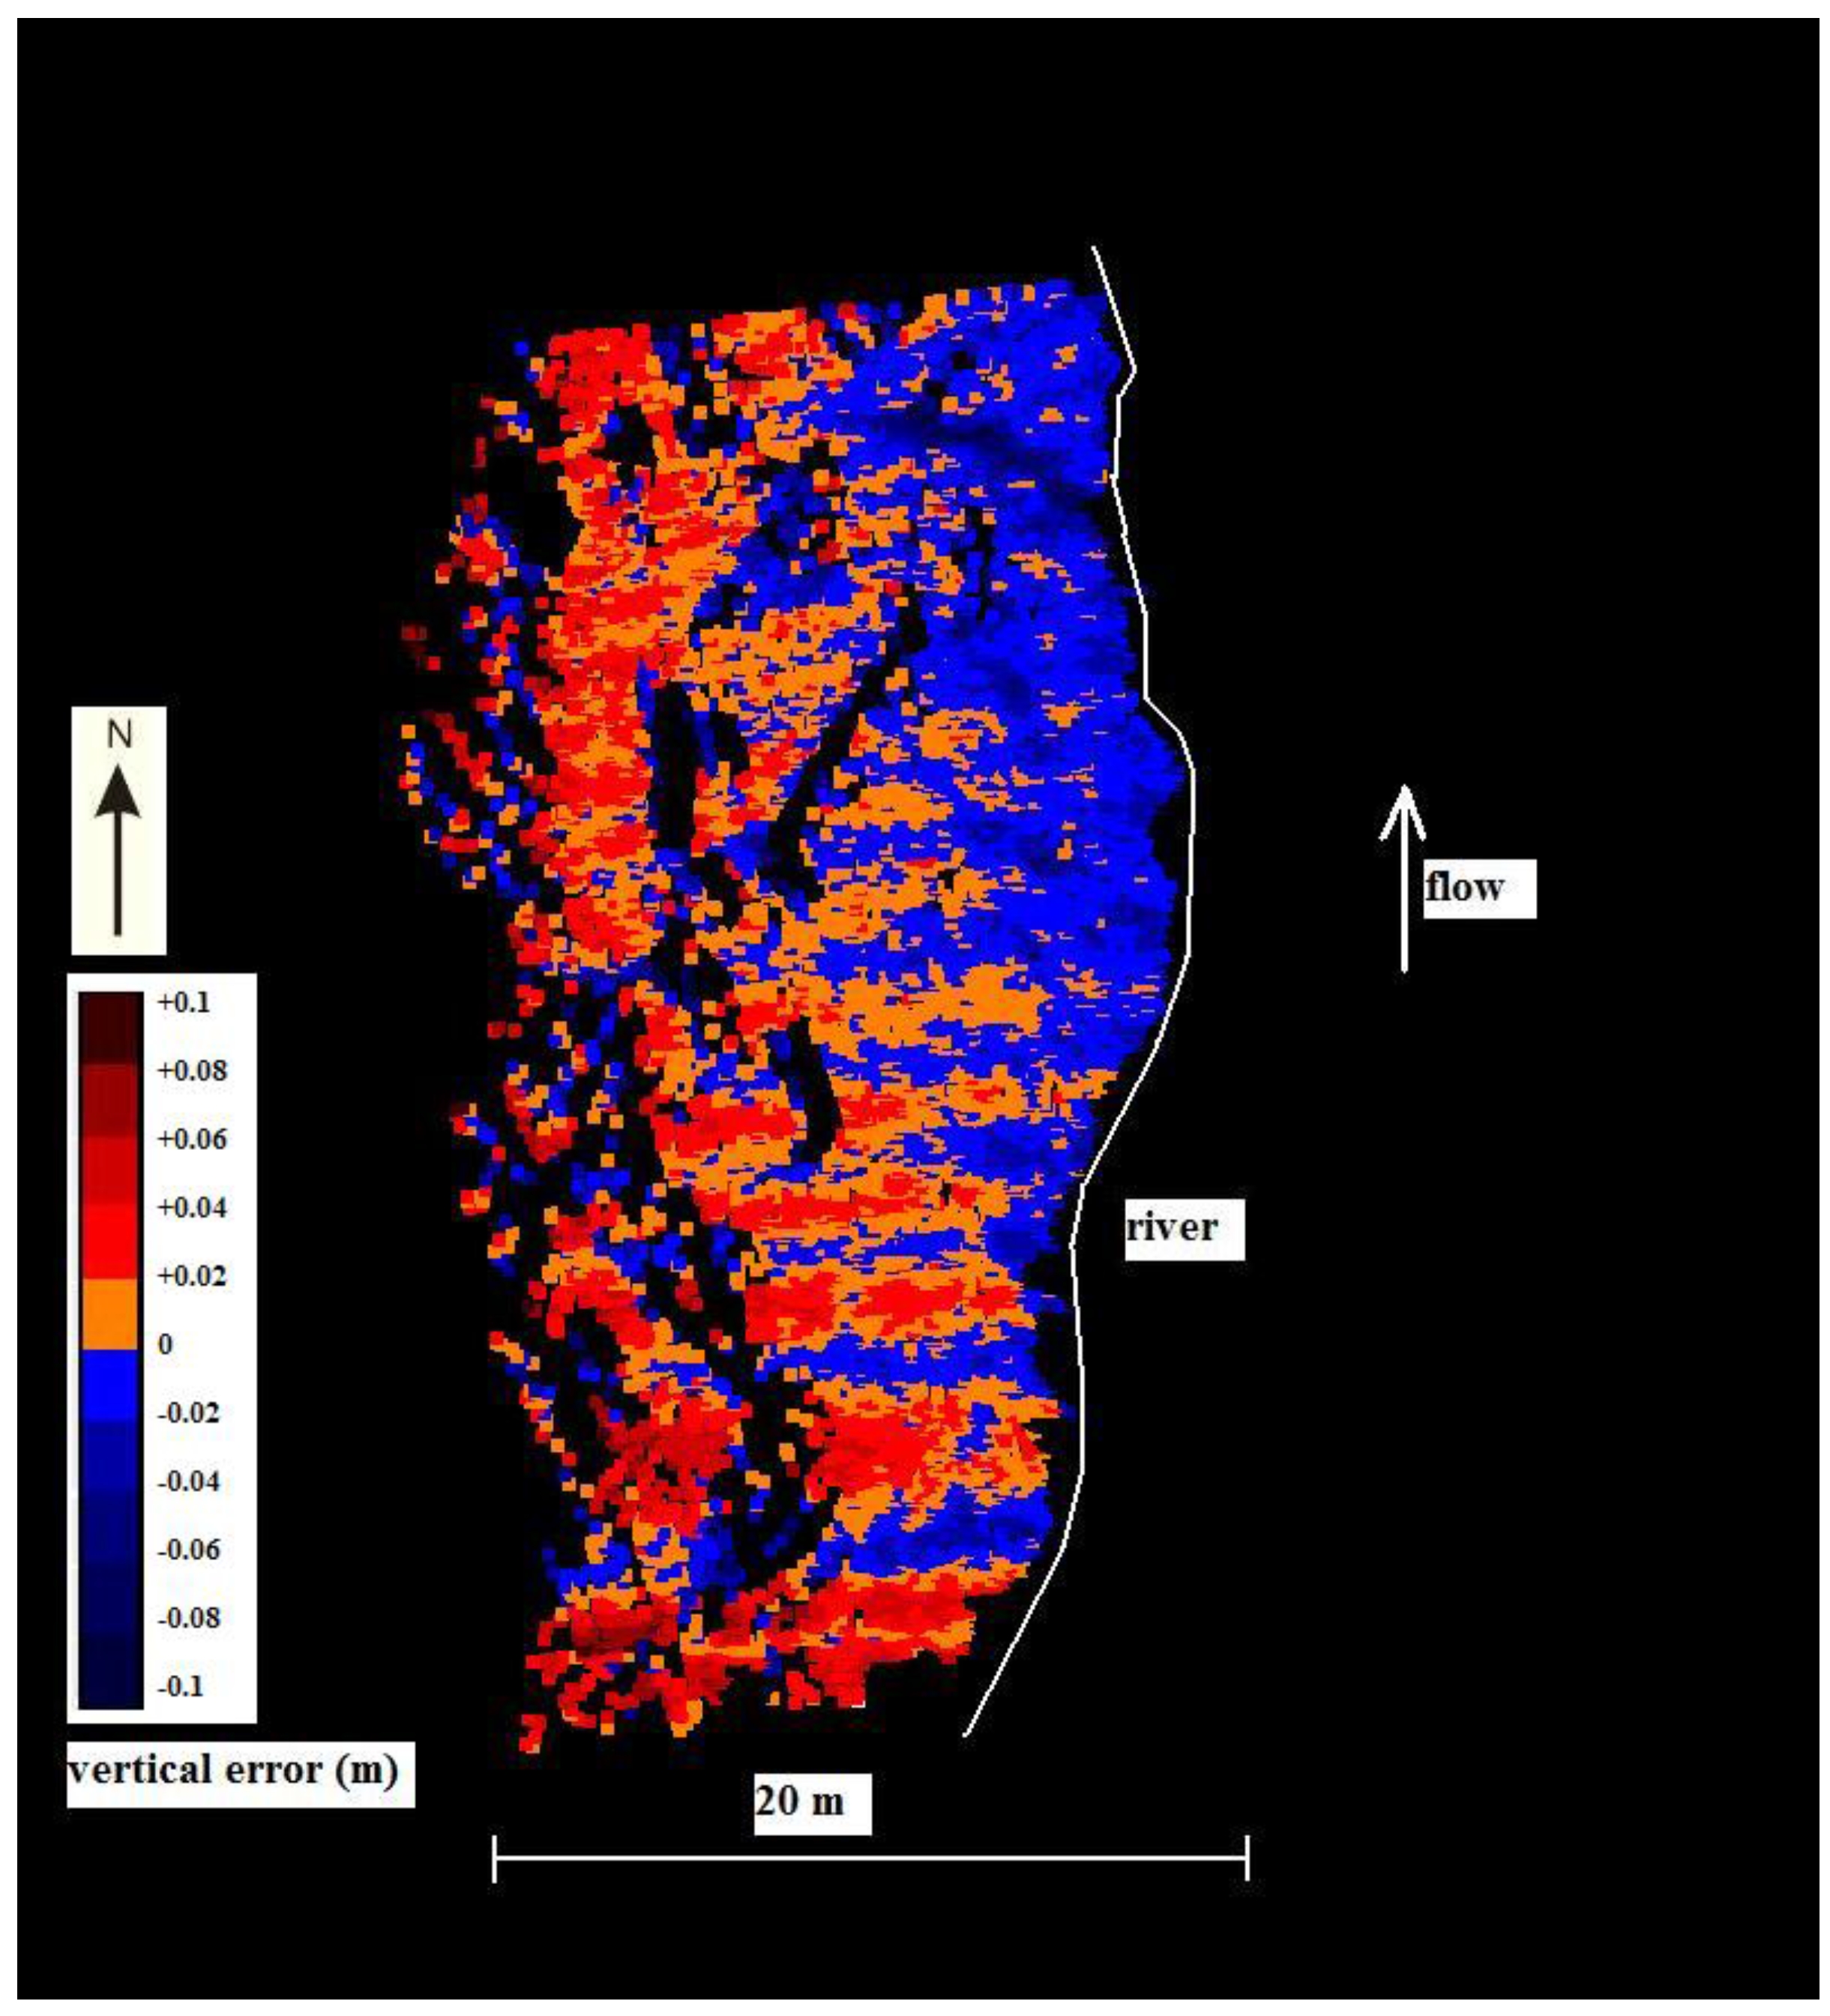
Section 3.1 takes into account the spatial variations of error only by dividing the areas to non-vegetated point bars and densely vegetated banks. However, it is worth pointing out that a vertical error is not uniform across the elevation surface. The error is spatially variable and has a tendency to be greater at breaks of slope, such as bar and bank edges [
38].
Figure 9 shows the spatial variations of the vertical error for BoMMS data on Point Bar 1. It seems that the elevation error has a connection with the scanning angle and range. The error surface also includes regular stripes which are perpendicular to the direction of the boat movement and river flow. These errors might also be linked to the calculation of the GPS-IMU data but further studies that deal with spatial variations in MLS-based DEMs error is clearly needed.
Figure 9.
Error surface for BoMMS data for Point Bar 1.
Figure 9.
Error surface for BoMMS data for Point Bar 1.
The presented methodology can be applied also to other topographic changes, not just on erosion change detection. MLS-based topographic change mapping, especially on road environments, may also be used to update man-made changes to national elevation models, for which currently ALS is increasingly the main data source.
5. Conclusions
We studied the feasibility of using MLS to map changes in riverine topography. We used a boat-based and cart-mounted mobile laser scanner to record the topography of point bars and river banks before and after the effect of erosion or deposition within one year. We analyzed the accuracy of the mobile mapping for elevation and change using terrestrial laser scans as a reference. In five out of six test sites we obtained the RMSE of the elevation level with better than 5 cm accuracy. This, however, required a systematic elevation error calibration of the data. We obtained better accuracies with the steeper scanning angles in particular, which we tried to improve in the 2009 data acquisition by increasing the mapping system support structure height by 1 m. Thus, the worst-case RMSE was decreased from 17.6 cm to 12.2 cm for point bars, while it was 5.3 cm for the CartMMS having a steep incidence angle. The precision for change detection was 0.93 (R2) and 3.4 cm (standard deviation of error). We demonstrated and verified the feasibility of MLS/MMS data for change detection, mapping and visualizations against TLS data with volume analysis. The results obtained indicate that MLS could provide accurate and precise change information over large areas. However, data needs to be controlled for systematic errors, as they significantly affect volumes derived from surface analysis.
