Article

Land Surface Albedos Computed from BRF Measurements with a Study of Conversion Formulae

1
Finnish Geodetic Institute, P.O. box 14, FI-02431 Masala, Finland
2
Finnish Meteorological Institute, Earth Observation, P.O. Box 503, FI-00101 Helsinki, Finland
*
Author to whom correspondence should be addressed.
Remote Sens. 2010, 2(8), 1918-1940; https://doi.org/10.3390/rs2081918
Submission received: 30 May 2010 / Revised: 11 June 2010 / Accepted: 25 June 2010 / Published: 12 August 2010

Abstract

:
Land surface hemispherical albedos of several targets have been resolved using the bidirectional reflectance factor (BRF) library of the Finnish Geodetic Institute (FGI). The library contains BRF data measured by FGI during the years 2003–2009. Surface albedos are calculated using selected BRF datasets from the library. Polynomial interpolation and extrapolation have been used in computations. Several broadband conversion formulae generally used for satellite based surface albedo retrieval have been tested. The albedos were typically found to monotonically increase with increasing zenith angle of the Sun. The surface albedo variance was significant even within each target category / surface type. In general, the albedo estimates derived using diverse broadband conversion formulas and estimates obtained by direct integration of the measured spectra were in line.

1. Introduction

Surface hemispherical albedo is one of the Essential Climate Variables (ECV) defined by the Implementation Plan for the Global Observing System for Climate in Support of the United Nations Framework Convention on Climate Change (UNFCCC) (http://unfccc.int/2860.php). It indicates how large a part of the incident radiation to a surface is reflected back. The albedo of land surfaces has large daily and seasonal variation in many regions. It also depends on the solar zenith angle. Although this dependence is qualitatively known and several models exist, systematic measurement data from well defined targets are rare.
Climate models require the land-surface albedo to be known at a quite high absolute accuracy, from 0.02 to 0.05 [1]. Several satellite-based instruments provide global and local albedos, for example MODIS on Terra and Aqua [2,3], METEOSAT [4], SEVIRI [5] and AVHRR [6]. The methodology is mostly based on a parametrised bidirectional reflectance factor (BRF, e.g., RossThick-LiSparse), applied to an observed reflectance between the nadir and 70 zenith angle [2]. MISR can provide multi-directional observations, but with less coverage [7]. Locally, surface albedo is often measured using mast-based or portable albedometers, and airborne measurements [8,9,10,11,12,13].
On the ground, the albedo is usually measured using broadband albedometers, consisting of up- and down-looking pyranometers. The resolved albedo can be very accurate, if the surface is flat and homogeneous in the footprint scale, typically in the order of 10 m. The sensor sensitivities can be extended to wider or narrower wavelength bands, or even be replaced with a spectral sensor, which gives more detailed information. When the surface is heterogeneous or has some topography in the footprint scale, as is often case inside forests, this method leads to average values with no information on the contribution of diverse components.
For smaller samples, on the order of 10 cm, another alternative is to measure the BRF using a goniophotometer, and derive the albedo by integrating the BRF. In this paper, we take a selected set of fairly comprehensive BRF measurements from the Finnish Geodetic Institute’s BRF library, and calculate the albedo from the data.
Current satellite sensors only sample the full broadband albedo at discrete wavebands. To obtain the full broadband albedo necessary for climate models, the satellite observations need to be converted from narrowband to broadband. This paper studies the effectiveness of various narrowband to broadband conversion algorithms. This is done by applying the algorithms to appropriate wavebands of the solved hemispherical albedos of the data set, and comparing the results to the albedo values obtained by integration over the whole spectrum.

2. Measurement and processing

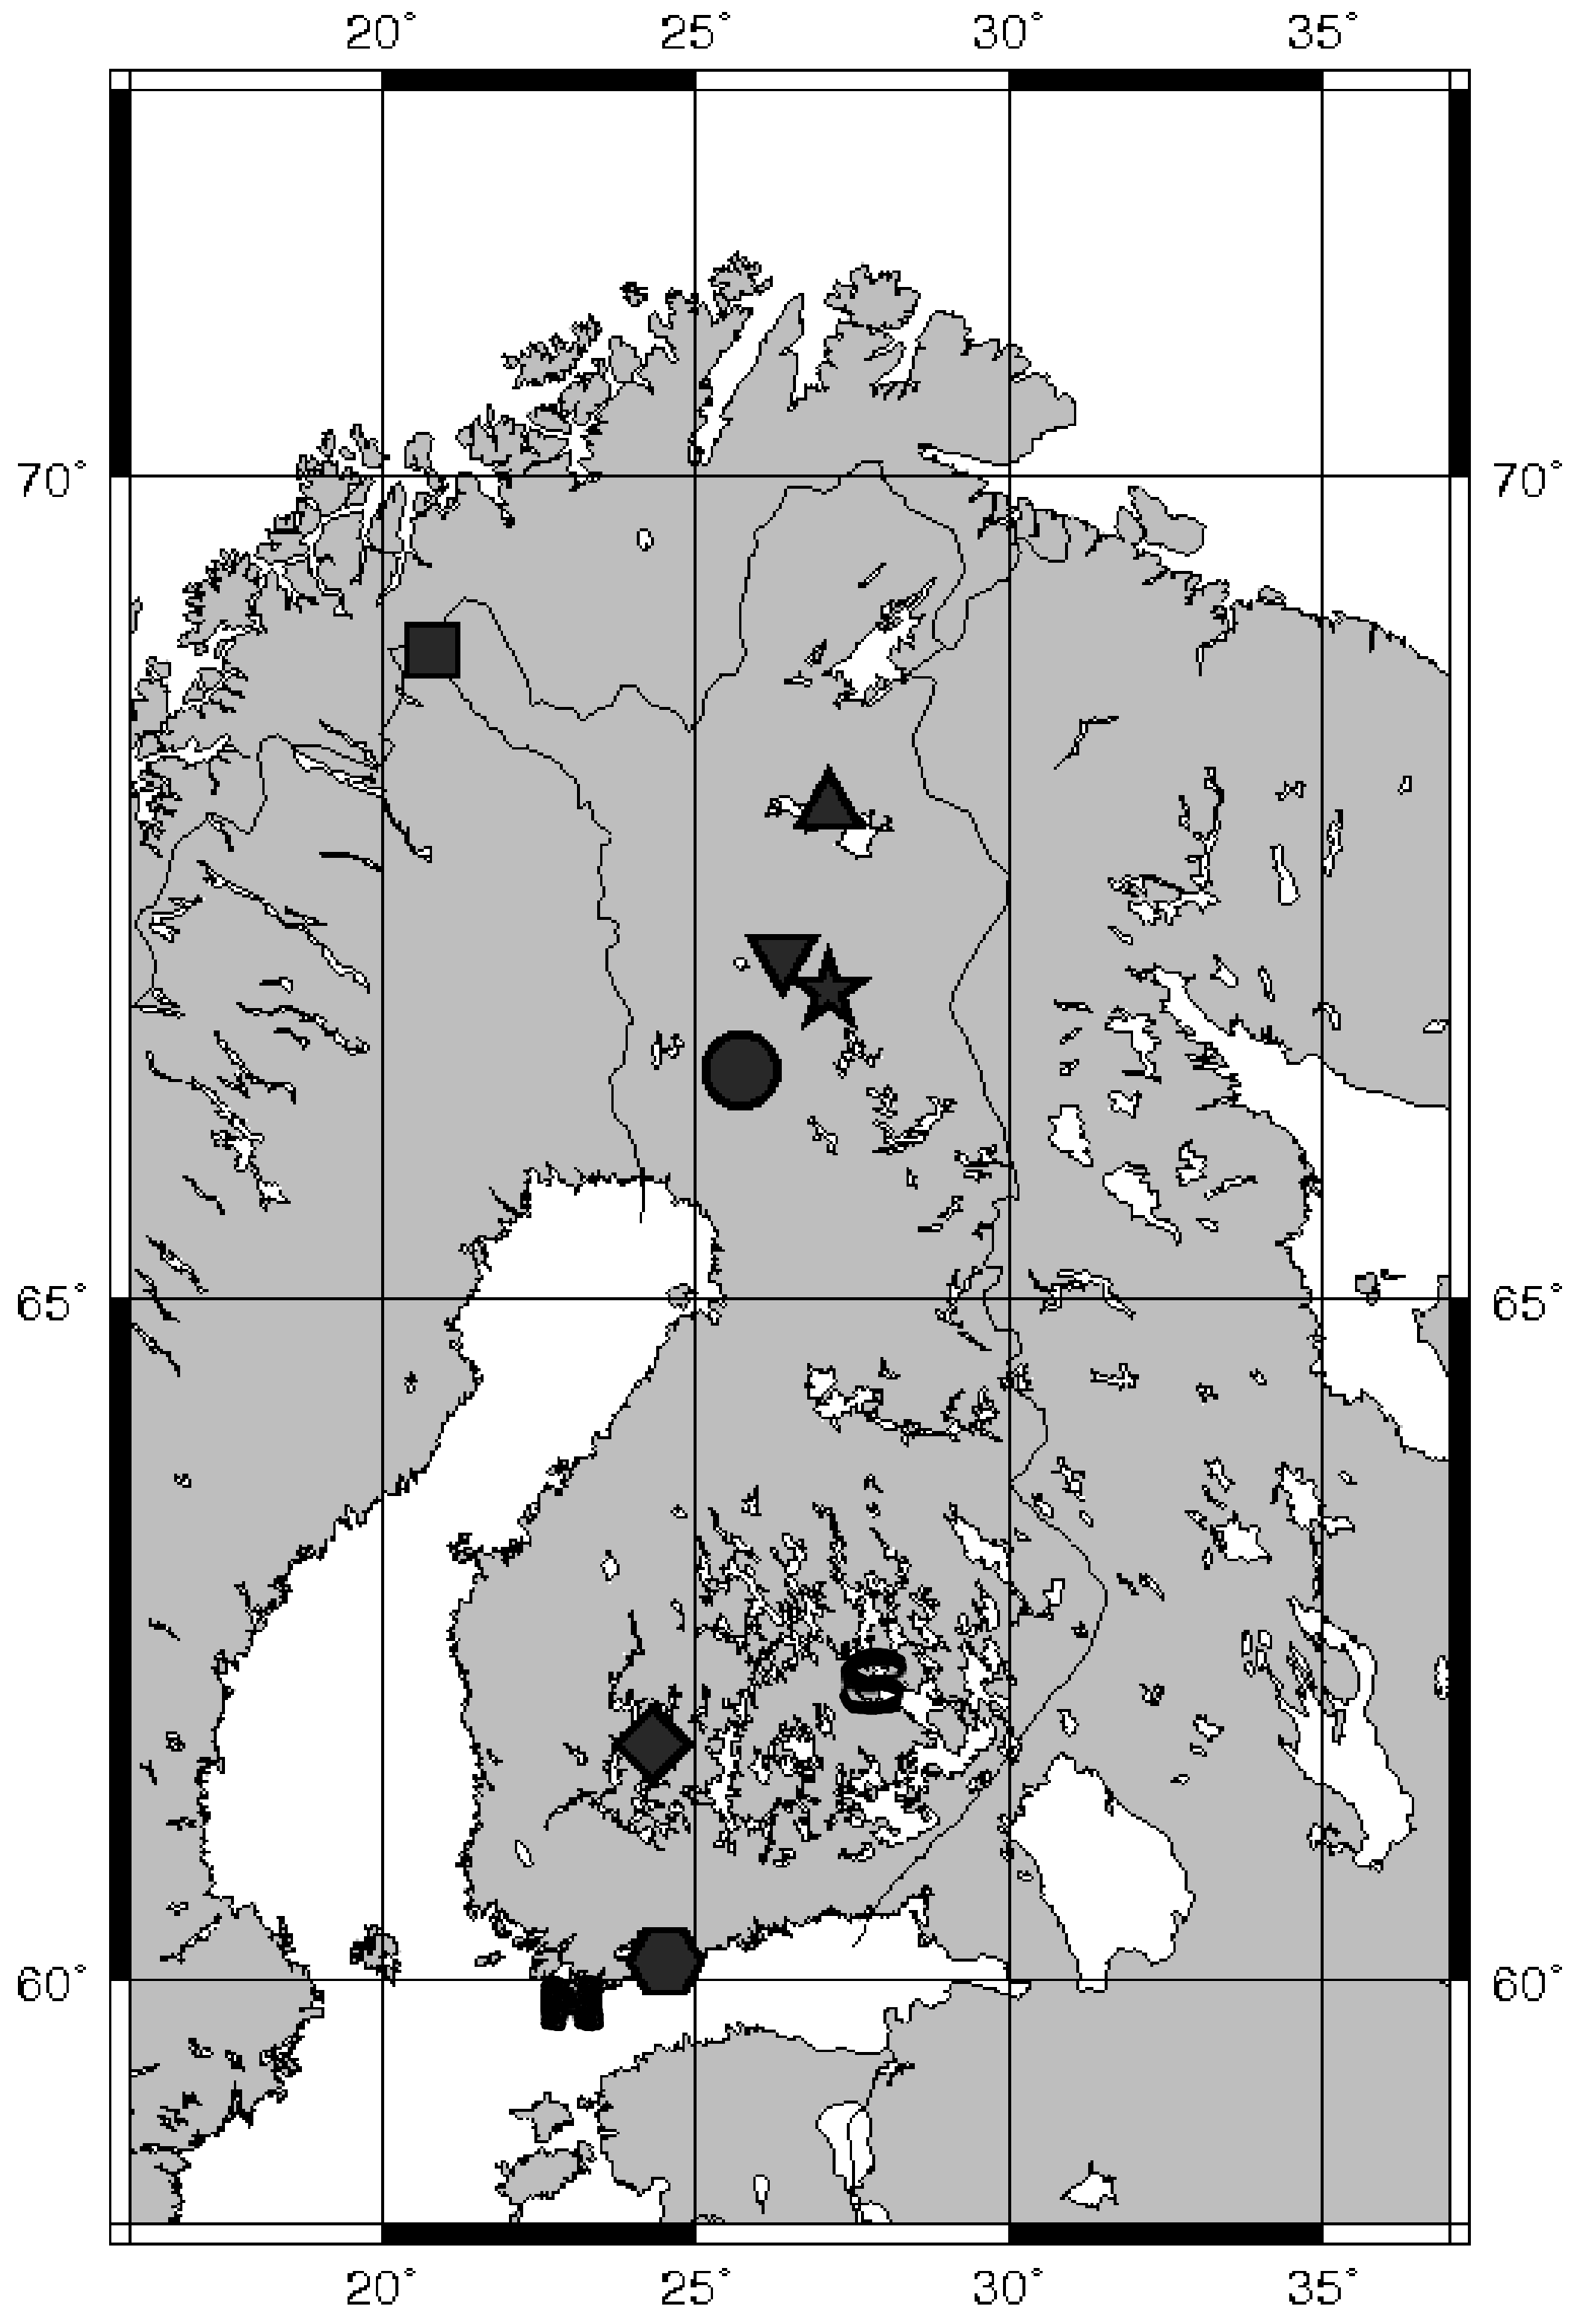
The data is taken from the Finnish Geodetic Institute’s BRF library. This library contains spectrally-resolved BRFs of over 100 land surface samples from various locations in Finland (Figure 1), as well as spectrally-resolved BRFs of of several artificial targets. The measurements were taken using the Finnish Geodetic Institute Field Gonio-spectro-radiometer (FIGIFIGO) and its predecessor, the Goniometer 3 [14,15,16,17,18,19,20]. The three basic setups are as follows, in the field under sunlight, in a laboratory
Figure 1. The locations of the measurements. From the bottom up, H = Hanko, hexagon = Masala, diamond = Hyytiälä, S = Suonenjoki, circle = Rovaniemi, star = Pyhätunturi, downward pointing triangle = Sodankylä, upward pointing triangle = Vuotso, square = Kilpisjärvi. Helsinki is 20 km east of Masala.
Remotesensing 02 01918 g001
using an Oriel 1000 W quartz tungsten halogen lamp, and in the field using the Oriel 1000 W quartz tungsten halogen lamp.
From the data base, we selected a suitable set of targets. Because of varying degrees of completeness of the measurements, only a small part of the targets were suitable for comprehensive albedo analysis. First, the calibration of the instrument must be stable and accurate within 5% or better. Most of the data fulfilled this requirement, but we rejected some of the oldest sets. Second, the angular range for the observed zenith angles must range from at least 0 to 70 . We rejected some laboratory measurements. Third, we needed at least five azimuth angles. We now dropped many samples measured outdoors in sunlight. The most difficult requirement was that there should be at least three differing illumination zenith angles. Finally, it was required that there had to be more than one independent measurement of similar targets, so that we could make a rough consistency estimate. Fifteen cases fulfilled the listed requirements, of which we selected the nine most interesting ones for analysis here:
  • We measured grey gravel from SjÖkulla test field [21] in a laboratory and in the field with five illumination angles. The gravel was artificially made, homogeneous, and rough, with an average grain size of 1 cm.
  • We took dry sand from several locations in Finland and measured it at several illumination angles.
    • 27.8.2004, Hanko beach, laboratory
    • 13.9.2005, Hietalahti beach, Helsinki, sunlight
    • 13.9.2005, Football field, Helsinki, sunlight
    • 17.7.2006, Hietalahti beach, Helsinki, sunlight
    • 8.8.2006, Sodankylä, sunlight
    • 31.5.2009, beach volley field, Hyytiälä, sunlight
  • We measured new snow in Sodankylä on two successive nights on 4–5 of March 2008 using a lamp immediately after a snow fall at five angles of illumination. The snow grains still had clear flake shapes, but they had already begun breaking up into needles.
  • We measured dry old snow on 1 April 2008 in Sodankylä using a lamp at four different illumination angles. The snow was several days or weeks old, the grains were rounded, and its temperature was well below zero.
  • We measured very wet melting snow in March 2009 in a laboratory in Masala using a lamp at three different illumination angles.
  • We combined the data on Moss from measurements in Masala and Suonenjoki, both in sunlight and using a lamp, with a total of eight angles of illumination. The samples mostly consisted of Hylocomium splendens species.
    • 23.8.2004, Masala, laboratory
    • 24.8.2004, Masala, sunlight
    • 7.6.2005, Suonenjoki, laboratory
    • 7.6.2005, Suonenjoki, laboratory
    • 7.6.2005, Suonenjoki, laboratory
    • 2.9.2004, Masala, laboratory, Pleurozium schreberi
  • We measured lichen in Suonenjoki, Sodankylä, and Masala. There were seven samples with nine angles of illumination.
    • 11.7.2001, Masala, laboratory
    • 18.8. 2004, Masala, laboratory
    • 7.6.2005, Suonenjoki, laboratory
    • 9.6.2005, Suonenjoki, laboratory
      Figure 2. Definition of the angles used in surface reflectance work: ϵ and ι are the zenith angles of the emergent (Observer) and incident (solar) radiation respectively, φ and ϕ 0 are the corresponding azimuths. The phase or back scattering angle α is the angle between the Observer and the Sun. The principal plane is fixed by the solar direction and the surface normal to it, while the cross plane is a vertical plane perpendicular to the principal plane.
      Figure 2. Definition of the angles used in surface reflectance work: ϵ and ι are the zenith angles of the emergent (Observer) and incident (solar) radiation respectively, φ and ϕ 0 are the corresponding azimuths. The phase or back scattering angle α is the angle between the Observer and the Sun. The principal plane is fixed by the solar direction and the surface normal to it, while the cross plane is a vertical plane perpendicular to the principal plane.
      Remotesensing 02 01918 g002
    • 3.8.2006, Sodankylä, sunlight
    • 3.8.2006, Sodankylä, sunlight
    • 6.8.2006, Sodankylä, sunlight
  • The Lingonberry data set contained two measurements from Suonenjoki and Sodankylä.
    • 8.6.2005, Suonenjoki, laboratory
    • 9.6.2005, Suonenjoki, laboratory
    • 5.8.2006, Sodankylä, sunlight
    • 6.8.2006, Sodankylä, sunlight
  • We measured an incomplete set of wet and dry peat at Suonenjoki in August 2003.
The usable spectral range was from 450 to 2,350 nm. The diffuse illumination component of the radiation has been separately measured and subtracted from all the radiation data, thus all the results correspond to a black sky condition.
Computing the albedo from discrete measurement points required modelling to interpolate and extrapolate the BRF to full hemisphere, since the measurements were not optimised for albedo measurements. Most measurements covered only half of the hemisphere, and thus the other half was assumed to be symmetric. Next, we fitted a simple polynomial to the data to give a smooth function over the hemisphere. Then, we computed the albedo (A) using an 11 × 18 point Gaussian/trapezoid quadrature
A ( μ ) = d μ 0 μ 0 d ϕ R ( μ , μ 0 , ϕ ) / π i j w i j μ i R ˜ ( μ , μ i , ϕ j ) ,
where R is the bidirectional reflectance factor, w i j is the quadrature weight, μ = cos ϵ , μ 0 = cos ι , and the angles ι , ϵ , ϕ are defined in Figure 2. The polynomial was of the form
R ˜ ( μ , μ 0 , α , γ ) = 1 μ + μ 0 j i N S j ( μ , μ 0 ) × a i j P i ( α ) + b i j P i ( β ) e β 2 2 + c i j P i ( δ ) e δ 2 2 ,
where a i j , b i j , c i j are wavelength dependent expansion coefficients, β = tan ( α / 2 ) / tan ( 5 / 2 ) , δ = tan ( γ / 2 ) / tan ( 5 / 2 ) , γ is the specular phase angle, defined as cos γ = ( μ + μ 0 ) / 2 + 2 cos α , P i is Legendre polynomial, and S ( μ , μ 0 ) = [ 1 , μ + μ 0 , μ μ 0 , μ 2 + μ 0 2 ] . This expansion assumes explicit reciprocity, left–right symmetry, isotropy in the solar azimuth ( R ( ϕ , ϕ 0 ) = R ( | ϕ ϕ 0 | ) , and a certain smoothness of the BRF shape. We used this polynomial because it was the best one supported by the primitive software, but it is not a substitute for proper physical modelling.
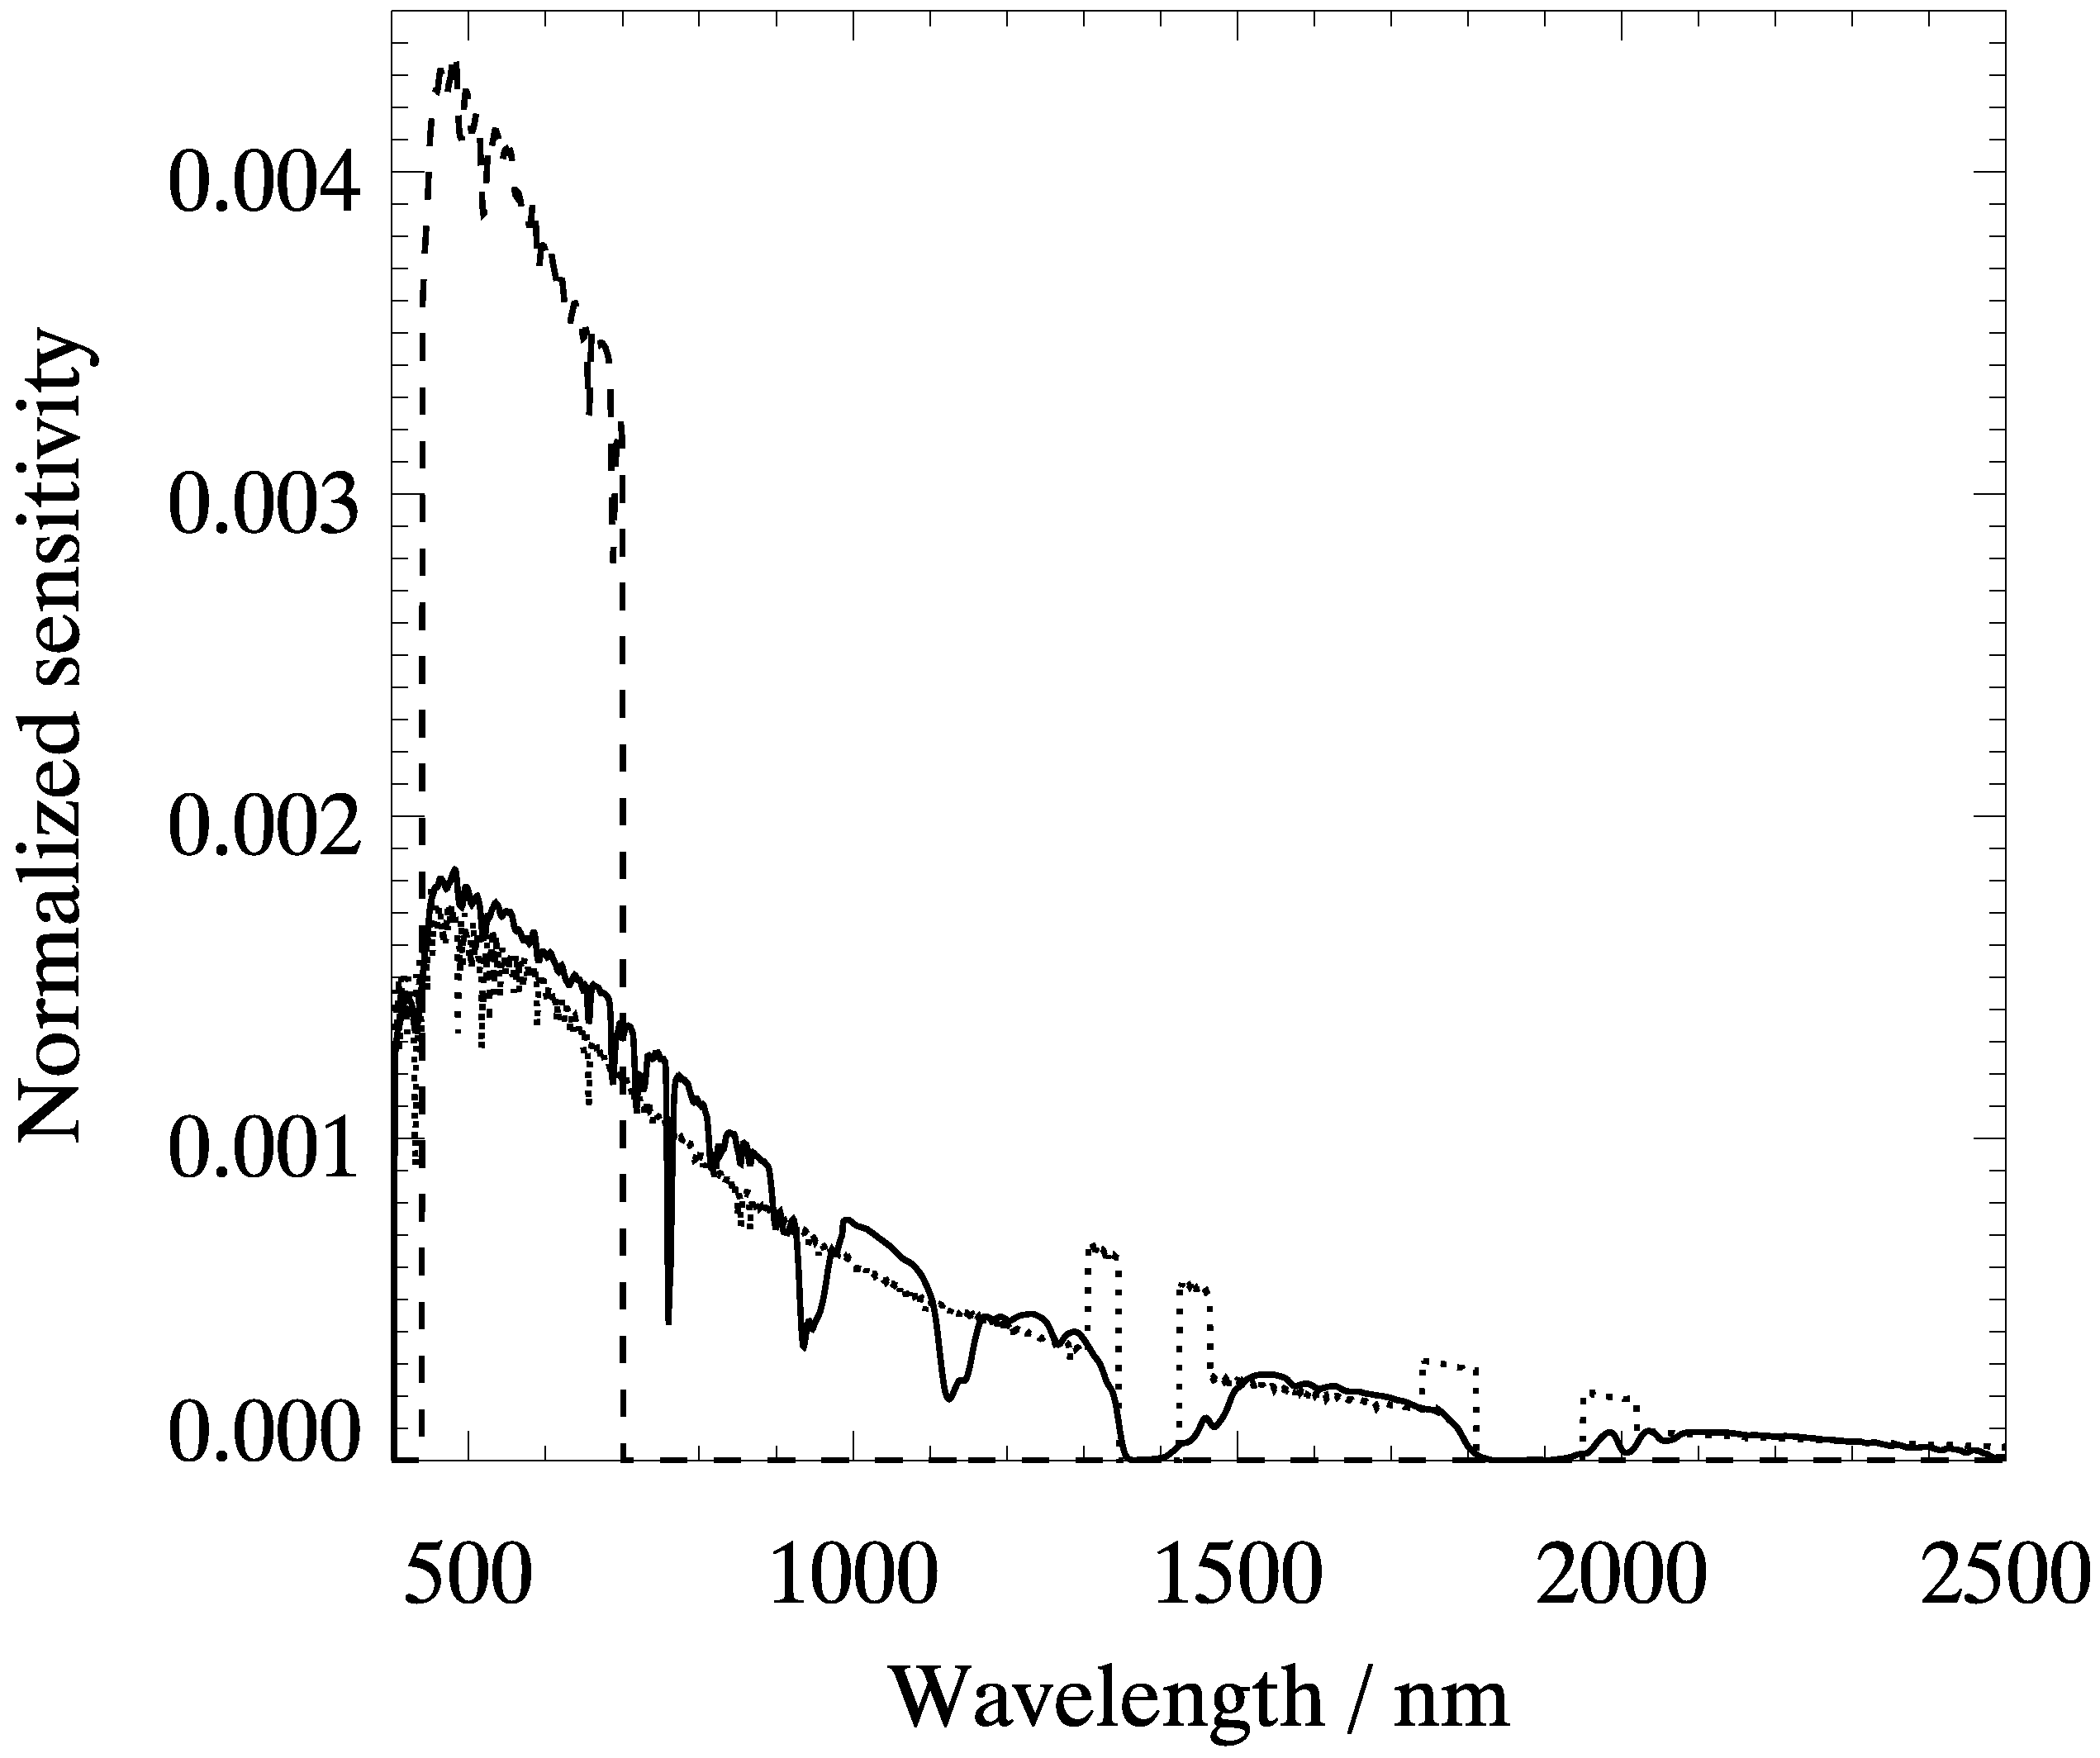
Figure 3. The illumination spectra used for various broadband-albedo computations. The solid line is the incident sunlight to the surface that is used for surface broadband albedo. We measured it on 18 May 2009 in SjÖkulla in clear sky conditions with a solar zenith angle of about 60 . We used the dashed line to compute the PAR (photosynthetically active radiation) albedo. The dotted line represents the solar radiation above the atmosphere, and was used for the top of atmosphere (TOA) albedo (with two technical modifications to the atmospheric water vapour absorption bands around 1,400 nm and 1,800 nm to deal with instrument noise in the sunlight measurements). All spectra are normalised to the same value.
Remotesensing 02 01918 g003
In addition to a detailed spectral albedo, many applications actually use only broadband albedos, that is to say, albedo which is integrated over a wavelength weighted by the spectrum of the incident light. For climatological applications, the surface broadband albedo is an important parameter, as it is related to the heating rate of the surface. Unfortunately, the broadband albedo depends on the varying incident radiation, which makes their comparison difficult. Thus, to make comparisons possible, we derived all broadband albedos shown here from the measured spectral albedos using the same solar spectrum, measured on 18 May 2009 in SjÖkulla, under a clear sky at a solar zenith angle of about 60 . For ecological purposes, another important albedo is the PAR-albedo (photosynthetically active radiation), which is simulated here by cutting the spectral range to 400–700 nm, where the chlorophyll mostly absorbs and utilises the radiation. Satellite users often normalise the albedo with the top of atmosphere (TOA) radiation. Because TOA does not depend on the atmosphere, it forms a fixed reference frame for presenting and comparing the results, although with less physical significance. Each of the three spectral distributions of irradiance which we apply in this paper are shown in Figure 3. Because the BRF measurements taken in sunlight have gaps at the atmospheric water vapour absorption bands around 1,400 nm and 1,800 nm, the TOA spectrum is slightly modified here around these bands.

3. Results

3.1. Albedos

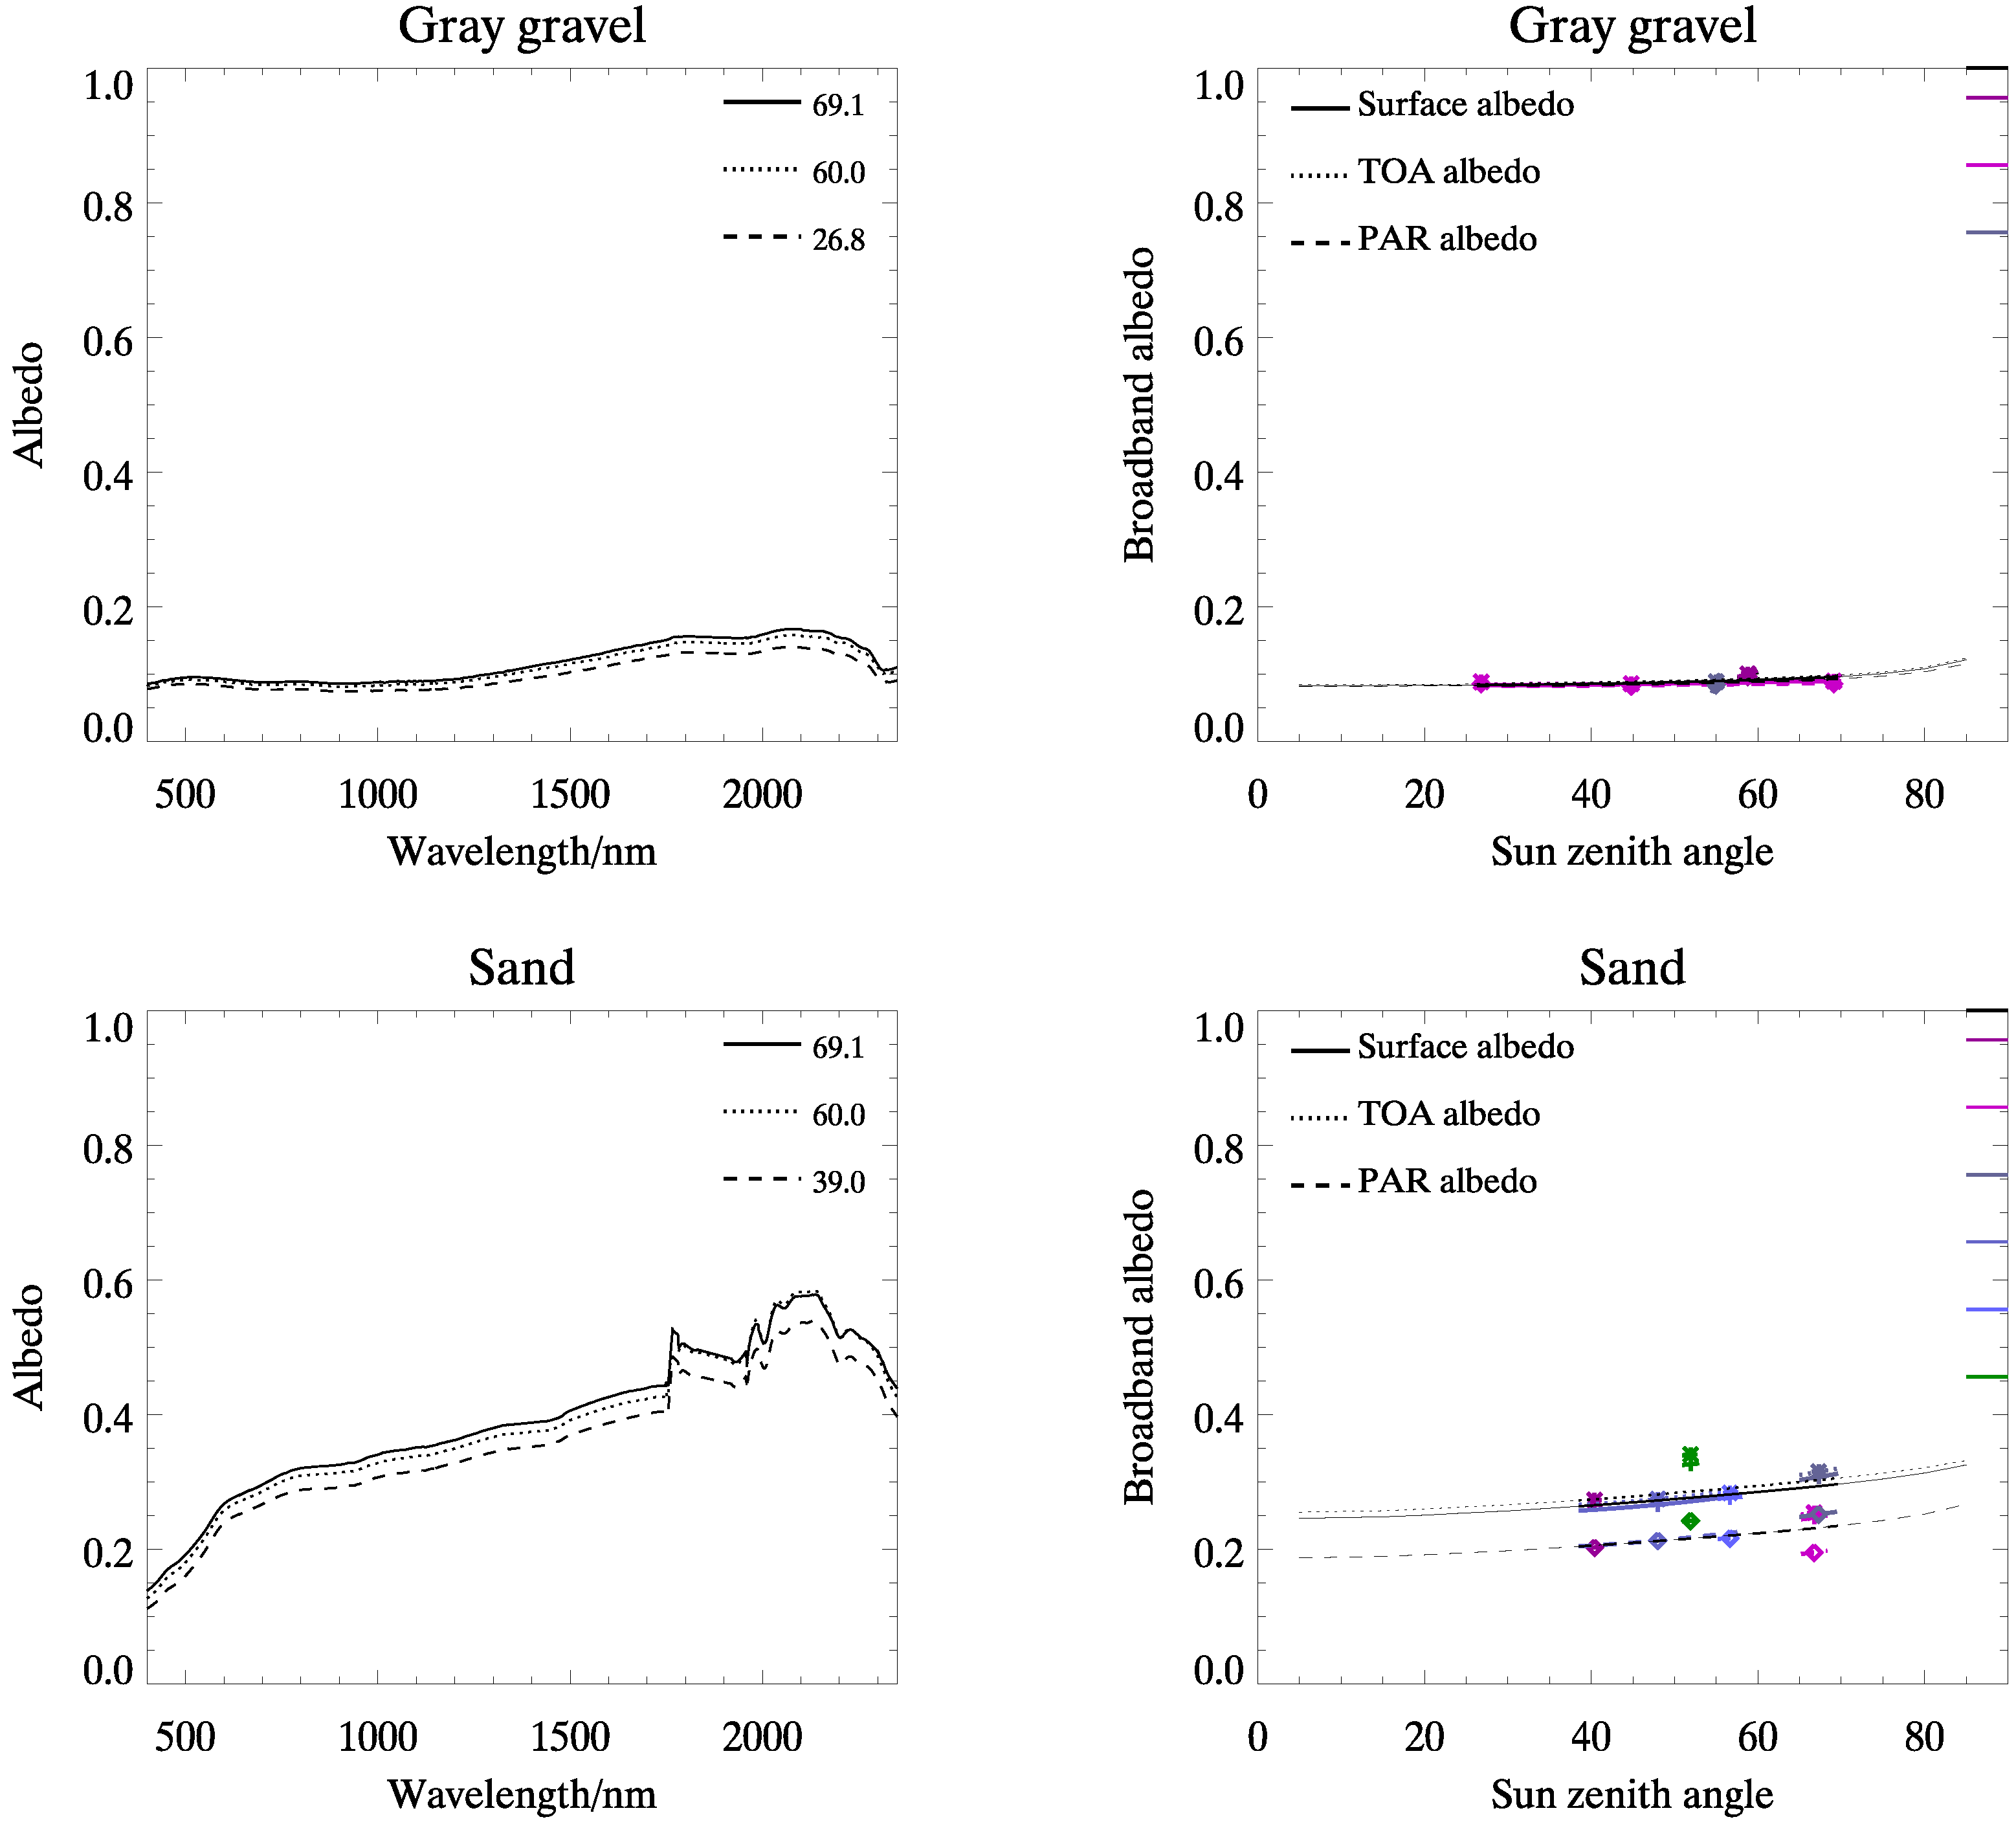
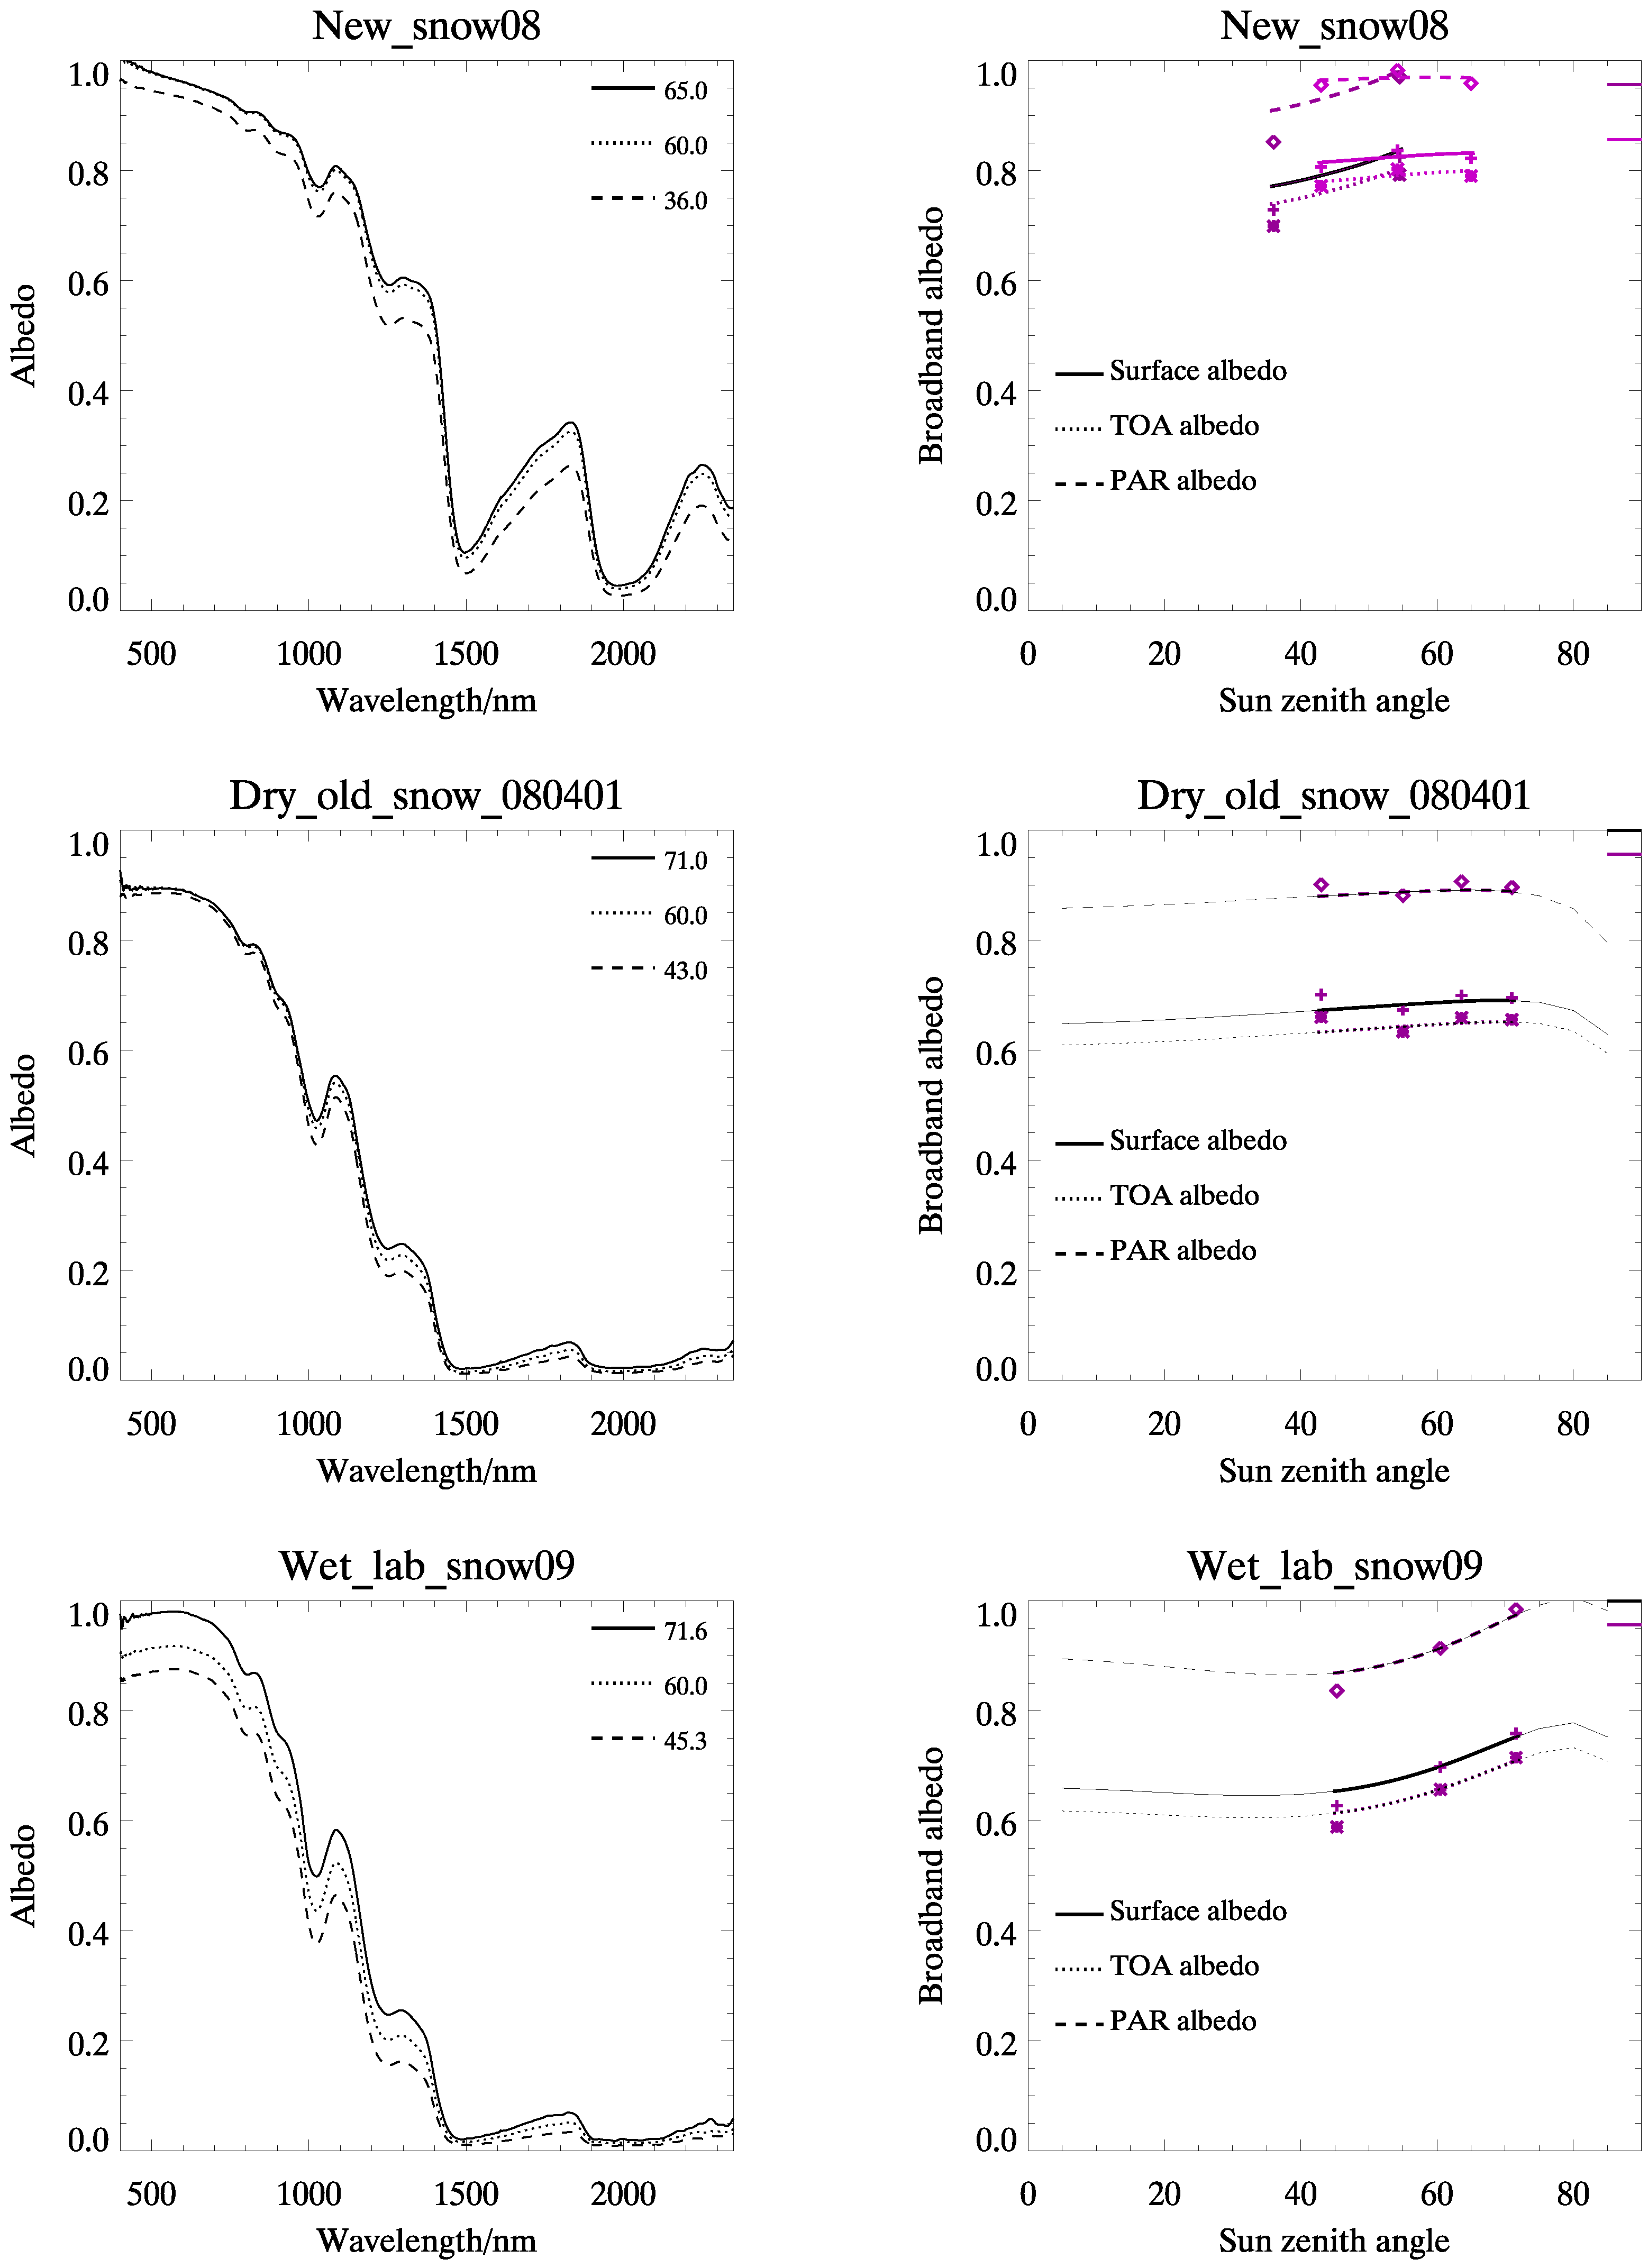
The albedos of the nine selected targets are presented in Figure 4, Figure 5, Figure 6 and Figure 7.
We selected grey gravel from the four reference surfaces in the SjÖkulla test field [21]. The spectral and angular characteristics are rather flat, as was the design goal of the test field (Figure 4 top). The sand varies a bit from target to target, but its’ main features are systematic (Figure 4 bottom).
The new snow albedo (Figure 5 top) is typical for small-grained snow. The albedo shows monotonically increasing dependence towards the larger zenith angles. Dry old snow (Figure 5 middle) also has a weak increasing trend in albedo relative to the zenith angle, although it is smaller than with other snow types. The spectrum is also darker in NIR-bands than with new snow because of the larger grain size. The wet snow (Figure 5 bottom) is spectrally close to dry old snow, but it has the strongest zenith angle dependence.
We combined the vegetation results (Figure 6) from several measurements. Though this caused some variation in the data, the trends are clear. The spectral characteristics are typical for vegetation: lichen is the greyest (flattest spectrum) and brightest and shrubs are the darkest. The zenith angle dependence of the albedo is weakly positive.
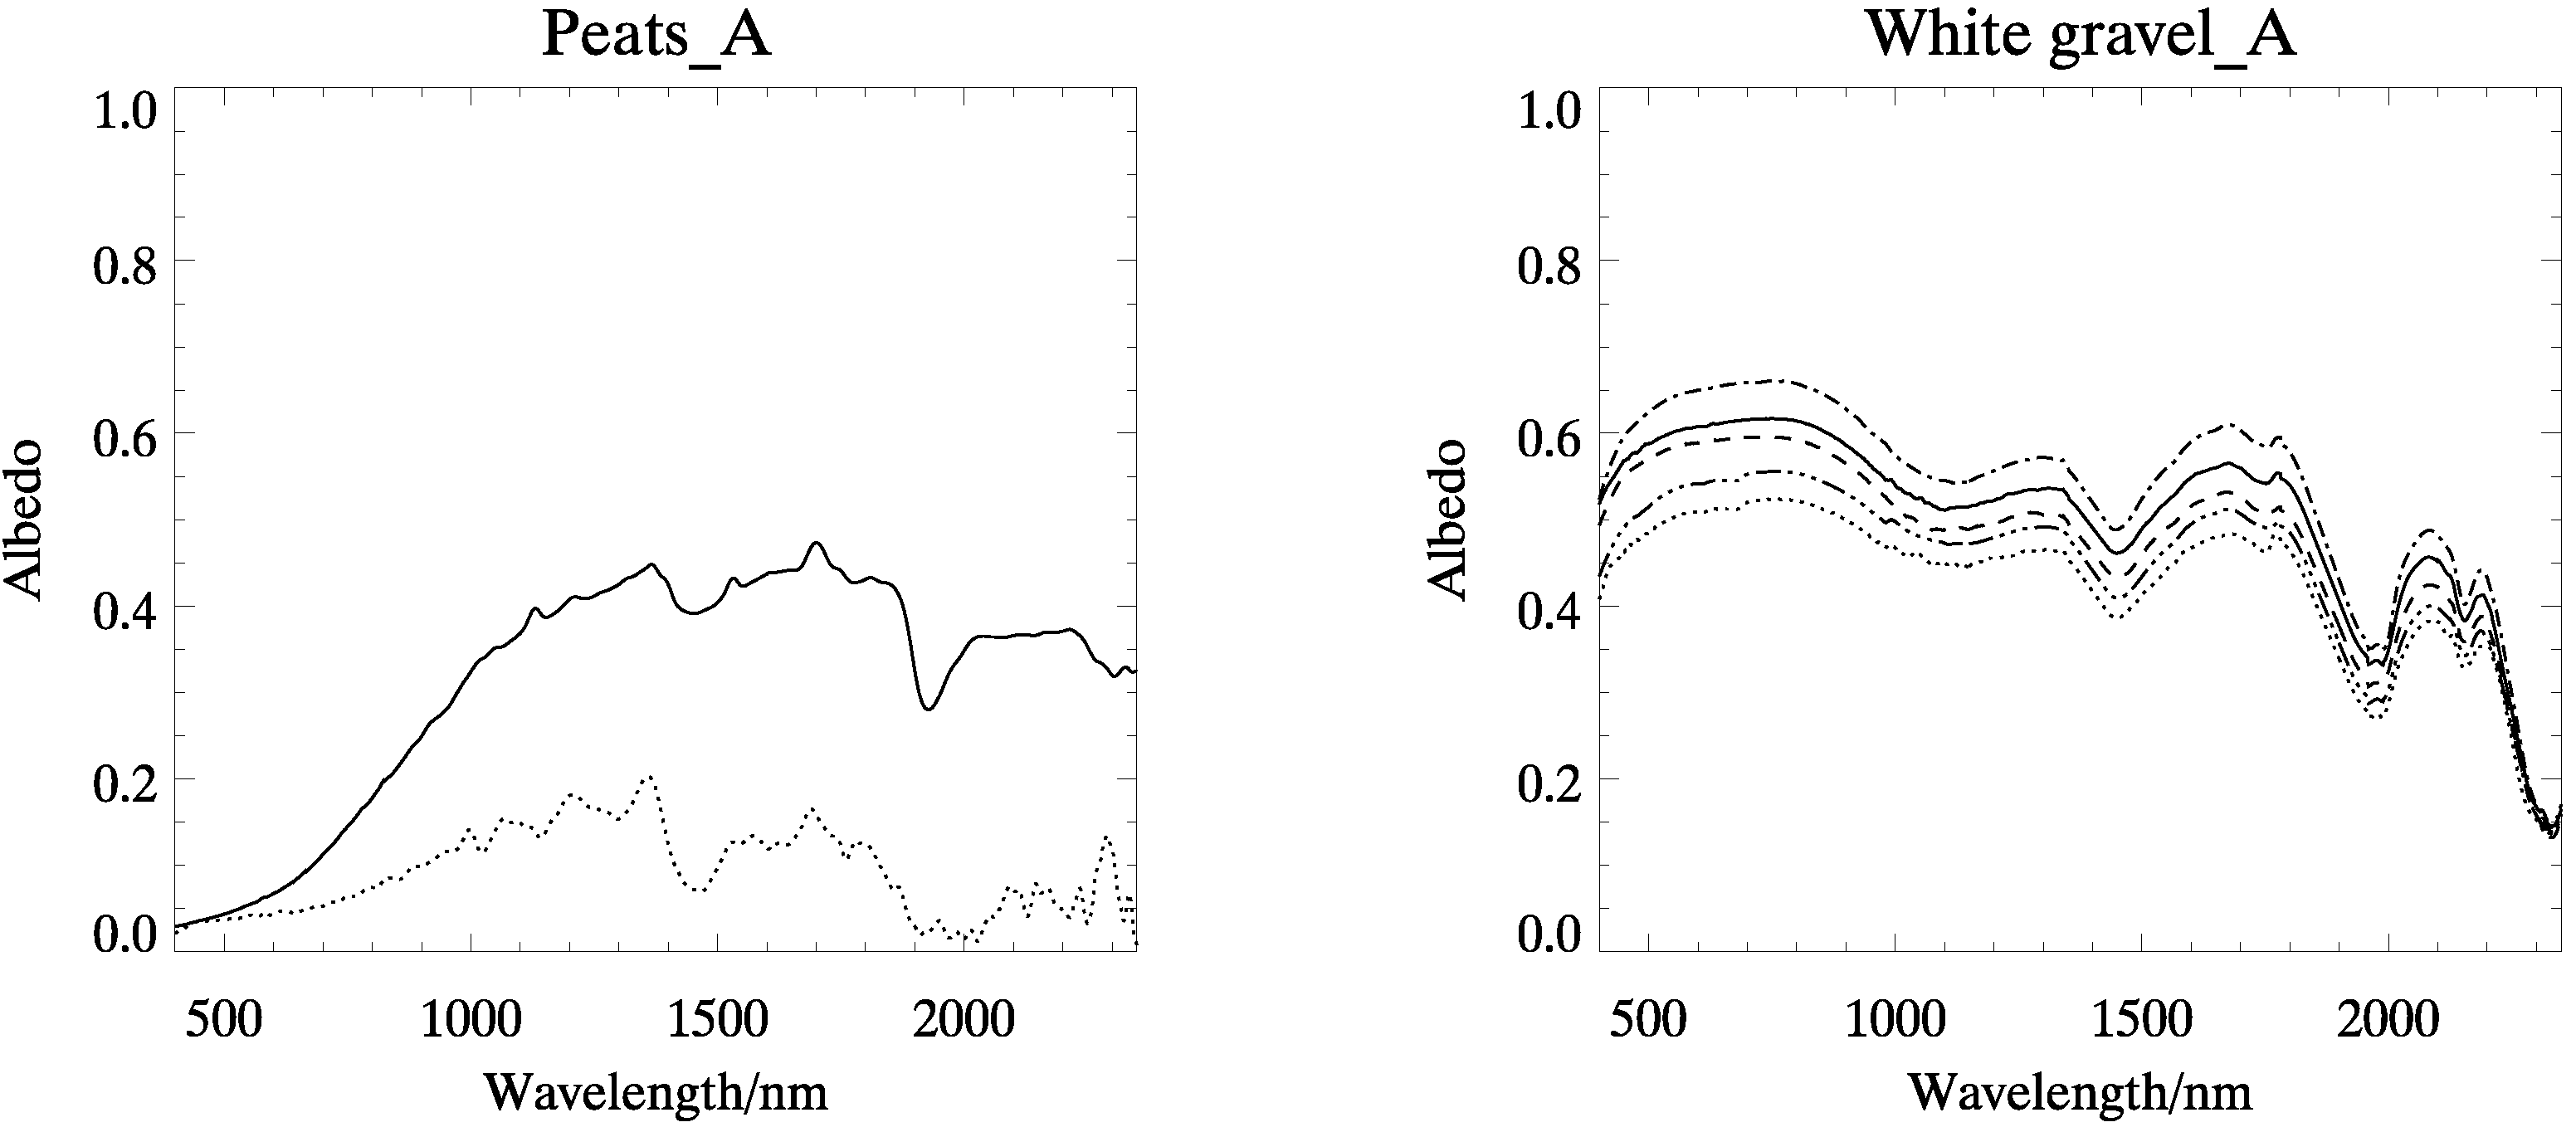
In all samples, the albedo is a more or less a monotonically increasing function of the zenith angle. However, temporal and spatial variations can be significantly larger than the zenith angle dependence alone, even in very short time and length scales. This is demonstrated in Figure 7, where we measured single peat sample both wet and dry, during the same day; It showed a very clear difference. In the same figure, the albedos of white gravel are shown, measured at different times between 2007 and 2009.
The broadband albedo values of the various targets corresponding to the sun zenith angle of 60 are given in Table 1. All measured vegetation targets have higher albedos than the grey gravel, but only lichen is brighter than sand. Naturally, all measured snow targets have much higher albedo values than any of the other targets. The albedo values are characteristic of the target and variation between individual samples is usually smaller than differences between targets.
Figure 4. Left: The spectrally-resolved hemispherical albedo at three angles of incidence: maximum, minimum and 60 (interpolated). Right: recovered broadband surface albedo (solid line, +), TOA albedo (dotted line, x) and PAR albedo (dashed line, diamond) as a function of the solar zenith angle. The black thin lines represent the broadband albedo obtained by combining all measured samples. The coloured thick lines and symbols correspond to the different samples, as listed by collection date, and represent the broadband albedo obtained by applying all illumination angles together (lines) and single illumination angles separately (symbols). The thin lines extrapolate to almost the full range of illumination angles but give less reliable values than the thick lines. The targets are grey gravel and sand in the upper and lower panels, respectively.
Remotesensing 02 01918 g004
The relative accuracy of the results is estimated to be around 5% for zenith angles between 0 and 60 , and about 10% for larger angles. The largest sources of error are calibration inaccuracies, sunlight variations in outdoor measurements and light source imperfections in lamp measurements, enhanced by the heterogeneity and variability of the targets. One special challenge is that natural land surfaces are never exactly horizontal, but more or less sloped in all directions. We selected all the targets from the flattest spots, but the uncertainty of levelling can still be between 1 and 10 , which can cause significant bias in albedo values. For some vegetation targets in particular, it is difficult to even say how the surface level should be measured, and the particular shape of the measured sample can play a significant role. The spectral shape is assumed to be more accurate relatively than absolutely.
Figure 5. Left: The spectrally-resolved hemispherical albedo at three angles of incidence: maximum, minimum and 60 (interpolated). Right: recovered broadband surface albedo (solid line, +), TOA albedo (dotted line, x) and PAR albedo (dashed line, diamond) as a function of the solar zenith angle, as in Figure 4. The targets are from top down: new snow, old dry snow, wet snow.
Remotesensing 02 01918 g005

3.2. Evaluation of Narrow-to-Broadband Surface Albedo Conversion Equations

We also used the measured albedo spectra to test various broadband conversion algorithms found in the relevant literature (Table 4 in Appendix 1). We applied the conversion formula to the measured albedo values integrated over the given wavelength bands. We then compared the obtained broadband albedo estimate to the broadband
Figure 6. Left: The spectrally-resolved hemispherical albedo at three angles of incidence: maximum, minimum and 60 (interpolated). Right: recovered broadband surface albedo (solid line, +), TOA albedo (dotted line, x) and PAR albedo (dashed line, diamond) as a function of the solar zenith angle, as in Figure 4. The targets are from top down: moss, lichen, and lingonberry.
Remotesensing 02 01918 g006
albedo value obtained by integrating them over the whole measured wavelength range.
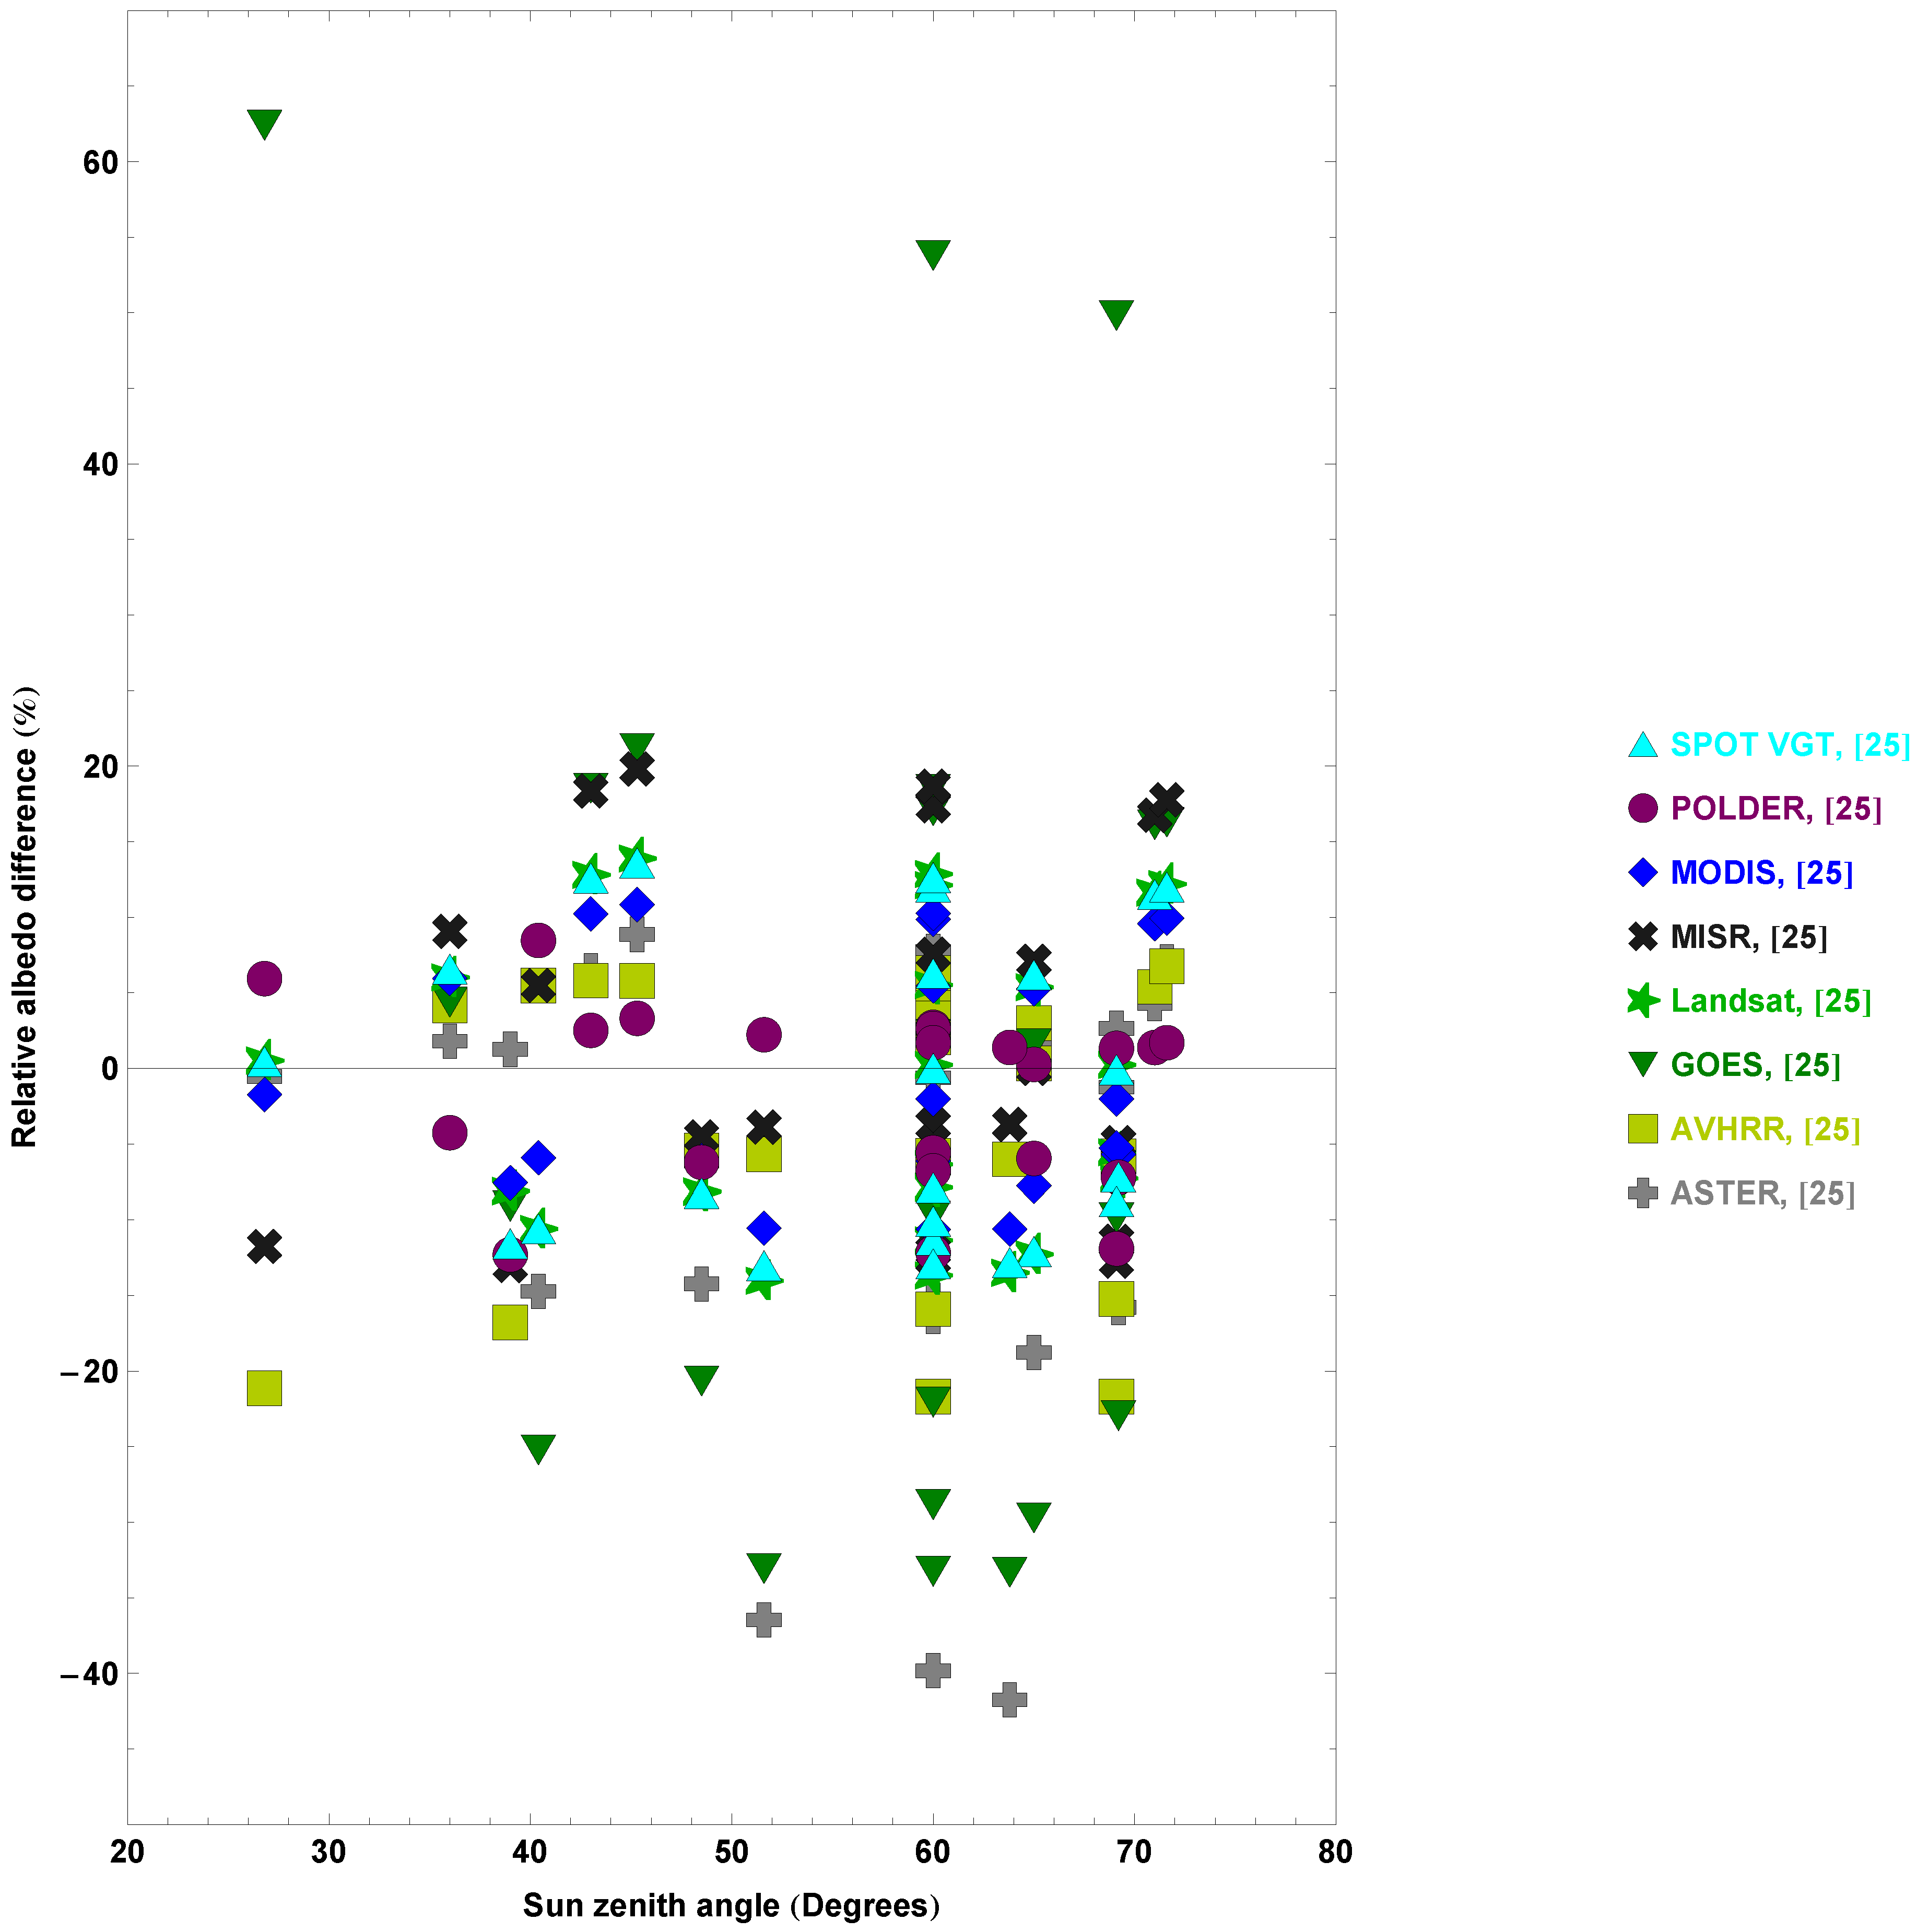
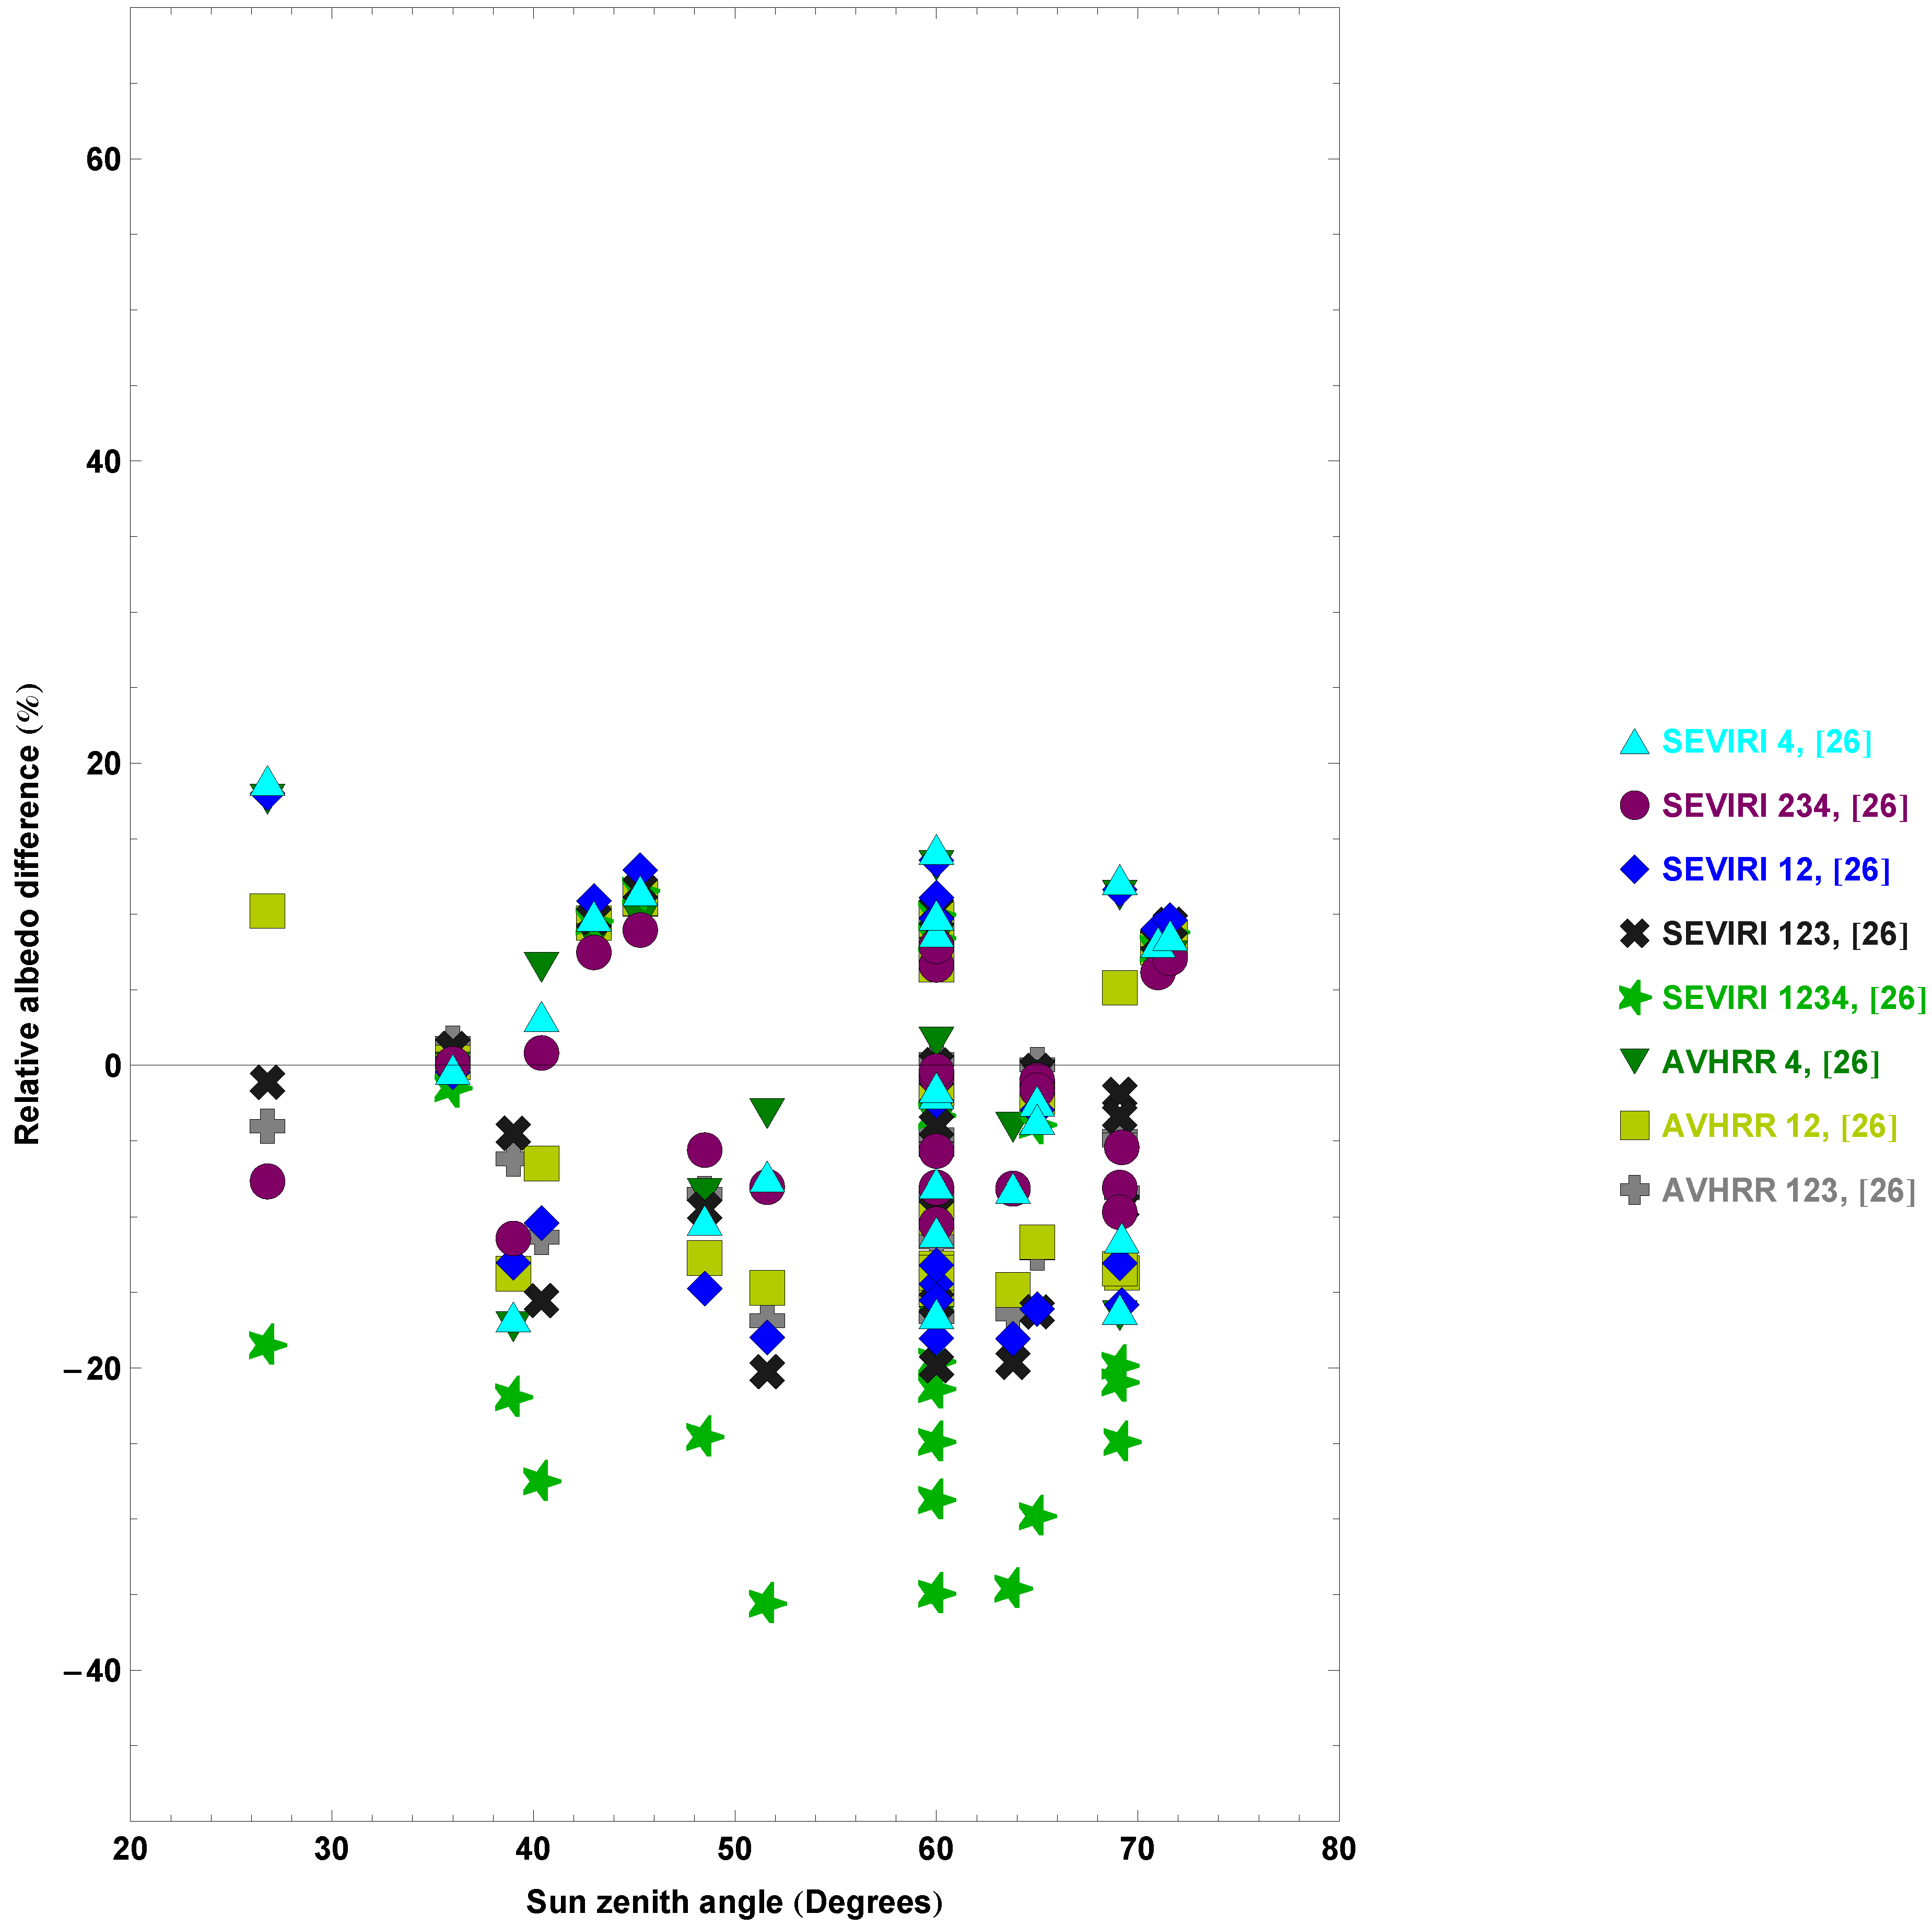
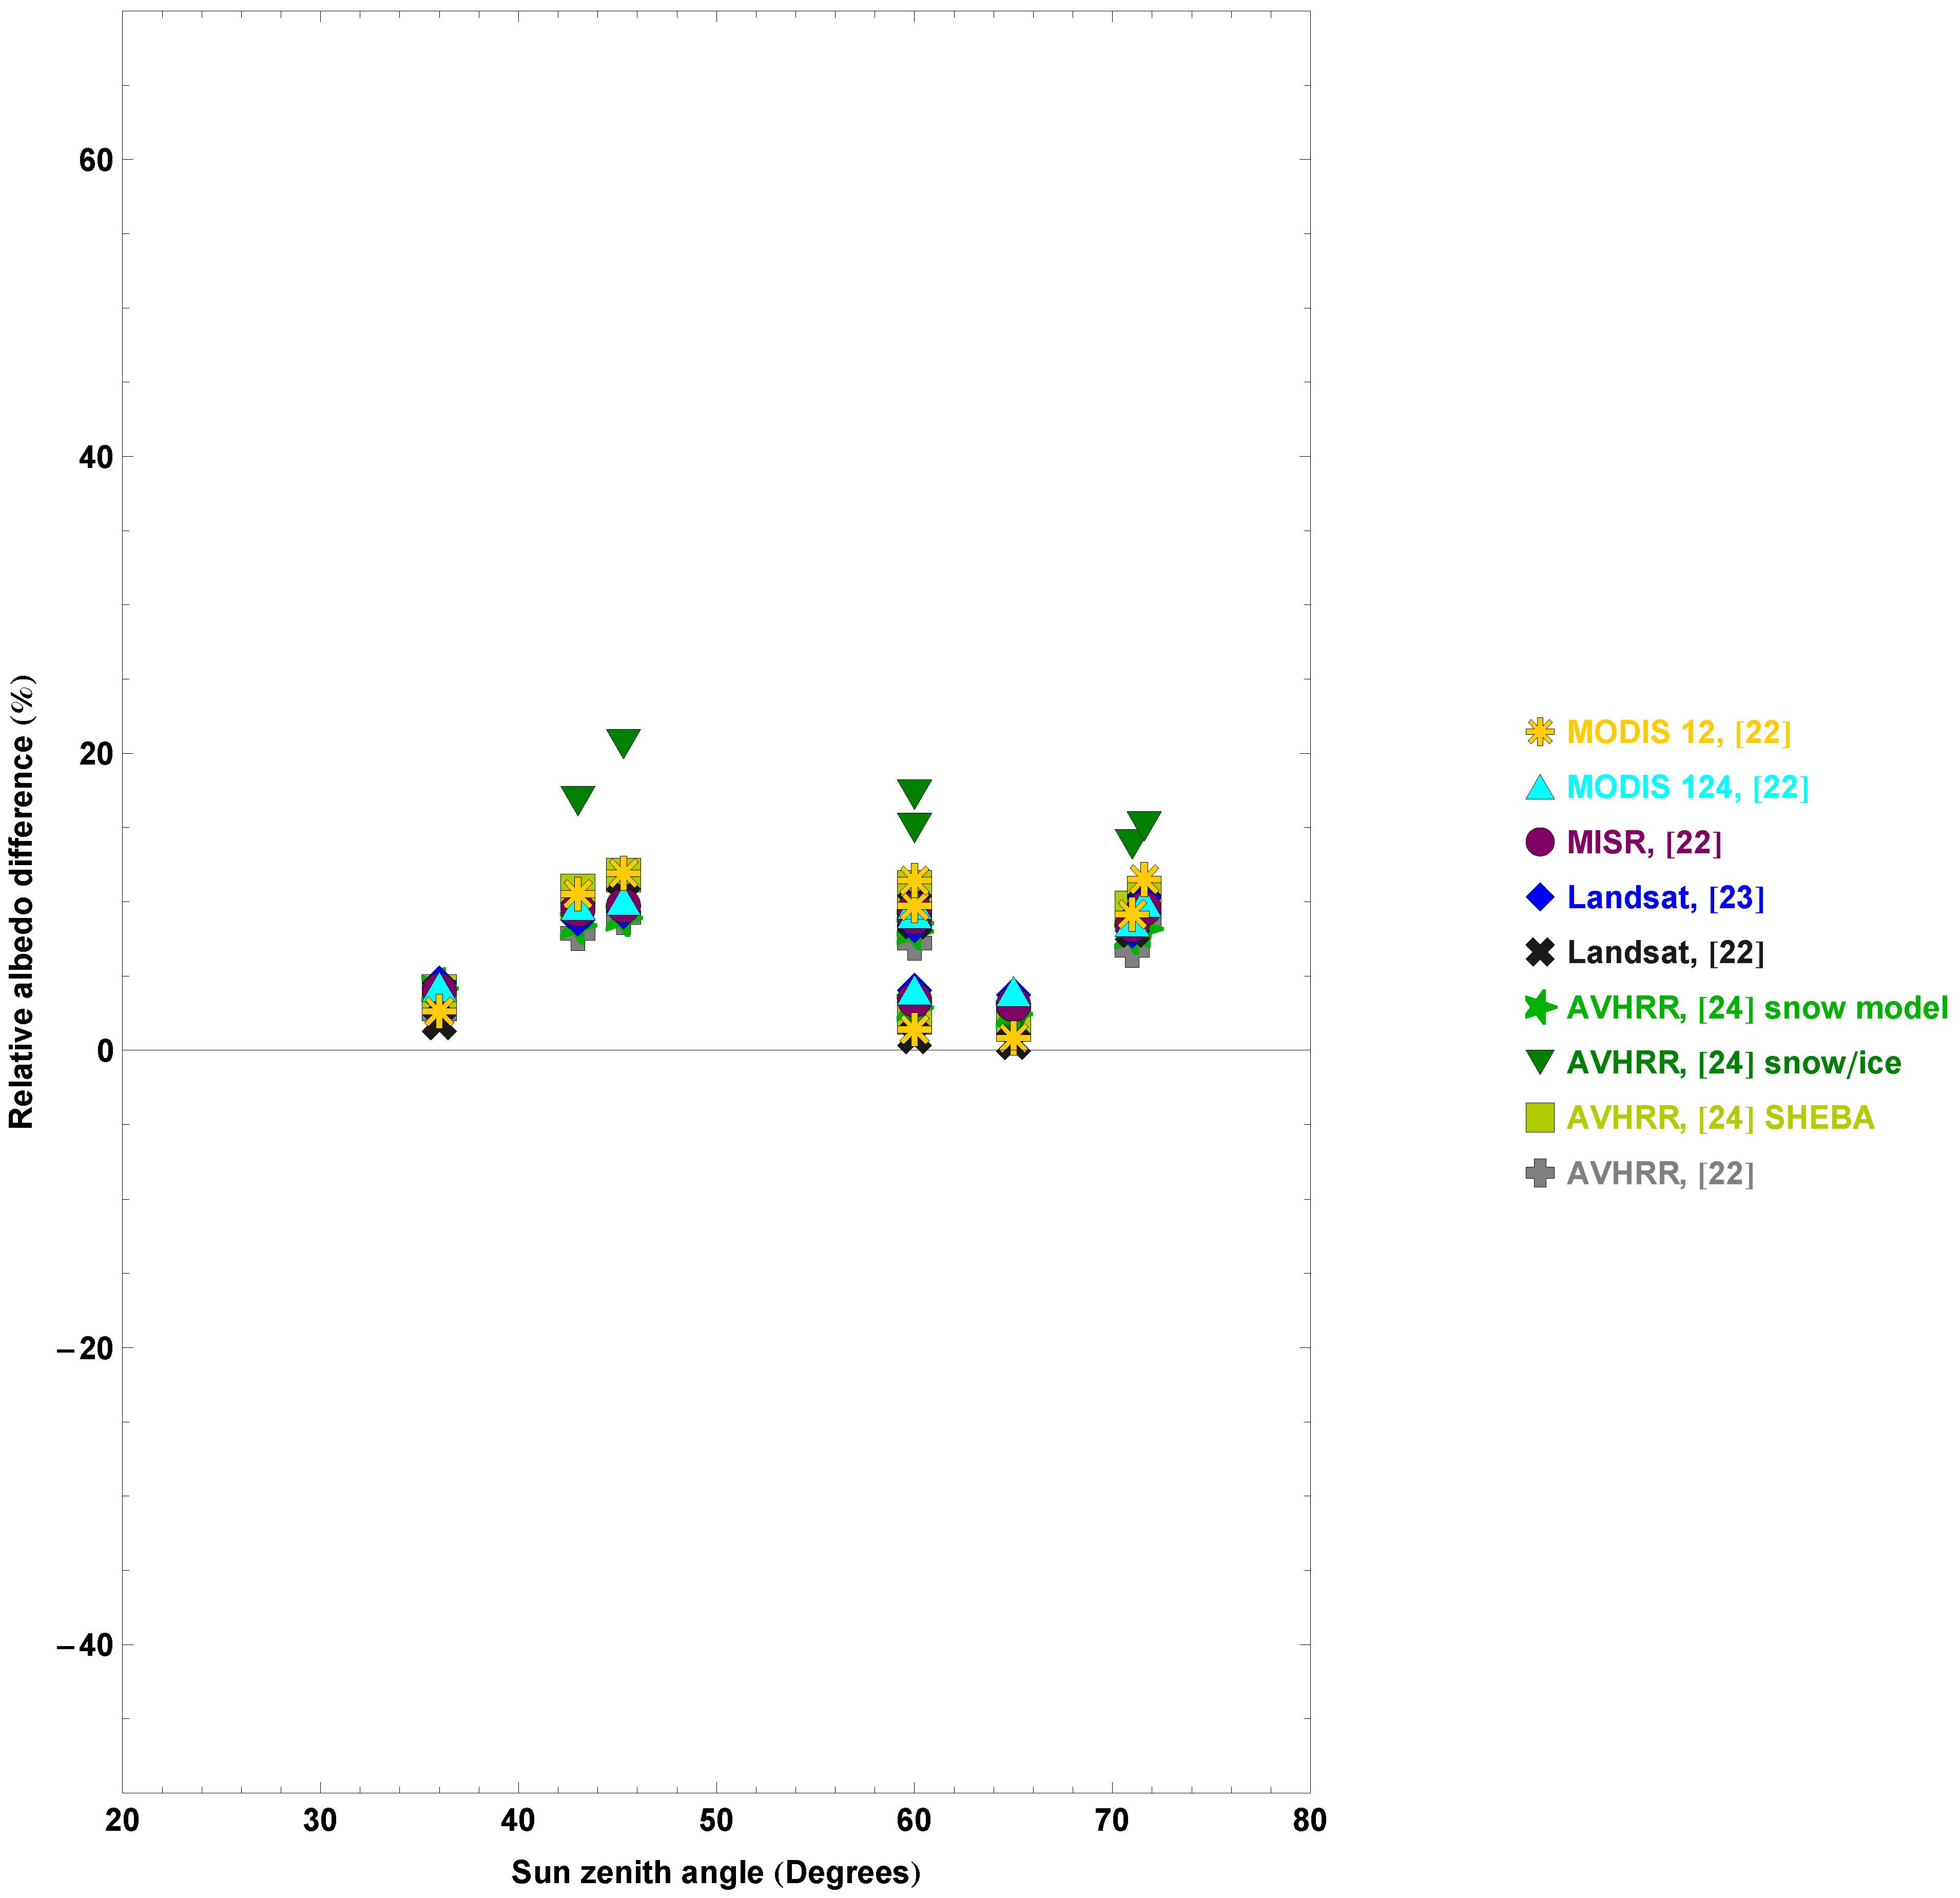
The results are shown in Figure 8, Figure 9, Figure 10, Figure 11 and Figure 12 and in Table 2. The relative difference of the two albedo estimates did not generally show a marked dependence on the solar zenith angle (Figure 8, Figure 9 and Figure 10), but
Figure 7. Left: Differences between the single peat sample from Suonenjoki when wet (dotted curve) and dry (solid line). Right: albedo of a SjÖkulla white gravel sample measured in different weather, cleanness, and ageing conditions. The angle of incidence was 60 ± 5 .
Remotesensing 02 01918 g007
Table 1. The broadband albedo values of various targets at the sun zenith value of 60 obtained by direct integration of the measured spectra.
TargetAlbedo
Grey gravel0.09
Lingonberry0.20
Moss0.24
Sand0.30
Lichen0.31
Dry old snow0.65
Wet lab snow0.66
New snow0.79
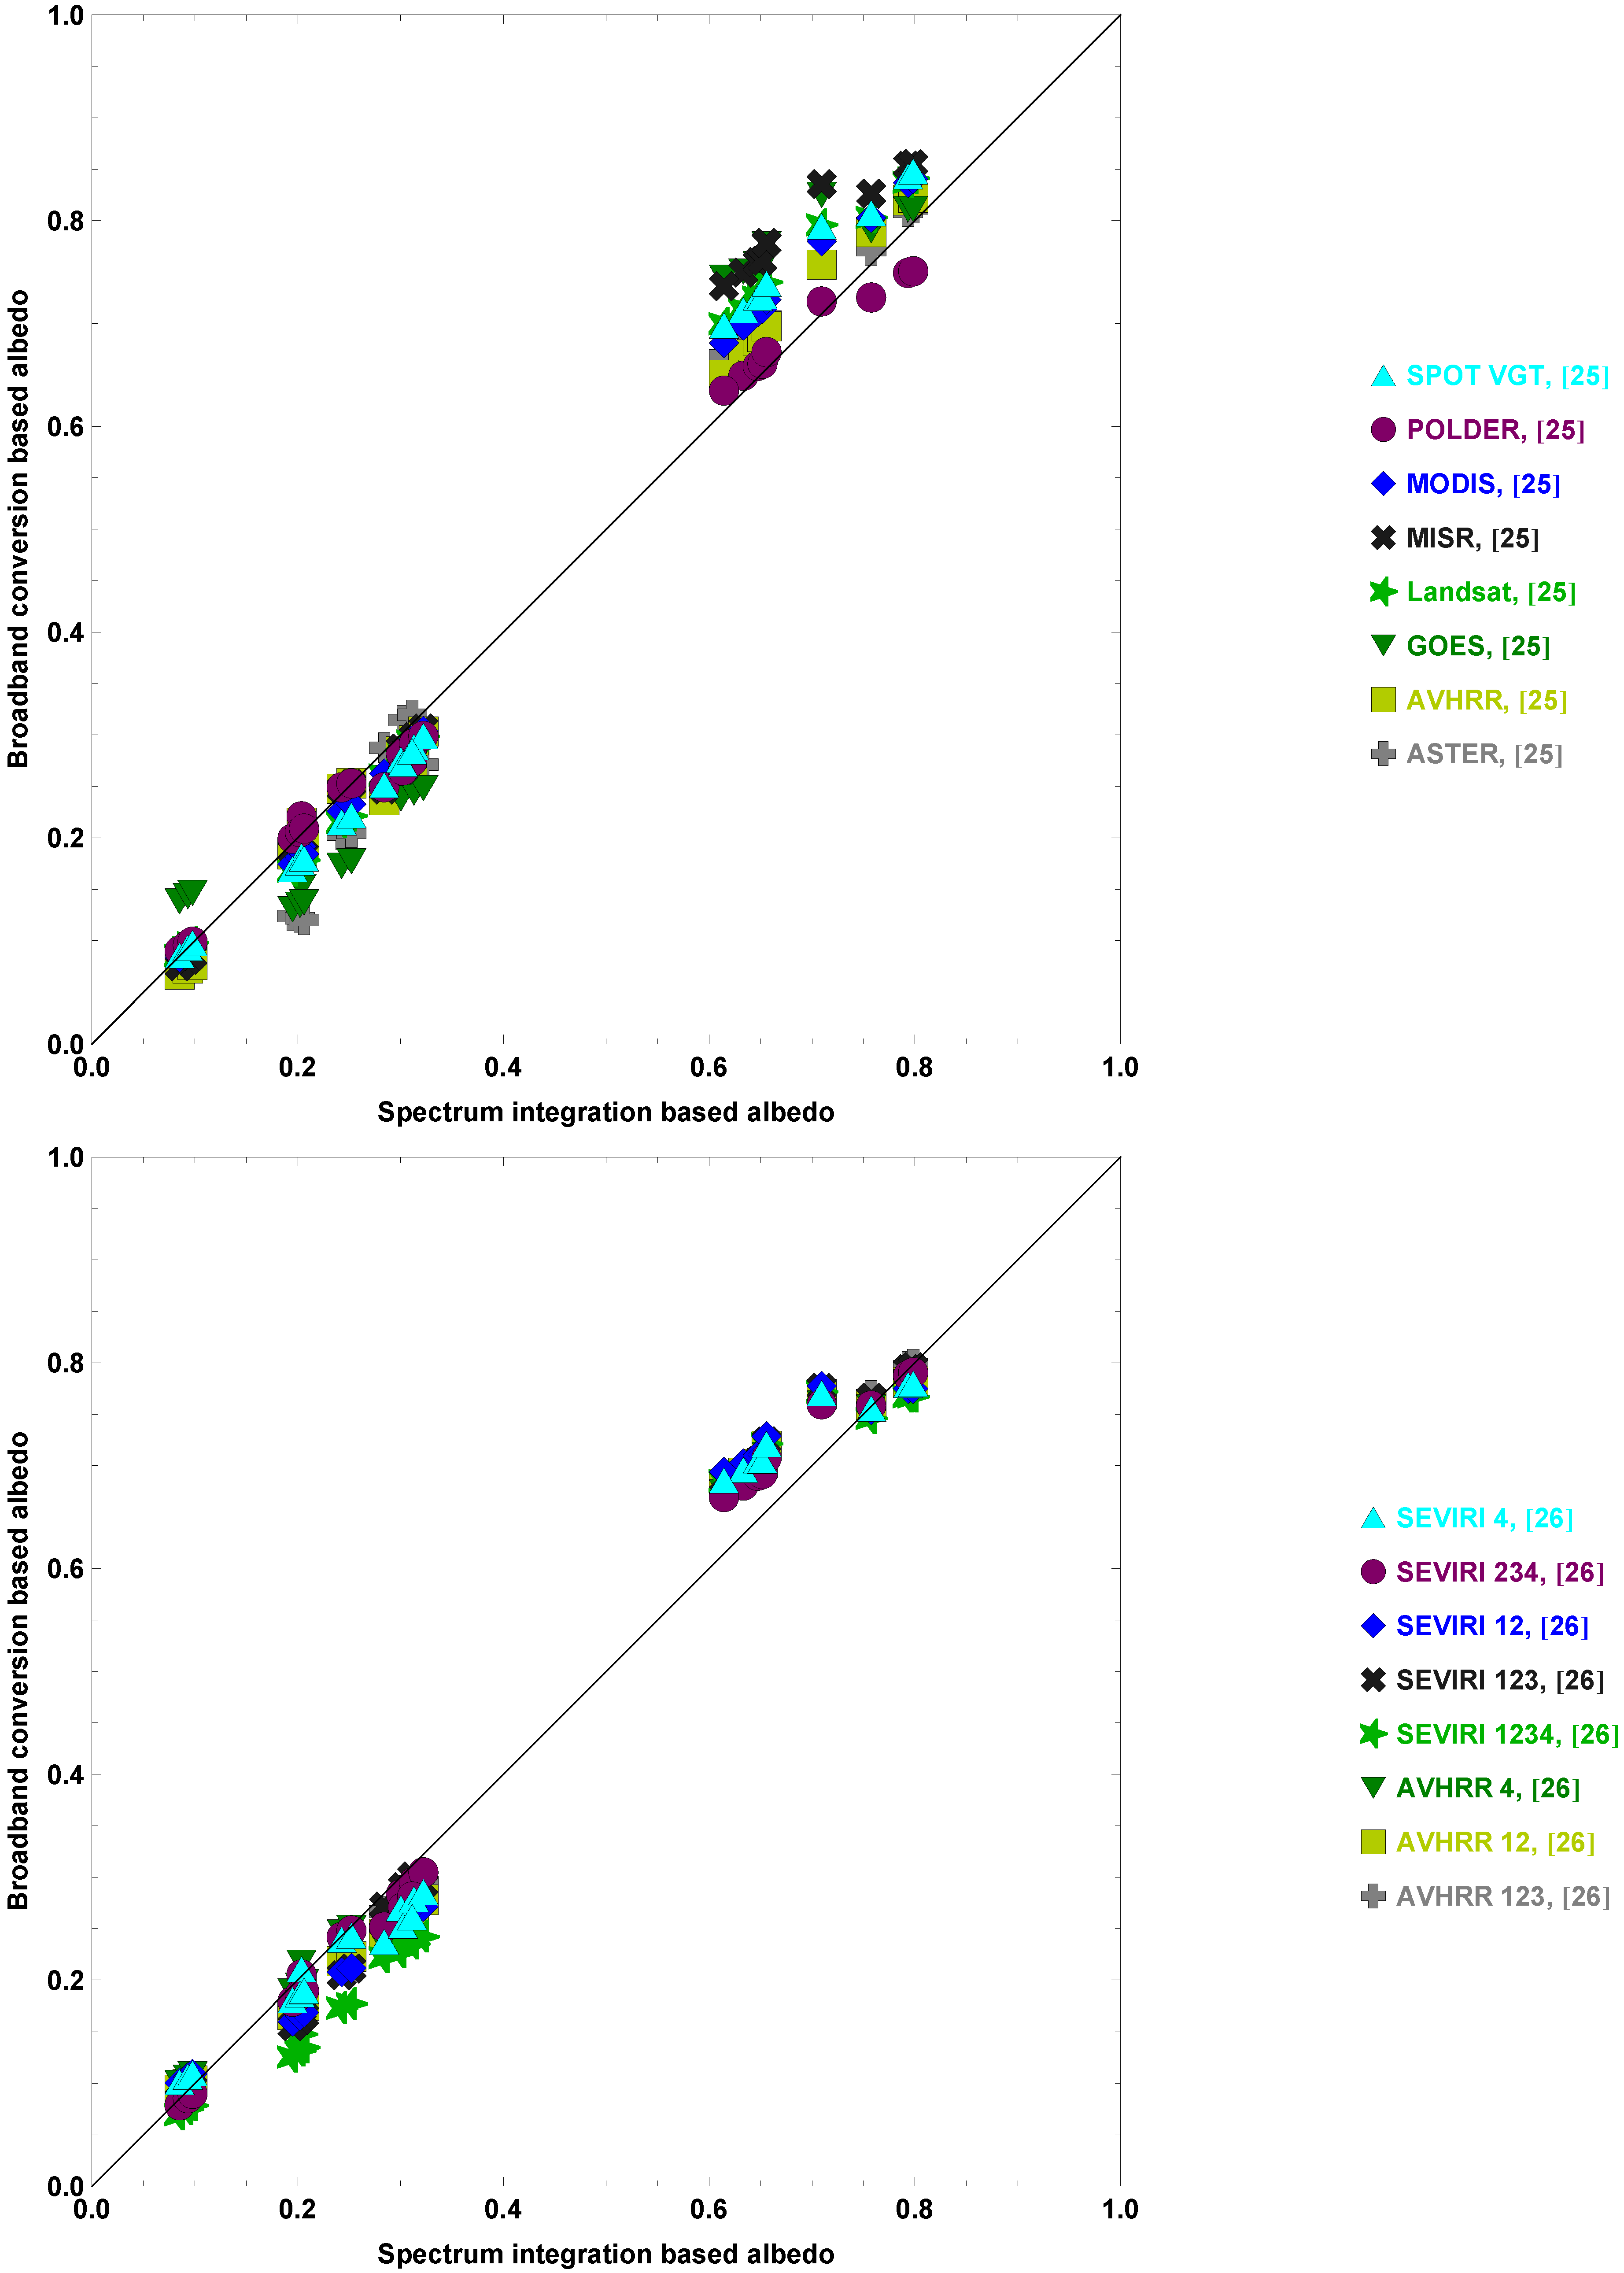
the broadband albedo values obtained using the conversion methods were systematically slightly smaller than the values obtained by integrating the whole spectrum, except for snow. The reason for obtaining smaller albedo values for vegetated targets using the broadband conversion formulas than by integrating the measured spectra is probably also related to the large variation of spectra for diverse species. The magnitude of the difference did not markedly depend on the magnitude of the albedo (Figure 11, Figure 12). The reason for the difference in the snow albedo may be related to the different structures of the measured snow and the Arctic snow used for the development of the broadband conversion formulae of snow. In addition, cloud screening problems with the satellite images may have caused an additional error in the broadband conversion parameters. It is obvious that all broadband conversion methods are rather systematic, so that the deviation from the integrated spectra does not have much scatter.
We computed the mean and standard deviation of the absolute values of the difference which are shown in Table 2 according to target type. We included all solar angle measurements in the statistics. The table is sorted according to the increasing order of the mean difference. For the snow data, we tested
Figure 8. The relative difference between two broadband albedo estimates and the sun zenith angle for various targets. We derived the two albedo values as follows: (1) by using various broadband conversion formulae from Liang [25] and (2) by directly integrating of the measured BRF spectrum.
Remotesensing 02 01918 g008
three sets of broadband conversion algorithms dedicated to snow [22,23,24] in addition to the general purpose methods.
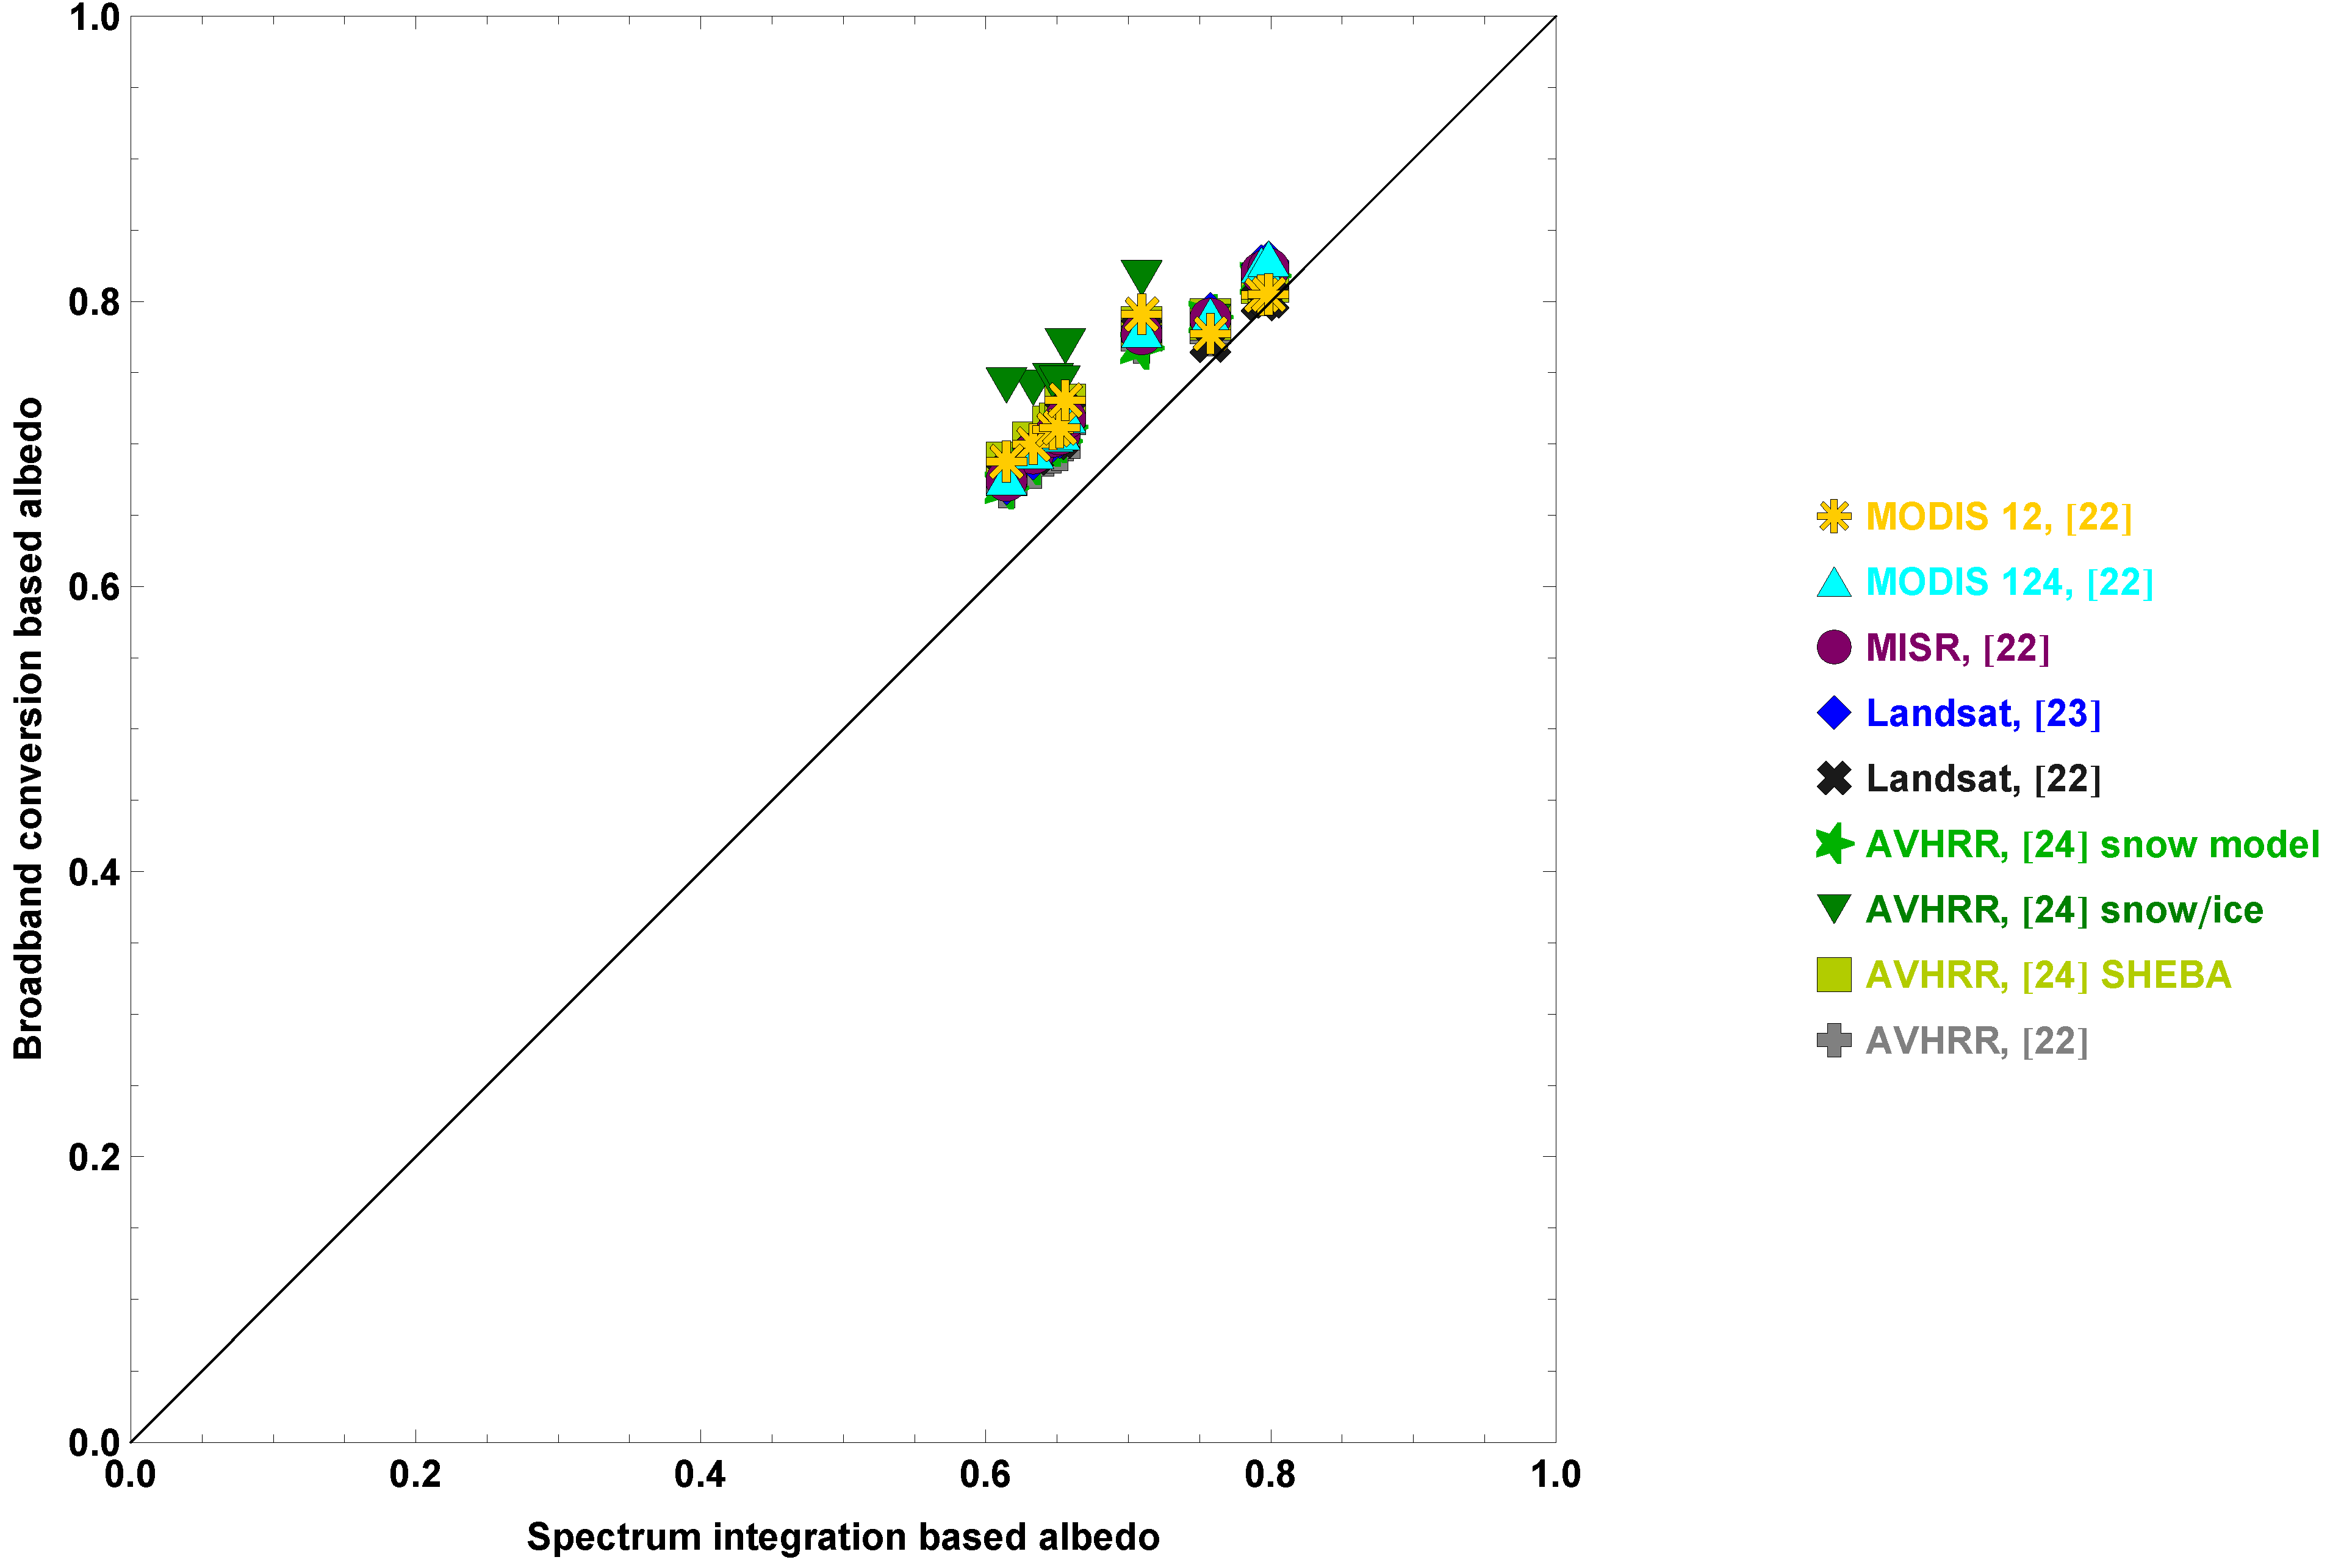
For the studied data set, the mean difference of the broadband albedo values, which we obtained by using various general purpose spectral conversion methods or integration of the whole spectrum, is smaller than 0.03 for 5 methods (Table 2) and smaller than 0.07 for all methods. Here one has to notice that each of the methods tends to produce slightly smaller values than the integrated measured BRF spectrum for albedos smaller than 0.4 and larger values for albedos larger than 0.6 (Figure 11, Figure 12).
Figure 9. The relative difference between two broadband albedo estimates and the sun zenith angle for various targets. We derived the two albedo values as follows: (1) by using various broadband conversion formulae from van Leeuwen and Roujean [26] and (2) by directly integrating the measured BRF spectrum.
Remotesensing 02 01918 g009
While most of the general purpose methods were almost as good for the snow targets as the dedicated ones, with four of them having a mean difference of albedo magnitude smaller than 0.035 [25,26], the small number of snow types in this data set does not permit strong conclusions.
For the whole data set, the standard deviation is smallest for the three broadband conversion methods which had the smallest mean difference. Mostly, the standard deviation values are smaller for land targets other than snow. The very small standard deviation for the MODIS based broadband algorithm [25] of either land or snow targets indicates that the method is systematic and only the snow cover is
Figure 10. The relative difference between two broadband albedo estimates and the sun zenith angle for snow. We derived the two albedo values were derived as follows: (1) by using various dedicated snow broadband conversion formulae from Greuell and Oerlemans, Knap and Oerlemans and Xiong et al. [22,23,24] and (2) by directly integrating the measured BRF spectrum.
Remotesensing 02 01918 g010
problematic, so that the mean deviation is larger than for many other conversion methods (Table 2). Likewise, the MISR-based broadband conversion method [25] is quite good for land targets but not for snow.
The accuracy of the BRF measurements is about 5% for solar zenith angles smaller than 60 and about 10% for larger angles (see Section 2). The rate error for the satellite-based methods is also estimated to bea few percentage points [25,26]. It turned out that, for all broadband conversion methods
Figure 11. The albedo calculated using broadband conversion methods versus the integrated measured BRF spectrum for various targets and the sun zenith angle values. Top: The conversion methods developed by Liang [25] are colour-coded as shown. Bottom: The conversion methods by vanLeeuwen and Roujean [26] are colour-coded as shown.
Remotesensing 02 01918 g011
Figure 12. The albedo calculated using broadband conversion methods versus the integrated measured BRF spectrum for various targets and the sun zenith angle values. The dedicated snow conversion methods developed by Greuell and Oerlemans, Knap and Oerlemans and Xiong et al. [22,23,24] are colour-coded as shown and the target is snow for all points.
Remotesensing 02 01918 g012
tested, the deviation from the value obtained from the integrated spectrum was smaller than 9% for all sun zenith angles used. Hence, it seems that for new snow the satellite-based broadband albedo estimation is reliable. For dry old snow and wet snow, the broadband conversion methods tend to produce systematically higher values than the integrated measured BRF spectrum, but still the agreement is in most cases within 15% for all sun zenith angle values. The dedicated snow methods give the best results for new snow, but for wet and old dry snow the general purpose conversion formulae for POLDER and AVHRR [25] produce estimates closest to the measured values.
For grey gravel, there is no marked bias between the measured and estimated broadband albedo values and the difference is within 15% for 10 of the conversion methods (out of a total of 16). The calculated broadband albedo estimate for sand is systematically smaller than the integrated spectrum in all cases but one, but still the difference is within 15% for 12 of the conversion methods. Here one should notice that the sand measured is the kind which exists in Finland, whereas the broadband conversion formulae have typically been derived for sand found in deserts.
For lingonberry, moss and lichen, the calculated and measured broadband albedo values deviate less than 15% from each other for 10, 12 and 13 conversion methods, respectively. In all cases, the conversion methods tend to produce smaller estimates than the integrated spectrum.
The six broadband conversion methods which produced albedo estimates deviating less than 15% from the values obtained by direct integration of the BRF spectra for all targets and for all sun zenith
Table 2. We obtained the mean and standard deviation values of the difference in estimated albedo values as follows (1) by using various broadband conversion formulae; and (2) by directly integrating the measured BRF spectrum. All targets and sun zenith angles are included.
AllLandSnow
MeanStandard dev.MeanStandard dev.MeanStandard dev.Method
0.0180.0140.0140.0140.0230.015POLDER, [25]
0.0220.0180.0150.010.0340.022SEVIRI 234, [26]
0.0260.0140.0210.0150.0350.007AVHRR, [25]
0.0270.0210.0210.0180.0380.022AVHRR 4, [26]
0.0280.020.0220.0110.0390.026AVHRR 123, [26]
0.0310.0230.0150.0070.0580.011MODIS, [25]
0.0310.0240.0240.0160.0430.03SEVIRI 123, [26]
0.0320.0220.0240.0160.0450.026SEVIRI 4, [26]
0.0340.020.0280.0140.0430.025AVHRR 12, [26]
0.0340.0250.0350.030.0330.017ASTER, [25]
0.0380.0280.020.0110.0690.019Landsat, [25]
0.040.0210.0340.0130.0510.028SEVIRI 12, [26]
0.040.0270.0210.0110.070.016SPOT VGT, [25]
0.0470.0460.0150.0120.0990.029MISR, [25]
0.0550.0220.0590.0220.0480.02SEVIRI 1234, [26]
0.0670.0340.0560.0170.0850.048GOES, [25]
0.0390.02AVHRR, [22]
0.0430.027Landsat, [22]
0.0440.015AVHRR, [24] snow model
0.0490.017MISR, [22]
0.050.015Landsat, [23]
0.0510.03MODIS 12, [22]
0.0520.016MODIS 124, [22]
0.0530.024AVHRR, [24] SHEBA
0.0780.045AVHRR, [24] snow/ice
angle values include: AVHRR 12 [26], Landsat [25], MODIS [25], POLDER [25], SEVIRI 234 [26], and SPOT VGT [25]. For all targets other than snow, the MISR-method [25] provided estimates which deviated less than 15% from the directly-integrated BRF spectrum. When not using any conversion method, the albedo estimates matched the integrated spectrum at an accuracy of better than 10% for all targets, but for the MODIS [25] and POLDER [25] methods only one of the no-snow targets had a poorer match (lingonberry and sand, respectively).
It is not necessarily possible to obtain a perfect match with the tested broadband albedo conversion methods, as they are described using simple statistical relationships which are typically low-order polynomials. In order to test the effect of the polynomial coefficient values on the accuracy of the albedo estimation, we derived the optimal parameter values (for this data set) for the same functions using linear regression. We did this only for the general purpose conversion formulae, including albedos related to all target types and solar angles in the regression data set. We then derived new albedo estimates using the same conversion functions as before, but with the optimised parameter values. The mean difference of the albedo estimates derived in this way showed the best achievable accuracy of the conversion function form for the data set in question. The ratio of the albedo difference between the optimal and original parameter values in the conversion functions is shown in Table 3. It is natural to expect that it would be more difficult to optimise parameters for a one-channel method than for the methods using several channels. This is also revealed by the fact that the three largest ratios belong to single channel methods. In fact, for this data set the AVHRR 4 conversion method by van Leeuwen and Roujean [26] seems to have optimal parameter values for the data set in question, and indeed the mean albedo estimation accuracy using this method is quite high. On the other hand, for this data set, the methods having the smallest ratio of albedo estimation error have the largest potential to still be improved by adjusting the parameter values, although the accuracy is already good when using the original parameter values.
Table 3. The ratio of the mean difference of albedo estimates derived by (1) using broadband conversion; and, (2) direct integration of the BRF spectrum. In the nominator, the broadband conversion has been derived using optimised parameter values and, in the denominator, by using original parameter values.
Optimal/OriginalMethod
0.03MODIS, [25]
0.05Landsat, [25]
0.07SPOT VGT, [25]
0.08ASTER, [25]
0.11SEVIRI 1234, [26]
0.19AVHRR, [25]
0.31AVHRR 123, [26]
0.31MISR, [25]
0.31POLDER, [25]
0.35SEVIRI 123, [26]
0.41SEVIRI 234, [26]
0.63SEVIRI 12, [26]
0.64AVHRR 12, [26]
0.64GOES, [25]
0.88SEVIRI 4, [26]
0.95AVHRR 4, [26]
The spatial resolution of the satellite, for which the conversion method has been derived, did not affect the match of the two albedo estimates. This is understandable, because even the highest satellite resolution (15 m x 15 m, ASTER) is much greater than the measured samples, which are in centimetre-scale. Moreover, a satellite pixel will most likely contain a mixture of several targets, especially if there is vegetation present. Therefore, an exact match between two albedo estimates for each individual target is not a necessary requirement for a good broadband conversion formula.

4. Discussion

The increasing trend of the zenith angle dependence of the albedo agrees well with previous measurements with many kind of targets, [27,28,29]. However, often the target itself varies faster than the zenith angle changes, and deducting clear dependence from data can be uncertain, as already noted by Wuttke et al. [30], based on Antarctic snow albedo observations. The diurnal asymmetry is known to affect both vegetation [31] and snow data [9].
There is no single broadband conversion method which could produce the closest albedo estimate for the measured BRF spectrum in all target cases. For AVHRR, a method using the visible and near infrared bands gives the closest estimate in half of the cases. This supports the positive results obtained previously [25]. For SEVIRI, the method which applies the channels 2, 3 and 4 (Table 4) gives the closest estimates in most cases. Without channel 4, and when also including channel 3 in addition to channels 1 and 2, the results improve or deteriorate depending on the target in question. Previously, the channel combination 1, 2 and 3 has been found to be the most promising, but the combination 2, 3 and 4 has also produced positive results [26]. The results of this study are, in that respect, close to previous results. However, in this study the use of all four channels of SEVIRI was not successful, unlike in the previous study.
Our results showed that the broadband conversion methods derived for various satellite instruments in general display a similar behaviour. The deviation from the measured and integrated BRF spectrum has roughly the same solar zenith angle dependence for all methods, but the absolute difference has a wide variation range. In fact, the broadband albedo estimates obtained using different broadband conversion methods typically differ from each other at least as much as from the value obtained by direct integration of the measured BRF spectrum. One reason for the discrepancy between the various broadband conversion methods could be the effect of the atmosphere on the measured ground truth, which then would affect the parameter values of the conversions formulae [11]. Thus, the target accuracy of climate models for broadband albedo is quite demanding for satellite retrieval.

5. Conclusions

We have resolved the hemispherical albedos of nine targets as a function of the angle of incidence, using data from the Finnish Geodetic Institute’s BRF library. With almost all targets and wavelengths, the hemispherical albedo is a monotonically increasing function of the angle of incidence. Typically, this brightening is between 10% and 30% (relative), but it could be larger outside the measurement range. The spectral shape depends slightly on the solar zenith angle, in other words, all features look qualitatively similar, but numerical differences and the ratios between channels can vary a by few percentage points. Variations in albedo are not only significant between diverse targets, but also within the same class of surface types. Since natural surfaces are often a mixture of many surface types (various vegetation and soil types, snow, ...) while the measurements covered only the most ideal and homogeneous surfaces, the true variation of albedos is even larger than shown in this study.
For more accurate and useful albedo models, many more dedicated albedo measurements should be performed. Albedometers and spectrometers using cosine collectors can directly measure albedo values of homogeneous areas under sunlight. There is still a need for an instrument that can measure more accurately less homogeneous targets with a large range of illumination directions and analyse the contribution of diverse components.
The agreement between the measured and calculated broadband albedo values mostly fell within the accuracy of the measurements and broadband conversion methods. The solar zenith angle or the spatial resolution of the satellite instrument did not play a significant role in the accuracy of the broadband conversion method. The general purpose conversion formulae produced nearly as good results for snow as the snow-dedicated methods.

Author Contribution

Jouni Peltoniemi supervised the measurements, analysed the data and composed the paper, with strong contributions from everyone. Terhikki Manninen and Aku Riihelä analysed conversion formulae and albedo parametrisation schemes and wrote the corresponding sections. Juha Suomalainen, Eetu Puttonen and Teemu Hakala performed the measurements. Teemu Hakala and Juha Suomalainen constructed the measurement instrumentation.

Acknowledgements

The work has been supported by the Academy of Finland, the European Commission Interreg program project Norsen, and the Finnish Ministry of Agriculture and Forestry. Some measurements were made during the Snortex campaign, which was financially supported by EUMETSAT through the projects Climate-SAF, Land-SAF and Hydro-SAF. The authors would like to thank many of our Norsen and Snortex partners.

A. Appendix

Table 4. The studied broadband conversion methods of various satellite instruments and respective channels and resolutions.
Instrument/Resolution/Conversion formula, α b b = Wavelength range of channels used in the conversion formula [μm]
Method Channel 1Channel 2Channel 3Channel 4Channel 5Channel 6*
ASTER, 15 m [25] 0 . 484 α 1 + 0 . 335 α 3 0 . 324 α 5 + 0 . 551 α 6 + 0 . 305 α 8 0.52…0.60.63…0.690.78…0.861.6…1.72.15…2.182.18…2.22a
     0 . 367 α 9 0 . 0015
AVHRR, 1.1 km [25] 0 . 3376 α 1 2 0 . 2707 α 2 2 + 0 . 7074 α 1 α 2 + 0 . 2915 α 1 0.57…0.710.72…1.01
     + 0 . 5256 α 2 + 0 . 0035
GOES, 4 km [25] 0 . 0759 + 0 . 7712 α 1 0.52…0.72
Landsat, 30 km [25] 0 . 356 α 1 + 0 . 130 α 3 + 0 . 373 α 4 + 0 . 085 α 5 + 0 . 072 α 7 0.45…0.510.52…0.600.63…0.690.75…0.901.55…1.752.09…2.35
     0 . 0018
MISR, 275 m [25] 0 . 126 α 2 + 0 . 343 α 3 + 0 . 451 α 4 + 0 . 0037 0.42…0.450.54…0.550.66…0.670.85…0.87
MODIS, 500 m [25] 0 . 160 α 1 + 0 . 291 α 2 + 0 . 243 α 3 + 0 . 116 α 4 + 0 . 112 α 5 0.62…0.670.84…0.870.46…0.480.54…0.561.23…1.251.63…1.65b
     + 0 . 081 α 7 0 . 0015
POLDER, 6 km [25] 0 . 112 α 1 + 0 . 388 α 2 0 . 266 α 3 + 0 . 668 α 4 + 0 . 0019 0.43…0.460.66…0.680.74…0.790.84…0.88
SPOT, 1 km [25] 0 . 0022 + 0 . 3512 α 1 + 0 . 1629 α 2 + 0 . 3415 α 3 + 0 . 1651 α 4 0.43…0.470.61…0.680.78…0.891.58…1.75
EPS/AVHRR, 1 km[26] 0.586…0.6790.733…0.9791.585…1.6310.437…0.970
  123 0 . 3880 + 0 . 5234 α 1 + 0 . 3102 α 2 + 0 . 1097 α 3
  12 3 . 0238 + 0 . 4967 α 1 + 0 . 3148 α 2
  4 3 . 6848 + 0 . 8008 α 4
SEVIRI, 5 km [26] 0.601…0.6780.780…0.8391.572…1.6980.476…0.910
  124 0 . 5095 + 0 . 5972 α 1 + 0 . 3071 α 2 0 . 0872 α 4
  123 0 . 4724 + 0 . 5370 α 1 + 0 . 2805 α 2 + 0 . 1297 α 3
  12 3 . 8259 + 0 . 5119 α 1 + 0 . 2782 α 2
  234 0 . 0831 + 0 . 0541 α 2 + 0 . 1106 α 3 + 0 . 7659 α 4
  4 3 . 8317 + 0 . 7926 α 4
AVHRR, 1.1 km [22] 0 . 718 α 1 0 . 137 α 1 2 + 0 . 317 α 2 2 0.574…0.7040.720…1.000
Landsat, 30 m [22] 0 . 422 α 2 + 0 . 337 α 4 + 0 . 113 α 4 2 0.519…0.6110.772…0.898
MISR , 275 m [22] 0 . 383 α 2 2 + 0 . 743 α 3 0 . 624 α 3 2 + 0 . 402 α 4 2 0.548…0.5650.663…0.6790.852…0.879
MODIS, [22] 0.620…0.6770.838…0.8750.544…0.564
  500 m, 124 0 . 734 α 1 0 . 717 α 1 2 + 0 . 428 α 2 2 + 0 . 458 α 4 2
  250 m, 12 0 . 714 α 1 0 . 110 α 1 2 + 0 . 286 α 2 2
Landsat, 30 m [23] 0 . 726 α 2 0 . 322 α 2 2 0 . 051 α 4 + 0 . 581 α 4 2 0.52…0.600.75…0.90
AVHRR, 1.1 km [24]
  SHEBA data 0 . 007 + 0 . 542 α 1 + 0 . 340 α 2 0.58…0.680.725…1.1
  Snow model 0 . 007 + 0 . 434 α 1 + 0 . 464 α 2
  Snow/ ice 0 . 28 ( 1 + 8 . 26 γ ) α 1 + 0 . 63 ( 1 3 . 96 γ ) α 2 + 0 . 22 ,
where γ = ( α 1 α 2 ) / ( α 1 + α 2 )
aChannels 7—9: 2.23… 2.28, 2.29… 2.36, 2.36… 2.43bChannel 7: 2.11…2.15

References

  1. Jin, Y.; Schaaf, C.B.; Woodcock, C.E.; Gao, F.; Li, X.; Strahler, A.H.; Lucht, W.; Liang, S. Consistency of MODIS surface bidirectional reflectance distribution function and albedo retrievals: 2. Validation. J. Geophys. Res. 2003, 108. [Google Scholar] [CrossRef]
  2. Liang, X.Z.; Xu, M.; Gao, W.; Kunkel, K.; Slusser, J.; Dai, Y.; Min, Q.; Houser, P.R.; Rodell, M.; Schaaf, C.B.; Gao, F. Development of land surface albedo parameterization based on Moderate Resolution Imaging Spectroradiometer (MODIS) data. J. Geophys. Res. 2005, 110. [Google Scholar] [CrossRef]
  3. Wang, Z.; Zeng, X.; Barlage, M. Moderate Resolution Imaging Spectroradiometer bidirectional reflectance distribution function-based albedo parameterization for weather and climate models. J. Geophys. Res. 2007, 112. [Google Scholar] [CrossRef]
  4. Pinty, B.; Roveda, F.; Verstraete, M.; Gobron, N.; Govaerts, Y.; Martonchik, J.; Diner, D.; Kahn, R. Surface albedo retrieval from METEOSAT: Part 1. theory. J. Geophys. Res. 2000, D-105, 18099–18112. [Google Scholar] [CrossRef]
  5. Aminou, D. MSG’s SEVIRI Instrument. ESA Bulletin 2002, 0376–4265. [Google Scholar]
  6. Schulz, J.; Albert, P.; Behr, H.D.; Caprion, D.; Deneke, H.; Dewitte, S.; Dürr, B.; Fuchs, P.; Gratzki, A.; Hechler, P.; Hollmann, R.; Johnston, S.; Karlsson, K.G.; Manninen, T.; Müller, R.; Reuter, M.; Riihelä, A.; Roebeling, R.; Selbach, N.; Tetzlaff, A.; Thomas, W.; Werscheck, M.; Wolters, E.; Zelenka, A. Operational climate monitoring from space: The EUMETSAT satellite application facility on climate monitoring (CM-SAF). Atmos. Chem. Phys. 2009, 9, 1–23. [Google Scholar] [CrossRef]
  7. Diner, D.J.; Braswell, B.; Davies, R.; Gobron, N.; Hu, J.; Jin, Y.; Kahn, R.; Knyazikhin, Y.; Loeb, N.; Muller, J.P.; Nolin, A.; Pinty, B.; Schaaf, C.; Seiz, G.; Stroeve, J. The value of multiangle measurements for retrieving structurally and radiatively consistent properties of clouds, aerosols, and surfaces. Remote Sens. Environ. 2005, 97, 495–518. [Google Scholar] [CrossRef]
  8. Pirazzini, R. Surface albedo measurements over Antarctic sites in summer. J. Geophys. Res. 2004, 109. [Google Scholar] [CrossRef]
  9. Pirazzini, R. Factors Controlling the Surface Energy Budget over Snow and Ice. Ph.D. Thesis, Department of Physics, University of Helsinki, Helsinki, Finland, 2008. [Google Scholar]
  10. Riihelä, A.; Manninen, T. Measuring the vertical albedo profile of a subarctic boreal forest canopy. Silva Fennica 2008, 42, 807–815. [Google Scholar] [CrossRef]
  11. Manninen, T.; Riihelä, A. Atmospheric effect on validation of broadband surface albedo (SAL) product of CM SAF using mast measurements. In Proceedings of the EUMETSAT Meteorological Satellite Conference, Darmstadt, Germany, 2008.
  12. Manninen, T.; Stenberg, P. Simulation of the effect of snow covered forest floor on the total forest albedo. Agr. Forest Meteoro. 2008, 149, 303–319. [Google Scholar] [CrossRef]
  13. Manninen, T.; Siljamo, N.; Poutiainen, J. Validation of the surface albedo product (SAL) of CM SAF in winter conditions. In Proceedings of the EUMETSAT Meteorological Satellite Conference, Maputo, Mozambique, 2006; pp. 48–54.
  14. Peltoniemi, J.; Kaasalainen, S.; Näränen, J.; Rautiainen, M.; Stenberg, P.; Smolander, H.; Smolander, S.; Voipio, P. BRDF measurement of understory vegetation in pine forests: dwarf shrubs, lichen and moss. Remote Sens. Environ. 2005, 94, 343–354. [Google Scholar] [CrossRef]
  15. Peltoniemi, J.; Kaasalainen, S.; Näränen, J.; Matikainen, L.; Piironen, J. Measurement of directional and spectral signatures of light reflectance by snow. IEEE Trans. Geosci. Remote Sens. 2005, 43, 2294–2304. [Google Scholar] [CrossRef]
  16. Peltoniemi, J.; Piironen, J.; Näränen, J.; Suomalainen, J.; Kuittinen, R.; Honkavaara, E.; Markelin, L. Bidirectional reflectance spectrometry of gravel at the Sjökulla test field. ISPRS J. Photogramm. Remote Sens. 2007, 62, 434–446. [Google Scholar] [CrossRef]
  17. Puttonen, E.; Suomalainen, J.; Hakala, T.; Peltoniemi, J. Measurement of reflectance properties of asphalt surfaces and their usability as reference targets for aerial photos. IEEE Trans. Geosci. Remote Sens. 2009, 47, 2330–2339. [Google Scholar] [CrossRef]
  18. Suomalainen, J.; Hakala, T.; Puttonen, E.; Peltoniemi, J. Polarised bidirectional reflectance factor measurements from vegetated land surfaces. J. Quant. Spectrosc. Radiat. Transfer 2009, 110, 1044–1056. [Google Scholar] [CrossRef]
  19. Peltoniemi, J.; Hakala, T.; Suomalainen, J.; Puttonen, E. Polarised bidirectional reflectance factor measurements from snow, soil and gravel. J. Quant. Spectrosc. Radiat. Transfer 2009, 110, 1940–1953. [Google Scholar] [CrossRef]
  20. Suomalainen, J.; Hakala, T.; Peltoniemi, J.; Puttonen, E. Polarised Multiangular Reflectance Measurements Using Finnish Geodetic Institute Field Goniospectrometer. Sensors 2009, 9, 3891–3907. [Google Scholar] [CrossRef] [PubMed]
  21. Honkavaara, E.; Peltoniemi, J.; Ahokas, E.; Kuittinen, R.; Hyyppä, J.; Jaakkola, J.; Kaartinen, H.; Markelin, L.; Nurminen, K.; Suomalainen, J. A permanent test field for digital photogrammetric systems. Photogramm. Eng. Remote Sens. 2008, 74, 95–106. [Google Scholar] [CrossRef]
  22. Greuell, W.; Oerlemans, J. Narrowband-to-broadband albedo conversion for glacier ice and snow: equations based on modeling and ranges of validity of the equations. Remote Sens. Environ. 2004, 89, 95–105. [Google Scholar] [CrossRef]
  23. Knap, W.; Oerlemans, J. The surface albedo of the Greenland ice sheet: Satellite-derived and in situ measurements in the Søndre Strøfjord area during the 1991 melt season. J. Glaciol. 1996, 42, 364–374. [Google Scholar]
  24. Xiong, X.; Stamnes, K.; Lubin, D. Surface Albedo over the Arctic Ocean Derived from AVHRR and Its Validation with SHEBA Data. J. Appl. Meteor. 2002, 41, 413–425. [Google Scholar] [CrossRef]
  25. Liang, S. Narrowband to broadband conversions of land surface albedo. I Algorithms. Remote Sens. Environ. 2000, 76, 213–238. [Google Scholar] [CrossRef]
  26. van Leeuwen, W.; Roujean, J.L. Land surface albedo from the synergistic use of polar (EPS) and geo-stationary (MSG) observing systems. An assessment of physical uncertainties. Remote Sens. Environ. 2002, 81, 273–289. [Google Scholar] [CrossRef]
  27. Privette, J.L.; Eck, T.F.; Deering, D.W. Estimating spectral albedo and nadir reflectance through inversion of simple BRDF models with AVItRR/MODIS-Iike. J. Geophys. Res. 1997, 102, 29529–29542. [Google Scholar] [CrossRef]
  28. Wang, Z.; Barlage, M.; Zeng, X.; Dickinson, R.E.; Schaaf, C.B. The solar zenith angle dependence of desert albedo. Geophys. Res. Lett. 2005, 32. [Google Scholar] [CrossRef]
  29. Grenfell, T.; Warren, S.; Mullen, P. Reflection of solar radiation by the Antarctic snow surface at ultraviolet, visible and near-infrared wavelengths. J. Geophys. Res. 1994, 99, 18669–18684. [Google Scholar] [CrossRef]
  30. Wuttke, S.; Seckmeyer, G.; König-Langlo, G. Measurements of spectral snow albedo at Neumayer, Antarctica. Ann. Geophys. 2006, 24, 7–21. [Google Scholar] [CrossRef] [Green Version]
  31. Song, J. Diurnal asymmetry in surface albedo. Agr. Forest Meteor. 1998, 92, 181–189. [Google Scholar] [CrossRef]