Article

Flood Susceptibility and Potential Flood Risk Assessment in Afghanistan Using Morphometric and Socioeconomic Indicators

by
Qutbudin Ishanch
1,
Kanchan Mishra
1,
Christiane Zarfl
1 and
Kathryn E. Fitzsimmons
2,*
1
Department of Geosciences, University of Tübingen, 72076 Tübingen, Germany
2
School of Earth Atmosphere and Environment, Monash University, Melbourne, VIC 3800, Australia
*
Author to whom correspondence should be addressed.
Remote Sens. 2026, 18(9), 1411; https://doi.org/10.3390/rs18091411
Submission received: 26 March 2026 / Revised: 24 April 2026 / Accepted: 29 April 2026 / Published: 2 May 2026

Highlights

What are the main findings?
  • National-scale flood susceptibility, vulnerability, and a potential flood-risk index were mapped across Afghanistan using an integrated RS-GIS framework combining PCA and AHP.
  • Eastern and northeastern subbasins, especially in the Panj-Amu and Kabul River basins, show the highest flood susceptibility, while densely populated northern and eastern provinces exhibit the greatest vulnerability and composite risk.
What is the implication of the main finding?
  • The resulting maps support evidence-based prioritisation of mitigation and adaptation in repeatedly affected provinces, particularly where high susceptibility coincides with high social vulnerability.
  • The proposed framework may be adapted to other data-scarce and conflict-affected mountain regions after local recalibration of indicators, weights, and validation datasets.

Abstract

Afghanistan is highly vulnerable to climate-driven extremes because of its combination of rugged geography and socio-political instability. Frequent events of extreme precipitation, floods, and droughts pose severe socio-economic and environmental challenges. Floods are particularly destructive, yet national-scale potential flood risk in Afghanistan has not been systematically assessed, largely due to limited data and field access. This study addresses this gap by mapping flood susceptibility, vulnerability, and risk using remote sensing (RS) and geographic information systems (GIS) at both subbasin and provincial scales. We apply a hybrid approach that combines Principal Component Analysis (PCA) to identify key environmental, climatic, and socio-economic indicators with the Analytic Hierarchy Process (AHP) to derive consistent weights and reduce subjectivity in decision-making. The results show that the eastern and northeastern ssubbasins especially within the Panj-Amu and Kabul River basins, have the highest flood susceptibility due to intense precipitation, steep terrain, and efficient drainage. Vulnerability increases in the densely populated northern and northeastern provinces, where land-use change and socio-economic constraints elevate flood-related impacts. Overall, 31% and 20% of study areas are classified as Very High and High vulnerability zones, respectively. The composite potential flood-risk index identifies that approximately 24% and 22% of Afghanistan fall within Very High and High flood risk zones, concentrated in the northern and eastern provinces. Model performance, evaluated using Receiver Operating Characteristic (ROC) curves and Area Under the Curve (AUC), indicates strong agreement between mapped Very High/High risk zones and frequently flooded provinces, with the upper-threshold scenario yielding an AUC of 0.913. These findings support targeted resource allocation, mitigation planning, and disaster-risk reduction in data-scarce and conflict-affected mountain regions.

1. Introduction

Rapid climatic changes in recent decades have raised global concern about the risk and impacts of floods, droughts and extreme precipitation. Such events are intensified in frequency, magnitude, and duration worldwide [1]. Floods are particularly devastating due to their severe social, economic, and environmental impacts [2,3]. The body of literature reporting damage to life and infrastructure associated with flooding events has increased substantially over the last few decades [3,4]. For example, the October 2012 storm and associated flood, which hit New York and New Jersey in the United States of America (USA), caused net damages exceeding US$60 billion [5]. Heavy floods in the Elbe and Danube basins of central Europe in June 2013 resulted in dozens of fatalities and a total loss of €12 billion [6]. The Global South is not immune; in September 2022, Pakistan witnessed catastrophic flooding that submerged one-third of the country, affected 33 million people, and caused economic losses worth US$30 billion [7].
Flooding is defined as a natural phenomenon where a portion of land becomes temporarily inundated by excessive surface water, either from river channels or as a result of heavy precipitation [3,8]. The occurrence and magnitude of floods depend on factors such as topography, land use, soil type, and meteorological conditions [2,9]. Rapid population growth and associated anthropogenic activities, such as land-use change and hydraulic engineering, are increasingly triggering more catastrophic flood impacts. Although the flooding events cannot be completely prevented, their destructive consequences can be minimised by assessing their risk and managing it accordingly [10]. Therefore, potential flood risk mapping and assessment is a critical first step upon which region-specific appropriate management and mitigation strategies can be based to reduce the damage, loss and human suffering caused by flood events [2,11].
Flood risk assessment generates a clear and informative map of flood-prone areas to assist public institutions and decision-makers in implementing mitigation strategies and prioritising resource allocation [2,9] in a sustainable way [12]. It is a multidimensional concept derived from the product of hazard and vulnerability [2,3,11]. Hazard refers to a physically threatening event and its probability of occurrence within certain areas [13,14]. In the present study, however, because event-based flood hazard is not modelled, the physical component is represented by flood susceptibility, defined as the propensity of an area to be affected by flooding based on local territorial conditions, indicating where flooding is likely rather than how often it may occur [15]. Vulnerability assesses the values that might be at risk, such as life, property, or the lack of resources to recover from the consequences of flooding [16,17]. However, the indices defining both flood hazard, susceptibility, and vulnerability vary across regions [9]. For instance, physical and social systems disturbed by the same external force in different regions may respond differently depending on varying coping capacities and sensitivities [18,19], making these interpretations directly relevant in the context of regional studies.
Countries of the Global South are particularly vulnerable to floods due to underdeveloped infrastructure, mitigation, and institutional capacity [8]. In such regions, the lack of monitoring systems, field data, and resources adds an additional dimension of complexity to understanding risk and vulnerability. In such cases, alternative approaches may be required to assess flood hazard. Although significant efforts have been made to evaluate flood susceptibility, vulnerability and associated risk worldwide [20], political sensitivity, limited access, and financial constraints add another layer of difficulty for assessing flood risk in vulnerable places like Afghanistan. This mountainous nation is not only prone to natural and climatic disasters [21,22,23], decades of conflict, instability and environmental degradation have made it highly susceptible to crisis. Afghanistan ranks fourth as the country most at risk [24] and seventh most vulnerable and least prepared for future climate change [25]. The last few decades alone have witnessed multiple flooding events causing catastrophic loss of life and damage to agricultural land, livestock, and infrastructure [21]. Landslides triggered by heavy rain in Badakhshan in the north of the country in 2014 killed 500 people and affected 27 provinces [26]. In August 2020, floods in Parwan near the capital of Kabul caused over 100 deaths and impacted more than 2000 households [27]. Despite these staggering figures, limited studies have been undertaken to assess flood susceptibility across Afghanistan beyond small-scale projects focusing on northern Kabul city [28], Kabul River basin [29] and Parwan province [30]. Although studies have improved the spatial identification of flood-prone areas, they generally do not integrate terrain-derived hydro-morphological parameters within a unified national framework [31]. Regular monitoring of a large, poorly resourced country such as Afghanistan is not only time-consuming but also logistically difficult, adding to its financial burden [32]. For data-scarce regions, remote sensing (RS) and spatial data analysis with Geographic Information Systems (GIS) have emerged as the most effective tools [33]. In highly vulnerable yet geopolitically unstable regions such as Afghanistan, secondary datasets provide the only practical basis for conducting a national-scale potential flood risk assessment incorporating both flood susceptibility and vulnerability. A range of satellite derivatives and GIS techniques, many of which are open-source, are now available to assess entire country profiles for flood susceptibility and vulnerability [19,34,35]. This includes the recent development of remotely sensed hydro-morphological characterisation over large spatial scales, which overcomes the requirement for long-term hydrological data for traditional hydrological models [36].
The objective of this study is to assess flood susceptibility and vulnerability across Afghanistan using an integrated RS-GIS framework, and to derive a potential flood-risk index by combining subbasin-scale flood susceptibility with provincial-scale social vulnerability. Specifically, we: (1) assess flood susceptibility and vulnerability indices using hydrometeorological, topographic, morphometric, land-cover, and socio-economic indicators; (2) identify and rank the key indicators using Principal Component Analysis (PCA); (3) assign relative weights and classify susceptibility, vulnerability, and risk levels using the Analytical Hierarchy Process (AHP); and (4) evaluate model performance using Receiver Operating Characteristic (ROC) analysis and the Area Under the Curve (AUC). This integrated approach identifies regions where physical susceptibility and social vulnerability coincide, providing a spatial basis for targeted mitigation, resource allocation, and disaster-risk planning.

2. Materials and Methods

2.1. Study Area

The study investigates the entire Afghanistan region, a country in Central Asia with an area of around 652,000 sq. km [29] (Figure 1a). It shares borders with Iran in the west, Pakistan in the east and south, China and Tajikistan in the northeast, Uzbekistan in the north and Turkmenistan in the northwest. Administratively, Afghanistan is divided into 34 provinces and 365 districts, which are broadly delineated according to river subbasins [37]. The country hosts 29 major rivers with a combined length of approx. 35,000 km, spanning five major river basins: the (1) Panj-Amu, (2) North, (3) Helmand, (4) Kabul and (5) Harirud Morghab [31,38]. The Hindu Kush mountain range extends from west to east [29], dividing the country into the central highlands with an elevation up to 8000 m asl, the low-lying deserts, the southwestern plateau and the northern plains with an average elevation of 150 m asl, respectively [29] (Figure 1a).
The strongly variable topography and associated climate influence the land use and land cover (LULC) of Afghanistan. Approximately 81% (534,504 sq. km) of the country is dominated by barren land and sand-covered surfaces, while only around 12% (approximately 69,914 km2) is arable or under cultivation [39] (Table S1 and Figure 1b). Urban or built-up areas comprise only a small fraction (0.47% or 26,421 sq. km). Water bodies and marshlands occupy 2.85% (15,815 sq. km), and forest or shrublands cover 2.78% (16,605 sq. km). Permanent snow cover is least extensive and constitutes 0.76% (4167 sq. km).
Afghanistan has a continental semi-arid to arid climate and incorporates desert, steppe and highland landscapes with temperature and precipitation patterns typical of these environments [38]. Temperatures are strongly continental, with hot summers and cold winters [22], with significant variation by altitude, i.e., mountainous areas often remain below zero year-round, while southern arid regions frequently exceed 35 °C [40]. Precipitation is dominated by winter storms originating as eastward-moving Mediterranean cyclonic systems, typically affecting the country between November and April and peaking from January to March [38]. During summer, monsoonal airflows associated with the Intertropical Convergence Zone (ITCZ) cross the Afghanistan–Pakistan border occasionally, bringing summer precipitation to the highest mountain peaks in the northeast. These highlands receive approximately 1000 mm/year of precipitation between November and April. By contrast, the lowland regions in the west and northern part of the country receive less than 150 mm/year [38].
Climate observations show a strong increase in mean annual temperature by 1.8 °C since the 1950s [41]. Projections suggest a likely increase of 1.4 °C by 2030 [38]. Precipitation patterns have altered across the country since the 1950s. In southwestern and northeastern Afghanistan, spring precipitation has decreased by 1.5–6 mm/year, whereas central, eastern, and southern Afghanistan have experienced slight increases in summer precipitation and in frequency of heavy (10 mm) and very heavy (20 mm) precipitation events [38]. This growing trend of extreme precipitation events is likely to exacerbate the chances of flash flooding, associated landslides and mudslides, as well as glacier lake outburst floods (GLOFs) [23]. Decades of conflict and unstable governance have weakened societal resilience and the capacity of public institutions to respond to natural disasters [42]. Together, these climatic and socio-political factors increase the vulnerability of Afghan communities to flood risks, with flood-related economic losses estimated at $400 million annually “https://www.undp.org/afghanistan/blog/afghanistan-brink-climate-catastrophe-we-must-act-now (accessed on 1 April 2026)”.

2.2. Datasets

2.2.1. Flood Susceptibility Indicator

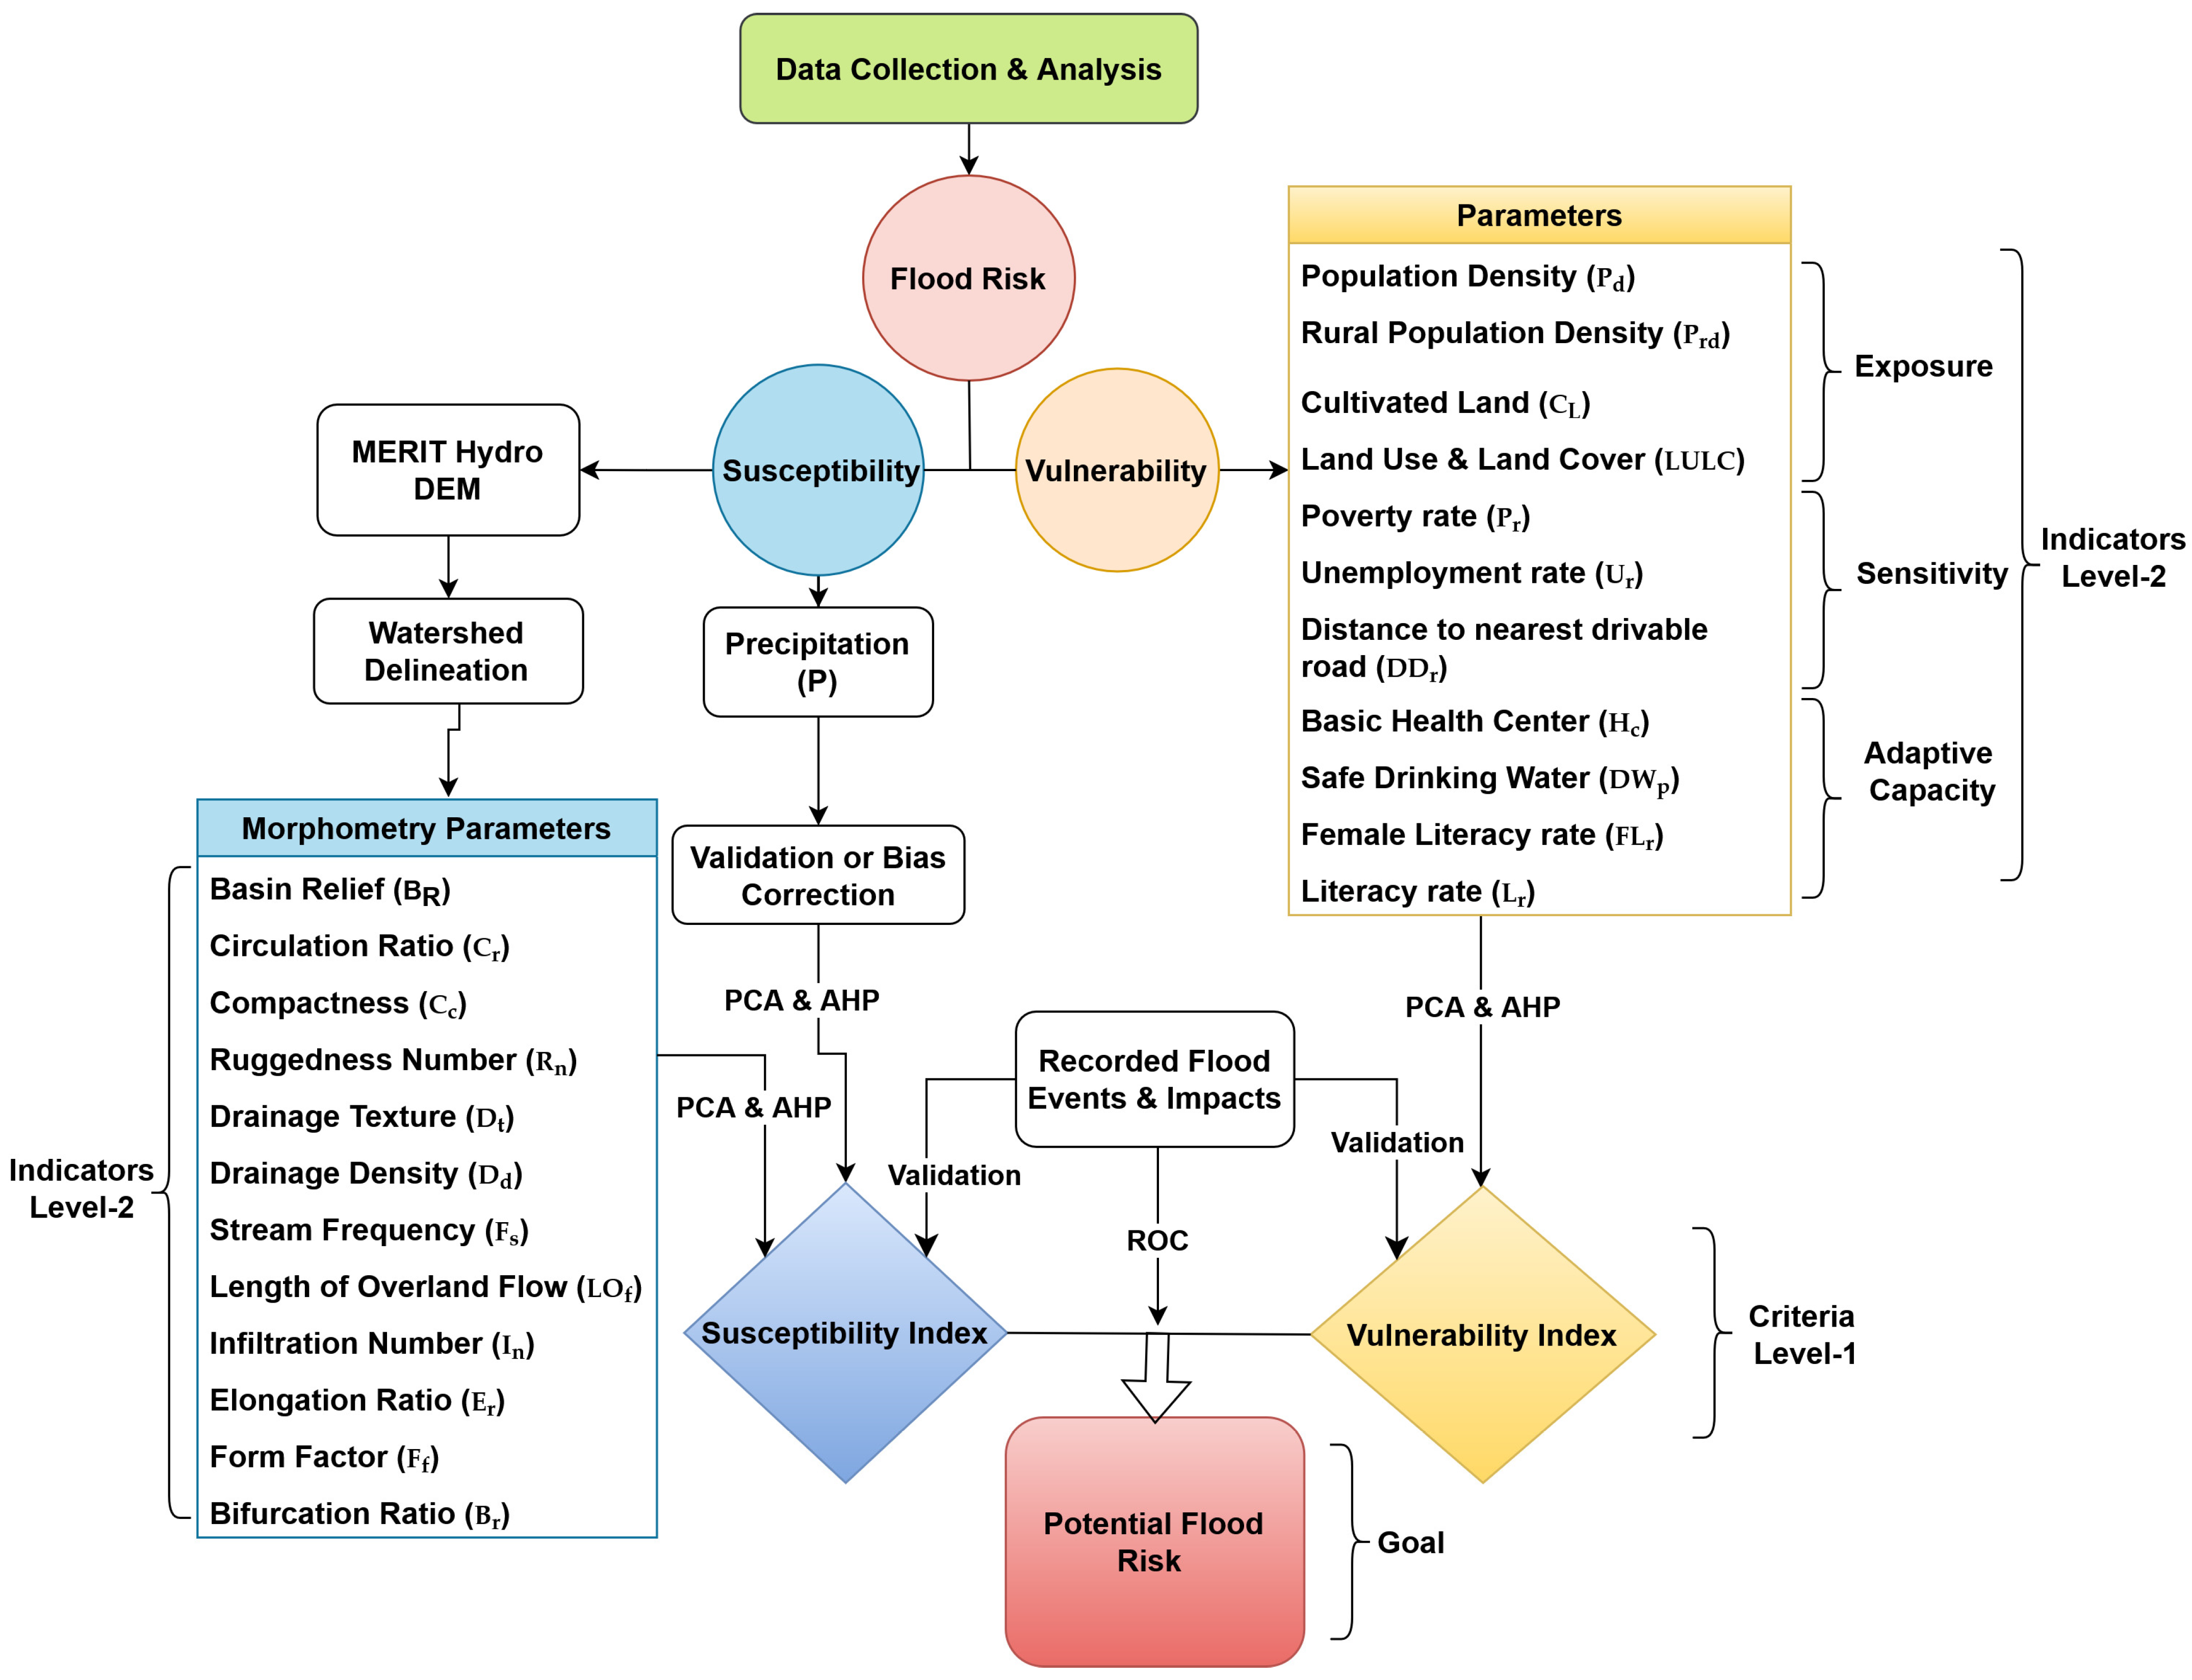
We used a freely available 90 m MERIT Hydro Digital Elevation Model (DEM) (http://hydro.iis.u-tokyo.ac.jp/~yamadai/MERIT_Hydro/ (accessed on 1 April 2026)) to delineate watersheds in ArcGIS 10.8 [35,43]. Given the highly variable size of individual catchments across the country, our delineation combined automated DEM-based methods with manual refinement to ensure that streamlines and drainage boundaries accurately matched observed hydrographic features. We used OpenStreetMap and HydroSHEDS datasets for visual verification and adjustment (Table 1). Full workflow details, including threshold selection, manual corrections, and validation steps, are provided in Supplementary Section S1.1. We identified 49 river basins across the country. For each basin, out of six primary parameters, we derived twelve Level-1 morphometric indicators using standard methods, namely: drainage density, basin relief, drainage texture, infiltration number, stream frequency, compactness, circulation ratio, elongation ratio, bifurcation number, overland flow length, ruggedness number, and form factor (see Supplementary Section S1 and formulae in Table 2). Each of these Level-1 indicators was further classified into sub-indicators (Level-2) as shown in Figure 2.
Precipitation data were obtained from the Global Precipitation Climatology Centre at the Deutscher Wetterdienst (GPCC, http://gpcc.dwd.de/ (accessed on 1 April 2026)) (Table 1), using mean monthly gridded data at 0.25° spatial resolution for 1990–2020. These data were validated and bias-corrected with observational data provided by the Ministry of Water and Energy of Afghanistan [49]. The precipitation data were then integrated with other indicators to assess the impact of potential flood susceptibility.

2.2.2. Vulnerability Indicators

We obtained data on socio-economic parameters from the Afghan National Statistical and Information Authority (NSIA; 2018 data as most recent available, http://www.nsia.gov.af), World Bank reports, and from the International Organization for Migration (IOM) (https://www.emro.who.int/child-adolescent-health/data-statistics/afghanistan.html (accessed on 1 April 2026)). We used these sources (Table 1) to derive the vulnerability indicators summarised in Figure 2. Due to the limited reliability of local data and a lack of consistent demographic and census information at district or smaller scales, all indicators were compiled and quantified at the provincial level. After careful consideration of the available and quantifiable parameters, we identified eleven Level-1 vulnerability indicators, including ten socio-economic indicators and one LULC indicator. This includes population density, rural population density, percentage of cultivated land, distance to nearest drivable road, female literacy rate, overall literacy rate, basic health centres, percentage of households with access to safe drinking water, poverty rate, unemployment rate, and land use/land cover. These indicators were further organised under the IPCC vulnerability framing of exposure, sensitivity, and adaptive capacity, as described in Figure 2 and Supplementary Table S2b.
We assessed LULC using the National Land Cover Monitoring System (NLCMS) for Afghanistan “https://rds.icimod.org/metadata/a2aa0488-b200-483f-8d4a-147f843cfa87 (accessed on 1 April 2026)” [50]. We reclassified the NLCMS classes into six major categories: (a) urban or built-up areas; (b) agricultural land; (c) water bodies and marshlands; (d) barren and sand-covered land; (e) forests and shrubland; and (f) snow-covered areas. These data were analysed to support the vulnerability index, with the category percentages for the Afghanistan region as presented in Table S1. Details of LULC map preparation and reclassification are provided in Supplementary Section S2.11.

2.3. Methods

Flood risk is defined here as the expected losses or harmful consequences arising from the interaction between physical flood-related processes and anthropogenic vulnerability factors [13,51]. Because the present analysis is based mainly on static morphometric indicators and long-term precipitation climatology, the susceptibility-related component is interpreted as flood susceptibility rather than an event-based flood hazard simulation. The potential Flood Risk Index (FRI) is therefore a composite relative index intended for national-scale prioritisation, not a deterministic prediction of inundation depth, duration, or probability.
Using available provincial-level socio-economic data, we carried out a regional flood risk assessment for the whole of Afghanistan. The analysis was based on the collection and processing of primary and secondary datasets (Table 1), including the MERIT Hydro DEM, precipitation data, and socio-economic indicators derived from census and land use/land cover (LULC) datasets. The assessment framework consists of two main components: flood susceptibility and vulnerability (Figure 2). Flood susceptibility represents the physical propensity for flooding, whereas vulnerability is structured according to the IPCC framework into exposure, sensitivity, and adaptive capacity. Exposure includes indicators such as population density, rural population density, and land use/land cover. Sensitivity includes socio-economic factors such as poverty rate, unemployment rate, and accessibility. Adaptive capacity reflects the ability to cope with and recover from flood impacts, represented by indicators such as literacy rate, access to basic health services, and access to safe drinking water (Table S2b).
For clarity, susceptibility and vulnerability were treated as Level-1 decision indicators, and their associated variables as Level-2 indicators. To harmonise the spatial framework of the assessment, the provincial-level vulnerability index was integrated with subbasin susceptibility values through spatial overlay analysis. All input layers were converted to the common spatial grid size before the final overlay and calculation of the FRI. Thus, although some thematic indicators originated from different administrative or hydrological units, the final analysis was performed within a uniform grid-based framework. The resulting FRI was then summarised at the provincial level for national-scale comparison, and each province was classified into four categories representing different levels of flood risk.

2.3.1. Statistical Data Analysis

To ensure a robust and unbiased flood potential risk assessment, we used a hybrid method that combines PCA and the AHP. AHP is a widely applied multi-criteria decision-making (MCDM) technique that structures complex problems into a hierarchy and then assigns relative importance to criteria through expert pairwise comparisons [52]. However, because it depends on expert opinion, AHP can be subjective and sometimes inconsistent [34]. To minimise this limitation, PCA was introduced as a complementary statistical tool. It reduces data dimensionality, identifies correlations among indicators, and highlights the most dominant indicators explaining variance within the dataset [53]. In our study, PCA was used as an exploratory tool to assess redundancy among indicators and guide their grouping, while AHP was applied to derive final weights through expert judgement and pairwise comparison. PCA loadings informed the relative importance of indicators, and AHP consistency ratios ensured methodological reliability. This ensured that expert judgments were informed and constrained by empirical data rather than applied independently.
Through this integration, we aim to (i) reduce redundancy among highly correlated indicators, (ii) minimise subjective bias in the AHP weighting process, and (iii) retain AHP’s ability to include local hydrological and socio-economic context that PCA alone cannot capture. This is especially useful in Afghanistan, where field data and expert access are limited. Similar hybrid approaches have proven effective in susceptibility and vulnerability studies [54,55].

2.3.2. Principal Component Analysis (PCA)

The PCA is a statistical technique that reduces the number of variables by transforming a large set of interrelated variables into a smaller set while preserving most of the original information [56,57]. In this study, we performed PCA using International Business Machines—Statistical Package for the Social Sciences (IBM SPSS Statistics Version 27, IBM Corp) software. Level-1 indicators were input to calculate each indicator’s loading on the principal components of flood susceptibility and vulnerability, grouping highly correlated variables. The number of principal components was determined based on eigenvalues greater than 1. To further improve the interpretability of the results, we applied Kaiser’s Varimax rotation [58]. Based on the identified linear associations, we ranked indicator loadings on the corresponding susceptibility and vulnerability indices (See Table S2a,b).

2.3.3. Analytical Hierarchy Process (AHP)

The AHP [52] provides a systematic approach for evaluating and integrating the impact of various indicators by defining the relative importance and weights. The process involves (a) selecting indicators, (b) constructing the hierarchy, (c) creating the pairwise comparison matrix, (d) assigning numerical values to compute weights, and (e) checking the consistency ratio.
The pairwise comparison matrix is the most crucial step in AHP, whereby each Level-1 and Level-2 criterion (Figure 2) is compared using the Saaty numbers ranging from 1 (equal importance) to 9 (extreme importance) (Table S3). In addition to evidence from the literature, the pairwise comparisons were informed by consultation with 9 specialists, including 5 local researchers and 4 international experts with experience in hydrology, geomorphology, water resources, flood-risk assessment, and Afghanistan or comparable dryland mountain environments. Final weights were accepted only when they were hydrologically interpretable, consistent with PCA results, and satisfied the AHP consistency ratio criterion. The values in the upper half of the matrix represent the decision maker’s subjectivity, experience, and knowledge [34,52,59], while the lower half contains the inverse values of the upper half [60].
After developing the pairwise matrix, we calculated Estimated Eigen Values (EEV) for each indicator and sub-indicators using Equation (1).
EEV = W 1 × W 2 × W 3 W N N
where
W1, W2, W3, WN represent the weights of the row elements in the matrix tables.
N denotes the number of row elements or compared indicators.
The prioritisation at Level-1 and Level-2 involves inputs from academic experts, stakeholders, local government representatives, and community members [11,51]. The resulting rankings were supported by PCA, which explained 85% and 73% of the total variance for the susceptibility and vulnerability indices (Table S2a,b).
The next step is to compute the Relative Importance Weights (RIW) of each criterion using Equation (2). As a rule, the sum of RIW in each matrix of indicators and sub-indicators must be equal to one.
RIW = W 1 × W 2 × W 3 W N N E E V 1 + E E V 2 + E E V 3 + + E E V N
where
EEV1, EEV2, EEV3, EEVN are the estimated eigenvalues of each element in an individual matrix.
The third step is to check consistency to avoid calculation errors and ensure a realistic matrix. This is obtained by determining the consistency ratio (CR).
CR = C I R I
where CI is the Consistency Index and RI is the Random Index, a value that depends on the number of criteria, as recommended by [60] (Table S4).
The Consistency Index (CI) is calculated using
CI = λ max n n 1
where
n is the number of indicators and,
λmax is the largest eigen value that is determined from normalisation matrix ( λ max ) by computing the sum of the products between each element of the RIW and column totals of the matrix as Equation (5).
λ max = E n
where [E] is the rational priority, defined as:
E = of   row   of   normalization   matrix R I W
A consistency ratio (CR) ≤ 0.10 is generally acceptable; if CR exceeds 0.10, the pairwise comparisons must be revised to improve consistency [52].
The consistency ratio for both the flood susceptibility index (FSI) and flood vulnerability index (FVI) parameters was calculated. Once completed, the final FSI and FVI maps were then generated using an arithmetic overlay of all criteria as expressed by Equations (7) and (8), respectively.
FSI = 0.2 × P + 0.14 × B R + 0.12 × C r + 0.11 × C c + 0.10 × R n + 0.09 × D t + 0.05 × D d + 0.05 × F s + 0.04 × LO f + 0.04 × I n + 0.03 × E r + 0.02 × F f + 0.02 × B r
FVI = 0.21 × P d + 0.18 × LULC + 0.15 × P rd + 0.13 × L r + 0.08 × H c + 0.07 × DW p + 0.06 × FL r + 0.04 × DD r + 0.04 × C L + 0.03 × P r + 0.02 × U r
Each parameter is assigned a normalised AHP weight reflecting its relative influence on susceptibility or vulnerability. The summation of all weighted parameters equals one (Σwi = 1), ensuring that each index is dimensionless and comparable across spatial units.
Finally, the FRI map was produced by multiplying the FSI and FVI maps as presented in Equation (9), which highlights areas where high susceptibility potential coincides with elevated vulnerability.
Potential   Flood   Risk   Index FRI = Flood   susceptibility   Index FSI × Flood   Vulnerability   Index FVI
These maps show a continuous value range, which was further classified into four major zones: Class-I (Very High), Class-II (High), Class-III (Moderate), and Class-IV (Low) using Jenks’ natural break method [61]. Jenks method optimises data grouping by minimising within-class variance and maximising between-class variance, improving the distinction between data clusters [61].

2.3.4. Comparison with Recorded Flood Inventory (2019–2024)

We compared the modelled flood susceptibility, vulnerability, and flood risk patterns with a province-level flood inventory comprising more than 600 recorded flood incidents and associated socio-economic impacts from 2019 to 2024, compiled from local authorities, news outlets, and United Nations datasets [26,27,62,63]. In May 2024, severe flash floods in the northern provinces of Baghlan, Takhar, and Badakhshan caused over 315 fatalities, destroyed more than 2000 houses, and heavily damaged cropland, bridges, and roads [62]. Additional late-May events in Ghor and Faryab caused ~70 deaths and extensive agricultural damage [63]. In the eastern provinces of Kunar and Nangarhar, heavy monsoon rains in June 2024 triggered localised flash floods that inundated several rural settlements, resulting in dozens of casualties and significant property losses, particularly along riverine floodplains [26]. We mapped the spatial frequency of these events across the study area to verify the susceptibility patterns and compared the observed damages and losses with the vulnerability index maps.
To further assess the predictive performance of the potential FRI, we applied ROC analysis. This method evaluates the ability of a model to discriminate between positive and negative cases across a range of thresholds by examining the trade-off between sensitivity (true positive rate) and specificity (1 minus false positive rate) [64]. Model performance was summarised using the Area Under the ROC Curve (AUC). An AUC ≈ 0.5 indicates no predictive ability beyond random classification, AUC ≈ 0.75 indicates good discrimination, and AUC ≈ 1.0 indicates perfect discrimination between flood-affected and unaffected provinces [65].
In this study, ROC/AUC analysis was performed by comparing normalised provincial FRI values with observed flood impacts derived from the recorded flood inventory. For each province, the number of recorded flood incidents and fatalities during 2019 to 2024 was compiled and combined to represent the observed flood impact. These provincial incident and casualty totals were then used to define binary flood-impact classes for ROC analysis, in which provinces exceeding a selected threshold were assigned a value of 1 and those below the threshold a value of 0.
We evaluated three flood-impact threshold scenarios based on the quartile distribution of provincial events: (i) a lower threshold (>9), representing moderately flood-affected provinces; (ii) a middle threshold (>14), representing frequently affected provinces; and (iii) an upper threshold (>22), representing observed flood impact. For each scenario, the optimal FRI threshold was identified using Youden’s J index. This index selects the point on the ROC curve that maximises the difference between sensitivity and false positive rate, providing the best discrimination between flood-affected and non-affected provinces [20,66]. This method allowed us to evaluate model accuracy, assess sensitivity to different flood-occurrence and impact thresholds, and test the reliability of the model in identifying flood-affected provinces. Overall, it provides a useful framework for potential flood risk assessment in data-scarce regions with comparable hydro-climatic and socio-economic conditions [20,66].

3. Results

3.1. Flood Susceptibility Index (FSI)

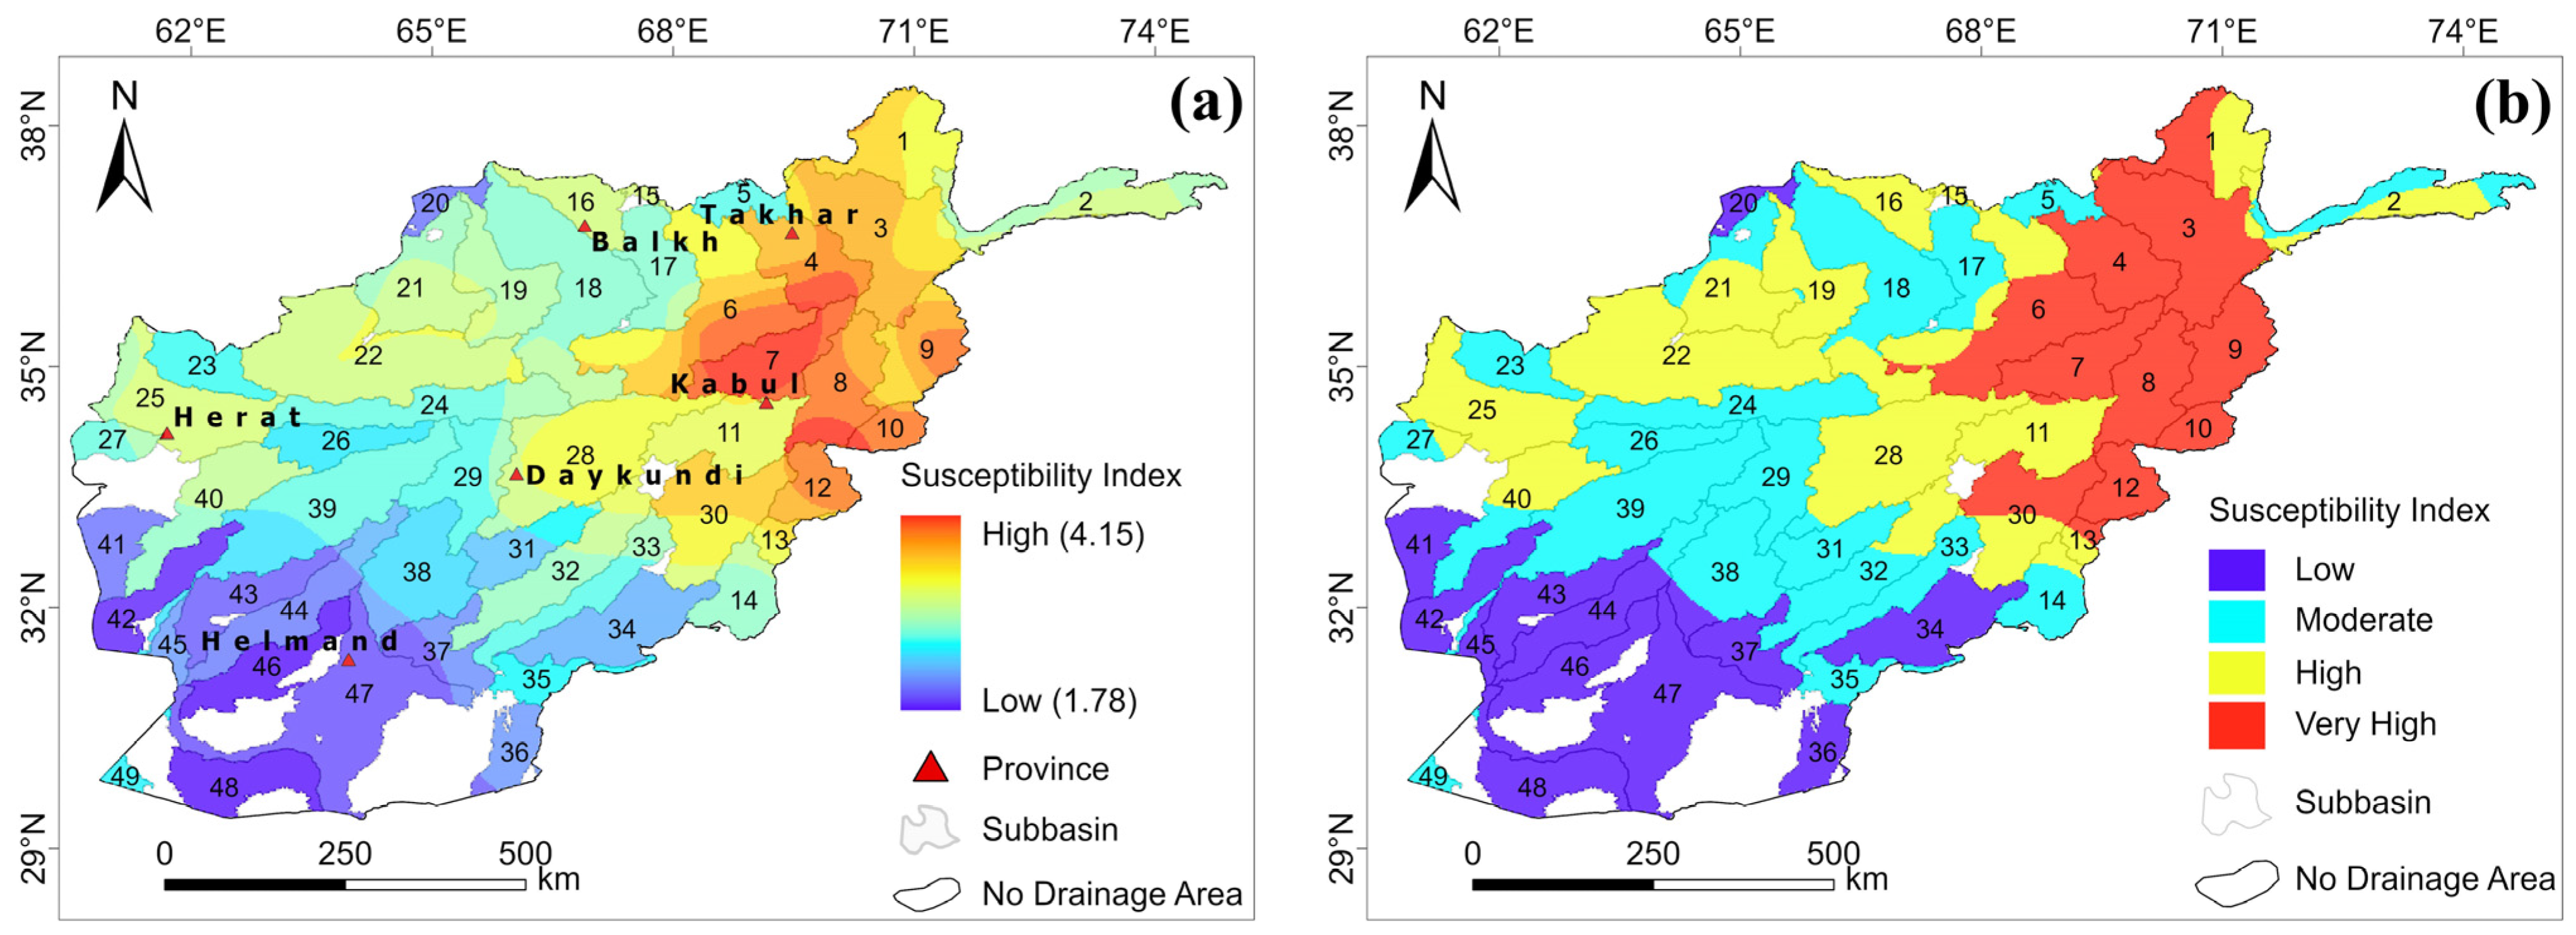
We generated a continuous FSI map using twelve Level-1 indicators and their respective Level-2 sub-indicators. FSI values range from 1.78 (low) to 4.15 (high), showing spatial variability (Figure 3a). Figure 3b presents the spatial variability of FSI classified into four major categories. The relative ranking and calculation of the Level-1 and Level-2 decision indicators, based on PCA and AHP, are presented in Table 3, Tables S5a,b(i–vi) and S6. The consistency ratio was found to be satisfactory (C.R ≤ 0.10, or ≤10%), as shown in Table 3. Further discussion on indicator selection is provided in Supplementary Section S1.
Approximately 20% (1.19 × 10⁶ sq.km) of the study area falls within the Very High FSI zone, while 29% (1.72 × 10⁶ sq.km) is classified as highly flood susceptible. In contrast, Low and Moderate FSI zones cover 20% (1.19 × 10⁶ sq.km) and 31% (1.84 × 10⁴ sq.km), respectively. These classes were further used to characterise the susceptibility of each subbasin to different FSI zones (Figure 3b). Some subbasins are affected by only one FSI class, while others overlap multiple FSI classes. For example, subbasin numbers 3, 4, 7, 8, 9, 10, and 12, which belong to the Panj–Amu and Kabul River basins, are classified as Very High FSI. The same basins, subbasins 1, 6, 13, and 30, exhibit both Very High and High FSI. Subbasins 15, 16, 19, 22, 25, and 28, which are part of the Harirud-Morghab and North River basins, are exposed to High FSI. Other subbasins, such as 14, 18, 21, 27, 32, and 40, span two flood susceptibility zones within their extent. The least susceptible area lies in the southwestern Helmand basin (including subbasin numbers 24, 26, 31, 35, 37, 38, 39, 41, 42, 43, 47), which is assessed as Moderate to Low FSI (Figure 3b).
To identify key controlling factors for each susceptibility zone, we further evaluated all morphometric and hydrological indicators using the PCA approach at the subbasin level (Table S2a), revealing the following characteristics:
Class I (Very High Susceptible zone) is influenced by high basin relief, short overland flow lengths, high infiltration number (low infiltration rate), and dense drainage networks (37% of the susceptibility loadings). High circulation ratio and low compactness ratio, indicating more circular basins, affect concentration time and amplify flood peaks, contributing 19% of the susceptibility loadings. In addition, basin shape factors, such as high form factor and elongation ratio, combined with high precipitation, contribute 18% of the susceptibility loadings, and area associated with rapid runoff and flash flood potential.
Class II (High Susceptible zone) is controlled by basin shape and compactness, with high circulation ratio, form factor, elongation ratio, and low compactness contributing 32% of the susceptibility loadings. Hydrological properties of the basin, such as high drainage density, infiltration number, low basin relief, and short overland flow length, contributes 31% of the susceptibility loadings and strongly influence High FSI. Precipitation and stream bifurcation contribute 14%, suggesting that flood susceptibility is closely linked to frequent stream branching and episodes of intense rainfall.
Class III (Moderate Susceptible zone) is dominated by basin shape and relief associated with 31% of the susceptibility loadings. High elongation ratio, form factor and significant vertical relief leading to rapid runoff. The drainage characteristics of the basins, such as high drainage density, shorter overland flow, higher infiltration number and rugged terrain, account for 28% of the loadings within moderate FSI. High precipitation and low compactness contribute an additional 16%, reinforcing the moderate flood susceptibility in this class.
Class IV (Low Susceptible zone) is influenced by drainage characteristics and overland flow, which together account for 39% of the susceptibility loadings. High drainage texture, stream frequency, drainage density, and infiltration number indicate dense drainage networks and reduced overland flow length indices, suggesting shorter flow paths with quick runoff. Basin shape metrics (elongation ratio and form factor) add a further 27%, accelerating runoff and flash flood potential. However, high compactness and low relief together account for 23% of the loadings and, combined with generally low precipitation, play a dominant role in limiting the overall flood susceptibility in this class.
To validate our flood susceptibility findings, we used documented flood incident reports from United Nations datasets (https://data.humdata.org/dataset (accessed on 1 April 2026)) covering 2019–2024. We created a classified flood incident map to visualise the spatial distribution of these events (Figure S4). Approximately 613 flood incidents recorded at the provincial level were mapped. Provinces with the highest incidents (39–70) are concentrated in northeastern and eastern Afghanistan, including Badakhshan, Takhar, Kunar, Nangarhar, Herat, Faryab and Baghlan, which are classified as Very High and high flood susceptibility zones on the map. Moderate flood susceptibility zones (12–23 incidents, orange) are distributed across central, northern, and western Afghanistan, including provinces such as Balkh, Ghor, Kabul and Paktika, while provinces in the southwest and central Afghanistan, such as Farah, Daykundi and Nimroz, experience fewer flood incidents (yellow), consistent with their low susceptibility classification.
Comparing the classified FSI map with the flood incident map, the eastern (Kabul River basin) and northeastern (Panj-Amu River basin) regions, which include subbasin numbers 1, 3, 4, 8, 9, and 10, show the highest flooding frequency. Similarly, subbasins 20, 21, 22, 23, 25, 27, and 40 in the northern (North River basin) and northwestern (Harirud-Morghab River basin) regions were identified as the second most flooded zones. Meanwhile, subbasins 28, 39, 41, 42, 43, and 44 in the central and southwestern (Helmand River basin) regions are rarely flooded zones.

3.2. Flood Vulnerability Index (FVI)

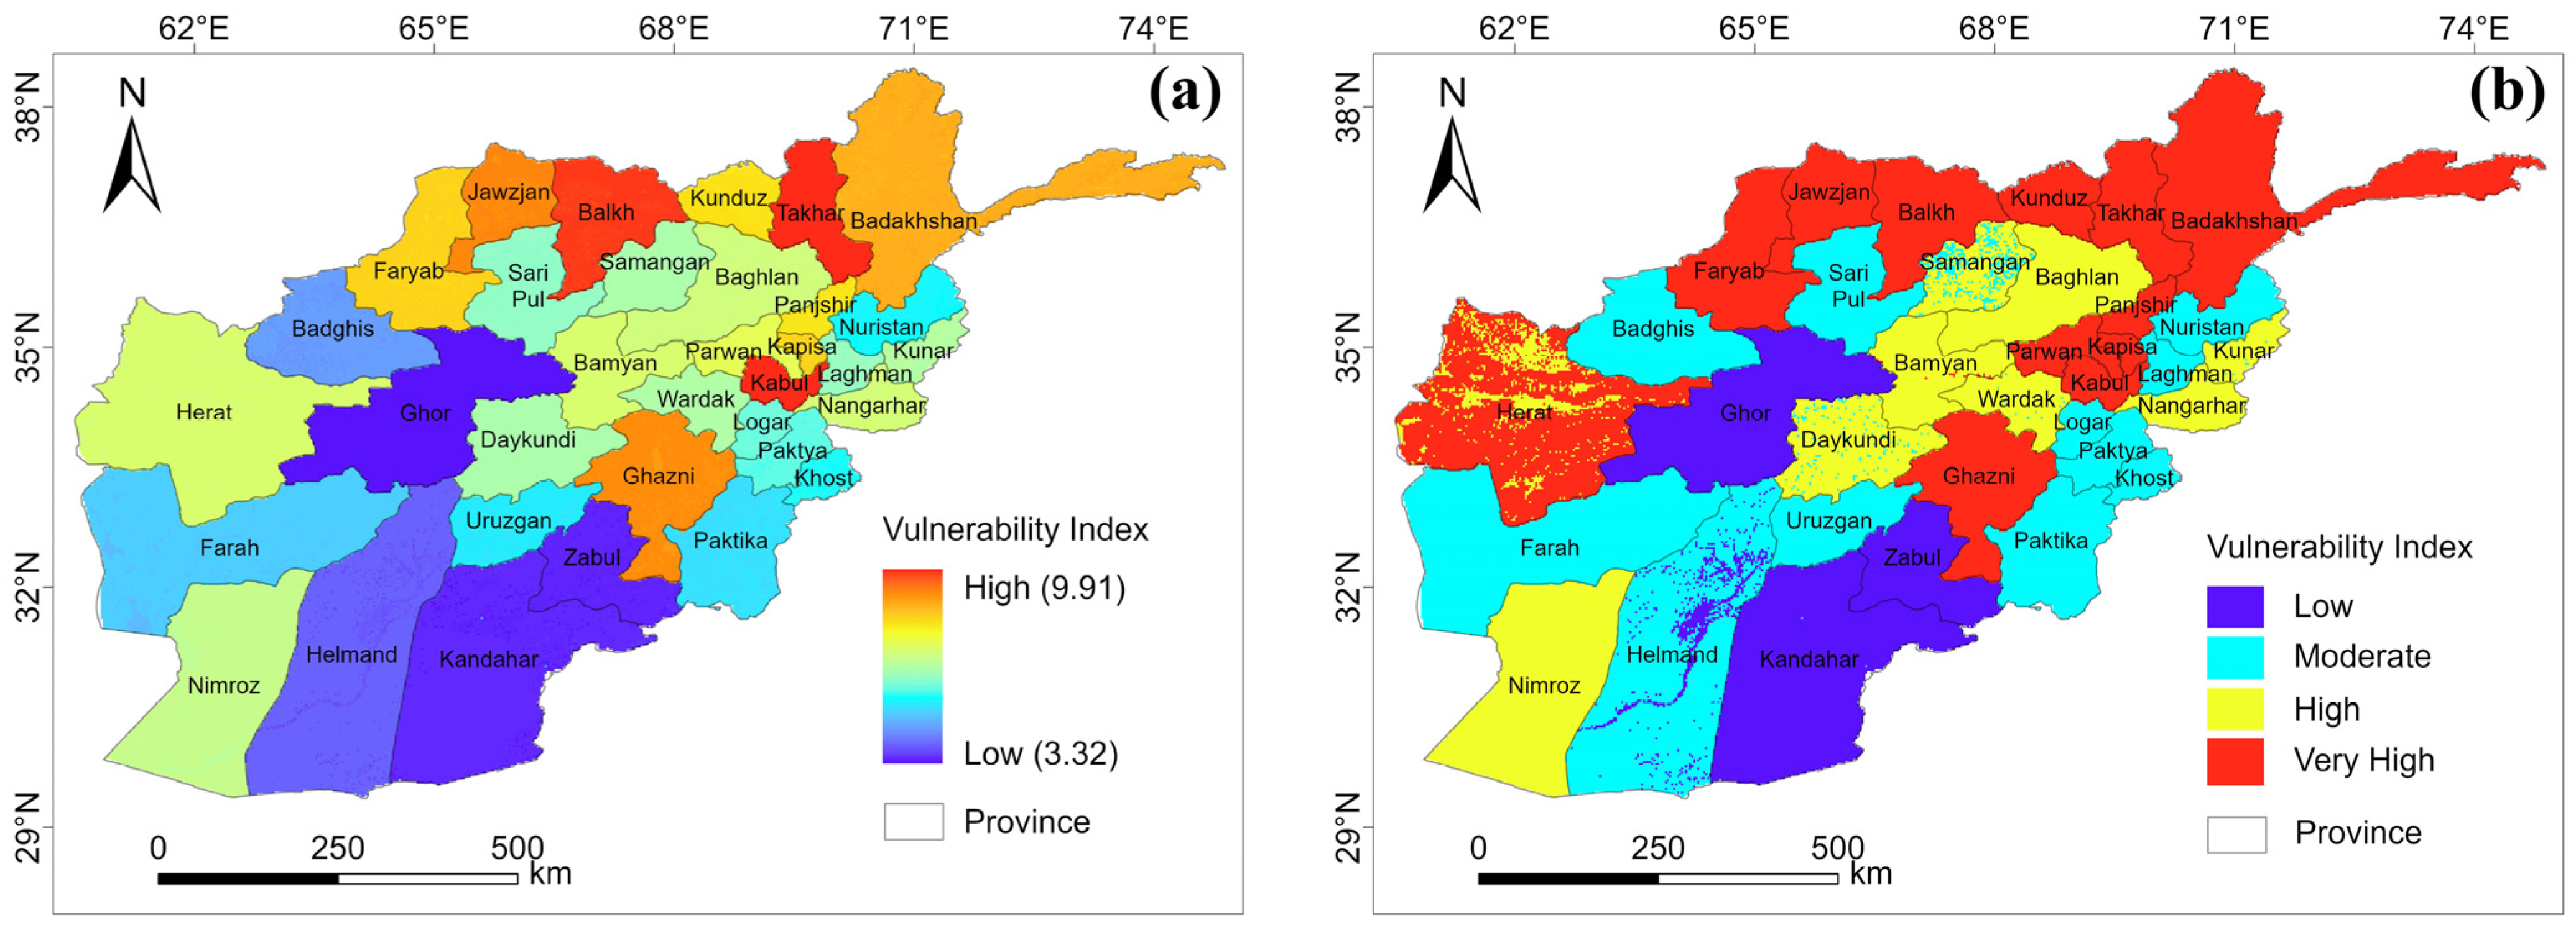
The continuous vulnerability scale of the FVI ranges from a low of 3.32 to a high of 9.91 (Figure 4a). The final FVI map (Figure 4b) was classified into four major zones using the same methodological approach as FSI at level-1 (see Table 4, Tables S7a,b(i–vi) and S8). Similar to the FSI map, RIWs were computed, and the CR was found to be satisfactory (i.e., C.R ≤ 0.10 or ≤10%) as shown in Table 4.
Based on province-level aggregation, approximately 31% (1.84 × 10⁶ sq.km) of the study area, located primarily in the northern and northwestern regions of Afghanistan, falls within the Very High FVI zone. The north-eastern and central regions are categorised as High FVI zones, covering 20% (1.19 × 10⁶ sq.km) of the study area. In contrast, the southern and western plain regions are classified into the Moderate and Low vulnerable zone covering 31% (1.84 × 10⁶ sq.km) and 17% (1.01 × 10⁶ sq.km), respectively.
To identify the major controlling factors for each vulnerability zone, all eleven indicators were analysed using the PCA approach at the province level (Figure S2b). The PCA results indicate:
Class I (Very High vulnerability zone) is characterised by high population density, high poverty rates, and poor road accessibility, which together contribute to 32% of the vulnerability loadings. Additionally, significant land use changes and extensive agricultural activity account for 24% of the Very High FVI zone, exacerbating vulnerability by amplifying runoff and reducing natural soil infiltration, thus intensifying flood risks.
Class II (High vulnerability zone) is primarily influenced by socio-economic factors and accessibility. High population densities, limited access to health centres, safe drinking water, lower female literacy rates, and greater distances from drivable roads cumulatively contribute 48% to vulnerability. Additionally, areas with lower literacy rates and extensive cultivated land, which impact community resilience, contribute an additional 22% to the vulnerability loadings.
Class III (Moderate vulnerability zone) is characterised by high population densities, both urban and rural, limited accessibility to safe drinking water, and greater distances from drivable roads. This zone’s vulnerability is heightened by limited evacuation routes and access to emergency services, accounting for 33% of the vulnerability loadings. Other influential factors include education, land use changes, and unemployment, which collectively add 26% of the loading impact in this class.
Class IV (Low vulnerability zone) is predominantly controlled by low population density and land cover dominated by bare and sandy areas, which together account for over 57% of the zone. In contrast, the unemployment indicator, inversely correlated with access to health centres, contributes 43%, balancing the vulnerability dynamics in these areas.
The spatial distribution of reported flood casualties (persons died or injured) shows clear regional patterns across Afghanistan. Provinces in the eastern, northeastern and parts of the western regions, including Ghor, Baghlan, Nuristan, Kunar, Nangarhar and Herat record the highest human impacts, with between 35 and 315 victims during the study period. These regions appear in dark orange to red, indicating frequent and severe flood-related fatalities and injuries. In contrast, provinces in the south and southwest, such as Nimroz, Helmand, Kandahar and Zabul, fall within the lowest impact classes (2–34 persons), displaying comparatively fewer casualties (Figure S7).
The FVI map (Figure 4b) shows a strong spatial correspondence with the casualty patterns (Figure S7). Provinces classified as Very High and High FVI (red and yellow), including Baghlan, Faryab, Ghor, Nuristan, Kunar, Nangarhar and Herat, closely align with the provinces that experienced the highest casualties in the incident dataset. Regions mapped as Moderate or Low FVI in the southern and southwestern provinces (e.g., Nimroz, Helmand, Kandahar, Uruzgan and Zabul) generally match areas with lower casualty counts, supporting the consistency of the vulnerability assessment. Minor discrepancies, such as Kandahar and Helmand, which show some casualties despite being classified as low to moderate FVI, may reflect local exposure patterns, event clustering or limitations in socio-economic indicators.

3.3. Potential Flood Risk Index (FRI)

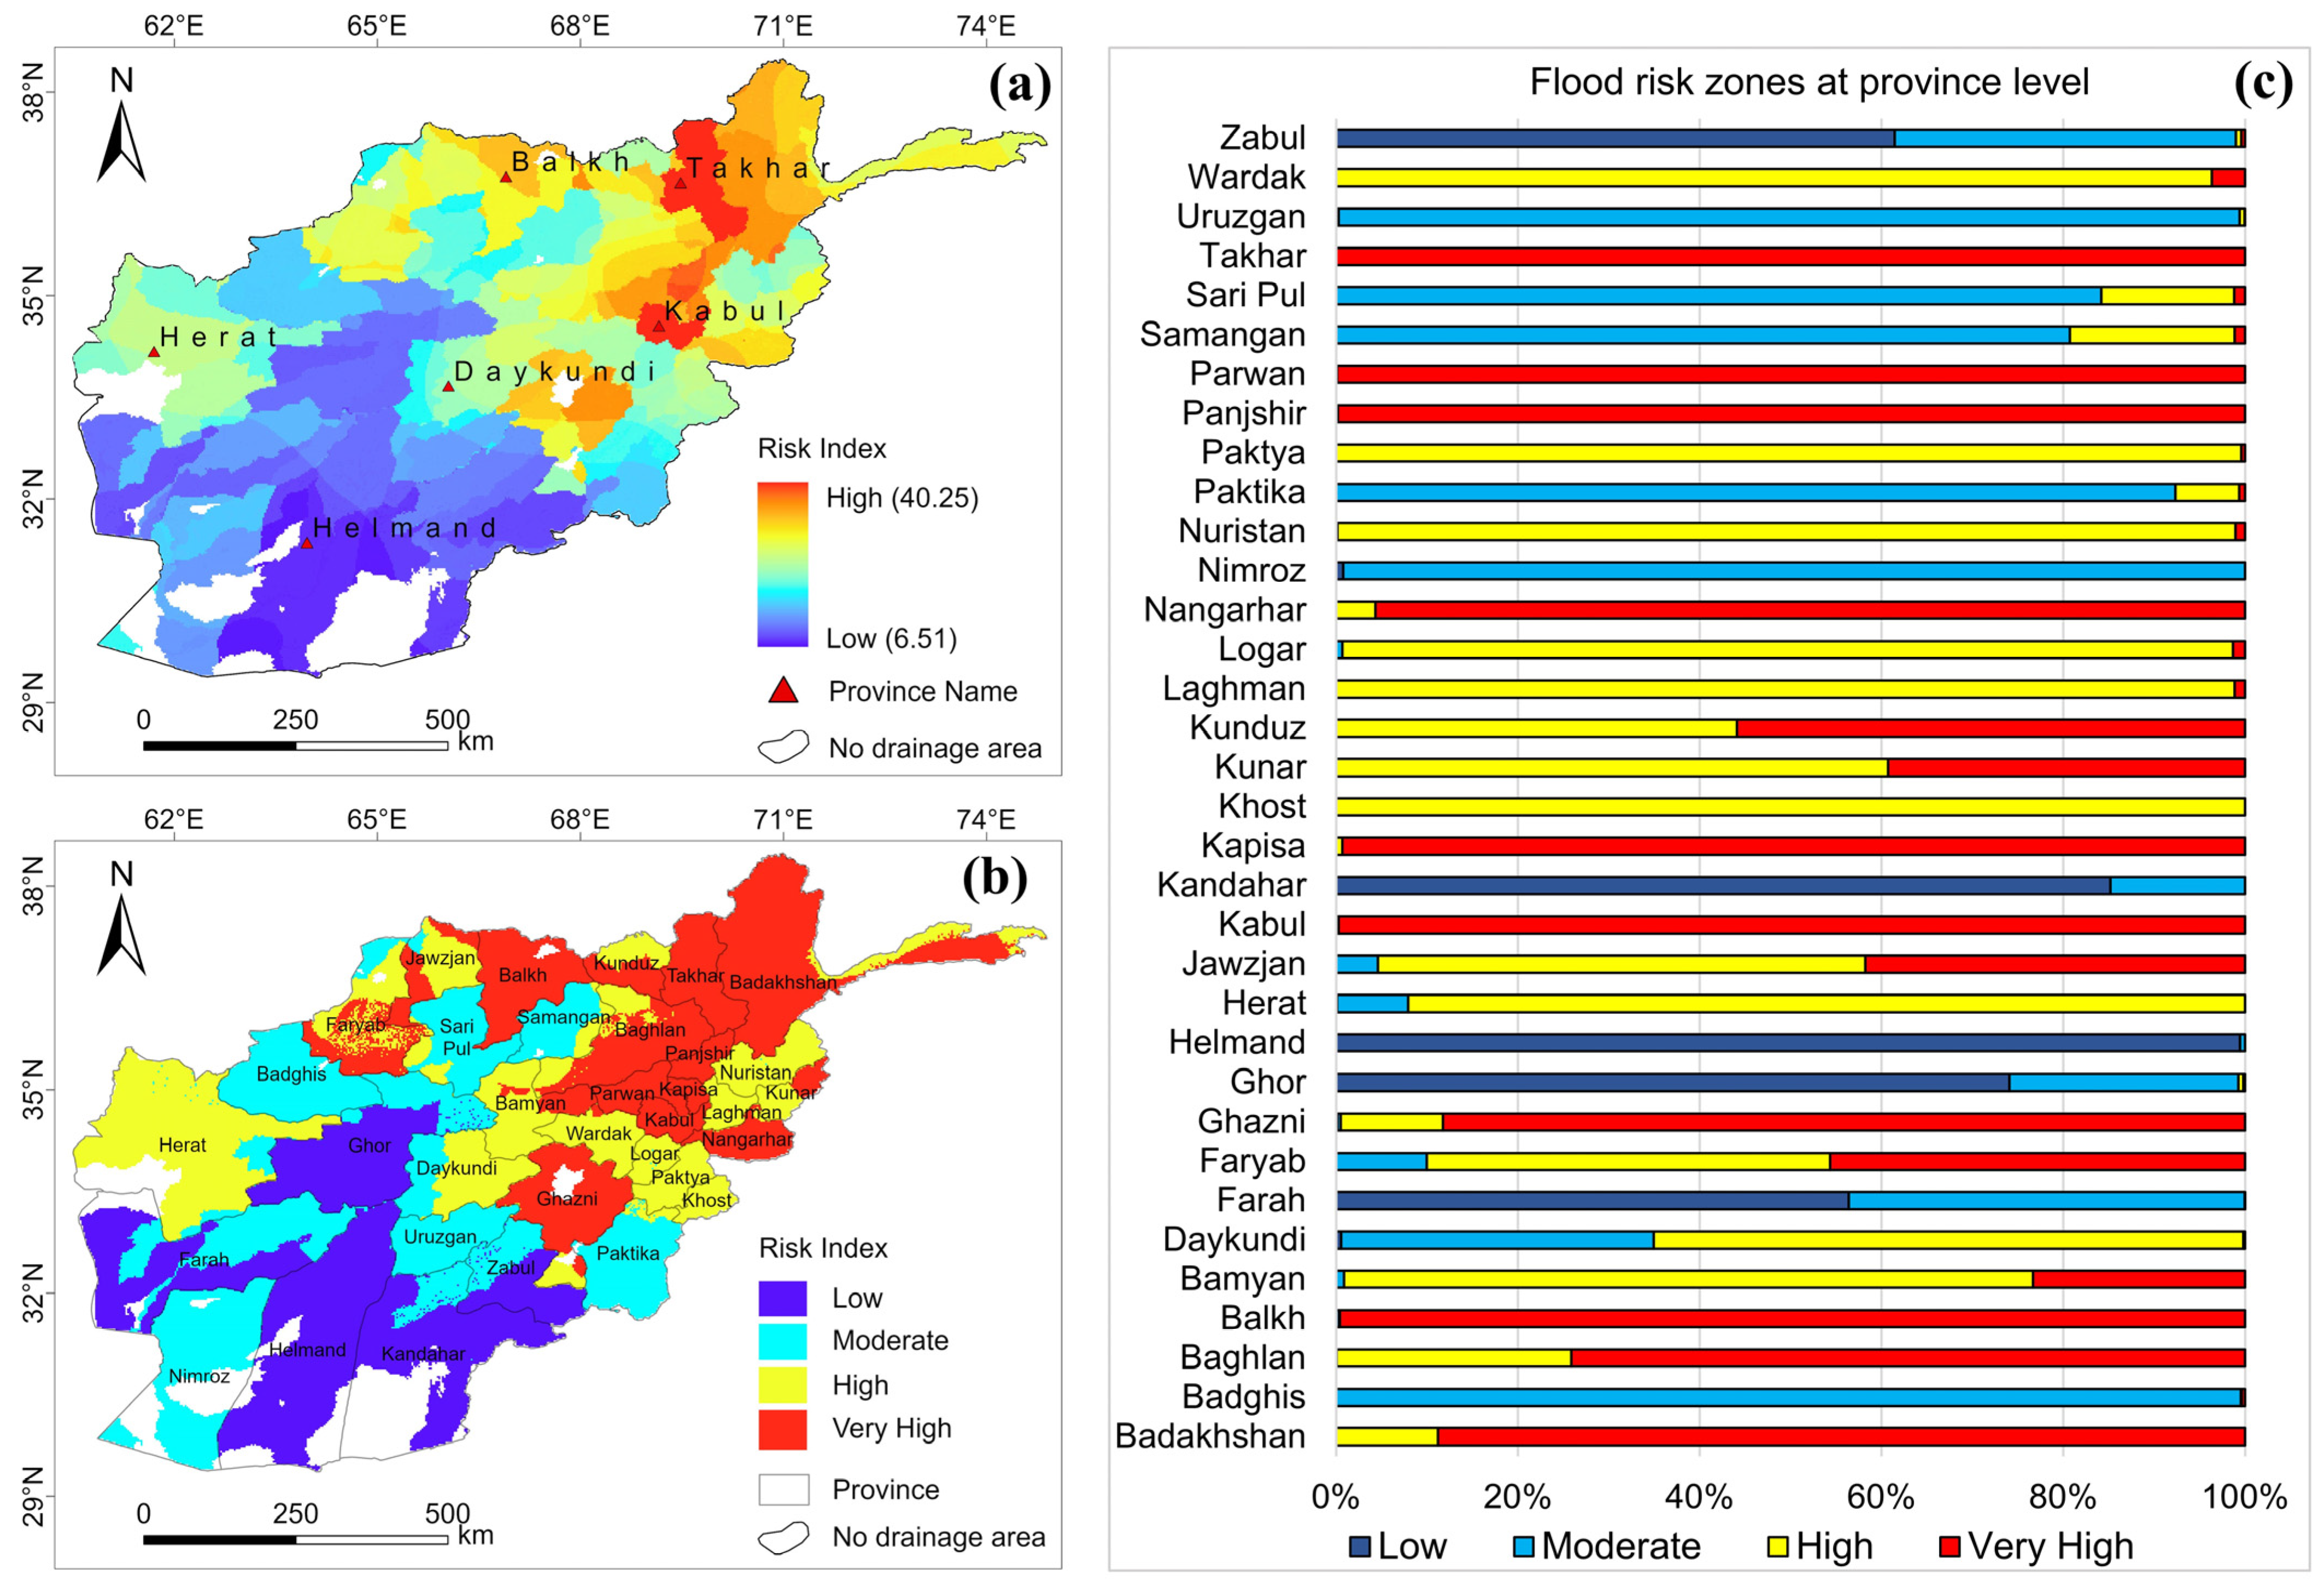
The FRI map (Figure 5a) illustrates the combined influence of flood susceptibility and flood vulnerability across Afghanistan, subsequently classified into Low, Moderate, High and Very High flood risk zones (Figure 5b). The classified FRI map shows that 24% (1.42 × 10⁶ sq. km) of the study area falls within the Very High FRI zone, which is concentrated in the northern and eastern provinces, including Balkh, Takhar, Panjshir, Parwan, Kapisa, Kabul and Nangarhar. The High FRI zone covers 22% (1.31 × 10⁶ sq. km) of the study area and appears prominently in parts of the central and eastern provinces, such as Bamyan, Wardak, Logar, Paktya and Khost and the western Herat province. In contrast, the Moderate and Low FRI zones account for 26% (1.54 × 10⁶ sq. km) and 28% (1.66 × 10⁶ sq. km), respectively. Moderate FRI (cyan) dominates much of the western and central southern provinces, including Badghis and Uruzgan, while Low FRI (dark blue) is largely confined to the central and southern provinces, notably Ghor, Helmand and Kandahar, where overall flood risk is minimal.
However, several provinces also exhibit transitions between multiple risk zones (Figure 5c). Provinces such as Badakhshan, Kunduz, Baghlan, Ghazni, Nangarhar, Kapisa, Kunar and Laghman show a mix of Very High and High FRI classes. In contrast, Faryab and Jawzjan contain substantial areas of Very High, High and Moderate FRI, while Farah, Sari Pul, Zabul and Paktika span from Low to High FRI zones. These patterns indicate substantial internal variability in flood risk within these provinces (Figure 5c), highlighting the importance of sub-provincial, spatially targeted flood management measures.
To identify key controlling factors of flood risk, we performed PCA on all thirteen susceptibility and eleven vulnerability indicators at the province levels (Table S9), and it shows that:
Class I (Very High Flood Risk zone) indicates the subbasins with high stream frequency, circular basins, higher precipitation, low compactness and higher infiltration number dominate the susceptibility component due to rapid runoff and water accumulation. In terms of socio-economic factors, provinces with high population density, significant land use changes, better access to safe drinking water, and high poverty rates play a significant role in determining Very High FRI zones (Table S9).
Class II (High Flood Risk zone) is dominated by subbasins with longer overland flow paths, considerable basin relief, lower drainage density, and lower infiltration numbers. Socio-economic contributors include high total and rural population densities, limited access to safe drinking water, and lower female and general literacy rates. This suggests that provinces with higher population densities and limited access to drinking water are more vulnerable, while low literacy rates exacerbate this vulnerability, highlighting the need for educational improvements to reduce flood risk (Table S9).
Class III (Moderate Flood Risk zone) is characterised by high drainage density, short overland flow length, and high infiltration numbers, indicating low water absorption capacity in these zones. Most of the area is barren in these provinces, with low to moderate rural and overall population densities. Limited availability of basic health centres further contributes to the classification of these provinces as Moderate FRI zones (Table S9).
Class IV (Low Flood Risk zone) is characterised by low drainage density and basin relief, along with extensive barren land, which contributes to a low infiltration number, potentially reducing surface runoff. Socio-economic factors such as low urban and rural population densities, better access to safe drinking water, and closer proximity to accessible roads for these small populations further contribute to the reduced flood risk in the region (Table S9).

3.4. Sensitivity Analysis of the Flood Risk Model

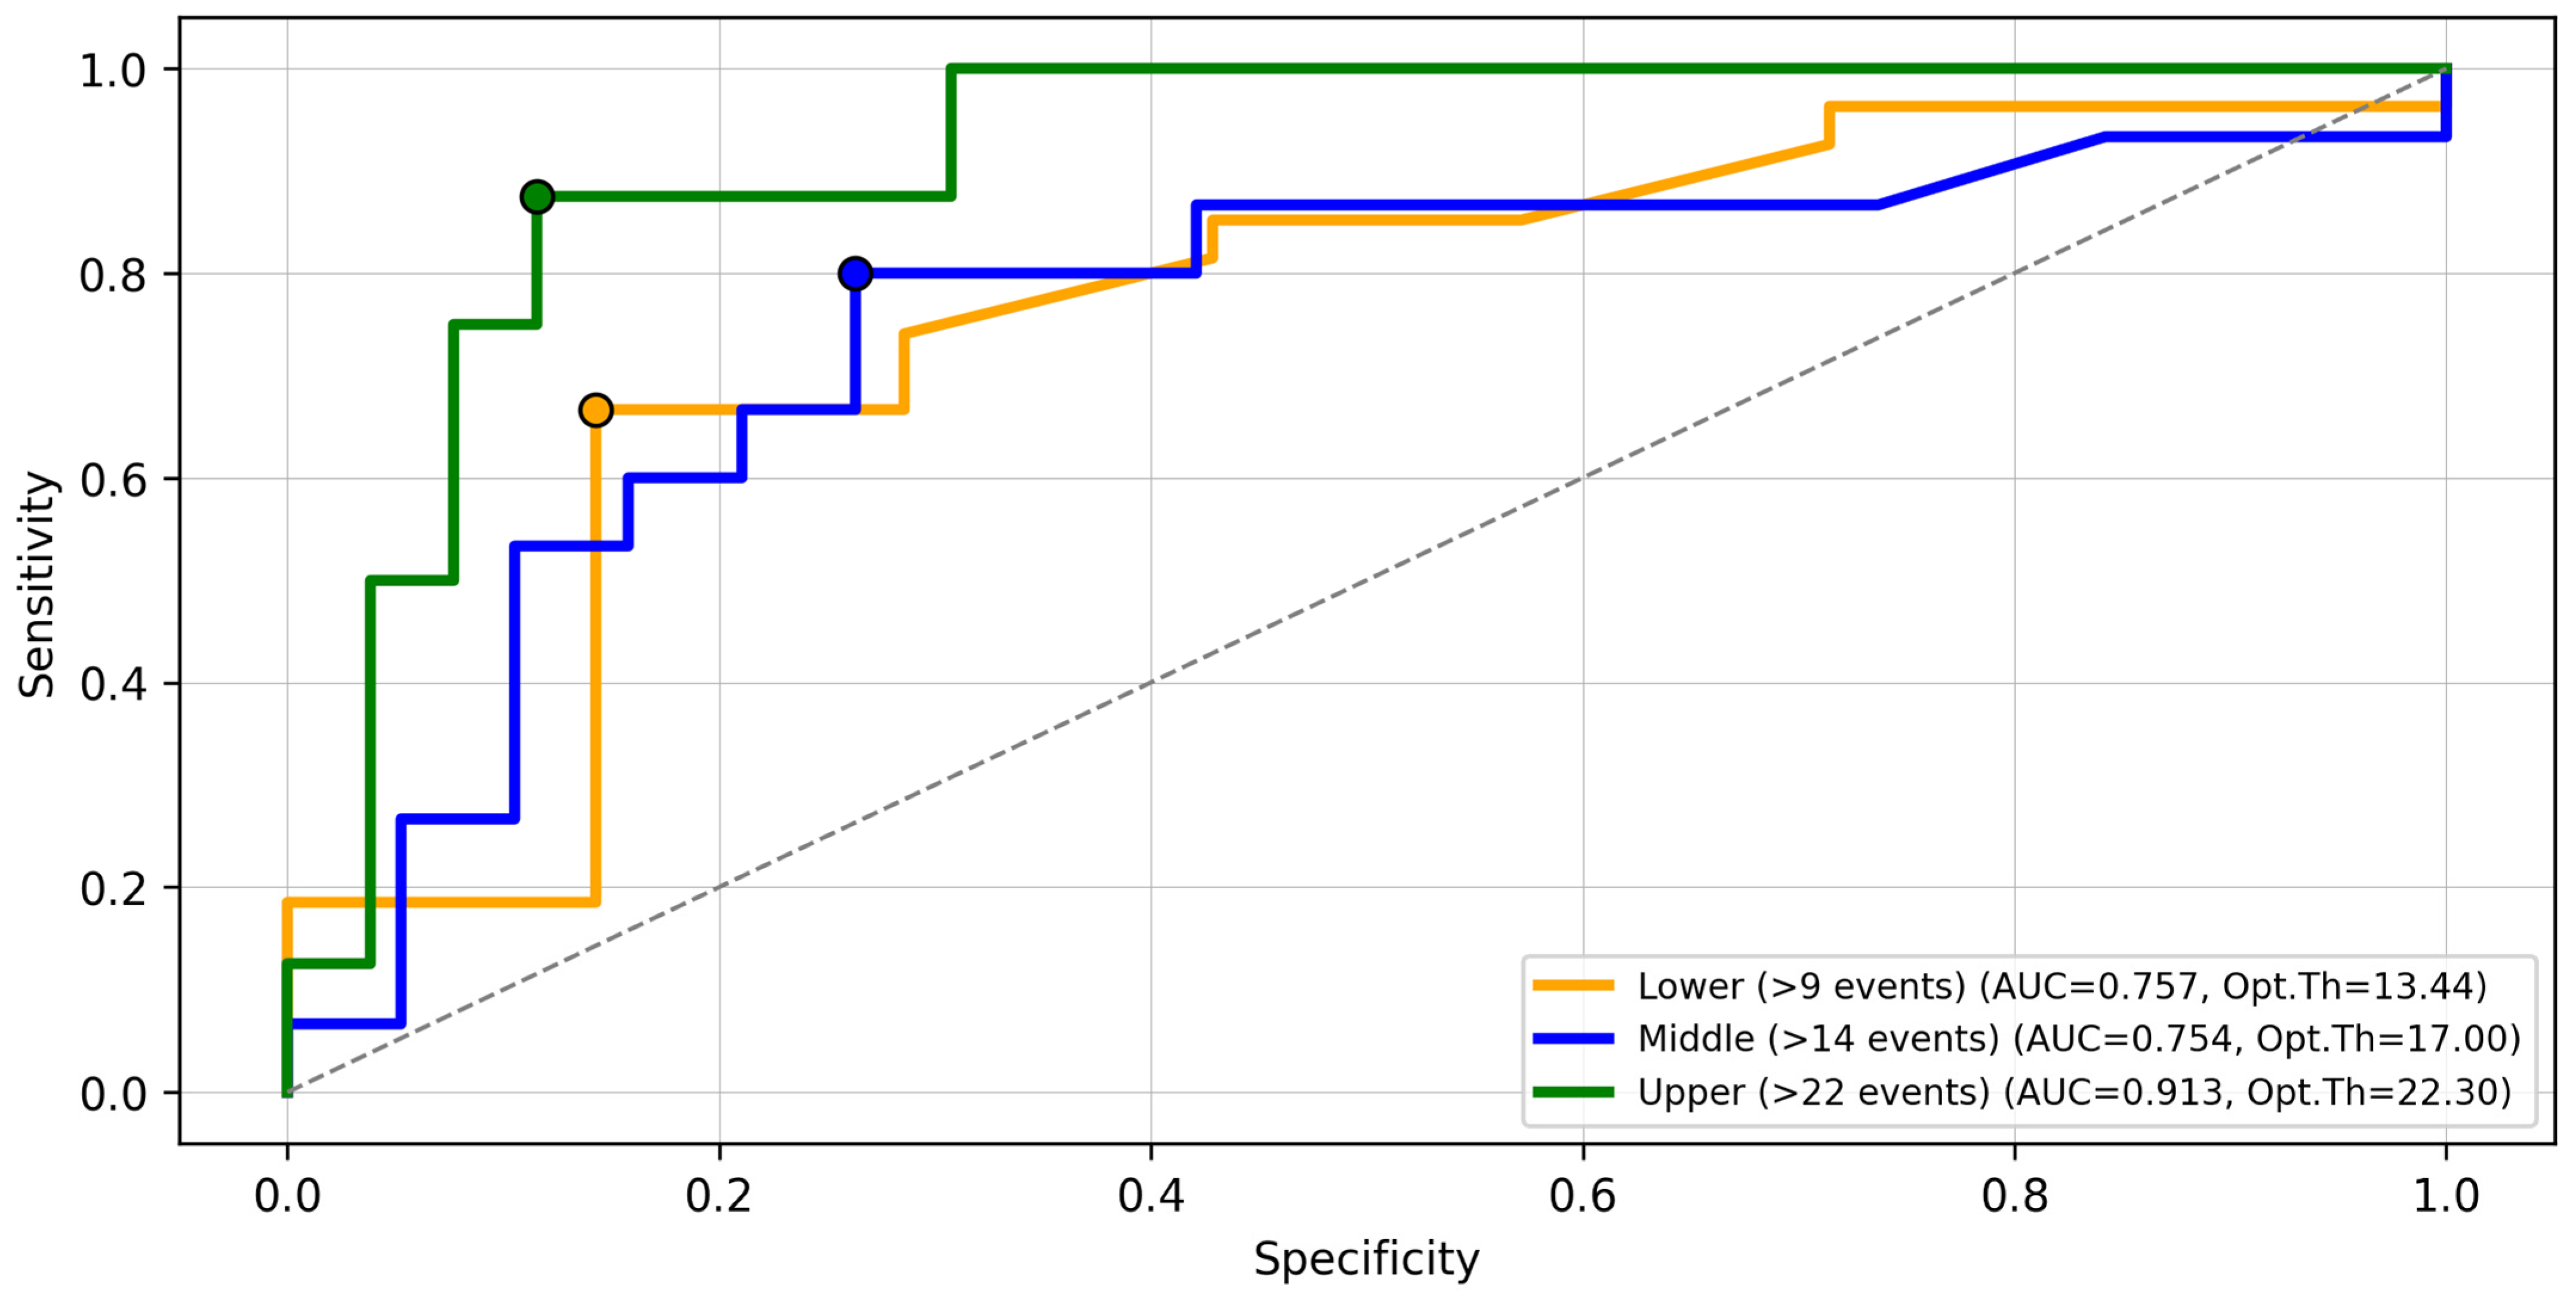
Three flood-impact thresholds (Figure 6) were tested to examine the model’s sensitivity to varying definitions of observed flood impact, derived from the quartile distribution of combined provincial flood incident and casualty counts. The lower threshold (>9) represents low to moderately flood-affected provinces and yielded an AUC of 0.757, with an optimal FRI threshold of 13.44. The middle threshold (>14) represents frequently affected provinces and yielded an AUC of 0.754, with an optimal FRI threshold of 17.0. The upper threshold (>22) captures the most severely affected provinces and yielded the highest AUC of 0.913, with an optimal FRI threshold of 22.3 (Figure 5a).
The ROC analysis for the three-threshold scenario (Figure 6) showed that model performance improved when validation focused on the most severely affected provinces. The upper threshold scenario achieved the highest AUC (0.913), indicating strong discriminatory power between flood-affected and less-affected provinces. Most provinces classified within the Very High and High FRI zones, including Baghlan, Badakhshan, Kunar, Nangarhar, Khost, Takhar, Balkh, Faryab, and Herat, also correspond to provinces with high recorded flood impacts. A few provinces classified as high risk showed weaker agreement with the observed flood inventory, which may reflect underreporting or limited event documentation.

4. Discussion

4.1. Factors Affecting Flood Risk Assessment

Assessments of flood risk in the Global South have long been challenged by limitations in the availability of data and on-ground monitoring. The recent availability of remotely sensed data offers potential for flood risk assessment in the Global South, as evidenced by the growing body of studies from countries neighbouring Afghanistan, in South and Central Asia, which are similar with respect to climate, topography and socio-economic situations. These studies provide us with the opportunity to compare our results across the region. Flood risk in South Asia, India and Pakistan is often driven by intense monsoon rainfall in steep river valleys and low-lying plains; flood risk in these areas has been mapped using a combination of hydrological data and socio-economic datasets [57], similar to our approach in this study. Flooding in mountainous Iran (Central/Western Asia), by contrast, is frequently associated with snow melt and mountainous runoff; comprehensive risk evaluation in these regions has relied on an integration of remote sensing and continuous monitoring systems [67,68]. Afghanistan is dominated by similar, complex flood-prone topographies, hydrology, and climate, but the combination of sparse observational data, complex terrain, and socio-political instability all limit detailed hazard modelling and field validation [67]. We must therefore rely on the integration of remote sensing, morphometric and socio-economic vulnerability analysis in order to investigate the risks and vulnerability linking the broader region [67,68].
The present study highlights the complex interplay between geomorphological, hydrological, and socio-economic factors which determine flood risk across Afghanistan. By integrating FSI and FVI, we produced a comprehensive FRI map capturing spatial variability at the provincial level. Approximately 20% of the study area falls within a “Very High” FSI zone, including subbasins 3, 4, 6, 7, 8, 9 and 10, which are primarily concentrated in the northeastern and eastern regions within the Panj-Amu and Kabul River basins. These areas feature high basin relief, dense drainage networks, and short overland flow lengths, contributing to rapid runoff during heavy rainfall. This context bears the closest similarity to the monsoon-driven floods in steep valley catchments observed in India and Pakistan [51]. By contrast, subbasins, namely 31, 32, 33, 38, 43, 44, 46 and 47, in the southwestern Helmand basin, characterised by flatter terrain, lower precipitation, and higher infiltration rates, exhibit predominantly “Moderate” to “Low” FSI. These spatial patterns are comparable with findings in other semi-arid regions where topography and precipitation strongly control flood risk patterns [69]. The study also highlights the influence of morphometric characteristics on flash flood intensity and watershed response during heavy rainfall events [18,70]. The strong agreement between our FSI results and observed flood incidents supports the reliability of morphometric and satellite-derived indicators in data-scarce environments [23,28].
The FVI results further indicate that socio-economic factors play a critical role in shaping regional flood vulnerability. Provinces with high population density, low literacy rates, poor road accessibility, and high poverty levels are more vulnerable. The northeastern provinces of Baghlan, Takhar, and Badakhshan, fit this category, since they are classified as “Very High” FVI. This assessment is consistent with findings from previous studies [71,72], and with the global flood risk literature, highlighting that socio-economic disparities and limited adaptive capacity exacerbate disaster impacts [17]. We also find that changes in land use and land cover, in particular agricultural expansion and urbanisation, alter runoff processes while also increasing the exposure and sensitivity of people and assets, thereby elevating overall flood risk. Similar trends have been reported in other regions undergoing rapid land-use transformation, where an increase in impervious surfaces has been observed to increase flood risk [73].
Our FRI map identifies that 24% of Afghanistan is classified as a “Very High” FRI zone, particularly the northern and eastern provinces, including Balkh, Takhar, Panjshir, Parwan, Kapisa, Kabul, Kunar and Nangarhar. The elevated risk in these areas is driven by a combination of geomorphological and socio-economic factors, including high population density and poor infrastructure capacity [9,51]. By contrast, the flatter, less populated provinces of the south and southwest regions, Helmand, Nimroz, and Farah, experience a lower flood risk. These areas also have better accessibility to essential services. These findings reinforce the importance of socio-economic resilience for mitigating flood impacts, particularly improvements in infrastructure, education, and livelihood diversification [74].

4.2. Limitations and Future Directions

This study provides a practical baseline for flood susceptibility and relative flood-risk assessment in data-scarce regions by integrating morphometric, precipitation, land-cover, and socio-economic indicators where long-term hydrological observations are limited or absent [11,36]. However, several challenges remain due to the inconsistent scientific literature and limited, low-quality observational data, which complicate validation and cross-regional comparison [74]. A key limitation lies in the scarcity of field measurements in arid and semi-arid regions of developing countries, where catchments are often poorly gauged and hydro-meteorological data are insufficient [69,75]. Additionally, there are gaps in census data at finer administrative scales, along with challenges in integrating multiple datasets that differ in format, quality, and spatial resolution. It further complicates the development of comprehensive and reliable flood risk models [76]. The limited availability of reliable hydrological observations also restricts comparison among alternative satellite-derived datasets and complicates verification of secondary inputs, including precipitation, that influence the susceptibility component [31,76]. Despite these limitations, secondary datasets remain the only feasible basis for a national-scale assessment in a geopolitically unstable and hazard-prone country such as Afghanistan.
The spatial resolution of the DEM is another important limitation. In this study, we used the MERIT Hydro DEM (3 arc-seconds, ~90 m), which provides hydrologically corrected elevations and river network information suitable for national-scale watershed delineation and morphometric analysis [77]. Although MERIT Hydro represents a considerable improvement over conventional DEMs, it may not fully capture micro-topographic controls on runoff and flood-prone terrain, particularly in mountainous regions. Afghanistan’s highly variable terrain, ranging from near sea level to several thousand metres, requires high-quality data processing and robust analytical methods to delineate morphometric parameters accurately [69,78]. Although finer-resolution open DEMs are available and could improve local-scale topographic representation, their application across a large and topographically diverse country is computationally demanding and may also generate spurious drainage features in low-relief areas if not carefully conditioned. Such datasets are not consistently available or validated across the entire country. Under these constraints, MERIT Hydro provides a practical balance among spatial detail, hydrological consistency, and computational feasibility for national-scale watershed delineation, although finer-resolution local studies would still be needed to better capture subbasin variability [77].
The validation data also requires cautious interpretation. The flood inventory used in this study was compiled from local reports, news sources, and United Nations disaster databases, which are among the few systematically available sources for Afghanistan. However, these records may vary in completeness, spatial precision, and temporal consistency, particularly in remote or conflict-affected regions. Therefore, the validation results should be interpreted as indicative rather than absolute measures of predictive accuracy. In this context, the ROC/AUC analysis provides a useful empirical benchmark for assessing whether provinces classified as relatively high risk broadly correspond to areas that experienced greater reported flood impacts [79]. The favourable AUC values, therefore, support the national-scale applicability of the framework, but they should not be interpreted as definitive evidence of local predictive performance [31,35,79].
Weighting uncertainty is another important consideration in PCA-AHP-based assessments. To address this, we performed a formal sensitivity analysis for selected FSI and FVI indicators (Table S10). The results showed that the framework remained generally stable under moderate perturbations of the selected weights. In particular, the FSI remained highly consistent across scenarios, and although the FVI showed some redistribution among adjacent classes, the overall spatial pattern and concentration of higher-vulnerability areas were preserved. This supports the robustness of the framework for national-scale flood-risk prioritisation [80,81,82].
Additional uncertainty arises from a temporal mismatch among the datasets. The susceptibility component is based on static morphometric indicators and long-term precipitation data from 1990 to 2020. It therefore represents historical baseline conditions rather than future flood behaviour under non-stationary climate conditions. Under climate change, precipitation regimes may shift, which could alter the spatial pattern of flood susceptibility in ways not captured by the present framework. Likewise, the socio-economic indicators are based primarily on 2018 NSIA statistics and related secondary sources. These data may not reflect more recent demographic changes, displacement, infrastructure damage, or land-use change in Afghanistan, and thus introduce uncertainty into current vulnerability estimates.
A further limitation concerns the integration of susceptibility and vulnerability across different source units. Susceptibility was assessed at the subbasin level, whereas vulnerability was derived from provincial-level socio-economic data because finer-scale and spatially consistent socio-economic information was not available. Although all input layers were ultimately standardised to a common grid size for overlay and index calculation, this does not remove the underlying aggregation uncertainty. As a result, intra-provincial variability in vulnerability cannot be fully captured, and flood risk may be over- or underestimated in provinces that contain both highly susceptible and less susceptible subbasins. For this reason, the final potential FRI should be interpreted as a relative national-scale prioritisation layer rather than a fine-scale deterministic flood-risk map.
The response of morphometric parameters to flood risk varies significantly across different subbasins of different sizes, being influenced by local hydro-morphometric characteristics, census data, land cover, and soil structures [43]. For example, in Badakhshan province, heterogeneous hydro-morphometric characteristics combined with relatively uniform census values can result in contrasting flood-risk responses depending on drainage configuration and local topography [83]. This spatial heterogeneity highlights the need for multi-scale assessments that combine national screening with finer local investigations in priority basins [59].
Future research should focus on improving data coverage, refining indicator selection, and developing adaptable frameworks well suited to data-scarce environments [15,84]. Enhanced integration of RS data with in situ observations can help bridge data gaps, while advances in RS and GIS-based analysis can improve the accuracy of morphometric parameter extraction in topographically complex regions [78]. Recent advances in remote sensing, such as the SWOT (Surface Water and Ocean Topography) mission, provide new opportunities for improving flood monitoring by enabling direct observations of water surface elevation and dynamics [85]. Integration of such datasets with hydrological and morphometric models can significantly enhance flood hazard representation and improve future risk assessments. Overall, while the proposed framework provides a robust national-scale flood risk assessment for data-scarce regions, uncertainties remain due to data resolution, temporal mismatch, weighting subjectivity, and scale integration. These limitations should be considered when interpreting results, and future studies should focus on higher-resolution datasets and probabilistic approaches to improve robustness.

4.3. Implications for Flood Risk Management

The primary objective of the study is to provide a first quantitative, national-scale baseline of flood susceptibility, social vulnerability, and relative composite risk in Afghanistan. The findings of this study have important implications for flood management strategies in Afghanistan. Provinces classified within the “Very High” and “High” FRI zones should be prioritised for targeted interventions, including the construction of flood barriers, improvements to drainage networks, and the establishment of reliable early-warning systems [20,59]. Strengthening socio-economic resilience through public awareness programmes, literacy initiatives, infrastructure development, and improved access to healthcare is equally critical for reducing overall vulnerability [3,69].
Whilst it is beyond the scope of this study to recommend specific policies or actions, the flood risk assessment presented here identifies the geographical regions of Afghanistan that face the greatest flood-related threats. Building on these findings, and considering local resources, traditional practices, climatic conditions, and the morphometric characteristics of each subbasin, location-specific interventions are proposed to guide flood mitigation efforts in the most vulnerable areas. In Badakhshan, Takhar, and Baghlan (Panj-Amu River Basin), where steep relief, intense rainfall, and rapid urban expansion exacerbate flooding, structural measures such as terracing, floodplain restoration, check dams, and small flood-storage reservoirs are recommended to reduce runoff and stabilise slopes. In Panjshir, Kapisa, Parwan, Kabul, Nuristan, Nangarhar, and Kunar (Kabul River Basin), where circular basin shapes, rapid runoff, irregular precipitation, and land-cover change dominate flood behaviour, terracing, flood-detention reservoirs, and soil-conservation practices are strongly advised. Increasing vegetation cover and promoting afforestation throughout both river basins will further support flood regulation and reduce sediment transport, benefiting from the local climatic conditions for ecological restoration. For Balkh, Herat, Faryab, Ghazni, and Wardak, where low basin slopes, high drainage density, and reduced overland flow are prevalent, channel improvement, canal rehabilitation, and rainwater harvesting are particularly suitable. Protecting indigenous vegetation and wild tree species nationwide is also essential to improve groundwater recharge, reduce soil erosion, and decrease flood intensity. Similar integrated approaches have been successfully implemented in other disaster-prone regions, demonstrating the value of comprehensive disaster-risk-reduction strategies [86].
Flood management in Afghanistan faces unique challenges due to its arid to semi-arid climate, limited institutional capacity and complex topography. Steep slopes, irregular precipitation, prolonged droughts, sparse vegetation and widespread erosion necessitate specialised and site-specific strategies. Mining and ongoing deforestation increase sediment transport, often reducing the effectiveness of flood-protection structures [1,14]. These physical challenges are compounded by data scarcity, limited technical resources, weak institutional coordination and low public awareness, all of which constrain both structural and non-structural flood-management efforts [15,69].
Social and political constraints, including fragmented governance, limited institutional coordination and limited data sharing, highlight the need for decentralised, community-driven flood-management approaches. Reviving traditional systems such as Karez networks, combined with community-operated early-warning systems, provides culturally acceptable and cost-effective alternatives in regions where formal institutions remain weak. Given the prolonged conflict, inadequate infrastructure and limited hydrological monitoring capacity, this study emphasises adaptive, locally feasible and resource-sensitive strategies to ensure that flood-risk management remains both scientifically robust and practically achievable across Afghanistan [15,69].

5. Conclusions

This study presents a comprehensive flood risk assessment for Afghanistan as a whole, using an integrated hydro-morphological approach that combines RS and GIS technologies. Unlike traditional hydrological models, which rely heavily on hydrological or hydraulic models, this approach combines open-source remote sensing datasets, morphometric indicators, precipitation information, and provincial socio-economic data. It therefore provides a feasible baseline assessment for a large, data-scarce, and conflict-affected mountain region.
Our analysis reveals that the Panj-Amu and Kabul River basins in eastern and northeastern Afghanistan are exposed to Very High FSI. This is due to the combined effects of precipitation, topography and drainage characteristics, which contribute to rapid runoff and increased flooding potential, especially during the Indian summer monsoon season. We categorise the central, northern, and northwestern regions as having high to moderate FSI, influenced by drainage networks but also heightened by short overland flow paths and low infiltration rates. We observe lower FSI in the western and southwestern regions due to reduced precipitation, gentler slopes, and higher bifurcation ratios that disperse floodwaters and potential flood impacts.
Integrating susceptibility with vulnerability highlights the importance of socio-economic factors in shaping flood risk in a country like Afghanistan. High population density, especially in rural areas, along with significant land use changes, are key drivers of vulnerability in northern and eastern Afghanistan. Conversely, lower population density and low relief deserts with disconnected drainage in the south and southwest correspond to lower vulnerability levels. These insights are crucial for government and non-governmental organisations in order to prioritise resources and target interventions effectively. While this integrated approach is currently the most feasible for Afghanistan’s complex terrain and limited data environment, challenges around data availability, data quality and political instability remain significant. Enhancing data collection, monitoring infrastructure, and performing rigorous sensitivity analyses will improve model accuracy and reduce uncertainty to ensure reliable outcomes.
Future efforts should focus on improving observational datasets, developing event-based flood inventories, integrating emerging satellite observations, and conducting finer-scale vulnerability assessments. The framework presented here may be adapted to other data-scarce mountain regions, provided that indicator selection, weighting, and validation are recalibrated to local hydro-climatic and socio-economic conditions.

Supplementary Materials

The following supporting information can be downloaded at: https://www.mdpi.com/article/10.3390/rs18091411/s1. Figure S1: Figure S1: Thematic layers used for the assessment of flood susceptibility Afghanistan region (a) Stream frequency, (b) Drainage density, (c) Basin relief, (d) Drainage texture, (e) Infiltration number, (f) Compactness coefficient; Figure S2: Thematic layers used for the flood susceptibility assessment Afghanistan region (a) Circulatory ratio, (b) Elongation ratio, (c) Ruggedness number, (d) Bifurcation Ratio, (e) Length of overland flow, (f) Form Factor; Figure S3: Spatial distribution of mean monthly precipitation across Afghanistan. The map classifies the country into six precipitation zones, ranging from very low (3.3–15.0 mm) to high (60.3–96.9 mm), highlighting regional variability in rainfall patterns; Figure S4: Spatial distribution of recorded flood incidents across Afghanistan region at province level. The map categorizes provinces into four classes based on the number of documented flood events: 4–11 (low), 12–23 (moderate), 24–38 (high), and 39–70 (very high); Figure S5: Thematic layers used for the assessment of flood vulnerability of the Afghanistan region: (a) Population density, (b) Rural population density, (c) Literacy rate, (d) Female literacy, (e) Basic health centers; Figure S6: Thematic layers used for the assessment of flood vulnerability of the Afghanistan region: (a) Safe drinking water, (b) Distance to the nearest drivable road, (c) Cultivated land area, (d) Poverty rate, (e) Unemployment rate; Figure S7: Spatial distribution of flood-related casualties across the Afghanistan region at the province level during various flooding events between 2019 and 2024. The map categorizes provinces into four classes based on the number of persons reported dead or injured: 2–11 (low), 12–34 (moderate), 35–103 (high), and 104–315 (very high); Table S1: Landuse and landcover areal statistics of Afghanistan; Table S2: (a) PCA based ranking of flood susceptibility indicators using Varimax with Kaiser Normalization methods, (b) PCA based ranking of flood vulnerability indicators using Varimax with Kaiser Normalization methods; Table S3: Saaty’s scale of preference; Table S4: Saaty’s Random index values; Table S5: (a) Calculation of relative importance weightage (RIW) for level 2 decision indicators used for the FHI (i) Stream frequency, (ii) drainage density, (iii) Basin relief, (iv) Drainage texture, (v) Infiltration number, (vi) Compactness coefficient, (b) Calculation of relative importance weightage (RIW) for level 2 decision indicators for the FHI (i) Circulatory ratio, (ii) Elongation ratio, (iii) Ruggedness number, (iv) Bifurcation Ratio, (v) Length of overland flow, (vi) Form factor; Table S6: Calculation of relative importance weightage (RIW) for level 2 decision indicators of Precipitation (mm) for the FHI; Table S7: (a) Calculation of relative importance weightage (RIW) for level 2 decision indicators for the FVI (i) population density, (ii) Rural population density, (iii) Literacy rate, (iv) Female literacy, (v) Basic health centres, (b) Calculation of relative importance weightage (RIW) for level 2 decision indicators for the FVI (i) Safe drinking water, (ii) Distance to the nearest drivable road, (iii) Cultivated Area, (iv) Poverty rate, (v) Unemployment rate; Table S8: Calculation of relative importance weightage (RIW) for level 2 decision indicators of LULC for the FVI; Table S9: Summary table of governing factors characterizing potential flood risks zones at subbasin/province level; Table S10: Sensitivity analysis of PCA-AHP weights for selected FSI and FVI indicators. Supplementary Material Files are uploaded separately with the manuscript submission. Contents of this file include 7 Figures and 11 Tables. Supplementary Section S1 includes additional explanations, figures, and tables that provide further details on the methodology, indicator selection and weighting, and supporting results not included in the main text. This Supplementary File will be available online with the article.

Author Contributions

Conceptualization: Q.I., K.M. and K.E.F.; Methodology: Q.I. and K.M.; Data Collection, Curation, Analysis and Validation: Q.I.; Writing—original draft: Q.I., K.M. and K.E.F.; Review and Editing: K.E.F., C.Z., Q.I. and K.M.; Funding acquisition: Q.I.; Project administration, resources, software: Q.I. and K.M. All authors have read and agreed to the published version of the manuscript.

Funding

This research was supported by the University of Central Asia (UCA) and the German Academic Exchange Service (DAAD) (Ref. No. 91840170). Additional support was provided through the project grant awarded to KM (PRO-MISHRA-2023-12) by the Federal Ministry of Education and Research (BMBF) and the Baden-Württemberg Ministry of Science, as part of the Excellence Strategy of the German Federal and State Governments.

Data Availability Statement

Open-source datasets were used in this study. DEM data were obtained from the MERIT Hydro database (http://hydro.iis.u-tokyo.ac.jp/~yamadai/MERIT_Hydro/) and ASTER DEM. Hydrological and meteorological data were collected from the GPCC dataset (https://opendata.dwd.de/climate_environment/GPCC/html/fulldata-monthly_v2022_doi_download.html) and the Ministry of Water and Energy of Afghanistan. Census data were obtained from NSIA Afghanistan (http://www.nsia.gov.af) and the WHO EMRO database (https://www.emro.who.int/child-adolescent-health/data-statistics/afghanistan.html). Land use and land cover data were derived from the ICIMOD data repository “https://rds.icimod.org/metadata/a2aa0488-b200-483f-8d4a-147f843cfa87 (accessed on 1 April 2026)”.

Acknowledgments

We sincerely thank our research team members for their invaluable support in data analysis and methodological refinement. We are also grateful to the University of Tübingen and our collaborative platforms for providing the resources and technical assistance that made this study possible. Finally, we extend our appreciation to the anonymous reviewers for their insightful comments and constructive suggestions, which have significantly improved the quality of this work.

Conflicts of Interest

The authors declare no conflicts of interest.

Abbreviations

The following abbreviations are used in this manuscript:
AHPAnalytical Hierarchy Process
PCAPrincipal Component Analysis
RSRemote Sensing
GISGeographic Information System
IPCCIntergovernmental Panel on Climate Change
ROCReceiver Operating Characteristic
AUCArea Under Curve
FRIPotential Flood Risk Index
FVIFlood Vulnerability Index
FSIFlood Susceptibility Index
DEMDigital Elevation Model
CIConsistency Ratio
IBMInternational Business Machines
SPSSStatistical Package for the Social Sciences
LULCLand Use Land Cover
MCDMMulti-Criteria Decision Making
GPCCGlobal Precipitation Climatology Centre

References

  1. IPCC. Climate Change 2007: Impacts, Adaptation and Vulnerability: Contribution of Working Group II to the Fourth Assessment Report of the Intergovernmental Panel; Cambridge University Press: New York, NY, USA, 2007; ISBN 9780521880107. [Google Scholar]
  2. de Moel, H.; Jongman, B.; Kreibich, H.; Merz, B.; Penning-Rowsell, E.; Ward, P.J. Flood Risk Assessments at Different Spatial Scales. Mitig. Adapt. Strateg. Glob. Change 2015, 20, 865–890. [Google Scholar] [CrossRef]
  3. Kron, W. Flood Risk = Hazard • Values • Vulnerability. Water Int. 2005, 30, 58–68. [Google Scholar] [CrossRef]
  4. Abdel-Fattah, M.; Saber, M.; Kantoush, S.A.; Khalil, M.F.; Sumi, T.; Sefelnasr, A.M. A Hydrological and Geomorphometric Approach to Understanding the Generation of Wadi Flash Floods. Water 2017, 9, 553. [Google Scholar] [CrossRef]
  5. Aerts, J.C.J.H.; Botzen, W.J.W.; de Moel, H.; Bowman, M. Cost Estimates for Flood Resilience and Protection Strategies in New York City. Ann. N. Y. Acad. Sci. 2013, 1294, 1–104. [Google Scholar] [CrossRef]
  6. Schröter, K.; Kunz, M.; Elmer, F.; Mühr, B.; Merz, B. What Made the June 2013 Flood in Germany an Exceptional Event? A Hydro-Meteorological Evaluation. Hydrol. Earth Syst. Sci. 2015, 19, 309–327. [Google Scholar] [CrossRef]
  7. World Bank. Pakistan Monsoon Floods 2022 (Post-Disaster Needs Assessment); World Bank Group: Washington, DC, USA, 2022. [Google Scholar]
  8. Nearing, G.; Cohen, D.; Dube, V.; Gauch, M.; Gilon, O.; Harrigan, S.; Hassidim, A.; Klotz, D.; Kratzert, F.; Metzger, A.; et al. Global Prediction of Extreme Floods in Ungauged Watersheds. Nature 2024, 627, 559–563. [Google Scholar] [CrossRef]
  9. Klijn, F.; Kreibich, H.; De Moel, H.; Penning-Rowsell, E. Adaptive Flood Risk Management Planning Based on a Comprehensive Flood Risk Conceptualisation. Mitig. Adapt. Strateg. Glob. Change 2015, 20, 845–864. [Google Scholar] [CrossRef]
  10. Rafiq, L.; Blaschke, T. Disaster Risk and Vulnerability in Pakistan at a District Level. Geomat. Nat. Hazards Risk 2012, 3, 324–341. [Google Scholar] [CrossRef]
  11. Mishra, K.; Sinha, R. Flood Risk Assessment in the Kosi Megafan Using Multi-Criteria Decision Analysis: A Hydro-Geomorphic Approach. Geomorphology 2020, 350, 106861. [Google Scholar] [CrossRef]
  12. Price, R.K.; Vojinovic, Z. Urban flood disaster management. Urban Water J. 2008, 5, 259–276. [Google Scholar] [CrossRef]
  13. Blaikie, P.; Cannon, T.; Davis, I.; Wisner, B. At Risk: Natural Hazards, People’s Vulnerability and Disasters, 2nd ed.; Routledge: Abingdon, UK, 2014; ISBN 0203714776. [Google Scholar]
  14. Karmokar, S.; De, M. Flash Flood Risk Assessment for Drainage Basins in the Himalayan Foreland of Jalpaiguri and Darjeeling Districts, West Bengal. Model. Earth Syst. Environ. 2020, 6, 2263–2289. [Google Scholar] [CrossRef]
  15. Mahmood, S.; Rahman, A. ur Flash Flood Susceptibility Modeling Using Geo-Morphometric and Hydrological Approaches in Panjkora Basin, Eastern Hindu Kush, Pakistan. Environ. Earth Sci. 2019, 78, 43. [Google Scholar] [CrossRef]
  16. Singh, G.; Pandey, A. Flash Flood Vulnerability Assessment and Zonation through an Integrated Approach in the Upper Ganga Basin of the Northwest Himalayan Region in Uttarakhand. Int. J. Disaster Risk Reduct. 2021, 66, 102573. [Google Scholar] [CrossRef]
  17. Cutter, S.L. Hazards Vulnerability and Environmental Justice; Routledge: Abingdon, UK, 2012; pp. 71–82. ISBN 9781849771542. [Google Scholar] [CrossRef]
  18. Nazeer, M.; Bork, H.-R. Flood Vulnerability Assessment through Different Methodological Approaches in the Context of North West Khyber Pakhtunkhwa Pakistan. Sustainability 2019, 11, 6695. [Google Scholar] [CrossRef]
  19. Membele, G.M.; Naidu, M.; Mutanga, O. Examining Flood Vulnerability Mapping Approaches in Developing Countries: A Scoping Review. Int. J. Disaster Risk Reduct. 2022, 69, 102766. [Google Scholar] [CrossRef]
  20. Ashfaq, S.; Tufail, M.; Niaz, A.; Muhammad, S.; Alzahrani, H.; Tariq, A. Flood Susceptibility Assessment and Mapping Using GIS-Based Analytical Hierarchy Process and Frequency Ratio Models. Glob. Planet. Change 2025, 251, 104831. [Google Scholar] [CrossRef]
  21. Hagen, E.; Teufert, J.F. Flooding in Afghanistan: A Crisis. In Proceedings of the Threats to Global Water Security; Springer: Dordrecht, The Netherlands, 2009; pp. 179–185. [Google Scholar]
  22. Qutbudin, I.; Shiru, M.S.; Sharafati, A.; Ahmed, K.; Al-Ansari, N.; Yaseen, Z.M.; Shahid, S.; Wang, X. Seasonal Drought Pattern Changes Due to Climate Variability: Case Study in Afghanistan. Water 2019, 11, 1096. [Google Scholar] [CrossRef]
  23. Sediqi, M.N.; Hendrawan, V.S.A.; Komori, D. Climate Projections over Different Climatic Regions of Afghanistan under Shared Socioeconomic Scenarios. Theor. Appl. Climatol. 2022, 149, 511–524. [Google Scholar] [CrossRef]
  24. Inform Risk Index. Inform Report 2024; Publications Office of the European Union: Luxembourg, 2024.
  25. University of Notre Dame. Notre Dame Global Adaptation Index. Notre Dame Global Adaptation Initiative. Available online: https://gain.nd.edu/our-work/country-index/ (accessed on 23 February 2025).
  26. OCHA. Afghanistan Floods: Flash Update #2—Floods Hit Eastern and Northeastern Afghanistan. 21 July 2024. Available online: https://www.unocha.org/publications/report/afghanistan/afghanistan-floods-flash-update-2-floods-hit-eastern-and-northeastern-afghanistan-21-july-2024 (accessed on 8 October 2025).
  27. ECHO. Afghanistan—Flash Floods Update (DG ECHO, UN OCHA, ERM Partners) (ECHO Daily Flash of 01 September 2020); European Commission’s Directorate-General for European Civil Protection and Humanitarian Aid Operations: Brussels, Belgium, 2020.
  28. Manawi, S.M.A.; Nasir, K.A.M.; Shiru, M.S.; Hotaki, S.F.; Sediqi, M.N. Urban Flooding in the Northern Part of Kabul City: Causes and Mitigation. Earth Syst. Environ. 2020, 4, 599–610. [Google Scholar] [CrossRef]
  29. Tani, H.; Tayfur, G. Modelling Rainfall-Runoff Process of Kabul River Basin in Afghanistan Using ArcSWAT Model. J. Civ. Eng. Constr. 2023, 12, 1–18. [Google Scholar] [CrossRef]
  30. Fazel-Rastgar, F.; Sivakumar, V. A Case Study of an Extreme Flooding Episode in Charikar, Eastern Afghanistan. J. Water Clim. Change 2023, 14, 4689–4707. [Google Scholar] [CrossRef]
  31. Qasimi, A.B.; Isazade, V.; Berndtsson, R. Flood Susceptibility Prediction Using MaxEnt and Frequency Ratio Modeling for Kokcha River in Afghanistan. Nat. Hazards 2023, 120, 1367–1394. [Google Scholar] [CrossRef]
  32. Goyal, M.K.; Sharma, A.; Surampalli, R.Y. Remote Sensing and GIS Applications in Sustainability. In Sustainability: Fundamentals and Applications; John Wiley & Sons: Hoboken, NJ, USA, 2020; pp. 605–626. ISBN 9781119434016. [Google Scholar]
  33. Kabenge, M.; Elaru, J.; Wang, H.; Li, F. Characterizing Flood Hazard Risk in Data-Scarce Areas, Using a Remote Sensing and GIS-Based Flood Hazard Index. Nat. Hazards 2017, 89, 1369–1387. [Google Scholar] [CrossRef]
  34. Mokhtari, E.; Mezali, F.; Abdelkebir, B.; Engel, B. Flood Risk Assessment Using Analytical Hierarchy Process: A Case Study from the Cheliff-Ghrib Watershed, Algeria. J. Water Clim. Change 2023, 14, 694–711. [Google Scholar] [CrossRef]
  35. Samela, C.; Albano, R.; Sole, A.; Manfreda, S. A GIS Tool for Cost-Effective Delineation of Flood-Prone Areas. Comput. Environ. Urban Syst. 2018, 70, 43–52. [Google Scholar] [CrossRef]
  36. Teng, J.; Jakeman, A.J.; Vaze, J.; Croke, B.F.W.; Dutta, D.; Kim, S. Flood Inundation Modelling: A Review of Methods, Recent Advances and Uncertainty Analysis. Environ. Model. Softw. 2017, 90, 201–216. [Google Scholar] [CrossRef]
  37. Najmuddin, O.; Li, Z.; Khan, R.; Zhuang, W. Valuation of Land-Use/Land-Cover-Based Ecosystem Services in Afghanistan—An Assessment of the Past and Future. Land 2022, 11, 1906. [Google Scholar] [CrossRef]
  38. Shokory, J.A.N.; Schaefli, B.; Lane, S.N. Water Resources of Afghanistan and Related Hazards under Rapid Climate Warming: A Review. Hydrol. Sci. J. 2023, 68, 507–525. [Google Scholar] [CrossRef]
  39. Shrestha, R. Land Degradation in Afghanistan A Chapter Prepared for the State of Environment of Afghanistan Asian Institute of Technology. 2007. Available online: https://www.researchgate.net/publication/328402388_Land_degradation_in_Afghanistan?channel=doi&linkId=5bca9fcf299bf17a1c61a4b8&showFulltext=true (accessed on 1 April 2026).
  40. World Bank. Climate Risk Country Profile: Afghanistan; World Bank Group: Washington, DC, USA, 2021; Volume 3. [Google Scholar]
  41. NEPA. Afghanistan: Climate Change Science Perspectives; National Environmental Protection Agency (NEPA): Canberra, Australia; United Nations Environment Programme (UNEP): Nairobi, Kenya, 2016.
  42. UNCT. United Nations Strategic Framework for Afghanistan 2023–2025. 2023. Available online: https://crisisresponse.iom.int/sites/g/files/tmzbdl1481/files/appeal/documents/UNSF%20Afghanistan%202023%20to%202025.pdf (accessed on 1 April 2026).
  43. Bharath, A.; Kumar, K.K.; Maddamsetty, R.; Manjunatha, M.; Tangadagi, R.B.; Preethi, S. Drainage Morphometry Based Sub-Watershed Prioritization of Kalinadi Basin Using Geospatial Technology. Environ. Chall. 2021, 5, 100277. [Google Scholar] [CrossRef]
  44. Strahler, A.N. Quantitative Analysis of Watershed Geomorphology. Eos Trans. Am. Geophys. Union 1957, 38, 913–920. [Google Scholar] [CrossRef]
  45. Horton, R.E. Erosional Development of Streams and Their Drainage Basins; Hydrophysical Approach to Quantitative Morphology. Geol. Soc. Am. Bull. 1945, 56, 275–370. [Google Scholar] [CrossRef]
  46. Schumm, S.A. Evolution of Drainage Systems and Slopes in Badlands at Perth Amboy, New Jersey. Geol. Soc. Am. Bull. 1956, 67, 597–646. [Google Scholar] [CrossRef]
  47. Faniran, A. The Index of Drainage Intensity: A Provisional New Drainage Factor. Aust. J. Sci. 1968, 31, 326–330. [Google Scholar]
  48. Miller, V.C. A Quantitative Geomorphic Study of Drainage Basin Characteristics in the Clinch Mountain Area, Virginia and Tennessee; Columbia University: New York, NY, USA, 1953; Volume 3. [Google Scholar]
  49. Uzair, M.; Shakil, R.; Muhammad, A.; Khan, W.; Mubeen, A.; Hussain, Z. Developing High Resolution Monthly Gridded Precipitation Dataset for Afghanistan. Theor. Appl. Climatol. 2024, 155, 5107–5128. [Google Scholar] [CrossRef]
  50. ICIMOD. Land Cover of Afghanistan (Data Set); International Centre for Integrated Mountain Development: Lalitpur, Nepal, 2022. [Google Scholar]
  51. Radwan, F.; Alazba, A.A.; Mossad, A. Flood Risk Assessment and Mapping Using AHP in Arid and Semiarid Regions. Acta Geophys. 2019, 67, 215–229. [Google Scholar] [CrossRef]
  52. Saaty, T.L. Decision making—the Analytic Hierarchy and Network Processes (AHP/ANP). J. Syst. Sci. Syst. Eng. 2004, 13, 1–35. [Google Scholar] [CrossRef]
  53. Jolliffe, I. Principal Component Analysis. In International Encyclopedia of Statistical Science; Springer: Berlin/Heidelberg, Germany, 2011; pp. 1094–1096. ISBN 3642048986. [Google Scholar]
  54. Feizizadeh, B.; Blaschke, T. Land Suitability Analysis for Tabriz County, Iran: A Multi-Criteria Evaluation Approach Using GIS. J. Environ. Plan. Manag. 2013, 56, 1–23. [Google Scholar] [CrossRef]
  55. Xie, W.; Meng, Q. An Integrated PCA–AHP Method to Assess Urban Social Vulnerability to Sea Level Rise Risks in Tampa, Florida. Sustainability 2023, 15, 2400. [Google Scholar] [CrossRef]
  56. Wu, T. Quantifying Coastal Flood Vulnerability for Climate Adaptation Policy Using Principal Component Analysis. Ecol. Indic. 2021, 129, 108006. [Google Scholar] [CrossRef]
  57. Ajtai, I.; Ștefănie, H.; Maloș, C.; Botezan, C.; Radovici, A.; Bizău-Cârstea, M.; Baciu, C. Mapping Social Vulnerability to Floods. A Comprehensive Framework Using a Vulnerability Index Approach and PCA Analysis. Ecol. Indic. 2023, 154, 110838. [Google Scholar] [CrossRef]
  58. Kaiser, H.F.; Rice, J. Little Jiffy, Mark Iv. Educ. Psychol. Meas. 1974, 34, 111–117. [Google Scholar] [CrossRef]
  59. Vojtek, M.; Vojteková, J. Flood Susceptibility Mapping on a National Scale in Slovakia Using the Analytical Hierarchy Process. Water 2019, 11, 364. [Google Scholar] [CrossRef]
  60. Vargas, T.L.S.L.G. What Is the Analytic Hierarchy Process? Springer: Berlin/Heidelberg, Germany, 1988; ISBN 3642835570. [Google Scholar]
  61. Jenks, G.F. The Data Model Concept in Statistical Mapping. Int. Yearb. Cartogr. 1967, 7, 186–190. [Google Scholar]
  62. Reuters. Afghanistan Floods Devastate Villages, Killing 315. Available online: https://www.reuters.com/world/asia-pacific/taliban-ministry-death-toll-floods-northern-afghanistan-rises-315-2024-05-12/ (accessed on 8 October 2025).
  63. Euro News. Flooding Kills at Least 68 People in Afghanistan. Available online: https://www.euronews.com/2024/05/18/flooding-kills-at-least-68-people-in-afghanistan (accessed on 1 April 2026).
  64. Zou, K.H.; O’Malley, A.J.; Mauri, L. Receiver-Operating Characteristic Analysis for Evaluating Diagnostic Tests and Predictive Models. Circulation 2007, 115, 654–657. [Google Scholar] [CrossRef]
  65. Rana, S.M.S.; Ahsan, S.M.; Hossain, M.N.; Sultana, N. Flood Risk Mapping of the Fl Ood-Prone Rangpur Division of Bangladesh Using Remote Sensing and Multi-Criteria Analysis. Nat. Hazards Res. 2024, 4, 20–31. [Google Scholar] [CrossRef]
  66. Liu, Y.; Liu, L.; Sun, H.; Chen, B.; Ma, X.; Ning, Y.; Qi, S. Flood Risk Assessment Combining Machine Learning with Multi-Criteria Decision Analysis in Jiangxi Province, China. Int. J. Disaster Risk Sci. 2025, 16, 858–869. [Google Scholar] [CrossRef]
  67. Ceresa, P.; Bussi, G.; Denaro, S.; Coccia, G.; Bazzurro, P.; Martina, M.; Fagà, E.; Avelar, C.; Ordaz, M.; Huerta, B.; et al. Large-Scale Flood Risk Assessment in Data Scarce Areas: An Application to Central Asia. Nat. Hazards Earth Syst. Sci. Discuss. 2025, 25, 403–428. [Google Scholar] [CrossRef]
  68. Behzadi, F.; Javadi, S.; Hafezi, S.; Vasheghani Farahani, E.; Golmohammadi, G. Flood Risk Projection in Iran Using CMIP6 Models and Frequency Analysis of Precipitation. Stoch. Environ. Res. Risk Assess. 2024, 38, 4843–4861. [Google Scholar] [CrossRef]
  69. Nabinejad, S.; Schuttrumpf, H. Flood Risk Management in Arid and Semi-Arid Areas. Water 2023, 15, 3113. [Google Scholar] [CrossRef]
  70. Alam, A.; Ahmed, B.; Sammonds, P. Flash Flood Susceptibility Assessment Using the Parameters of Drainage Basin Morphometry in SE Bangladesh. Quat. Int. 2021, 575–576, 295–307. [Google Scholar] [CrossRef]
  71. Trani, J.-F.; Bakhshi, P.; Noor, A.A.; Lopez, D.; Mashkoor, A. Poverty, Vulnerability, and Provision of Healthcare in Afghanistan. Soc. Sci. Med. 2010, 70, 1745–1755. [Google Scholar] [CrossRef]
  72. Omerkhil, N.; Chand, T.; Valente, D.; Alatalo, J.M.; Pandey, R. Climate Change Vulnerability and Adaptation Strategies for Smallholder Farmers in Yangi Qala District, Takhar, Afghanistan. Ecol. Indic. 2020, 110, 105863. [Google Scholar] [CrossRef]
  73. Zope, P.E.; Eldho, T.I.; Jothiprakash, V. Hydrological Impacts of Land Use–Land Cover Change and Detention Basins on Urban Flood Hazard: A Case Study of Poisar River Basin, Mumbai, India. Nat. Hazards 2017, 87, 1267–1283. [Google Scholar] [CrossRef]
  74. Zhou, L.; Liu, L. Enhancing Dynamic Flood Risk Assessment and Zoning Using a Coupled Hydrological-Hydrodynamic Model and Spatiotemporal Information Weighting Method. J. Environ. Manag. 2024, 366, 121831. [Google Scholar] [CrossRef]
  75. Ahmed, A.; Al Maliki, A.; Hashim, B.; Alshamsi, D.; Arman, H.; Gad, A. Flood Susceptibility Mapping Utilizing the Integration of Geospatial and Multivariate Statistical Analysis, Erbil Area in Northern Iraq as a Case Study. Sci. Rep. 2023, 13, 11919. [Google Scholar] [CrossRef]
  76. Albano, R.; Samela, C.; Craciun, I.; Manfreda, S.; Adamowski, J.; Sole, A.; Sivertun, Å.; Ozunu, A. Large Scale Flood Risk Mapping in Data Scarce Environments: An Application for Romania. Water 2020, 12, 1834. [Google Scholar] [CrossRef]
  77. Yamazaki, D.; Ikeshima, D.; Sosa, J.; Bates, P.D.; Allen, G.H.; Pavelsky, T.M. MERIT Hydro: A High-Resolution Global Hydrography Map Based on Latest Topography Dataset. Water Resour. Res. 2019, 55, 5053–5073. [Google Scholar] [CrossRef]
  78. Rahmati, O.; Golkarian, A.; Biggs, T.; Keesstra, S.; Mohammadi, F.; Daliakopoulos, I.N. Land Subsidence Hazard Modeling: Machine Learning to Identify Predictors and the Role of Human Activities. J. Environ. Manag. 2019, 236, 466–480. [Google Scholar] [CrossRef] [PubMed]
  79. Rahmati, O.; Pourghasemi, H.R. Identification of Critical Flood Prone Areas in Data-Scarce and Ungauged Regions: A Comparison of Three Data Mining Models. Water Resour. Manag. 2017, 31, 1473–1487. [Google Scholar] [CrossRef]
  80. Chen, Y.; Yu, J.; Khan, S. Environmental Modelling & Software The Spatial Framework for Weight Sensitivity Analysis in AHP-Based Multi-Criteria Decision Making. Environ. Model. Softw. 2013, 48, 129–140. [Google Scholar] [CrossRef]
  81. Shrestha, S.; Dahal, D.; Poudel, B.; Banjara, M.; Kalra, A. Flood Susceptibility Analysis with Integrated Geographic Information System and Analytical Hierarchy Process: A Multi-Criteria Framework for Risk Assessment and Mitigation. Water 2025, 17, 937. [Google Scholar] [CrossRef]
  82. Bouchikhi, S.; Chourak, M.; Boushaba, F.; El Baida, M. Flood Susceptibility Mapping in Urban Areas Based on Analytical Hierarchy Process: A Decade-Long Systematic Literature Review. J. Afr. Earth Sci. 2026, 233, 105903. [Google Scholar] [CrossRef]
  83. Hosseini, S.H.; Hashemi, H.; Fakheri Fard, A.; Berndtsson, R. Areal Precipitation Coverage Ratio for Enhanced AI Modelling of Monthly Runoff: A New Satellite Data-Driven Scheme for Semi-Arid Mountainous Climate. Remote Sens. 2022, 14, 270. [Google Scholar] [CrossRef]
  84. Kundzewicz, Z.W.; Kanae, S.; Seneviratne, S.I.; Handmer, J.; Nicholls, N.; Peduzzi, P.; Mechler, R.; Bouwer, L.M.; Arnell, N.; Mach, K.; et al. Le Risque d’inondation et Les Perspectives de Changement Climatique Mondial et Régional. Hydrol. Sci. J. 2014, 59, 1–28. [Google Scholar] [CrossRef]
  85. Yao, J.; Wang, M.; Xu, N.; Liu, T.; Mo, F.; Li, X.; Cao, Y.; Chen, K.; Sun, J.; Lu, H. 3-D Flood Mapping from SWOT Observations during Extreme Rainfall: A Case Study of Gangnan Reservoir. Int. J. Digit. Earth 2025, 18, 2544916. [Google Scholar] [CrossRef]
  86. UNISDR. The Human Cost of Natural Disasters: A Global Perspective; Centre for Research on the Epidemiology of Disaster (CRED): Brussels, Belgium, 2015. [Google Scholar]
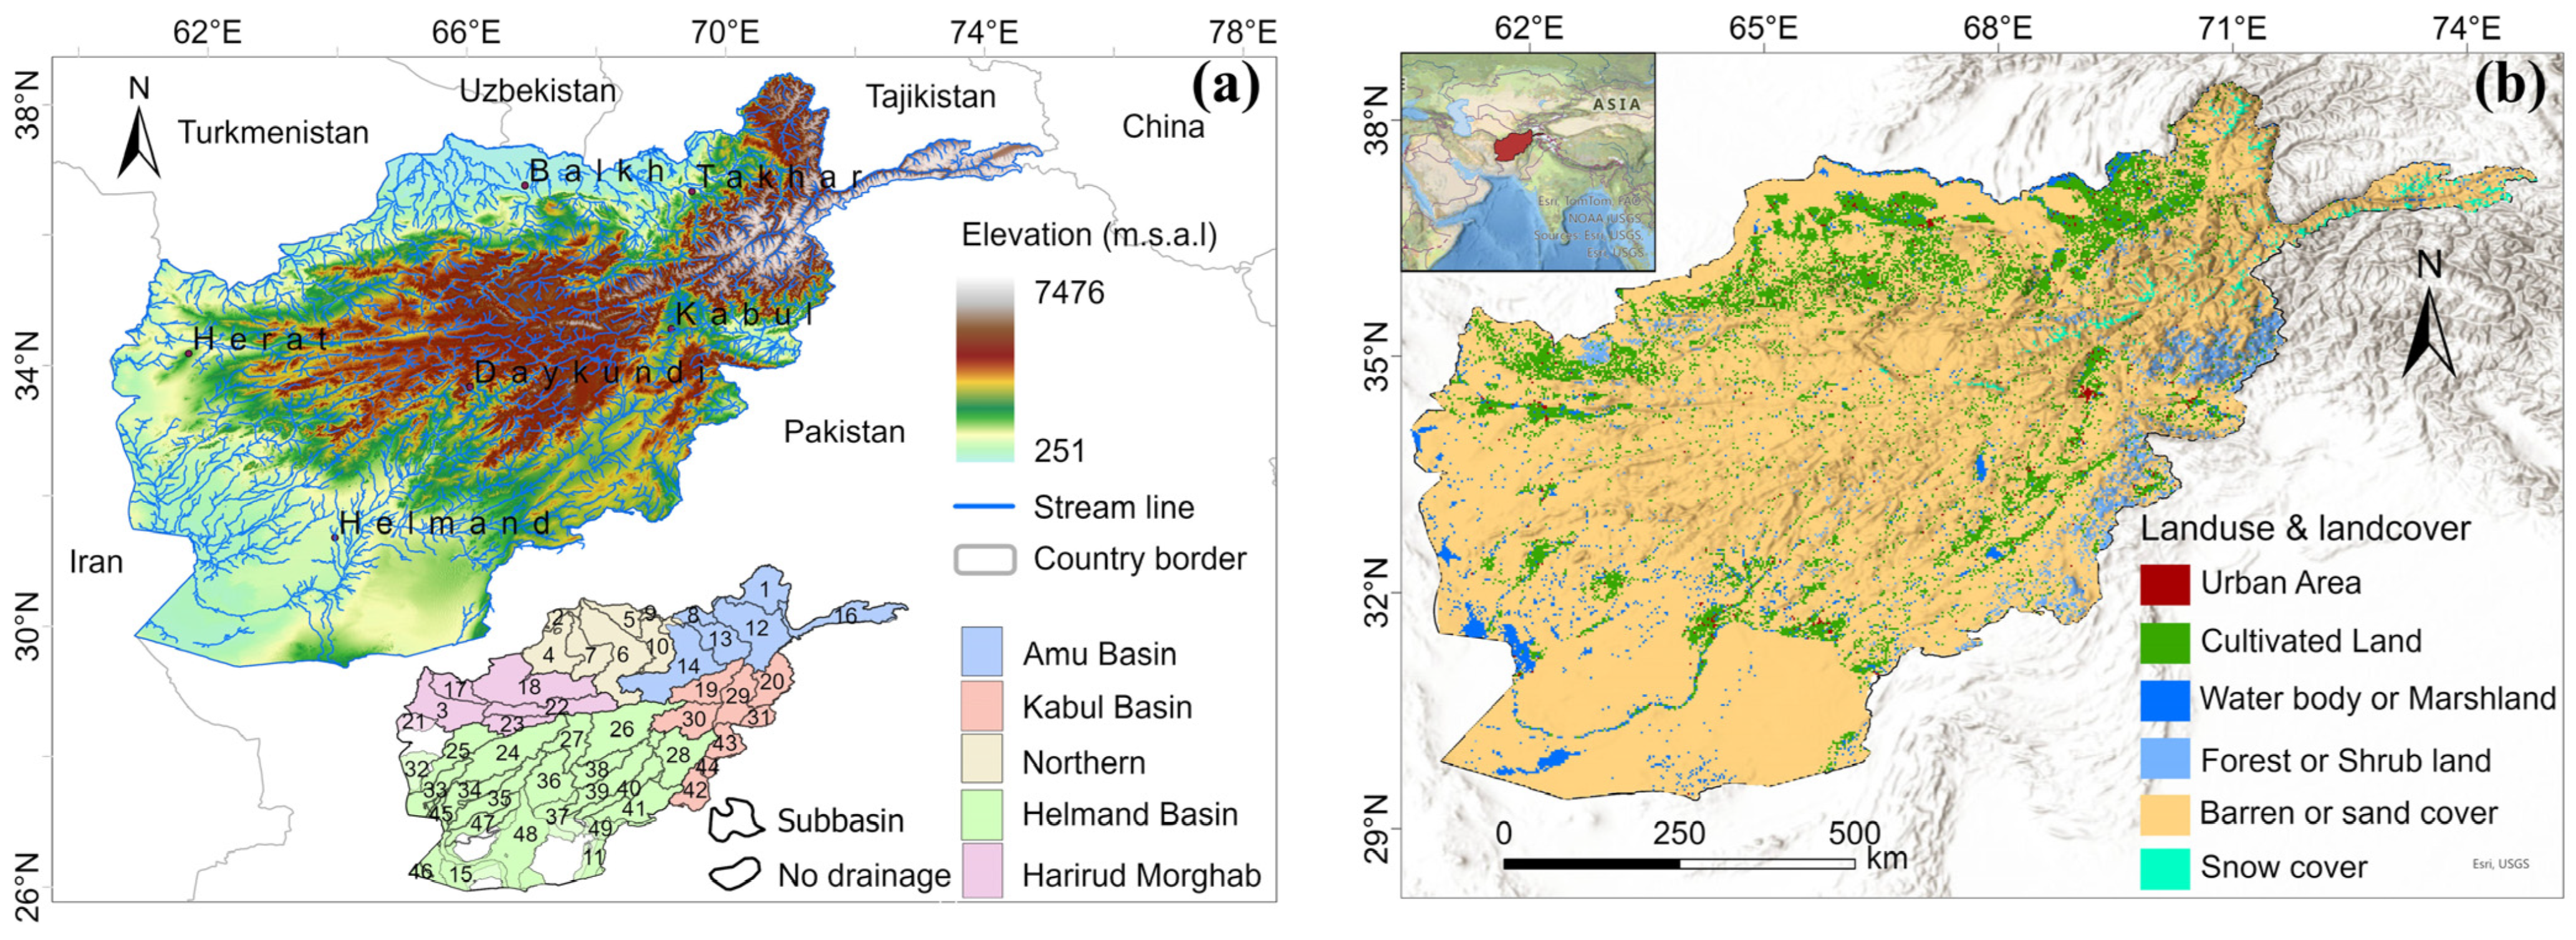
Figure 1. (a) Geographical map of Afghanistan region displaying elevation, streamlines, major cities/towns along with an inset map highlighting main river basins and their respective subbasin numbers; (b) land use and land cover map of Afghanistan region depicting distribution of cropland, forest, rangeland, built-up, and barren land classes based on recent classification data.
Remotesensing 18 01411 g001
Figure 2. Conceptual framework for potential flood risk assessment using a hydro-morphological and multi-criteria decision analysis (MCDA) approach. It integrates natural susceptibility (from DEM-derived morphometric parameters and precipitation) and vulnerability (from socio-economic indicators). PCA and AHP are used for weighing and index generation, with validation from recorded flood events to produce the final potential flood risk map.
Remotesensing 18 01411 g002
Figure 3. Spatial distribution of flood susceptibility index across Afghanistan at the subbasin level; (a) flood susceptibility index (FSI) map ranging from low (1.78) to high (4.15) values; (b) classified flood susceptibility index (FSI) map of Afghanistan at the subbasin level. The map categorises regions into four susceptibility levels, i.e., Low, Moderate, High, and Very High, based on hydro-morphometric analysis.
Remotesensing 18 01411 g003
Figure 4. Spatial distribution of flood vulnerability index across Afghanistan at the provincial level; (a) continuous vulnerability index map ranging from low (3.32) to high (9.91) and (b) classified vulnerability map categorising provinces into four levels, i.e., Low, Moderate, High, and Very High based on weighted socio-economic indicators.
Remotesensing 18 01411 g004
Figure 5. Potential flood risk assessment across Afghanistan using spatial and statistical approaches at a province level; (a) continuous flood risk index (FRI) map, ranging from low (6.51) to high (40.25) values highlighting spatial variability across the region; (b) classified FRI map categorising provinces into four risk levels, i.e., Low, Moderate, High, and Very High; (c) bar chart showing the percentage distribution of flood risk zones within each province, providing a comparative overview of intra-provincial exposure to varying risk levels.
Remotesensing 18 01411 g005
Figure 6. Receiver Operating Characteristic (ROC) curves for the flood risk model under three flood-impact thresholds (>9, >14, and >22) derived from combined provincial incident and casualty counts for 2019 to 2024. The upper-threshold scenario demonstrates the highest discriminatory power, with an Area Under the Curve (AUC) of 0.913.
Remotesensing 18 01411 g006
Table 1. Details of primary and secondary datasets used for the analysis.
Data TypeSpatial ResolutionData SourceDerived Indicator/Used for
Digital elevation model90 mhttp://hydro.iis.u-tokyo.ac.jp/~yamadai/MERIT_Hydro/ (accessed on 1 April 2026)Morphometric characteristics
Province level shapefilesScale = 1: 30,000,000https://www.igismap.com/download-afghanistan-administrative-boundary-gis-data-for-national-provinces-districts-and-more/ (accessed on 1 April 2026)Administrative boundaries
Census data Statistics Province levelhttp://www.nsia.gov.af (accessed on 1 April 2026)
https://www.emro.who.int/child-adolescent-health/data-statistics/afghanistan.html (accessed on 1 April 2026)
Population density, Unemployment rate, Poverty rate, Basic health centres, Literacy rate
Census data statisticsProvince levelhttps://www.worldbank.org/en/data/interactive/2019/08/01/afghanistan-interactive-province-level-visualization (accessed on 1 April 2026)Rural population density, Cultivated land, Female Literacy rate, Distance to nearest drivable road, Safe drinking water
Precipitation datasets0.25°https://opendata.dwd.de/climate_environment/GPCC/html/fulldata-monthly_v2022_doi_download.html (accessed on 1 April 2026)Precipitation variability
Land use land cover data Scale = 1: 50,000https://rds.icimod.org/Home/DataDetail?metadataId=1973187 (accessed on 1 April 2026)Urban or built-up areas, Water bodies and marshlands, Agricultural land, Barren and sand-covered land, Forests and shrubland, and Snow-covered areas
Table 2. Formula and calculation of morphometric indicators for flood susceptibility index.
S.No.Basin ParametersSymbol (Unit)FormulaReferences
1.AreaA (km2)A = area of basin
2.Length L b (km) L b = Length of basin
3.Perimeter P b (km) P b = perimeter of basin
4.Streams order N 0 N 0 = Hierarchical rank[44]
5.Streams number N u N u = N 1 + N 2 + + N n , where N n is number of streams of any given order[45]
6.Streams length L u (km) L u = L 1 + L 2 + + L n [44]
7.Stream frequency F s F s = N u A [45]
8.Drainage density D d (km/km2) D d = L u A [45]
9.Basin relief B R B R = h h 1 ,
where h = maximum height (km),
h1 = minimum height (km)
[46]
10Drainage texture D t D t = N u P b [45]
11.Infiltration number I n I n = F s × D d [47]
12.Compactness C c C c = 0.282 × P b A [45]
13.Circulation ratio C r C r = 4 × π × A P 2 [48]
14.Elongation ratio E r E r = 2 × A / π L b [46]
15.Ruggedness number R n R n = B R × D d [44]
16.Bifurcation B r B r = N u N u + 1 [45]
17.Length of overland flow L O f L O f = 1 2 × D d [45]
18.Form Factor F f F f = A L b 2 [45]
Table 3. Calculation of relative importance weightage (RIW) for decision indicators (Level-1) for flood susceptibility index (FSI).
Decision IndicatorsPBRCrCcRnDtDdFsLOfInErFfBrEEVRIW
Precipitation (P)12333344445563.330.20
Basin Relief (BR)1/21222233334452.300.14
Circulation ratio (Cr)1/31/2122233334452.010.12
Compactness (Cc)1/31/21/212233334451.810.11
Ruggedness number (Rn)1/31/21/21/21233334451.620.10
Drainage Texture (Dt)1/31/21/21/21/2133334451.460.09
Drainage Density (Dd)1/41/31/31/31/31/312223340.910.05
Stream Frequency (Fs)1/41/31/31/31/31/31/21223340.820.05
Length of overland flow (LOf)1/41/31/31/31/31/31/21/2123340.740.04
Infiltration number (In)1/41/31/31/31/31/31/21/21/213340.660.04
Elongation ratio (Er)1/51/41/41/41/41/41/31/31/31/31230.420.03
Form Factor (Ff)1/51/41/41/41/41/41/31/31/31/31/2120.370.02
Bifurcation (Br)1/61/51/51/51/51/51/41/41/41/41/31/210.70.02
Sum of column4.407.039.5311.0312.5314.0322.4223.9225.4226.9238.8340.5053.0016.721.00
Calculation of consistency ratio (CR) for decision indicators (Level-1) of flood susceptible index (FSI).
Decision IndicatorsPBRCrCcRnDtDdFsLOfInErFfBrSum of rows[E]
P0.230.280.310.270.240.210.180.170.160.150.130.120.112.5712.89
BR0.110.140.210.180.160.140.130.130.120.110.10.10.091.7312.58
Cr0.080.070.10.180.160.140.130.130.120.110.10.10.091.5212.65
Cc0.080.070.050.090.160.140.130.130.120.110.10.10.091.3812.75
Rn0.080.070.050.050.080.140.130.130.120.110.10.10.091.2512.9
Dt0.080.070.050.050.040.070.130.130.120.110.10.10.091.1413.08
Dd0.060.050.030.030.030.020.040.080.080.070.080.070.080.7313.36
Fs0.060.050.030.030.030.020.020.040.080.070.080.070.080.6613.55
LOf0.060.050.030.030.030.020.020.020.040.070.080.070.080.613.71
In0.060.050.030.030.030.020.020.020.020.040.080.070.080.5513.82
Er0.050.040.030.020.020.020.010.010.010.010.030.050.060.3513.93
Ff0.050.040.030.020.020.020.010.010.010.010.010.020.040.313.44
Br0.040.030.020.020.020.010.010.010.010.010.010.010.020.2213.54
Sum of column111111111111113172.2
λmax = 13.25; CI = 0.02; RI = 1.56; CR = 0.01
RIW = relative importance weightage; λ = largest eigen value; CI: consistency index; CR: consistency ratio; RI: random index; [E] = rational priority.
Table 4. Calculation of relative importance weightage (RIW) for decision indicators (Level-1) of flood vulnerability index (FVI).
Decision IndicatorsPdLULCPrdLrHcDWpFLrDDrCLPrUrEEVRIW
Population Density (Pd)122333344573.010.21
LULC1/212233344562.520.18
Rural Population Density (Prd)1/21/21233344452.140.15
Literate Rate (Lr)1/31/21/2133344441.780.13
Basic Health Centres (Hc)1/31/31/31/312233331.130.08
Safe Drinking Water (DWp)1/31/31/31/31/21222330.930.07
Female Literate (FLr)1/31/31/31/31/21/2122230.790.06
Distance to Nearest Drivable Road (DDr)1/41/41/41/41/31/21/212220.580.04
Cultivated Land (CL)1/41/41/41/41/31/21/21/21220.510.04
Poverty Rate (Pr)1/51/51/41/41/31/31/21/21/2120.420.03
Unemployment Rate (Ur)1/71/61/51/41/31/31/31/21/21/210.330.02
Sum of Column4.185.877.4510.0015.3317.1718.8325.5027.0031.5038.0014.151.00
Calculation of consistency ratio (CR) for decision indicators (Level-1) of flood vulnerability index (FVI).
Decision IndicatorsPdLULCPrdLrHcDWpFLrDDrCLPrUrSum of rows[E]
Pd0.240.340.270.300.200.170.160.160.150.160.182.3310.95
LULC0.120.170.270.200.200.170.160.160.150.160.161.9110.73
Prd0.120.090.130.200.200.170.160.160.150.130.131.6310.79
Lr0.080.090.070.100.200.170.160.160.150.130.111.4011.11
Hc0.080.060.040.030.070.120.110.120.110.100.080.9111.29
DWp0.080.060.040.030.030.060.110.080.070.100.080.7411.25
FLr0.080.060.040.030.030.030.050.080.070.060.080.6211.19
DDr0.060.040.030.030.020.030.030.040.070.060.050.4711.37
CL0.060.040.030.030.020.030.030.020.040.060.050.4111.34
Pr0.050.030.030.030.020.020.030.020.020.030.050.3311.17
Ur0.030.030.030.030.020.020.020.020.020.020.030.2510.79
Sum of column1.001.001.001.001.001.001.001.001.001.001.0011.00121.97
λmax = 11.09; CI = 0.01; RI = 1.51; CR = 0.01
RIW = relative importance weightage; λ = largest eigen value; CI: consistency index; CR: consistency ratio; RI: random index; [E] = rational priority.
Disclaimer/Publisher’s Note: The statements, opinions and data contained in all publications are solely those of the individual author(s) and contributor(s) and not of MDPI and/or the editor(s). MDPI and/or the editor(s) disclaim responsibility for any injury to people or property resulting from any ideas, methods, instructions or products referred to in the content.